1
Page Design
Charts
461
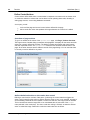
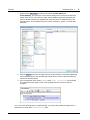
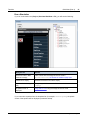
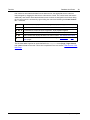
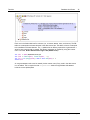
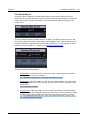
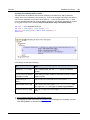
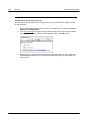
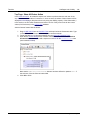
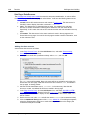
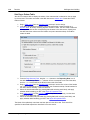
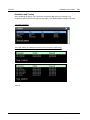
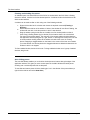
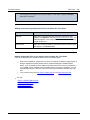
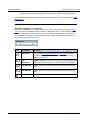
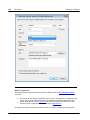
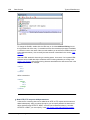
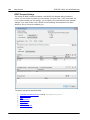
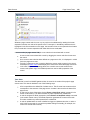
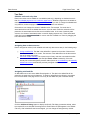
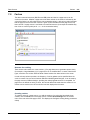
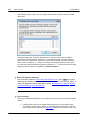
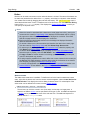
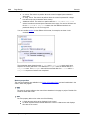
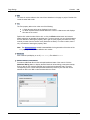
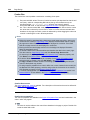
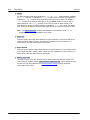
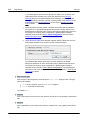
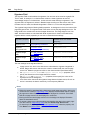
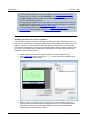
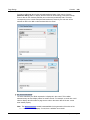
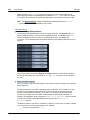
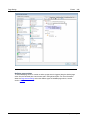
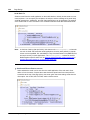
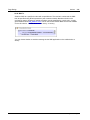
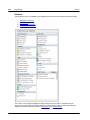
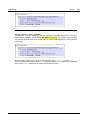
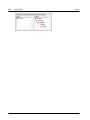
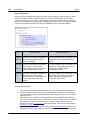
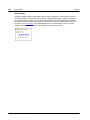
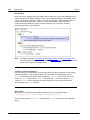
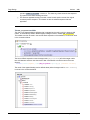
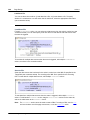
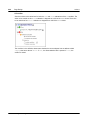
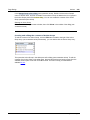
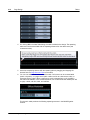
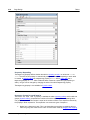
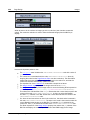
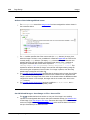
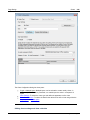
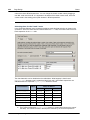
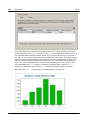
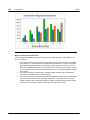
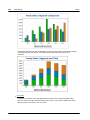
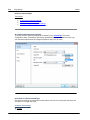
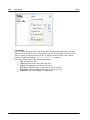
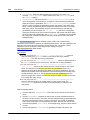
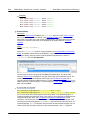
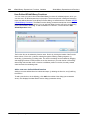
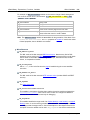
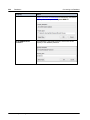
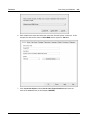
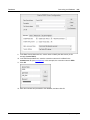
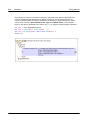
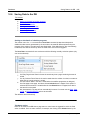
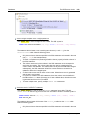
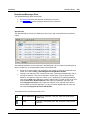
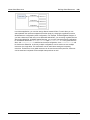
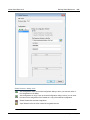
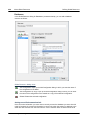
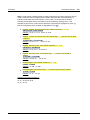
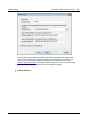
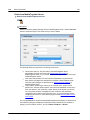
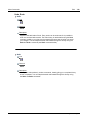
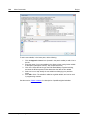
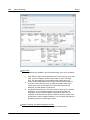
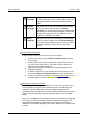
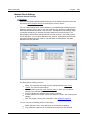
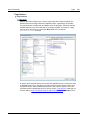
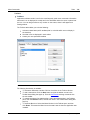
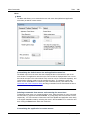
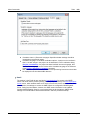
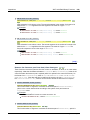
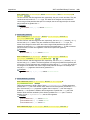
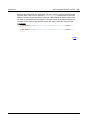
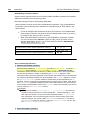
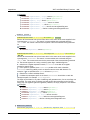
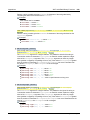
One row, three series
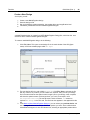
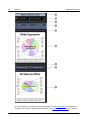
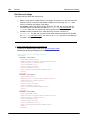
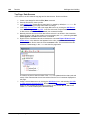
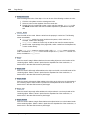
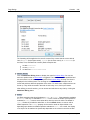
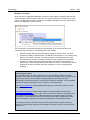
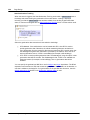
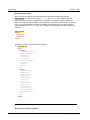
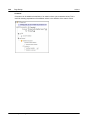
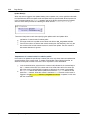
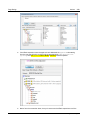
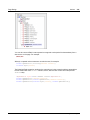
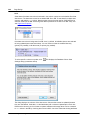
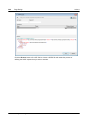
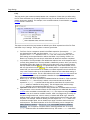
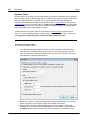
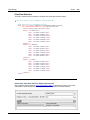
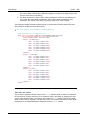
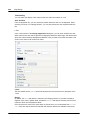
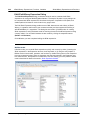
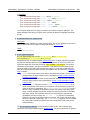
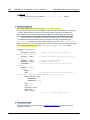
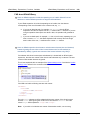
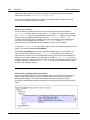
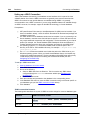
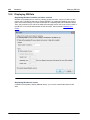
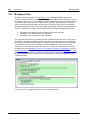
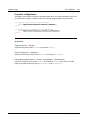
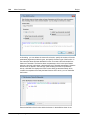
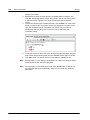
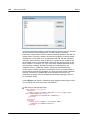
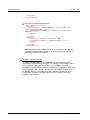
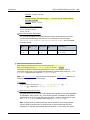
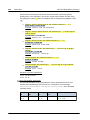
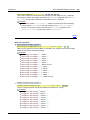
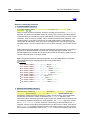
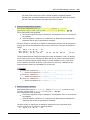
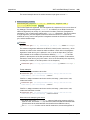
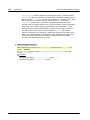
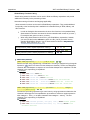
The chart in this example has the Data node (see XML document above) as its XPath context
node. Only one row is used for data selection, but it generates three series. This is because the
XPath expression in the For-Each column returns a sequence of three items, thus implicitly
creating three series.
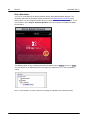
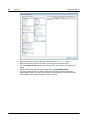
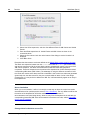
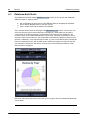
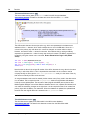
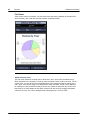
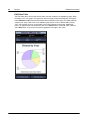
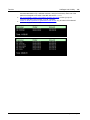
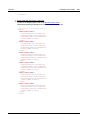
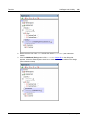
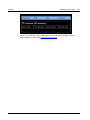
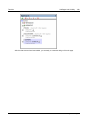
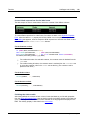
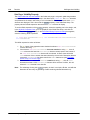
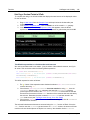
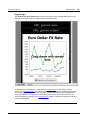
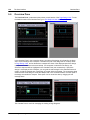
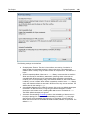
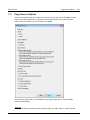
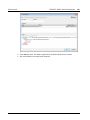
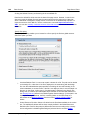
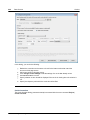
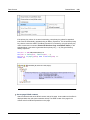
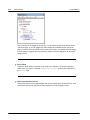
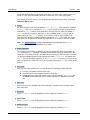
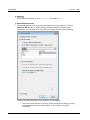
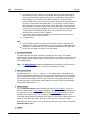
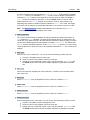
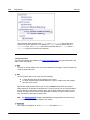
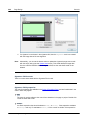
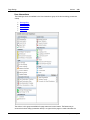
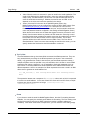
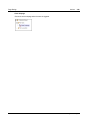
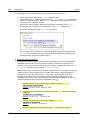
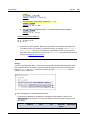
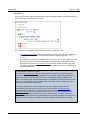
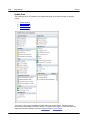
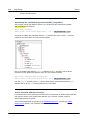
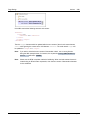
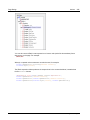
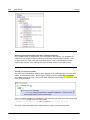
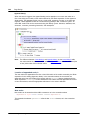
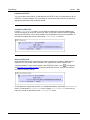
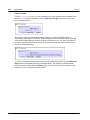
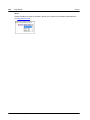
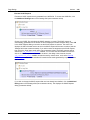
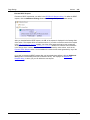
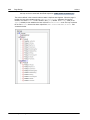
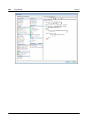
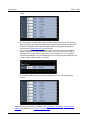
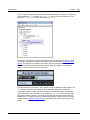
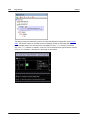
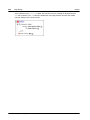
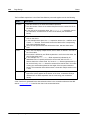
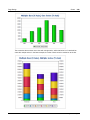
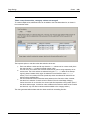
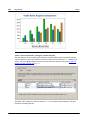
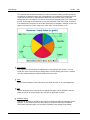
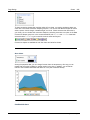
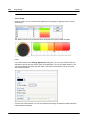
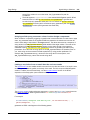
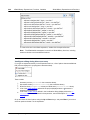
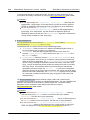
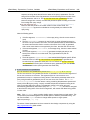
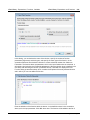
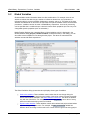
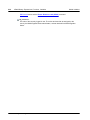
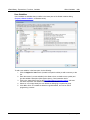
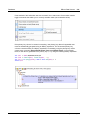
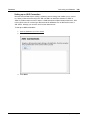
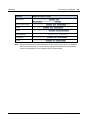
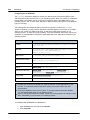
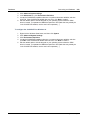
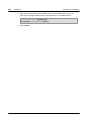
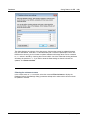
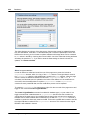
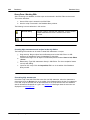
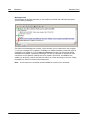
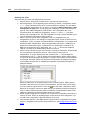
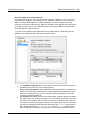
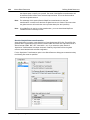
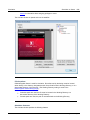
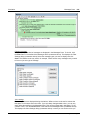
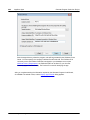
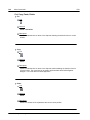
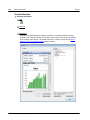
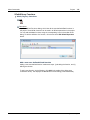
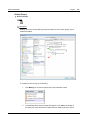
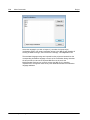
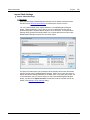
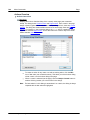
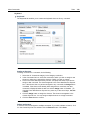
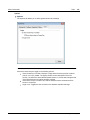
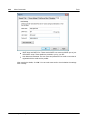
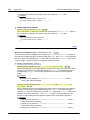
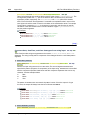
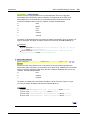
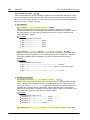
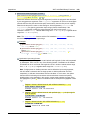
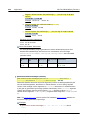
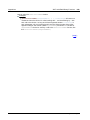
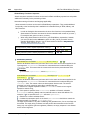
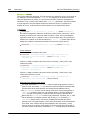
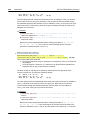
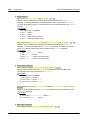
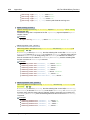
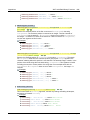
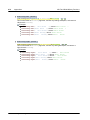
For each series, the series name, X-Axis, and Y-Axis selections will correspond to the different
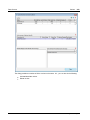
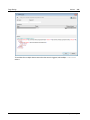
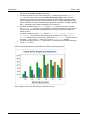
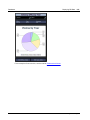
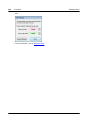
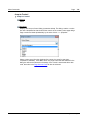
regions because each series has a different Region element as its context node. The chart for
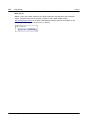
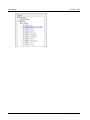
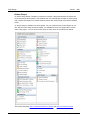
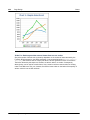
this data selection will look something like this:
© 2015 Altova Gmb H
Altova MobileTogether Designer