1
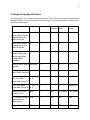
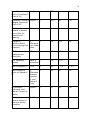
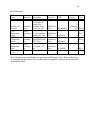
55 Table 1: Measurements Taken for Encoder B Output Signal Vpp
Frequency
Period
Pulse Width+
Pulse Width-
2.20E+00
1.74E+03
5.74E-04
2.82E-04
2.92E-04
Test Plan 1. Verify Encoder Performance
a. Connect encoder to appropriate ground ports on supply
b. Connect oscilloscope probes to appropriate encoder pins
c. Connect encoder to appropriate DC bias
d. Turn on supply
e. Rotate shaft and capture signals
2. Determine if Calculation for speed based on Encoder Signals is Accurate
a. Initialize the encoder
b. Apply a DC sweep to the motor attached to the encoder going from 1 V to 10 V in 0.5 V steps
using the E-652-m supply
c. Record rpm’s as displayed by the supply
d. Capture the output signals from the encoder
e. Compare the rpm’s measured and the rpm’s calculated
f. Determine if the calculations need adjustment
g. Correct as necessary
Table 2: BOM
Risk Assessment Description of Risk Possible Consequences Probability of Risk (H/M/L)
Severity of Risk (H/M/L)
Overall Risk (H/M/L) Contingency Plan Drive a seven segment display with the encoder output Verify proper acquisition of signals Obtain new encoders Inability to interface with the DAQ Decreased image quality L H M Inability to read A and M outputs Encoders do not function Unknown direction of motion H M H Inability to control speed H H H