Download User Manual RFIS
Transcript
User Manual RFIS (Regional Flood Information System) Table of Contents A Introduction .................................................................................................................................................. 1 B Remote Device Configuration ..................................................................................................................... 4 1 Login ................................................................................................................................................................. 4 2 Configuring Project, Station and RTU ........................................................................................................... 4 2.1 Adding a Project .......................................................................................................................................... 4 2.2 Adding Station ............................................................................................................................................. 5 2.3 Adding remote terminal unit (RTU) .......................................................................................................... 6 2.4 Adding RTU Sensors ................................................................................................................................... 7 3 Communication Setting (Modem setting) .................................................................................................... 8 4 Adding alert...................................................................................................................................................... 9 5 Adding Users.................................................................................................................................................. 10 6 Adding Group ................................................................................................................................................ 10 C Data Management System ........................................................................................................................ 11 1 Login ............................................................................................................................................................... 11 2 Creating Projects, Stations, Networks and Groups ................................................................................... 11 2.1 Adding Project ........................................................................................................................................... 11 2.2 Adding Network ........................................................................................................................................ 12 2.3 Adding Groups .......................................................................................................................................... 13 2.4 Adding Parameter Template ................................................................................................................... 14 2.5 Adding Station ........................................................................................................................................... 15 3 Adding Sensor ............................................................................................................................................... 19 4 Adding device ................................................................................................................................................ 20 5 Adding Communication ................................................................................................................................ 20 6 Adding Parameter ......................................................................................................................................... 22 7 User Management and Access Control ...................................................................................................... 23 7.1 Adding User Group (User Category) ....................................................................................................... 23 7.2 Adding Group ............................................................................................................................................ 24 7.3 Adding User to Groups ............................................................................................................................ 24 8 Development of Quality Control Procedure .............................................................................................. 25 8.1 Adding LIMIT CHECK to a parameter (Parameter Rule) ....................................................................... 25 8.2 Adding STEP CHECK to a Parameter (Parameter Rule) ........................................................................ 27 8.3 Adding CONSTANT CHECK to a parameter ........................................................................................... 28 8.4 Applying rules to Networks and Groups ................................................................................................ 29 9 Data Aggregation .......................................................................................................................................... 30 9.1 Aggregation Type: ..................................................................................................................................... 31 10 D E Data Visualization .......................................................................................................................................... 32 Content Management System (CMS) ....................................................................................................... 34 2 CMS Dashboard............................................................................................................................................. 34 3 Create New Page ........................................................................................................................................... 35 4 Adding Page Content .................................................................................................................................... 37 5 Page Formatting ............................................................................................................................................ 37 5.1 Components: ............................................................................................................................................. 37 5.2 Text Formatting Tools .............................................................................................................................. 43 6 Adding News and Events .............................................................................................................................. 44 7 Administration ............................................................................................................................................... 45 7.1 Change Password ..................................................................................................................................... 45 7.2 Sign out ...................................................................................................................................................... 45 Some useful SQL for easy data extraction directly from database .................................................... 46 Station and parameter ........................................................................................................................................... 46 Station network and group .................................................................................................................................... 47 Alert (Email) ............................................................................................................................................................. 56 Stored Procedures .................................................................................................................................................... 57 Triggers ..................................................................................................................................................................... 58 F System Component .................................................................................................................................... 62 Acronyms AES Advanced Encryption Standard APN Access Point Name CDMA Code Division Multiple Access CMS Content Management System DMS Data Management System GUI Graphical User Interface NTP Network Time Protocol QC Quality Control RFIS Regional Flood Information System RTU Remote Terminal Unit SMS Short Message Service Regional Flood Information System A Introduction The RFIS (Regional Flood Information system) is a time series software that provides a platform for timely exchange of flood data and information. The RFIS is developed with the objective of flood observation network in Hindu Kush Region with the development of regional database for hydrological and meteorological information; thus providing a common data sharing format for easy dissemination of weather information in the region. RFIS HYCOS Field Data Devices Acquisition Other Data Data entry Rule Engine Aggregation Sources Engine Data Management Quality Check Engine Agent Data Sharing Data Correction Import/Export Device Monitoring Configuration Data RFIS Database Visualization 1|Page Regional Flood Information System Components of RFIS: The RFIS software intact different modules to provide a platform for the information exchange. A. Remote Device Configuration B. Data Acquisition Module C. Data Management Module D. Data Visualization Module E. Content/Document Management Module A. Remote Device Configuration It is a web-based device configuration application operated through internet. It provides an interface to configure data loggers and sensors. Data Logger Request for Setting Internet Provides Setting Remote Device Configuration System B. RFIS Database Data Acquisition Module Data Acquisition Module is a gateway for weather data into RFIS database. It receives data from field device through internet via HTTP protocol. Other Data Data Logger Sources SMS-to-WEB Gateway Internet Mobile SMS Data Acquisition Module 2|Page Regional Flood Information System C. Data Management Module The Data Management Module comprises of following components: Data Entry It is a manual data observation entry interface that is intended for addition of station and its metadata. Quality Control Quality Control is a mechanism for data validation. Data validation is based on user definable rules. This also provides interface to configure alerts / warning based on observations received and the rules defined. QC helps to check correlation between observations for same station or multiple stations. Further, it provides timely information for errors in sensor and system. Data Aggregation Data Aggregation is a mechanism for generating derived parameters from basic parameters. The data aggregation is based on specific rules, data quality and availability. The aggregated data can also be handled by the QC engine. Monitoring Data Management System also provides a web interface to monitor remote devices. This generally includes Data monitoring, Power and Battery usage monitoring which helps in fault finding and trouble shooting of remote devices. Automatic notification is generated for any error – communication error, device error, etc. Data Rectification / Processing DMS provides an interface for correcting observations; audit trail and data download and upload. This module also facilitates manual execution of rule engine and aggregation engine. User Management D. Data Visualization Module: RFIS provides a large set of components for visualization of data in different standards and formats such as: • Basic tabular view and graph view for all the parameters • Virtual instruments on websites for specific parameters for real time display • Map view with Google map integration The data visualization module provides highly customizable components for user specific requirements and it is scalable to add further visualization components. E. Content/Document Management Module: The Content Management Module is an interface in DMS to manage additional documents, reports, publications, news, etc related to station and observations. This module can be integrated with data visualization component to create customizable web pages to display on public web sites. Further, this module provides basic search and document management system for repository. Note: There are separate links for Remote Device Configuration, Data Management System and Content Management System. Please contact Real Time Solutions for the links. 3|Page Regional flood Information System – Data Management System (DMS) B Remote Device Configuration This section familiarizes several web based tools associated with remote device configuration viz. configuration of data logger and sensors and setting its parameters. 1 Login In the web browser, enter the link provided by RTS. Provide you username and password. If login is successful you will see an interface like below. 2 Configuring Project, Station and RTU 2.1 Adding a Project Click on “+Project” and then on “Add Project “on the right pane. A project details dialog box will appear. Provide Name of the project Provide Start Date, Completion Date and Description of the project (these fields are not mandatory). Save your project by clicking on “Save” button. 4|Page Regional flood Information System – Data Management System (DMS) If saving is successful you will see the project in the project list 2.2 Adding Station In the project list page (image above) click on the project (1) or click on “+Projects” in the left panel to expand the tree and click on the project (2). To edit this project (3) click on button “Edit Project” (2). To add a station click on button “Add Station” (1) under the project (3). Provide Station Code. Must be unique and numeric. Provide Station Name Select Station Type Leave other fields blank and click “Save” If saving is successful you will see the station in the station list page. 5|Page Regional flood Information System – Data Management System (DMS) 2.3 Adding remote terminal unit (RTU) In the station list page (image above) click on the station (1) or click on “+Hycos Test Project” in the left panel to expand the tree and click on the station (2). To edit this station (3) click on button “Edit Station” (2). To add RTU click on button “Add RTU” (1) under the station (3). General Tab Select type: RTDL-11, Provide RTU name and code (code must be unique and numeric). Provide Primary Server : device will communicate to this server and also sends parameter readings Provide Secondary Server: device will not communicate with this server but send parameter readings. If you want to enable data encryption select Encryption “AES” or else “None”. Time Tab This tab is used to enable time synchronization for the device. Enable “Auto Sync Time” Provide Protocol) NTP (Network time server Time address. Usually : time.windows.com This is the location from where the device synchronizes its time Select “Sync Interval”: must be numeric. Time Zone: Device will provide data in the time zone you specified. 6|Page Regional flood Information System – Data Management System (DMS) Advance Tab If you enable “Auto Firmware Update” it will check for the updates for the software that is running on the device. Checking frequency is determined by the “Update Check Interval” and it must be numeric. If you want to record the supply voltage enable “Power Supply Records” Provide “Supply Sampling Interval” and “Supply Logging Interval” If “Power Saving” is selected as “Data Transfer Frequency”, then data will be posted in long interval of time whereas data posting is at real time if “Real Time Posting” is selected. If saving is successful you will see the RTU in RTU list page as shown below: 2.4 Adding RTU Sensors In the RTU list page (image above) click on the RTU (1) or click on “+(station)” in the left panel to expand the tree and click on the newly added RTU (2). To edit this RTU (3) click on button “Edit RTU” (2). 7|Page Regional flood Information System – Data Management System (DMS) 3 To add a sensor click on button “Add Sensor” (1) under the RTU (3). Select the type of sensor. Settings are provided accordingly to the type of sensor selected. Click “Add Parameter” (4). Select the sensor for which parameter/s is/are to be added. Select its corresponding Parameter. Provide a Name for the selected parameter. Provide Sampling Interval, Logging Interval and Measurement Unit accordingly. If saving is successful you will see the parameter in the list. Communication Setting (Modem setting) To setup the communication press button “Communication” (1) (image below). Select the Type M2MCGI or M2MGGI depending on the use of CDMA-GSM or GSM-GSM respectively for data transmission. 8|Page Regional flood Information System – Data Management System (DMS) Provide APN, Username and Password provided by the mobile service provider. Priority: The modem having higher priority (High) will post data to server first. If the higher priority modem could not send data, next priority (Medium) modem tries posting data. Logging: If Enabled data logger logs modem status parameters like CSQ (signal strength), modem error. Iridium Tab Iridium Modem can be operated in four different modes: Disabled: Device does not use Iridium to post data. Regular Modem: Sets Iridium to post regular data as general modems (CDAM & GSM). Special Log: Iridium posts minimum, maximum and average of each parameter once in a day Alarm Only: Sends data whenever an alarm condition is triggered Click “Save” to save these communication settings as configured. 4 Adding alert Alerts can be incorporated into the system for parameters to generate alarm for any alarming condition. For example: setting warning and danger levels for water level to generate alert for flooding situation. To setup alert, click “Add Alert” (2). Select parameter for which alarm is to be set. Select alert type : o SMS: Alert is sent through SMS to all the users defined in “Group”. o Iridium: Alert is sent via Iridium to server. To use iridium, iridium modem 9|Page 
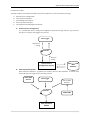
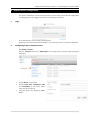
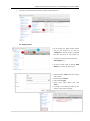
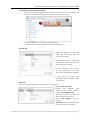
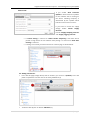
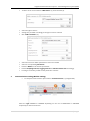
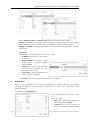
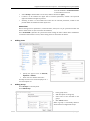
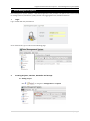
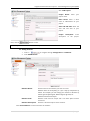
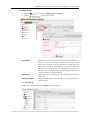
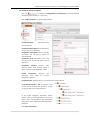
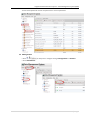
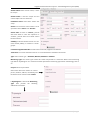
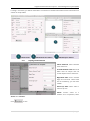
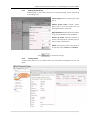
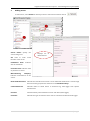
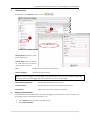
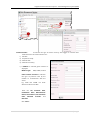
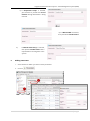
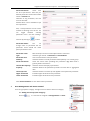
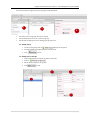
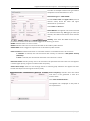
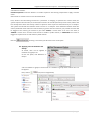
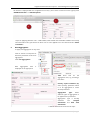
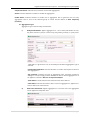
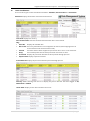
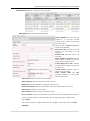
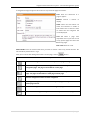
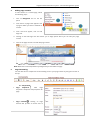
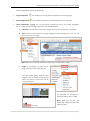
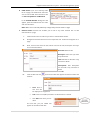
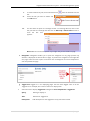
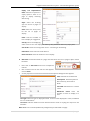
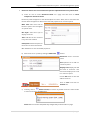
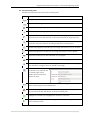
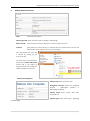
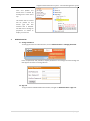
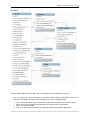
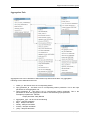
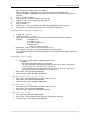
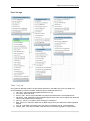
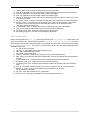
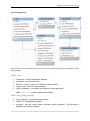
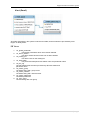
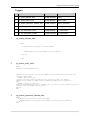
Regional flood Information System – Data Management System (DMS) must be enabled in “Communication” as described in section 3. Select Group to whom SMS is to be sent (if SMS is selected as Type). If alarm is to be enabled for upper limit of selected parameter, enable it and provide upper threshold and upper hysteresis. Similarly, If alarm is to be enabled for lower limit of selected parameter, enable it and provide lower threshold and lower hysteresis. Remember! Above settings (sensor parameters, communication, alerts) are not yet synchronized with the device rather these are just saved into the database, Press “Download” (3) button to synchronize these settings to device. When device establishes a communication with the server, these setting are then saved into the device. 5 Adding Users Click on “Add User” to add a new user. Specify the type of user as General, Operator or Admin. Enter new user details and save it. A newly entered user will be displayed in a user description list 6 Adding Group Click “Groups” on the left panel. Click “Add Group”. Enter group name. Add description to the group Select users to be included in this group. Click “Save” button. When a group is successfully added it will be listed in a Registered Group. 10 | P a g e Regional flood Information System – Data Management System (DMS) C Data Management System Data Management System (DMS) is a web based application that provides a Graphical User Interface (GUI) to manage stations, field devices, quality control rules, aggregation rules, metadata and data. 1 Login Log in to DMS with the provided link. Once authenticated, you are directed to following page. 2 Creating Projects, Stations, Networks and Groups 2.1 Adding Project Click or navigate to Configuration >> Projects 11 | P a g e Regional flood Information System – Data Management System (DMS) Click “Add Project” Project Name: Enter your project name. Short Name: Enter a short name or abbreviation of your project. Start and End Date: Enter the start and end date of your project. Project Description: description Next, click on of the Enter project. button to save. Note: Only the fields marked “*” are mandatory. 2.2 Adding Network 1. Click on 2. Click “Add Network”. Network Name: or navigate through Configuration >> Networks. Provide name to the network you want to create. Network name can be anything. It is just a way of classification of station. For example, you can classify your network on the basis of station type like Hydrological, Meteorological, Agro Met, etc. Network name must be unique. Network Code: Network code must be unique and it can have alpha numeric characters. Network Description: Provides a brief description of the network. Click “Save Network” to save and create the network. 12 | P a g e Regional flood Information System – Data Management System (DMS) 2.3 Adding Groups 1. Click on 2. Click on Group Name: or navigate to Configuration >> Groups and enter the given fields. Group name can be anything it’s another way if classification of station. So, you can classify your group on the basis station attributes of common or physical location or basins (like high land, low land, SYNOP, etc.) whatever suits your requirement. Group name must be unique. For hydrological station you can create groups according to basin, for meteorological station you can create group according to altitude. Group Code: Group code must be unique and can contain alpha numeric characters. Group Description: Briefly describe group name though it’s not mandatory but recommended. Click “Save Group” To view your saved groups click on Groups link in a tree view. 13 | P a g e Regional flood Information System – Data Management System (DMS) 2.4 Adding Parameter Template Click or navigate to Configuration >> Parameters. A list of pre-defined parameters will be listed on a right pane. Click “Add Parameter” to add a new parameter. Parameter Name: Parameter name must be unique. Parameter Short Name: Enter parameter short name (not mandatory). Parameter Description: Briefly describe parameter. You can leave it blank but recommended. Parameter Code: Parameter code must be unique and can contain alpha numeric characters. Parameter Interval: Defines units (minutes, hours, days, months, years) in which values are to be displayed in web. Parent parameter Parameter: from which Specifies the the current parameter is derived. Parameter Unit: Indicates unit of measurement for the parameter. Is Parameter Group: If Yes is selected, it will not be treated as the actual parameter, rather as a group with set of real parameters. In the figure alongside, parameter “Water Group” is not an actual parameter, it is used to group other real parameter like Waterlevel, Daily Water Level – Minimum, Daily Waterlevel – Maximum. Click “Save Parameter”. 14 | P a g e Regional flood Information System – Data Management System (DMS) To View saved parameter click on list parameter or click on parameter. 2.5 Adding Station Click on left panel or navigate through Configuration >> Stations. Click “Add Station” 15 | P a g e Regional flood Information System – Data Management System (DMS) Station Name: Enter station name, it must be unique. Station Code: It must be unique and can contain alpha numeric characters. Installation Date: Date when station was setup. Status: Current status of the station. If it’s in operation select “Active” else “Inactive”. Active Date: If Status is “Active”, provide date from when it came into operation. If “Inactive”, provide date from which station became inactive. Visibility: Indicates whether station is to be made visible publicly or limited to certain groups. Latitude/Longitude/Altitude: Provide stations latitude, longitude and altitude. Time Zone: Time zone should be same as it is in the field device installed in the station. Type: Select station type – Automatic, Manned, Automatic + Manned. Measuring Type: This means type of data this station will provide. If it measures “Water level” measuring type will be “Hydrological”. If it measures weather parameters measuring type will be “Climatology” and so on. Project: Select Project Name. Other meta data of the station viz. contact person, number, address, accessibility and landmark can be entered under Others If Hydrological is selected for Measuring Type then provide the following additional information. 16 | P a g e Regional flood Information System – Data Management System (DMS) If saving is successful, you will be redirected to an interface as shown below where further information for station can be provided. Station Detail 2.5.1 Add Network for Station. Add Group for Station. Defining Station Network Select Network: Select Network name from a list. Provide Network Code: Add code which must be unique and can contain alpha numeric characters. Begin/End Date: Enter network begin and end date. These fields are not mandatory, you can leave it blank. Inherit QC Rule: Select “YES” or “NO” for QC rule. Status: Current status of a network. If it’s in operation, select “Active” else “Inactive”. Click to save. 17 | P a g e Regional flood Information System – Data Management System (DMS) 2.5.2 Defining Station Group Provide group for the station that you are currently working. Station can belong to multiple groups. Select Groups: Select station group from the list. Station Group Code: Provide station group code. It must be unique and can have alpha numeric characters. Begin/End Date: Add begin and end date for group. These fields are not mandatory. Inherit QC Rules: Indicates whether to inherit rules defined for selected group to station under consideration. Status: Select group status, if the group is in operation select “Active” else “Inactive”. Click 2.5.3 to save these settings. Viewing Station To view saved station, click on station name from hierarchical arrangement on the left panel. 18 | P a g e Regional flood Information System – Data Management System (DMS) 3 Adding Sensor To add sensor, select Station on which you want to add sensor and then click on Sensor Name: Specify the sensor being used. SN: Field to Displays list of added sensors enter Serial Number of the sensor. Installation Date: Indicates date of installation. Purchase Date: Indicates date of purchase of sensor. Manufacturing Company: Indicates manufacturer of the sensor. Next Calibration Date: Indicates the date when the sensor is to be calibrated. Notification is sent through email to various groups before the date set as Alert Before Days. Connected Device: Indicates device to which sensor is connected e.g. data logger from specific manufacturer. Protocol: Communication protocol between sensor and device (data logger). Interface: Indicates the type of interface sensor uses to communicate with the data logger. 19 | P a g e Regional flood Information System – Data Management System (DMS) 4 Adding device To add device, select Station and then click on . Lists added devices Device Name: Specify the name given to the device. Device Code: Must be unique for each device and can contain alpha numeric characters. SN: Specifies the serial number of the device. Device Category: Specifies the type of device. Note: For “Device Category” as “Data logger”, Device Code must exist in order to map the station with data being sent by the data logger and must match with the one set to data logger. 5 Manufacturing Company: Specifies the manufacturer of the device. Purchase Date: Indicates the purchase date of installation of the device. Description: Field to enter description related to the device. Adding Communication Communication here indicates means by which data logger transmits data to central server that can be through modem, manual SMS, manual form, etc. 1. Select Station to add communication parameters. 2. Click Communication. 20 | P a g e Regional flood Information System – Data Management System (DMS) Communication: It indicates the type of means used by data logger to transmit data. Different means of communication are: i) Modem ii) Acquisition Script iii) Manual SMS iv) Manual Form Entry i) If Modem is selected given interface is displayed Modem Type: GSM, CDMA, Iridium. Data Transfer Protocol: It indicates the type of protocol used by the modem to communicate with the server. E.g. GSM and CDMA use HTTP whereas Iridium uses SBD. Enter the Installation SN, Purchase Date, Date, Manufacturer Name, Sim Number, Sim Activation Date, Network Provider and Remarks. Click “Save” 21 | P a g e Regional flood Information System – Data Management System (DMS) ii) If “Acquisition Script” is selected, you will have to provide the Source Domain through which data is being received. iii) If “Manual SMS” is selected, then provide the Sender Name. iv) If “Manual Form Entry” is selected, then provide “Feeder Name” who is responsible for entering data to the system. 6 Adding Parameter 1. Select Station for which you want to add a parameter. 2. Click on 22 | P a g e Regional flood Information System – Data Management System (DMS) Parent Parameter: Select from the list of parameters. These are predefined parameter list that were added earlier in Section 2.4. Selection of any parameter, auto fills most of the fields. Default values can be modified as per the requirement. Also, a new parameter can be created instead of selecting from the list. You can toggle between selecting parameter from a list and creating a new one by clicking on button Parameter Name: You can change name of parameter but the parameter name should not match parent parameter name. Parameter Code: Must be unique and can contain alpha numeric characters. Type: Indicates type of data – Continuous or Accumulated. Parameter Unit: Unit of measurement of the parameter. Visibility: Indicates whether to make parameter visible publicly or to certain group. Sensor Parameter: Select the sensor name providing this parameter. E.g. Water level is given by Rader Level Sensor. Interval & Frequency: Indicates interval of display of parameter. Property: Indicates whether the parameter provides real time data or aggregated data. Inherit QC Rule: Indicates whether to inherit QC rule applied to that particular parameter. Upper Threshold: Provides upper threshold for the parameter. Lower Threshold: Provides upper threshold for the parameter. Click “Save Parameter” to save above station parameter. 7 User Management and Access Control Users are grouped in category. A single user must have at least one category. 7.1 Adding User Group (User Category) Click on in a tree view or navigate to Configurations >> Users. 23 | P a g e Regional flood Information System – Data Management System (DMS) An interface with list of groups and user groups will be displayed. 1 2 3 First Pane (1) lists all groups that were created. Second Pane (2) lists users in a particular group. Third Panel (3) displays form for adding a group and a user. 7.2 Adding Group 1. To add a new group click on 2. Form for adding a new group will be in third panel. displayed in first panel. 3. Click to save. 7.3 Adding User to Groups 1. Select Group Name for which you want to add user. 2. Click on 3. Fill the form to add user in a group. 4. Click to save. 24 | P a g e Regional flood Information System – Data Management System (DMS) 8 Development of Quality Control Procedure This section familiarizes with data quality control process and how to apply quality rules on data from station. This section will enable one to design quality control to validate data from field devices i.e., by applying rules. Rules can be simple mathematical operation and /or user defined function based on time and data. Note: Rules can be applied to individual parameter(s), network and groups. There are 4 types of rules can be applied to each parameter - Limit Check, Step Check, Constant Check, and Parameter Cross Check. Data Acquisition Raw Comply Data Comply Comply Parameter Network Group Rules Station Rules Rules Rules Comply Invalid Invalid Invalid Invalid Flag Data, Trigger Notification Aggregate Data Store Processed Data 8.1 Adding LIMIT CHECK to a parameter (Parameter Rule) This rule checks if a parameter exceeds a certain threshold limit Click on from tree view or navigate to Configuration >> Parameters. Click on parameter for which rule is to be applied from the list of Parameters. Click on from Parameter Information p a g e . 25 | P a g e Regional flood Information System – Data Management System (DMS) Let’s take an example to define Limit check where o temperature must be between 5 to 30 C. Select Rule Type as “LIMIT CHECK”. Provide Lower Limit and Upper Limit (must be numeric value): Check the lower and upper thresholds for a parameter. Select Start and End date. Select Month: The applied rule will be executed for selected months only. For e.g. if you select Jan and Feb, rules will be executed for these months only. Severity: If the value that DMS receives for this parameter exceeds the limit than it will be flagged as the severity you select. NONE: Indicates there is no error in value. ERROR: Indicates value as Error and such value will not be visible in public domain. SUSPICIOUS: Value is flagged as suspicious but is still visible in public domain. Rules on Failure: Indicates what action is to be taken if data is not available for this rule to execute. If “Continue” is selected, this rule will execute with severity as selected in “Rule failure severity (Continue)”. If “Halt” is selected, this rule will halt and further rule execution is seized. Execution Order: Indicates priority of the rule execution if the parameter has more than one rule applied.. 0 means higher priority, larger the numbers lower the priority. Select Alert Group: Sends an alert through E-mail to selected group whenever the applied rule fails. Provide the subject and message of the alert (email). Alert Frequency: Indicates time after which next alert is to be generated. It must be a numeric value. Click “Save Parameter Rule”. The applied rule is displayed on left panel of list of parameters. 26 | P a g e Regional flood Information System – Data Management System (DMS) 8.2 Adding STEP CHECK to a Parameter (Parameter Rule) This rule verifies whether the rate of change of instantaneous value is within a limit or not. Let’s take an example where two consecutive temperature value differences cannot be o more than 0.3 C Insert Title for the rule to be applied. Select Rule Type as “STEP CHECK”. Increment: It indicates the maximum deviation two amount allowed consecutive of between values. It must be a numeric value. Include Suspicious: Enter “Start Date” and “End Date” for which the rule is applicable. Select Month: This rule will be executed for selected month only. E.g. If Jan and Feb are selected, then the rules will be applicable only for these two months. Rule on Failure: It indicates action to be taken If no data is available for this rule to execute. If “Continue” is selected, this will execute with the severity as selected in “Rule failure severity (Continue)”. If “Halt” is selected, this rule will halt and further rule execution is seized. Severity: Step Check checks if two consecutive values received for a parameter from a station do not deviate much. To perform the step check the system requires two 27 | P a g e Regional flood Information System – Data Management System (DMS) parameter values – values that we received (value that needs to be checked) and the previous value (value that has already been checked and stored). If the difference between these two values is greater than the increment you provided the value will be flagged as the severity you select. Severity “NONE” denotes there is no error in the value. Severity “ERROR” denotes error in the value and this value will not be visible in public domain. If “SUSPICIOUS” is selected, this value is flagged as suspicious but will still be visible in public domain. Execution Order: Indicates priority of rule execution if more than one rule is applied to a parameter. 0 means higher priority, larger the numbers lower the priority. Select Alert Group: Generates an alert (email) whenever the rule applied to a parameter fails. Provide subject and message to generate as alert. Alert Frequency: Indicates time for generation of next alert. It must be a numeric value. Click “Save Parameter Rule” to apply the set rule to the parameter. 8.3 Adding CONSTANT CHECK to a parameter Let’s take an example where temperature cannot be same for a period of time. Add Title for the rule. Select Rule Type as “CONSTANT CHECK”. Check in (Data Interval): Indicates time duration of which data is to be constant checked. For example: If 1 Hours is entered, QC will apply rules to past 1 hour data for constant check. Min required Samples: Indicates required number of samples within selected time interval in Check in (Data Interval) Tolerance: Tolerance must be greater than the difference between maximum value and minimum value amongst data selected within the 28 | P a g e Regional flood Information System – Data Management System (DMS) selected time duration. Include Suspicious: Indicates whether to include suspicious data among sample data to apply constant check. Other fields are similar to those rules described above. Here, checks if the value being received for a parameter is changing. To perform the constant check, the system requires value that we just received (that needs to be checked) and the precious values (values that has already been check and stored), number of previous value required is determined by no. of samples. The system will calculate the absolute mean from the no. of samples. If the difference between these two values (calculated mean value and received value) is greater than the tolerance you provided the value will be flagged as the severity you selected. If you select “NONE”, it means there is no error in the value, if “ERROR” it means error and this value will not be visible in public domain, if “SUSPICIOUS” this value is flagged as suspicious but it’s still visible in public domain. Now click . If saving is successful you will see the rule on left pane. 8.4 Applying rules to Networks and Groups As stated, rules can be applied to networks and groups too. On the left panel, click Networks or Groups A list of networks or groups is listed. Click on a network or group name to which rule is to be applied. Next, click on link (see an image below). 29 | P a g e Regional flood Information System – Data Management System (DMS) An interface is diplayed with list of applied rule on left (1) and a form to add rule on the right (2) with “Add Network Rule” or “Add Group Rule” Steps for applying different rules – LIMIT CHECK, STEP CHECK and CONSTANT CHECK have already been described. Here, parameter for which rule is to be applied has to be selected under “Select Parameter”. 9 Data Aggregation To apply data aggregation on any data: Click on station on left panel for which the parameter needs to be aggregated. Click “List Aggregation” Data Aggregation form is displayed on the right panel. Title: Enter Title for the aggregated data, e.g. Discharge, Dew Point. Primary Input Parameter (X): Select primary parameter which is to be aggregated to create derived parameter. Aggregation Type: Offers different types of aggregation to be applied to the parameter. Aggregation Type classified into Calculation and is broadly Delayed Real Time Calculation. It will be discussed at the end of the topic. 30 | P a g e Regional flood Information System – Data Management System (DMS) Output Parameter: Indicates the parameter formed after aggregation. Status: Indicates whether to enable or disable the aggregation. Enable Alerts: Indicates whether to enable alert if aggregation fails or generate alert on every aggregation. Alert is sent to the selected group at certain interval defines at Alert Frequency (minutes). 9.1 Aggregation Type: Aggregation type can be broadly classified into: i) Delayed Calculation: Applies aggregation to a set of data (data within an hour, day, week, month or year) to create hourly, daily, weekly, monthly, or yearly value. New fields are generated if any of the Delayed Calculation Aggregation Type is selected. Include Null/Suspicious: Indicates whether to include null/suspicious values in data aggregation. Agg. Function: Indicates the type of aggregation (Sum, minimum, maximum, average or count) to apply on data. Number of data for which aggregation is to be applied is entered in Min. No. of required samples. Time Offset: Includes data that lies within the time offset defined. Value Filter: Indicates what data to filter so that no aggregation is applied on it. Data is defined as a formula/rule. ii) Real Time Calculation: Applies aggregation to real time data. This aggregation can be applied to interpolate data. 31 | P a g e Regional flood Information System – Data Management System (DMS) 10 Data Visualization There are three types of data visualization available – Raw Data, Processed Date and Latest Data. Raw Data: Displays all the data received from field device. Time zone: displays the country. Start and End Date: indicates duration between which data is to be viewed. Flag: Show All: Not Found: Lists every data which are not mapped to the station (here mapping means in Displays all available data. Paused: Lists data that has been stopped for procession due to error in rule execution. Retry: Lists all data points that has been processed more than 10 times. Processed: Displays all processed data that has been passed through QC rules. Unprocessed: Displays unprocessed data. terms of Device Code and Parameter Code). Processed Data: Displays all processed data that passed through QC rule. Severity: Allows selecting from the list to display only those data that has been flagged as OK, SUSPICIOUS or ERROR. Latest Data: Display recent data received in the server. 32 | P a g e Regional flood Information System – Data Management System (DMS) Feed/Edit Data: Helps to manually feed and edit data. Data Upload: Helps manually uploading data. Select Template: You can select the template if it has been created already. If “No”, create one by filling the below fields. Select file type as Excel or Csv which needs to be uploaded. Data start row: Indicates start row number of the file which is to be uploaded Exclude row: Indicates rows to be excluded. Sheet number to process: Specifies total number of sheets in your file which needs to be processed. Treat empty cell as null: Indicates whether to treat empty cell in the file as null or not. Invalid values: Specifies types of value to treat as invalid. Treat invalid value as null: Indicates whether to treat invalid value as null or not. Select File: Browse for the file to be uploaded. Data Timezone: Specifies timezone of data in the file. Need to QC: Indicates whether to apply QC on data or not. Human Processed: Indicates whether data of the file is human processed or not. Data Source: Indicates source of data Select Station: Indicates station of which the data is. No. of columns: Indicates total number of columns in the file. According to the number of columns entered, fields for column number and corresponding value are generated. Click “Verify”. This entry is saved as a template. Next time, this template can be selected from “Select Template”. 33 | P a g e Regional flood Information System – Content Management System D Content Management System (CMS) Content Management System (CMS) is a web based application that provides a Graphical User Interface (GUI). This section familiarizes with several server tools associated with content management system that helps one to manage content for the website. 1 Login Login into the CMS admin page with the link and credentials provided by RTS. 2 CMS Dashboard The first page that you see after a successful login is a dashboard. Dashboard is an interface which displays all the possible links needed for an effective website. The right pane on the page list all the new pages created, booked marked pages, recent pages, etc. The left pane displays the list of all the pages. Web Content Editor Dashboard All Pages Displays the list of all the pages. You can bookmark the page by clicking on the icon. New Pages Displays the list of all the newly created pages. Recent Pages Displays the list of recently visited pages. It lists the details of who visited the certain page and at what date and time. Bookmarked Pages Displays the list of pages that were bookmarked in All Pages. Unlinked Pages Resources List outs all the files that were uploaded using the Image gallery or Resources Panel. You can edit or delete any uploaded files form this Resources page. Navigation Navigation is a link using which you will create and design page. 34 | P a g e Regional flood Information System – Content Management System 3 Create New Page To create a new page, click on Navigation link on the right pane. Navigation link will display a list of all the navigations created previously. To create a new page – 1. Click on the link where you want to create a new page. A tool box appears with an option to create and edit page, delete, refresh and access control. 2. Click on Insert new navigation below tool to create a new link or click on Insert new child navigation tool to create child navigation. Insert new navigation below Insert new child navigation Let’s for instance, create a new child page with a name Career in News and Events. So, click on News and Events and then click on Insert new child navigation button. 35 | P a g e Regional flood Information System – Content Management System A navigation dialog box appears where we are to provide the page information. Title: Enter the title/name of a page to appear. Banner: Choose a banner to display. State: Select the state which can either be Protected or Visible or both. Make sure to select the state as visible else the navigation will not be displayed. Link To: Select a page from dropdown menu if you want to link to any specific page else select “Not linked to any page”. User Code: Add user code. External URL: Enter the external URL link if you want to redirect a link to any outside domain. The link should be prefixed with “>” sign. After you are done with adding information’s for the page, click on button. Tools Description Edit Tool: Clicking on this tool will enable you to edit page setting. Insert new navigation below: Clicking on this tool will enable you to add new navigation/page. The page created will be a main page. Insert new child navigation: Clicking on this tool will enable you to add a child page. The page created will be a child page of main page. Remove navigation: Click to remove navigation. Edit Page: Clicking on this tool will redirect you to page where you can edit the select page content. Refresh: Clicking on this will refresh the navigation page. Access Control: Using this tool you can set access permission for a page. 36 | P a g e Regional flood Information System – Content Management System 4 Adding Page Content To add content in a created page, follow the following steps: 1. Click on Navigation link on the left panel. 2. From the list of pages that appears click a page for which you want to add/edit its content. 3. From tools that appear, click on Edit Page tool. 4. Clicking on the Edit Page tool will redirect you to Page Option where you can add your page content. 5. Click on the page content area and add page content. Note: Make sure to save and publish any changes that you have made in a page. 5 Page Formatting You can add various components and formatting tools to your page content by using the tool bar at the top. 5.1 Components: Page Properties : With Page Properties component add properties for page. Page Preview : Clicking on Page Preview will provide an actual view of 37 | P a g e Regional flood Information System – Content Management System how the page would look like be publishing. Copy Components : This enables you to copy all the component of an existing page. Paste Components : This enables you paste the copied components to a new page. Insert Components : You can add various components such as text, image, navigation, etc., to a page. The various page components are described below – a. Container: To add a new container for a page, click on Insert Component > Containers. b. Text: To insert a new text area on a page, navigate to Insert Components > Text. This will insert a text area on a page. Note: Make sure to save and publish any changes that you have made in a page. c. Image: To add image to a page, click on Image from the Insert Component tool. From the image gallery dialog box that appears, click on Choose File button and select the picture to add from your PC and close the box. The uploaded file will appear in the Image Gallery and in a page. Note: Make sure to save and publish any changes that you have made in a page. 38 | P a g e Regional flood Information System – Content Management System d. HTML Panel: If you are to add any video file on a page, use HTML Panel. Select the area to insert HTML Panel and then click on Insert Components > HTML Panel. In the YouTube Browser dialog box that appear, paste the embed code of a video and click OK button. Note: Make sure to save and publish any changes that you have made in a page. e. External Links: External Link enables you to link to any other external link. To add external link to a page, i. ii. Click and select the area where you want to add the External link. Navigate to External Link from Insert Component tool. A link box will appear on a page. iii. Next, click on Text tool from the tool bar and set the title, description and style for an external link box. Box Title: Add box title Box Style: Select box style from drop-down box. Title: Add title for the links if any else leave it blank Description: Add description for the links if any else leave it blank. Click OK. iv. Click on Add Link tool from the tool bar that appears for External Links and add link. Text: Enter a text that will be displayed as a hyperlink. Link: Enter a link (URL) to which to redirect when it is clicked. Click OK button after you are done. The link that you just added will appear in an External Link box. 39 | P a g e Regional flood Information System – Content Management System v. In order to delete any link, click on Remove Links from the External Link tool bar. vi. Select the link you want to delete and click OK button. vii. You also have an option to rearrange the link. To rearrange the link, click on the link you want to rearrange and then click on Move Up or Move Down button to from the box that appears. Note: Make sure to save and publish any changes that you have made in a page. f. Navigation: Navigation enables you to place the navigation on any page position. By default it is displayed on the left side of a page. To position the navigation on the right side of a page, select the area to place it and then click on Navigation for Insert Components. Save and publish the page. g. Tagged List: Tagged list is for displaying pages that has been tagged same as in the Tagged List. For example, let’s create a section for display news. i. Select the area to display Tagged List. Navigate to Insert Components > Tagged List. Query: Add tag to display in Title: Add title for Tagged List. Description: Add description for the tagged lists if any else leave it blank. 40 | P a g e Regional flood Information System – Content Management System Empty List Replacement Html: Add text to replace the empty spaces if there is no page to display matching with the tag. Style: Select the ordering style for the list of pages to display. Class: Select the class (color) for the list of pages to display. Limit: Limit the number of lists to display in a tagged list. Sort By: Select the displaying order of the list. You can display list either by title, publication date or by expiry date. Sort Order: Select the sorting order of lists – ascending or descending. Date Filter: Select how lists will be filtered. Filter Tolerance: Limit the number of list to display. h. RSS Feed: To add a RSS Feed on a page, click and select an area on a page to place an RSS Feed box. Next click on RSS Feed from Insert Component tool bar. Click on Edit tool from the tool bar that appears next to Insert. Set the properties for RSS Feed in the RSS Feed Properties dialog box that appears. Title: Add title for the RSS Feed. Description: Add description for RSS Feed if any else leaves it blank. Feed URL: Add feed url to retrieve a feed. Maximum Items: Enter the number of feeds to display at a time. List Type: Select list type to display RSS Feed. It can be either displayed in a box, numbered list or in a bulleted list. List Class: Indicates HTML CSS Class which would be used for styling the output for this Feed Box Note: Make sure to save and publish any changes that you have made in a page. 41 | P a g e Regional flood Information System – Content Management System i. Resources Panel: You can use Resources panel to upload and share any information. a) Select an area to insert Resources Panel on a page and then click on Insert Component > Resources Panel. Resources panel will appear on the selected place to insert it. Next, click on Text tool from the tool bar that appears for Resources Panel and properties for resources panel. Main Title: Add main title for Resource panel. This will appear as a panel name. Box Style: Select box style to display resources. Title: Add title for the resources if any else leave it blank. Description: Add description for the resources else leave it blank. Click OK button to save the added properties. b) Add resources to a panel by clicking on Add Items tool bar. Resources: Enter resources name. File: upload a file to add in a resources panel. Display Title: Display title will be same as resources. This title will be displayed as a link in a resources panel. Click on OK button to save the added resources. Click on Save and then on Publish icon. c) Similarly, click on (Remove Items) to remove any added resources. Select the file to remove and then click OK button. Note: Make sure to save and publish any changes that you have made in a page. 42 | P a g e Regional flood Information System – Content Management System 5.2 Text Formatting Tools The table below describes the various text formatting tools. Tools Description Add style to your headings. Add font size for page content. Bold tool enables you to give your text bold appearance. Italic tool enables you to give your text italic appearance. Superscript tool enables you to position your text slightly higher than the other text on the line. Select the character to superscript and click on superscript tool. Subscript tool enables you to position your text slightly lower than the other text on the line. Select the character to subscript and click on subscript tool. Numbered paragraph tool enables you to arrange information’s in list in numbers. Bulleted Paragraph tool enables you to arrange information’s in list in bullets. Indent tool enables you to add indentation to a paragraph. Outdent tool enables you to remove indentation from a paragraph. Insert Image tool enables you to insert image in a text box. Click on Insert Image tool and select an image to insert or upload a new image. Insert a link tool enables you to add link to any external URL or internal pages. It also enables you to create email address as a link. Remove link tool enables you to delete created link from a page. Select the link to delete from dialog box and click OK button. Clear Formatting tool allows you to clear the formatting that you have applied to any text. Select the text and the click on Clear Formatting tool. Highlight Tool enables you to highlight the content in a text area. Height Tool enables you to define the height of a text area. The height of a text area is defined in pixels. 43 | P a g e Regional flood Information System – Content Management System 6 Adding News and Events Title: Enter the title of news. Home Page Title: Enter the title of news to display in Home page. External Link: Enter the URL of news to display if it is from any other resource. Content: Add content for news if there is no external link. The content field is same as the Web content editor page that is for any normal page. Save and publish the news that is created by clicking on the icons at the top. The news that is created will be placed first in News and Events section and is not visible. Its property needs to be changed to visible to display it on the site. Station Info Templates Station Title: Enter the station title. Navigation Location: Select the navigation location – Hydrological Network or Meteorological Network. Station Code: Select station code from dropdown list. Station Type: Select station type – Hydrology or Meteorology. 44 | P a g e Regional flood Information System – Content Management System Save and publish the station that is created by clicking on the icons at the top. The station that is created will be station placed type on that the was selected and is invisible. You will have to change its properties to visible to display it on the site. 7 Administration 7.1 Change Password To change password for administration, click on Administration > Change password. Enter old password, new password, confirm password in the Change Password dialog box that appears and click on Change button. 7.2 Sign out To log off from the DHMS Web Content Editor, navigate to Administration > Sign out. 45 | P a g e Regional flood Information System E Some useful SQL for easy data extraction directly from database Station and parameter Station information is stored in two tables ‘station’ and ‘station_audit’.The main purpose of creating two table is to record all the changes, there is no provision of update or deletion.Every time user inserts the station information a new row is added in ‘station_audit’ table preserving the previous entry.While fetching the station information, latest record from the ‘station_audit’ table is supplied to the user. Code : SELECT s.*,sa.* FROM station as s INNER JOIN (SELECT max(id) as max_id,station_id FROM station_audit group by station_id)as saa ON (s.id=saa.station_id) INNER JOIN station_audit as sa ON (saa.max_id=sa.id) (Note: same storing principle is followed for ‘parameter’ and ‘station_parameter’) 46 | P a g e Regional flood Information System Station network and group Station network is stored in two tables ‘station_network’ and station_network_audit’.The main purpose of creating two table is to record all the changes, there is no provision of update or deletion.Every time user inserts the station network information a new row is added in ‘station_network_audit’ table preserving the previous entry.While fetching the station information, latest record from the ‘station_network_audit’ table is supplied to the user. Code : SELECT s.*,sa.* FROM station_network as s INNER JOIN (SELECT max(id) as max_id,station_network_id FROM station_network_audit group by station_network_id)as saa ON (s.id=saa.station_network_id) INNER JOIN station_network_audit as sa ON (saa.max_id=sa.id) (Note: same storing principle is followed for ‘network’, ‘group’ and ‘station_group’) 47 | P a g e Regional flood Information System Station device, sensor and communication 48 | P a g e Regional flood Information System QC Rule All rules defined will be stored in table `wa_rule`.Following are the attributes and its use. sync_out_unique_id : auto generated 16 character length unique id.Generated when rule is created.This id will be used while synchronization of the rule in multiple domain. 1. sync_change_detected : set to 1 when user update the rule definition.So, that the system knows to sync the changes to other domain if the rule has been synchronized. 2. order : rule execution order. 3. rule_of : to whom this rule belongs to (parameter,network,group,station parameter) 49 | P a g e Regional flood Information System 4. station_parameter_id : this field is set to the corresponding station parameter if rule_of is station_parameter otherwise this is set to NULL. 5. parameter_id : this field is set to the corresponding parameter(global parameter) if rule_of is parameter otherwise this is set to NULL. 6. network_id : this field is set to the corresponding network if rule_of is network otherwise this is set to NULL. 7. group_type : this field is set to the corresponding group if rule_of is group otherwise this is set to NULL. 8. rule_type : type of rule (limit_check,step_check,constant_check) 9. start_date : rule execution begin date. 10. end_date : rule expiry date. 11. severity : 0 (ok),1 (error),2 (suspicious) 12. user_group_ids : comma separated user group ids 13. mailing_lis_ids : comma separated mailing_list ids 14. subject : alert subject 15. msg : alert body 16. alert frequency: numeric (minutes after which next alert will be send) 17. rule_on_failure : ‘halt’ or ‘continue’ .(In case rule fails to run) 18. rule_failure_severity : only applicable if rule_on_failure is continue.0,1 or 2. 19. rule_failure_alert : send alter if rule fails to run. 20. month_select:13 character long.Each character position reflects to the month and character can only be 0 and 1, except first character.1st character will always be #. example : #100100000000 2st position character is set to 1 means January 5th position character is set to 1 means April this means rule is application to run only for January and april. If rule_type is `limit_check` 1. 2. 3. 4. 5. parameter1 : upper limit parameter2 : lower limit include_suspicious : NOT SET/NOT REQUIRED data_interval : NOT SET/NOT REQUIRED data_interval_type: NOT SET/NOT REQUIRED If rule_type is `step_check` 1. parameter1 : Allowed increment.Numeric 2. parameter2 : NOT SET/NOT REQUIRED 3. include_suspicious : 1 for ‘yes’,0 for ‘no’ 4. data_interval : Check in (data interval).Numeric. 5. data_interval_type: ‘hour’ or ‘minute’ If rule_type is `constant_check` 1. 2. 3. 4. parameter1 : Min required samples parameter2: tolerance include_suspicious : 1 for ‘yes’,0 for ‘no’ data_interval : Check in (data interval).Numeric. 5. data_interval_type: ‘hour’ or ‘minute’ 50 | P a g e Regional flood Information System Aggregation Rule Aggregation rules can be defined on station basis only and stored in table `wa_aggregation`. Following are the attributes and its use. 1. station_id : this field is set to the corresponding station. 2. input_parameter_id : this field is set to corresponding station parameter. This is the input parameter for the aggregation rule. 3. output_parameter_id : this field is set to corresponding station parameter. This is the parameter for which this aggregation rule will be executed using input parameter. example:Input parameter : Rainfall Output parameter: Daily Rainfall 4. aggregation_type : can be one of the following hourly : delayed calculation daily : delayed calculation weekly : delayed calculation monthly : delayed calculation yearly : delayed calculation 51 | P a g e Regional flood Information System 5. 6. 7. 8. 9. 10. 11. table :Interpolation-Table, real time calculation delayed calculation : aggregation rule will be executed after the specified time real time calculation : aggregation rule will be executed as soon as the input parameter is received. status : 1 enable,0 disable user_group_ids : comma separated user group ids mailing_lis_ids : comma separated mailing_list ids subject : alert subject msg : alert body enable_alert : 1 yes,0 no (need to send alert when aggregation fails to execute) alert frequency: numeric (minutes after which next alert will be send) Fields applicable to delayed calculation only include_null : 1 yes,0 no include_suspicious : 1 yes,0 no value_filter : expression to rule to filter the input parameter values while calculation. example : V>20 AND V<10 V>=1 AND V<=10 (V=9 OR V=7) AND V!=5 V IN (20,45,55) where ‘V’ is the input value. aggregation_function : can be sum,min,max,avg,count. min_samples : minimum no. of required samples of input parameter if 0 is supplied this field is ignored.The aggregation rule will use all the available samples for calculation If aggregation_type is ‘hourly’ time_offset : minute offset to (+)add/(-)subtract to hour example : lets suppose the date is 2013-01-01 00:00:00 +12 is the offset then it will aggregate data from 2013-01-01 00:12 - 2013-01-01 1:11,2013-01-01 1:12 - 2013-01-01 2:12 and so on -12 is the offset then it will aggregate data from 2012-12-31 23:48 - 2013-01-01 00:47,2013-01-01 00:48 - 2013-01-01 1:47 and so on table_value : NOT SET/NOT REQUIRED week_start_day : NOT SET/NOT REQUIRED If aggregation_type is ‘daily’/’monthly’/’yearly’ time_offset :hour: minute offset to (+)add/(-)subtract to hour table_value : NOT SET/NOT REQUIRED week_start_day : NOT SET/NOT REQUIRED If aggregation_type is ‘weekly’ time_offset :hour: minute offset to (+)add/(-)subtract to hour table_value : NOT SET/NOT REQUIRED week_start_day : range from 0-6(Sunday-Saturday If aggregation_type is ‘table’ time_offset NOT SET/NOT REQUIRED table_value : comma separated key value pair (eg.10-20,20-30,30-40) week_start_day : NOT SET/NOT REQUIRED 52 | P a g e Regional flood Information System Data Storage Table `raw_log` Every point of data that needs to be processed should be in this table.This is the only table from where DMS(QC) processes the data. Following are the attributes and its use 1. obs_time : data received time(station timezone not utc). 2. obs_value: observed value 3. device_code : device unique identifier from where the observation is sent.Alphanumeric 4. parameter_code: parameter unique identifier.Alphanumeric.This code recognize the observed value to which parameter its belongs to. 5. pass_qc : set to 1 if it needs to pass through qc, otherwise 0. 6. data_source_id : respective data source (table data_source).This defines the data originated domain. 7. user_id : if the data is inserted by any user set it to respective user id , otherwise NULL. 8. transfer_date : time when the data is transferred to processed log (table wa_observation). 53 | P a g e Regional flood Information System 9. 10. 11. 12. 13. 14. 15. 16. 17. 18. 19. created_date : time at which the data point is stored in the table. interval : applicable only when data send by ‘RTS data logger’.Parameter received interval. read_ptr : applicable only when data send by ‘RTS data logger’ write_ptr: applicable only when data send by ‘RTS data logger’ source_ip : applicable only for data send by ‘RTS data logger’.IP address of the source at the time data is received. not_found : set to 1 if device_code and/or parameter_code mapping is not found,otherwise 0 paused : set to 1 if rule has not enough data to run the rule or rule execution is incomplete ,otherwise 0.In this case all the rules executed till the failure will be inserted in table `raw_log_paused_executed_rule` is_processed : set to 1 if human intervention is applied process data, otherwise 0 retry_count :Number of times QC engine tries to process the data point. processing_start_time : begin time of processing the data point processing_end_time : end time of processing the data point Table `wa_observation` After processing data from `raw_log` data is then inserted into `wa_observation` table and the all the rule executed for the data is inserted into table `wa_observation_rule_executed`.In case, if data already exists for the station parameter for a specified time the system copies the previous data to `wa_observation_audit` and rules to `wa_observation_audit_rule_executed`.Following are the attributes and its use 1. id : auto increment number 2. raw_log_id : associated raw log id from table raw_log 3. obs_time : observation time in UTC. 4. obs_value : observation value 5. severity : data error category.Can be 0(ok,no error),1(error),2(suspicious). 6. data_source_id: respective data source (table data_source).This defines the data originated domain. 7. is_processed:set to 1 if human intervention is applied process data, otherwise 0 8. processing_start_time : begin time of processing the data point 9. processing_end_time : end time of processing the data point (including all rules execution time) 10. user_id : if the data is inserted by any user set it to respective user id , otherwise NULL. 11. transfer_to_audit : if set to 1 (on update previous data point is copied to wa_observation_audit table) 12. log_time : time data inserted into wa_observation. 13. sync: if set to 1 data point is eligible to be synchronized otherwise not. 54 | P a g e Regional flood Information System User Management Each and every user should belong to minimum one user group.User privilege is inherited from user group privilege. Table `user` username : must be valid email address password : must be md5 hash blocked : if set to 1 user is not allowed to access DMS. forget_token : token to reset password forgot_timestamp : time when user request to reset password table ‘user_info’ contains general user details. Table `user_group_privilege` user_group_id : corresponding user group station_id : corresponding station. privilege : can be r(read) and/or c(create) and/or d(delete). This privilege is applied to the station selected. 55 | P a g e Regional flood Information System Alert (Email) All emails generated by the system is stored in this table, these email will be processed by Alert Engine on timely basis. DB Views 1. vw_global_parameter Lists all the parameters which has not been deleted. 2. vw_device_station List all the station devices which has not been deleted 3. vw_mailing_list List all the users on the mailing list 4. vw_observation List processed data points with station name and parameter name 5. vw_raw_log List raw data that has not been processed by QC with station and parameter name 6. vw_station_group List station along with group name. 7. vw_station_network List station along with network name. 8. vw_station_parameter List station parameter. 9. vw_user_group List user along with user group. 56 | P a g e Regional flood Information System Stored Procedures 1. proc_update_latest_data CREATE PROCEDURE `proc_update_latest_data`(IN deviceId INT,IN categoryId INT,IN value DOUBLE,IN valueTime DATETIME) MODIFIES SQL DATA DETERMINISTIC BEGIN DECLARE prevTime DATETIME DEFAULT NULL; DECLARE prevValue DOUBLE DEFAULT NULL; DECLARE cur_latest CURSOR FOR SELECT `time`,`value` FROM `wscada_latest_data` WHERE wscada_device_id=deviceId AND wscada_data_category_id=categoryId; DECLARE CONTINUE HANDLER FOR NOT FOUND SET @no_more_rows = TRUE; OPEN cur_latest; loop_into:LOOP FETCH cur_latest INTO prevTime,prevValue; IF @no_more_rows THEN CLOSE cur_latest; LEAVE loop_into; END IF; END LOOP loop_into; IF (prevTime IS NULL AND value IS NOT NULL) THEN INSERT INTO `wscada_latest_data`(wscada_device_id,wscada_data_category_id,latest_value,latest_time) VALUES(deviceId,category_id,value,valueTime); ELSEIF (prevTime IS NOT NULL) THEN IF (prevTime<valueTime AND value IS NOT NULL) THEN UPDATE `wscada_latest_data` SET `latest_value`=value,`latest_time`=valueTime WHERE `wscada_device_id`=deviceId AND `wscada_data_category_id`=categoryId; END IF; END IF; END 57 | P a g e Regional flood Information System Triggers 1. SN Trigger Event Defined on Table 1 tgr_station_deleted_date AFTER UPDATE station 2 tgr_station_audit_insert AFTER INSERT station_audit 3 tgr_station_parameter_deleted_date AFTER UPDATE station_parameter 4 tgr_station_parameter_audit_insert AFTER INSERT station_parameter_audit 5 tgr_wa_observation_insert AFTER INSERT wa_observation 6 tgr_wa_observation_update AFTER UPDATE wa_observation tgr_station_deleted_date BEGIN IF NEW.deleted_timestamp IS NOT NULL THEN DELETE FROM station_min WHERE station_id=NEW.id; END IF; END 2. tgr_station_audit_insert BEGIN DECLARE sid INT DEFAULT NULL; SELECT station_id FROM `station_min` WHERE station_id=NEW.station_id INTO sid; IF(sid IS NULL) THEN INSERT INTO station_min (station_id,code,visibility,name,project_id,station_audit_id) VALUES (NEW.station_id,NEW.code,NEW.visibility,NEW.name,NEW.project_id,NEW.id); ELSE UPDATE station_min SET code = NEW.code,name=NEW.name,project_id=NEW.project_id,station_audit_id=NEW.id,visibili ty=NEW.visibility WHERE station_id=sid; END IF; END 3. tgr_station_parameter_deleted_date BEGIN IF NEW.deleted_timestamp IS NOT NULL THEN DELETE FROM station_parameter_min WHERE station_parameter_id=NEW.id; END IF; END 58 | P a g e Regional flood Information System 4. tgr_station_parameter_audit_insert BEGIN DECLARE sid INT DEFAULT NULL; DECLARE spid INT DEFAULT NULL; SELECT station_id FROM `station_parameter` WHERE id=NEW.station_parameter_id INTO sid; IF sid IS NOT NULL THEN SELECT station_parameter_id FROM `station_parameter_min` WHERE station_parameter_id=NEW.station_parameter_id INTO spid; IF(spid IS NULL) THEN INSERT INTO station_parameter_min (station_parameter_id,station_id,code,visibility,name,station_parameter_audit_id) VALUES(NEW.station_parameter_id,sid,NEW.code,NEW.visibility,NEW.name,NEW.id ); ELSE UPDATE station_parameter_min SET code = NEW.code,name=NEW.name,station_id=sid,station_parameter_audit_id=NEW.id,visibilit y=NEW.visibility WHERE station_parameter_id=spid; END IF; END IF; END 5. tgr_wa_observation_insert BEGIN DECLARE stationParameterId INT DEFAULT NULL; DECLARE latestObservationTime DATETIME DEFAULT NULL; SET time_zone = "+00:00"; SELECT station_parameter_id,latest_obs_time FROM `wa_latest_observation` WHERE station_parameter_id=NEW.station_parameter_id INTO stationParameterId,latestObservationTime; IF (stationParameterId IS NULL) THEN IF (NEW.severity!=1) THEN INSERT INTO `wa_latest_observation` (wa_last_observation_id,wa_latest_observation_id,station_parameter_id,last_severi ty,last_obs_time,last_obs_value,latest_severity,latest_obs_time,latest_obs_value, last_error_observation_id,last_error_obs_time,last_error_obs_value) VALUES (NEW.id,NEW.id,NEW.station_parameter_id,NEW. severity,NEW.obs_time,NEW.obs_value,NEW.severity,NEW.obs_time,NEW.obs_value,NULL, NULL,NULL); ELSE INSERT INTO `wa_latest_observation` (wa_last_observation_id,wa_latest_observation_id,station_parameter_id,last_severi ty,last_obs_time,last_obs_value,latest_severity,latest_obs_time,latest_obs_value, last_error_observation_id,last_error_obs_time,last_error_obs_value) VALUES (NULL,NULL,NEW.station_parameter_id,NULL,NUL L,NULL,NULL,NULL,NULL,NEW.id,NEW.obs_time,NEW.obs_value); 59 | P a g e Regional flood Information System END IF; ELSE IF NEW.severity!=1 THEN IF (latestObservationTime = NEW.obs_time) THEN UPDATE `wa_latest_observation` SET wa_last_observation_id=NEW.id, last_severity=NEW.severity, last_obs_time = NEW.obs_time, last_obs_value = NEW.obs_value, latest_severity=NEW.severity, latest_obs_value=NEW.obs_value WHERE station_parameter_id=NEW.station_parameter_id; ELSEIF (latestObservationTime < NEW.obs_time) THEN UPDATE `wa_latest_observation` SET last_severity=NEW.severity, wa_last_observation_id=NEW.id, last_obs_time = NEW.obs_time, last_obs_value = NEW.obs_value, latest_severity=NEW.severity, wa_latest_observation_id=NEW.id, latest_obs_time =NEW.obs_time, latest_obs_value=NEW.obs_value WHERE station_parameter_id=NEW.station_parameter_id; ELSE UPDATE `wa_latest_observation` SET wa_last_observation_id=NEW.id, last_severity=NEW.severity, last_obs_time = NEW.obs_time, last_obs_value = NEW.obs_value WHERE station_parameter_id=NEW.station_parameter_id; END IF; ELSE UPDATE `wa_latest_observation` SET last_error_observation_id=NEW.id, last_error_obs_time=NEW.obs_time, last_error_obs_value=NEW.obs_value WHERE station_parameter_id=NEW.station_parameter_id; END IF; END IF; END 6. tgr_wa_observation_update BEGIN DECLARE lastInsertId BIGINT DEFAULT NULL; DECLARE stationParameterId INT DEFAULT NULL; DECLARE latestObservationTime DATETIME DEFAULT NULL; SET time_zone = "+00:00"; SELECT station_parameter_id,latest_obs_time FROM `wa_latest_observation` WHERE station_parameter_id=NEW.station_parameter_id INTO stationParameterId,latestObservationTime; IF (stationParameterId IS NULL) THEN IF (NEW.severity!=1) THEN INSERT INTO `wa_latest_observation` (wa_last_observation_id,wa_latest_observation_id,station_parameter_id,last_severity,last _obs_time,last_obs_value,latest_severity,latest_obs_time,latest_obs_value,last_error_obs ervation_id,last_error_obs_time,last_error_obs_value) VALUES (NEW.id,NEW.id,NEW.station_parameter_id ,NEW.severity,NEW.obs_time,NEW.obs_value,NEW.severity,NEW.obs_time,NEW.obs_value,NULL,NU LL,NULL); ELSE INSERT INTO `wa_latest_observation` (wa_last_observation_id,wa_latest_observation_id,station_parameter_id,last_severity,last 60 | P a g e Regional flood Information System _obs_time,last_obs_value,latest_severity,latest_obs_time,latest_obs_value,last_error_obs ervation_id,last_error_obs_time,last_error_obs_value) VALUES (NULL,NULL,NEW.station_parameter_id,NUL L,NULL,NULL,NULL,NULL,NULL,NEW.id,NEW.obs_time,NEW.obs_value); END IF; ELSE IF NEW.severity!=1 THEN IF (latestObservationTime = NEW.obs_time) THEN UPDATE `wa_latest_observation` SET wa_last_observation_id=NEW.id, last_severity=NEW.severity, last_obs_time = NEW.obs_time, last_obs_value = NEW.obs_value, latest_severity=NEW.severity, latest_obs_value=NEW.obs_value WHERE station_parameter_id=NEW.station_parameter_id; ELSEIF (latestObservationTime < NEW.obs_time) THEN UPDATE `wa_latest_observation` SET last_severity=NEW.severity, wa_last_observation_id=NEW.id, last_obs_time = NEW.obs_time, last_obs_value = NEW.obs_value, latest_severity=NEW.severity, wa_latest_observation_id=NEW.id, latest_obs_time =NEW.obs_time, latest_obs_value=NEW.obs_value WHERE station_parameter_id=NEW.station_parameter_id; ELSE UPDATE `wa_latest_observation` SET wa_last_observation_id=NEW.id, last_severity=NEW.severity, last_obs_time = NEW.obs_time, last_obs_value = NEW.obs_value WHERE station_parameter_id=NEW.station_parameter_id; END IF; ELSE UPDATE `wa_latest_observation` SET last_error_observation_id=NEW.id, last_error_obs_time=NEW.obs_time, last_error_obs_value=NEW.obs_value WHERE station_parameter_id=NEW.station_parameter_id; END IF; END IF; IF NEW.transfer_to_audit=1 THEN INSERT INTO wa_observation_audit (wa_observation_id,raw_log_id,station_parameter_id,obs_time,obs_value,severity,data_sour ce_id,user_id,processing_start_time,processing_end_time,log_time,is_processed) VALUES(OLD.id,OLD.raw_log_id,OLD.station_paramete r_id,OLD.obs_time,OLD.obs_value,OLD.severity,OLD.data_source_id,OLD.user_id,OLD.processi ng_start_time,OLD.processing_end_time,UTC_TIMESTAMP(),OLD.is_processed); SET lastInsertId = LAST_INSERT_ID(); INSERT INTO `wa_observation_audit_rule_executed` (wa_observation_audit_id,wa_rule_id,rule_type,severity,rule_failure,processing_start_tim e,processing_end_time,status) SELECT lastInsertId,wa_rule_id,rule_type,severity,rule_failure,processing_start_time,processing _end_time,status FROM `wa_observation_rule_executed` WHERE wa_observation_id= OLD.id; DELETE FROM `wa_observation_rule_executed` WHERE wa_observation_id= OLD.id; END IF; END 61 | P a g e Regional flood Information System F System Component 62 | P a g e Regional flood Information System SN Component Language Description 1 DMS (frontend) GWT (?) user interface for Data Management System 2 DMS (backend) PHP (?) BULL (rts build php framework) business process (insert,update,delete) operation in DMS 3 QC Engine (Scheduler) PHP (?) run rules on data 4 Aggregation Engine (Scheduler) PHP (?) run aggregation rule on data 5 Alert Engine (Email) (Scheduler) PHP (?) send email alert Flow Chart of DMS DMS is a tool to configure the data management system.It is the place when we configure station its parameter and define rules on these parameters.This tool includes two component the frontend and the backend.The frontend user interface is developed in GWT and the backend interface is developed in PHP.Front end servers user to insert,update and delete the configuration, whereas the backend provides the frontend the data required to present to the user.Backend is also responsible for saving,updating and deleting the configuration as supplied by the user through frontend interface.Apart from the configuration this system can be used to view,upload and manipulate the data received in DMS. 63 | P a g e Regional flood Information System Flow Chart QC Engine 64 | P a g e Regional flood Information System 65 | P a g e Regional flood Information System Flow Chart Aggregation Engine 66 | P a g e Regional flood Information System Alert Engine (Email) 67 | P a g e