1
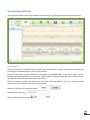
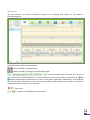
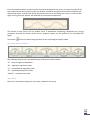
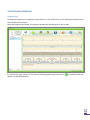
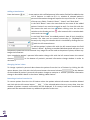
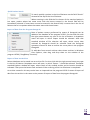
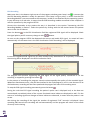
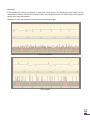
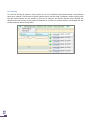
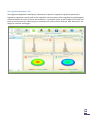
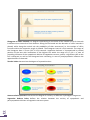
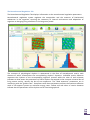
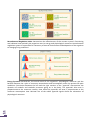
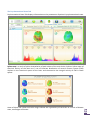
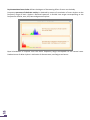
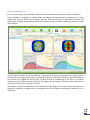
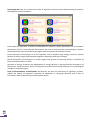
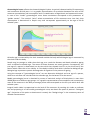
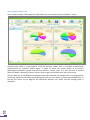
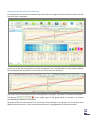
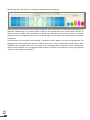
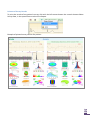
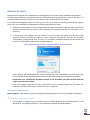
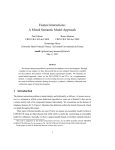
Scientific and Production Company DINAMIKA Portable Diagnostic Facility LOTOS User Guide Saint Petersburg, 2013 www.dyn.ru CONTENTS INTRODUCTION ................................................................................................................................ 3 Purpose ................................................................................................................................................................................... 3 Features .................................................................................................................................................................................. 3 Application .............................................................................................................................................................................. 3 Standards ................................................................................................................................................................................ 4 Support.................................................................................................................................................................................... 4 DELIVERY SET ................................................................................................................................... 5 TECHNICAL DESCRIPTION.................................................................................................................. 6 The ECG Recording Module .................................................................................................................................................... 6 Technical Characteristics ......................................................................................................................................................... 6 Warranty Liabilities ................................................................................................................................................................. 6 PRE-STARTING PROCEDURES ............................................................................................................ 7 Software Installation ............................................................................................................................................................... 7 Preparation of the ECG Recording Module for Use ................................................................................................................ 7 First Program Run ................................................................................................................................................................... 7 Connecting the ECG Recording Module to Patient ................................................................................................................. 8 THE PROGRAM INTERFACE ............................................................................................................... 9 List of Patients ......................................................................................................................................................................... 9 The ECG Tab .......................................................................................................................................................................... 11 The Vegetative Regulation, the Neurohumoral Regulation, the Psychoemotional State, the Fractal Analysis and the Complex Analysis Tabs. ......................................................................................................................................................... 14 THE PROGRAM OPERATION ............................................................................................................ 15 Program Start ........................................................................................................................................................................ 15 Adding a New Patient............................................................................................................................................................ 16 Changing Patient’s Data ........................................................................................................................................................ 16 Removing a Patient from the List .......................................................................................................................................... 16 Quick Patient Search ............................................................................................................................................................. 17 Import of Data from the Program Omega-M ........................................................................................................................ 17 Export of Data into Archive ................................................................................................................................................... 17 ECG Recording ....................................................................................................................................................................... 18 ECG Viewing .......................................................................................................................................................................... 20 The Vegetative Regulation Tab ............................................................................................................................................. 21 The Neurohumoral Regulation Tab ....................................................................................................................................... 23 The Psychoemotional State Tab ............................................................................................................................................ 25 The Fractal Analysis Tab ........................................................................................................................................................ 27 The Complex Analysis Tab ..................................................................................................................................................... 30 The Dynamics of Functional Condition Tab ........................................................................................................................... 31 Printout of Survey Results ..................................................................................................................................................... 33 ASSESSMENT OF TREATMENT EFFICIENCY ....................................................................................... 34 Express Control ..................................................................................................................................................................... 34 Long-Term Observation ........................................................................................................................................................ 34 REMOVAL OF FAULTS ..................................................................................................................... 35 The Program Is Not Starting .................................................................................................................................................. 35 The Program is Failing to Detect the Device ......................................................................................................................... 36 Faults in the List of Patients .................................................................................................................................................. 38 Problems by ECG Signal Recording ....................................................................................................................................... 39 INTRODUCTION The diagnostic facility LOTOS is one of modifications of the Computer Facility for Organism Functional State Assessment Dinamika (TU 9442-001-50904116-2005). Purpose The facility LOTOS is designed to be used for assessment of health state as well as for control of treatment efficiency. The device LOTOS differs from other devices as it is mobile and easy to use. To operate the device no professional medical education is needed. Following the detailed step-by-step user guide allows to obtain survey results in a prompt and convenient way. LOTOS provides for graphic representation of the body response to medicines and medical treatments. Features ECG recording with real-time monitoring of functional state indices. Assessment of the state of cardiovascular and vegetative nervous system by means of variance analysis. Assessment of body’s neurohumoral regulation and energy resources by means of neurodynamic analysis. Assessment of current psychoemotional state using the method of brain biorhythm mapping. Assessment of organism adaptation level and level of harmonization of biological rhythms using the method of fractal analysis. Determination of patient’s biological age. E-catalogue of patients with a feature of data import from Omega-М program. Simultaneous representation of two surveys’ results with a view of comparative analysis. Printout of survey results. Application LOTOS is indispensable in the routine monitoring of health status in case of ambulatory treatment, as well as in patients who take nutritional supplements or undergo organism purification, hunger therapy, manual, reflex- and hirudotherapy. Constant surveillance of health status is also necessary when conducting weight reduction courses. When using home physiotherapeutic devices, LOTOS permits not only to control health status, but also to choose time, duration and periodicity of exposure. Application of the device is effective for permanent health control in professional sportsmen and those who regularly attend fitness gyms and centers. In this case regular surveys permit to make an individual choice of the intensity and duration of physical exercise. It should be added that the device LOTOS can be used by pharmaceutical companies in presentations of medicine effect, as well as effect of nutritional supplements and dietary cure products. Prompt survey of patient health status permits to choose necessary medicines in an effective way while patients have an opportunity of controlling the treatment process. This circumstance has a positive effect on moral and psychological state of an examined person and builds his trust to pharmaceutical company. Standards The technology used by SPC Dinamika has been approved by Ministry of Health of the Russian Federation and is authorized for use for medical purposes. It is covered by patents and copyright certificates of the Russian Federation. The software and the hardware of the diagnostic facilities produced by SPC Dinamika meets the standards of measurement, physiological interpretation and clinical use of cardiac intervalometry indices, adopted by European Society of Cardiology and North American Association for Electrophysiology. Production facilities of SPC Dinamika meet the quality standards ISO 9001:2008. Support SPC Dinamika provides to its customers a full set of guidance materials and instructions as well as an ongoing consultancy support. With the purpose of the user support SPC Dinamika has created a customized web portal offering the users of the products an opportunity of setting up a personal virtual office, as well as of receiving additional consultations and getting access to the new products of the company. The system developers will appreciate any feedback comments and requests regarding the software and the technical guides. In view of constant upgrade of the facility, some differences between the present guide and the later software versions are possible. DELIVERY SET 1. LOTOS Software. 2. ECG Recording Module. Model LOTOS – 1 item. 3. Cardiography Electrodes Skintact F 9024 AC – 2 items. 4. Interface cable USB v2.0 – 1 item. 5. Medical wallet – 1 item. TECHNICAL DESCRIPTION The ECG Recording Module The recording module is fed from the computer through the optically coupled USB-interface. Note: In some notebook models power line disturbances occur when recording ECG at main-fed operation. To eliminate the disturbances it is recommended to deenergize the altering-current adapter for the period of recording and to use battery supply. In case power line disturbances occur in the stationary computer, it is recommended to use grounding. In some notebooks power line disturbances can be caused by printer connected through USB interface. To eliminate disturbances it is recommended to disconnect printer from computer for the period of recording ECG. Technical Characteristics Input voltage range .................................................................................................................. 0,03–5 mV Input impedance, not less than ...................................................................................................... 5 МОm Inner noise level at the input, no more than…………………………….................................................... 10 mkV Common-mode rejection ratio at frequency of 50 Hz, not less than ………………............................. 110 dB Direct current in circuit of the patient, not more than.................................................. 0,1 microamperes Bandwidth............................................................................................................................... 0,03–500 Hz Time constant ..................................................................................................................................... 3,2 s Input signal sampling frequency…………………................................................................................. 1000 Hz Quantization register length............................................................................……….……….….…………..….. 12 The device’s electrical safety meets State Standard (GOST) Р 50267.0 and State Standard 50267.25 (IEC 601) for products of II protection class, BF type. Warranty Liabilities The guaranteed service life of the system is five years from the sale date. The guarantee services are provided in the technical center of the company in Russia, Saint Petersburg. In case faults are detected during this guarantee period, the Company ensures a free replacement of individual components, as well as of the whole facility. During the whole operation life period users can update the software free of cost at the company’s website www.dyn.ru. PRE-STARTING PROCEDURES Software Installation 1. Switch on the computer. 2. Insert the software compact disk in the CD-ROM of your computer. 3. Open the panel My Computer, double click with the left mouse button the icon of CD-ROM in which LOTOS software CD has been inserted. 4. In the opened window containing the list of folders located on LOTOS Software CD open the folder LOTOS by double clicking the left mouse button and by double clicking start the file “LOTOS.Multilang.<release_date>.exe”. LOTOS Software Installation Wizard will start. 5. To install LOTOS software with default settings click Next in the successively opened Installation Wizard windows, then in the Installation Wizard window Ready to Install click Install. 6. After the LOTOS software installation is completed, press on Finish to exit the Installation Wizard. Preparation of the ECG Recording Module for Use Connect the electrodes to the lead cable and fix plugs securely with screws. Connect the interface cable to the computer through a free USB port. Connect the interface cable to the distant module. First Program Run Upon the first program startup and connecting the device to the computer the operating system can display a warning that Windows Firewall has blocked some network features of the program “dnahost.exe”. It is necessary to allow the program “dnahost.exe” to establish network connections both in private and in public networks. For that select the checkboxes “Private networks” and “Public networks”, then click Allow Access. By doing so no user data are transferred to the network. The program “dnahost.exe” is a part of the device driver and transmits ECG signal to the program LOTOS strictly within the computer through the virtual local network. In case some other firewall is installed on the user’s computer, it is necessary to customize it so that it does not block the network features of “dnahost.exe”. How to do it is described in the firewall operating instruction. Connecting the ECG Recording Module to Patient The electrode pads are placed on the inside of the patient’s wrists. The electrode with the red plug is placed on the right arm, the one with the green plug is placed on the left arm. It is recommended to moisten the skin at the points of contact with water. During survey the patient should be at rest, in a sitting or lying position. In some cases, if the R wave amplitude is too low, the red electrode is placed on the right wrist and the green one on the left ankle richly moistened with water. To reduce the disturbances while recording ECG the following rules should be observed: The patient’s arms should be motionless and relaxed. If the patient is in sitting position, his hands should be on his knees, if the patient is in lying position, his arms should rest at his sides. No other people should move around within the radius of 1,5-2 meters of the patient. In the course of recording the patient’s state should be as relaxed and comfortable as possible. It is not recommended to distract the patient by talks or to show him the computer display with the ECG being recorded. You can suggest the patient to close his eyes. THE PROGRAM INTERFACE The program window is nominally divided into two fields: List of Patients and Patient Survey Results. List of Patients The List of Patients is located on the left-hand side of the window. Its upper field serves to display and to change the selected patient’s personal information. Personal information can be displayed in minimized or expanded mode, in the latter case it can be changed. Switching between the two modes is performed by clicking with the left mouse button on the bar situated below the patient personal information. The List of Patients contains the information on all the examined patients. The List of Patients control elements are also located on this side of the window: Buttons of selection of List display mode: Patient quick search box: Patient add and delete button: . . . Survey Results Panel displaying survey Results of currently selected patient is situated on the right-hand side of the window. This panel is basically a set of several tabs. Buttons at the top of the panel are used to switch between them. In total there are seven tabs: – the Registration and Viewing of ECG Data tab contains the control elements for record and display of the patient’s electrocardiogram. – the Vegetative Regulation tab displays the assessment of the organism Vegetative regulation by methods of heart rhythm variance analysis. – the Neurohumoral Regulation tab serves to display the hormonal regulation assessment by means of neurodynamic analysis. – the Psychoemotional State tab displays the psychoemotional state assessment by means of brain biorhythm mapping. – the Fractal Analysis tab displays the assessment of the body’s adaptation level and is used to determine biological age by means of fractal analysis. – in the Complex Analysis tab complex analysis of the organism functional state is displayed. – Dynamics of Functional Condition tab displays the dynamics of the change of functional state indices with the course of time. At the top right-hand corner of LOTOS window the program logo button is located which serves to visualize the information on the program, as well as the button information. used to visualize the reference In the bottom right-hand corner of the program window information about the connected device is displayed. In parentheses the number of surveys performed with the use of the device is indicated. The lamp color indicates the operational readiness of the device: grey – the device is not detected; red – a device from other hardware and software system not destined for operation of LOTOS facility has been connected; green – the device is ready for operation. Buttons / switch on and switch off the program audio signals. The ECG Tab The tab contains the control elements designed for recording and display of the patient’s electrocardiogram. Brief description of the control elements: / – ECG recording start/stop button. / – button of polarity change of recorded ECG signal. – control element used to display the results of one of previously conducted patient’s surveys. Selection of the survey results is performed by and buttons permitting to choose earlier or later survey date respectively. Additionally, by clicking the date with the left mouse button, menu of survey selection is opened where the results of a previously conducted patient’s survey can be selected. – heart rate. – number of recorded heart contractions. ECG As a function of the selected operation mode the program displays either an ECG signal registered previously in the course of the survey, or the ECG signal recorded immediately at the moment. The time in minutes and seconds elapsed from the registration start is laid off along the horizontal axis while the ECG amplitude is laid off along the vertical axis. The graph scaling is performed by moving the mouse with the right button pressed. Dragging the graph is performed by moving the mouse with the left button pressed. Rhythmogram Depending on selected operation mode the program displays either a previously registered rhythmogram, or the one being registered at the moment. Rhythmogram is a graph where the number of RR intervals is plotted on the horizontal axis while the interval size in seconds is plotted on the vertical axis. RR interval is a time interval between two heart beats. The artifacts – extra systoles and disturbances – are highlighted at the rhythmogram in red. The graph scaling is performed by the right mouse button while the graph dragging is performed by the left mouse button. The button Recording. serves to visualize the Graph of the Dynamics of Functional Condition During the Dynamics of Functional Condition During the Recording The Graph of the Dynamics of Functional Condition during the Recording demonstrates how the functional state indices varied in the course of the survey. It enables to estimate the reliability of the survey results. If the functional condition remains on the same level throughout the survey, it means that the survey was conducted correctly and its results are reliable. If however the graph of functional condition has abrupt level drops, it means that either the patient was not at rest during the survey, or that the ECG signal arriving from the patient was affected by extraneous disturbances. The Results of such survey are not reliable and it is worthwhile conducting a duplicate trial, having previously removed the factors which have a negative impact on the quality of the recorded ECG signal. The button serves to switch the graph back to the rhythmogram display mode. Functional status Indicators The indicators display the normalized values of functional status indices: “А” – level of organism adaptation “В” – vegetative regulation index “С” – neurohumoral regulation index “D” – psychoemotional state index “Health” – complex state index Notes Field Permits to save and to change the text notes related to the survey. The Vegetative Regulation, the Neurohumoral Regulation, the Psychoemotional State, the Fractal Analysis and the Complex Analysis Tabs. These tabs display a detailed information on the patient’s functional state. They are organized in accordance with the same principle and differ only by information displayed. Each tab is nominally divided into two hemisections – the left and the right one. In each tab’s hemisection parameters related to one of previously conducted surveys are displayed. By using the controls at the top of the tab, survey date can be selected. Thus the dynamics of functional status change can be assessed in a quick, easy and demonstrable way. In each tab two functional parameters are displayed: In the Fractal Analysis tab – fractal portrait of biorhythms and gerontological curve. In the Vegetative Regulation tab – histogram of RR intervals and autocorrelation portrait. In the Neurohumoral Regulation tab – neurodynamic matrix and energy pyramid. In the Psychoemotional State tab – spline-map of electrical activity of the brain and spectrum of brain activity. In the Complex Analysis tab – functional status indices and complex state index. By pressing the button in the window of a respective parameter, each functional parameter’s descriptive statement can be visualized. THE PROGRAM OPERATION Program Start To start the program point with the mouse pointer to the LOTOS icon on the desktop and double-click with the left mouse button. Once the program has loaded, the program window will be displayed on the screen: In the bottom right corner of the primary window green lamp must be on device is ready for operation. , it indicates that the Adding a New Patient Press the button . A new patient with unfilled personal information field will be added to the List of Patients. In order to fill it in, window of selected patient’s personal information change will open at the top of the list. It consists of three entry fields: “Patient’s Photo”, “Name” and “Birth Date”. In the field “Name” enter the name and the last name of the added patient. Patient’s sex must be entered as well. For that click with the left mouse the male sex icon When clicking once the sex icon switches to the female sex icon to the male sex icon . , after iterated click it switches back In the field “Birth Date” the added patient’s date of birth should be entered. The date can be entered numerically (in “DD/ММ/YYYY” format) or by using the calendar which is visualized by clicking the icon with the left mouse button. To add the patient’s photo click with the left mouse button the field “Patient’s Photo”. By doing so standard Windows panel will open so as the patient’s photo file can be selected. Any image file can be used as the patient’s photo, without any image size limitations. Upon completing patient’s personal information change click with the left mouse button the control element minimize it. at the bottom of patient’s personal information change window in order to Changing Patient’s Data To change a patient’s personal data choose the patient from the List of Patients by clicking the left mouse button, then click with the left mouse button the control element at the bottom of the window of patient’s personal information change to maximize it. Patient’s personal information change is described in detail in the clause “Adding a New Patient”. Removing a Patient from the List To remove patient from the List of Patients select the patient whose information should be deleted and click with the left mouse button . If the selected patient has any survey data, then the window of patient removal confirmation will be displayed. If no surveys have been conducted, the patient will be removed without any additional questions to the user. Quick Patient Search To search quickly a patient in the List of Patients use the field “Search” situated at the top of the List of Patients. When entering in this field the first letters of the searched patient’s last name, patient whose last name starts with the letters entered in the Search field will be immediately selected. If some letter cannot be entered in the Search field, it means that in the List of Patients there is no patient whose last name starts with these letters. Import of Data from the Program Omega-M Data of patient surveys performed by means of Omega-M can be added to the database of the program LOTOS. For that end click with the right mouse button any spot in the List of Patients. A dropdown menu will open in which Import should be selected. After that standard window of file selection will open, where survey data archived by Omega-M should be selected. Read the Omega-M operation manual on how to archive the survey data in the program Omega-M. To add data from several archives select these archives in Windows Files Explorer, then drag and drop them on the window of the program LOTOS (“Drag&Drop” function). Export of Data into Archive Patient database can be saved into an archive file. For that click with the right mouse button any spot in the List of Patients. Dropdown menu will open, in which “Export…” should be selected. Thereafter standard Explorer window will open, where name of the created archive and its location should be indicated. Then press the button Save and wait till the archiving of the List of Patients is completed. An archive created in this way can be later on imported into the program LOTOS. Process of import of data from the archive is the same as the process of import of data from the program Omega-M. ECG Recording Make sure that in the bottom right corner of the program window green lamp is on . It means that the ECG Recording Module is ready for operation. If the lamp is of gray color, it means that the ECG Recording Module is not connected to the computer, invalid or not detected by the operating system. In case the lamp is of red color, it means that the ECG Recording module connected to the computer is unfit for operation by the program LOTOS. Connect the electrodes to the patient the way it is described in the section “Connecting the ECG Recording Module to Patient”. Select the patient by clicking with the left mouse button the patient name in the List of Patients. Press the button . In the ECG Visualization Field the registered ECG signal will be displayed. Check the signal polarity and if necessary change it with / button. As soon as the program LOTOS has detected the correct and stable ECG signal, its record will start automatically. At the same time in the ECG Visualization Field “Recording” will be displayed. In case the registered ECG signal has for some reasons many disturbances or its polarity is confused, the warning will be displayed in the ECG Visualization Field: The program will continue registering the ECG signal till the signal quality normalizes or till the recording is stopped by pressing the button . In the process of recording the program controls uninterruptedly the quality of the recorded signal. Whenever disturbances occur, they will be visualized in the rhythmogram in red. In case there are a lot of disturbances, recording will be interrupted and the program will start ECG recording anew. To stop the ECG signal recording prematurely press the button . During the real time ECG signal recording the patient’s pulse rate is displayed and, as the data are accumulated, normalized values of the current functional status indices are displayed as well. If in the course of recording significant changes of these indices are observed, it means that the patient is not at rest. Also during the recording of the signal the number of registered “R-R” intervals is displayed. Upon recording 300 intervals the recording will end automatically and the program will switch to the mode of survey result viewing. Attention! If the patient has ciliary arrhythmia or expressed extra systole, the functional state indices will be calculated incorrectly. The functional state indices may be determined in all modes only in case patient has no heart rate disturbance! Examples of such disturbances are shown at the following images: Ciliary arrhythmia Extra systole ECG Viewing To view the Results of patient’s survey select in the List of Patients the patient whose survey Results have to be viewed. The function of quick patient search can be used if necessary. When clicking with the left mouse button on any patient in the List of Patients, the Survey Results Panel displays the Results of the last survey of the patient distributed in six tabs. To choose another survey date use the control element Select Survey Date. The Vegetative Regulation Tab The Vegetative Regulation Tab displays information on patient’s vegetative regulation parameters. Vegetative regulation is performed by the vegetative nervous system which regulates the physiological processes below the level of human consciousness. It promptly reacts to the changes of internal and external environment by influencing the cardiovascular system whose effective work determines the supply of nutrients and oxygen. Histogram of «R-R» intervals is a diagram representing a correlation of the number of «R-R» intervals in different time intervals of their duration. Along the horizontal axis the duration of «R-R» intervals is plotted, while along the vertical axis the probability of their occurrence (i.e. the number of «R-R» intervals within the respective range) is plotted. The histogram interval is 0,04 seconds. The range of the histogram base is from 0,32 to 1,64 seconds. Vegetative balance is characterized by central position of the bars with localization of the highest bar within the range of 0,7–1,0 s. In case of prevailing influence of the sympathetic division of vegetative nervous system, a significant shift to the left is observed, as well as the histogram base narrowing. In case of parasympathetic influence the opposite effect is observed. Tension index characterizes the degree of myocard tension. Autocorrelation portrait characterizes the degree of similarity of different rhythmogram fragments. Vegetative balance index defines the relation between the activity of sympathetic and parasympathetic divisions of vegetative nervous system. The Neurohumoral Regulation Tab The Neurohumoral Regulation Tab displays information on the neurohumoral regulation parameters. Neurohumoral regulation system regulates the composition and the structure of biochemical substances in the organism, ensuring the constancy of internal environment and adaptation of organism to changing living conditions in the long-term period. The structure of physiological rhythms is represented in the form of neurodynamic matrix, each element of which characterizes the corresponding rhythms’ dynamics. Individual matrix elements represent the rhythms of the corresponding organism systems while the color of each element indicates to what extent the parameters of these rhythms correspond to the common universal law of living nature activity, namely the law of two exponents. The “ideal exponent” parameters are in conformity with the “golden ratio”. Compliance with these parameters ensures the maximum effective work of life-support systems at minimum energy costs. Yellow and red colors of matrix elements indicate that the parameters of the rhythm are far from being optimal. Neurohumoral Regulation Index characterizes the effectiveness of the nervous system’s functioning and indicates how optimally the organism uses its energy and physiological resources. Neurohumoral regulation system is responsible for constancy of internal environment and adaptation of the organism to changing living conditions. Energy Pyramid characterizes the overall total of the organism’s physiological resources and the balance between the cycles of resources accumulation and consumption under the present life pace conditions. Correlation between the left and the right sections of the “pyramid” characterizes the dynamics of anabolic and catabolic processes going on in the body. The pyramid’s blue area is proportionate to the resources recovery time while the pyramid’s red area is proportionate to the resources consumption time. Minimal size of the whole pyramid signals about the exhaustion of physiological resources. The Psychoemotional State Tab Psychoemotional State Tab displays information on the parameters of patient’s psychoemotional state. Spline-map is a result of spline-interpolation of peak values of the main brain rhythms. Spline maps of electrical activity of the brain are a set of bivariate distribution of central nervous system (CNS) rhythms in the functional spaces of the brain and characterize the integral activity of CNS in these spaces. Areas of black and yellow-red color range indicate the hypoactivity of the brain as a result of disease state, overfatigue and stress. Psychoemotional state index defines the degree of devastating effect of stress on the body. Frequency spectrum of the brain activity is obtained by means of translation of heart rhythms to the frequency range of brain rhythms. Obtained spectrum is divided into ranges corresponding to the frequencies of delta, teta, alfa, beta and gamma rhythms. Equal distribution of rhythms over the entire frequency range corresponds to the normal state. Predominance of delta rhythm is indicative of disease state, overfatigue and stress. The Fractal Analysis Tab In the Fractal Analysis Tab information about the fractal analysis of the patient’s status is displayed. Fractal analysis is designed to visually assess the degree of harmonization of biorhythms in body organs and systems which have a fractal structure with the purpose of detecting functional and pathological changes and assessing organism’s immune status, as well as predicting patient’s health state changes. Fractal analysis enables to reveal similarity of regularities in dynamic parameters of rhythms which characterize physiological processes in the human organism. During the analysis of electrocardiogram the rhythms are singled out which have a fractal structure, manifesting in the form of universal reactions to external and internal influences. The degree of concordance of these rhythms determines the quality of life activity at a given moment. The capacity to maintain and preserve this harmony during a long period of time reflects the quality of organism’s capacities of adaptation to changing external and internal environment conditions or its “immunity”. Fractal portrait index is an information index of organism’s immune status demonstrating its capacity of adaptation to new conditions. Fractal portrait represents a solution of Mandelbrot’s equation, whose parameters are the dynamic parameters of ECG. Fractal portrait characterizes the level of harmonization of physiological rhythms and demonstrates how concordantly the organs and the systems of the body function. Fractal harmony of biorhythms at all the regulation levels indicates large energy resources, optimal balance of energy supply and favorable prognosis regarding health state changes. Partial disharmony of biorhythms in certain organs and systems of the body allows is indicative of functional abnormalities in them. Decrease of energy resources and degradation of energy balance is characterized by disturbance of biorhythms’ fractal harmony, which corresponds to serious functional disturbances or to pathological changes in individual organs. Level of harmonization of biorhythms characterizes the level of consistency of regulatory systems, reflects the quality of organism’s capacities of adaptation to changing conditions and is also an information index characterizing immune system status. Gerontological curve reflects the slowest biological rhythm. Its period is determined by life expectancy and constitutes 90-110 years. It is a graphic representation of correlation between the rates of life resources accumulation and consumption and is a combination of logarithmic and exponential curves. In case of the “model” gerontological curve these correlations correspond to the parameters of “golden section”. The nominal “point” where accumulation of life resources turns into their slow consumption is determined in empiric way and corresponds approximately to the age of 30-33 calendar years. Calendar age is measured by the clock situated outside the body while biological age is measured by the clock inside the body. People may be younger or older than their age; as a result the diseases and death related to ageing occur at different calendar age. The causes of these diseases are mostly genetic. Consequently, the true age of a person is determined not by time which has elapsed since his or her birth but by the factors which reflect his or her viability. It is the body’s viability level which is defined as biological age. Biological age represents systemic disintegration of organism in the process of ageing. Using the concept of “gerontological curve” we can determine biological and true age of a person, which as a rule does not coincide with the calendar age, for the better or for the worse. Model gerontological curve is obtained by means of statistical analysis of biorhythms in more than 10000 patients of different age groups. It is a graphic representation of accumulation and consumption rates of life resources in the body of average person and corresponds to the life cycle which lasts 100 calendar years. Integral health index is proportional to the level of life resources. By marking this index on ordinate axis and projecting it on the model gerontological curve, we obtain the point of patient’s “biological age”. Projection of this point on abscissa axis is exactly the “biological age” in the customary sense of calendar measurement. The Complex Analysis Tab The Complex Analysis Tab displays the information on the complex analysis of patient’s status. Complex State Index is a quintessence of all the previous indices and is a symbolic mathematical representation of “patient’s health status”. It helps to assess the overall quality of the body’s physiological processes and the level of their balance. “Health level” is in fact the level of tension which the body’s regulatory systems need in order to get into harmony with life environment. The thin blue disc in the Diagram of Complex State Index indicates the standard for an average patient of this age, while the practically measured health index can rank above or below the standard level. In the top left corner of the diagram the difference between the actual and the average value is displayed. The Dynamics of Functional Condition Tab In the Dynamics of Functional Condition Tab the process of change of functional status indices with the course of time is displayed. At the top of the tab two elements of date management are situated which may be used to indicate the analyzed period. By default no more than ten last surveys are analyzed. The results of all the analyzed surveys are displayed in the graph “Dynamics of Functional Condition”. The buttons at the upper right of the graph allow to conceal or to display corresponding parameter at the graph. By means of the left mouse button one of surveys can be selected on the graph so as to visualize more detailed information on it. The currently selected survey is highlighted with yellow vertical bar. Below the graph information on currently selected survey is displayed. Date and time of the survey, heart rhythm during the survey and values of functional state indices are displayed. Additionally, on the base of the results of the considered survey analysis daily forecast of patient’s state is made. The accurateness of prediction depends directly on the number of surveys analyzed. Surveys conducted more than one month ago are not taken into consideration in forecast calculation. At the bottom of the Dynamics tab calendar is located on which dates of surveys are highlighted. The highlight color characterizes the patient’s state on that day. In case on some day several surveys were conducted, the highlight color will correspond to the averaged value of patient’s state. Clicking with the left mouse button on the highlighted date permits to choose the respective survey at the graph “Dynamics of Functional Condition”. Printout of Survey Results To print the results of any patient’s survey click with the left mouse button the control element Select Survey Date, in the opened menu select Print Report. Example of printed survey results of a patient: ASSESSMENT OF TREATMENT EFFICIENCY Assessment of Treatment Efficiency can be performed by means of express control as well as by means of long-term observation. Express Control The express control method is applied in such treatments where the effect of treatment exposure can be immediately perceivable. First initial indices are measured in patient, then the patient is exposed to therapeutic intervention of any kind (fast-acting medication intake, physiotherapy, reflex therapy, etc.) and immediately after the therapy exposure repeated measurement of indices is performed. Repeated survey results are compared to the initial survey. If the functional state has improved, it means that the therapeutic intervention has had a positive effect. Therapeutic effect might start the organism’s recovery process, in this case deterioration of indices takes place as the body needs forces to combat the disease. If after the therapeutic treatment the indices have deteriorated, it is recommended to wait for some time (15-30 minutes) and then conduct measurement for the third time. Long-Term Observation Long-term observation is applied with a view of regular control of functional status of the patient under treatment. Before starting the course it is necessary to gauge the initial indices as well, and then periodical surveys are to be conducted. To obtain objective data it is desirable, that all the surveys be conducted at the same time and at regular intervals. REMOVAL OF FAULTS Despite the fact that all the components of the diagnostic facility have been repeatedly checked for intactness and reliability, occasionally faults can arise while operating the facility. If this is the case, it is recommended to search the solution of a problem in this section of the User Guide. If you have not managed to repair the fault on your own, then before contacting the technical support service it is recommended to undertake the following preparatory steps: Switch on the computer on which the problem has been detected. Install the diagnostic facility software and connect the device to this computer. Connecting electrodes to the patient is not required. In most cases the problem can be solved in a much faster and easier way by permitting technical support specialist to connect to your computer through the internet. The program TeamViewer is designed for that. To use it, it is necessary to download and start the client-end portion of TeamViewer software by the following link: http://download.teamviewer.com/download/TeamViewerQS.exe Upon starting the downloaded file “TeamViewerQS.exe” the TeamViewer’s window with your ID and Password will be displayed on the screen. Be ready to tell them to support specialist. Important: once TeamViewer has been started, it can be ended only after the talk with the support specialist has ended. Once the support specialist has been connected to your computer, please do not touch the keyboard and the mouse unless the talk has been completed. The Program Is Not Starting Fault symptom: when trying to start the program nothing happens or the error message is displayed. Check the Operating System Version The program is designed to be operated only by OS MS Windows Vista, MS Windows 7 и MS Windows 8. The highest efficiency is ensured when operated by MS Windows 7. Reinstall the Program The program files might be damaged by some other program. The easiest way to rectify this fault is to reinstall the program. By doing so no patient data will be affected. It is recommended to download the latest version of the software from the manufacturer’s website. This can be done from one’s personal account at the website of the company “Dinamika” (www.dyn.ru). To get a personal account, registration at the company’s website is needed. Check Your Antivirus Software It is possible that the diagnostic facility software has been blocked for some reason by the antivirus software installed on your computer. This might be caused by a virus attack on your computer, which resulted in diagnostic facility software infection by virus and its subsequent blocking by antivirus. It is recommended to thoroughly check the computer for viruses and then reinstall the diagnostic facility software. It is strongly recommended that the latest version of the software be downloaded again from the website of the company “Dinamika”. The Program is Failing to Detect the Device Fault Symptom: the program has been started and the device connected to the computer but the ECG recording cannot be started and in the bottom right corner of the program the message “Device is not Connected” is displayed: Check the Connection of the Device to your Computer: USB-cable connecting the device to the computer must not be longer than 2 meters. The use of longer cables as well as of different extenders might impede the correct functioning of the device. USB-cable connecting the device to the computer must be of “USB 2.0” standard. The cable armor normally bears the corresponding identification marks. Cables of “USB 1.0”, USB 1.1” are not fit for the device. Check the operating capacity of the computer’s USB port by connecting to it some knownfunctioning USB-device, for example, USB-storage device (so called flash drive). If the computer has several USB-ports, try to connect the device to different USB-ports. Check the Device: The device and the interface cables must not have any visible damages. In case the USB-cable has been damaged, you can replace it on your own with any equivalent one. If USB-cable the device or the electrodes’ cables have been damaged, you have to contact the technical support service. On the device connected to the computer, red light-emitting diode must be on, while the blue light-emitting diode must be off (it only shortly twinkles the moment the device is connected to the computer). If both light-emitting diodes are on, it is indicative of the device’s internal error. In this case you should contact the support service. Check the sticker on the back of the device. At the bottom of the sticker the serial number of the device is indicated. The first two figures of this number must be “71” or “72”, for example “DIN721234”. If this is not the case, then it is possible that you are using the device incompatible with this diagnostic facility. Use only the device which was in one set with this diagnostic facility. Check the Driver of the Device: Make sure that the device has been correctly detected by your computer’s operating system. For that open the Windows OS Control Panel and start the Device Manager (it is situated in the applet Sounds and Audio Devices): Open USB Controllers group in the Device Manager and make sure that the device “USB Serial Converter” is included in the list. Click with the right mouse button on “USB Serial Converter” and in the appeared menu select “Properties”. The device property window will open. Make sure in the Device Status field “This device is working properly” is indicated, then switch to the tab “Driver” and make sure that the version of the installed driver is “2.8.14.0”. If something from the listed above does not correspond to the actual situation, it is recommended to reinstall the driver of the device. For that open the menu Start of ОS Windows, select All Programmes, then the folder “Dinamika/Lotos/Install Device Driver”. Before installing the driver, make sure that the device is connected to your computer. Faults in the List of Patients Fault Symptoms: The List of Patients does not contain any names, some patients cannot be deleted, the entered names and birth dates of patients are not saved. Run the Program As Administrator Such fault arises because the program is not entitled by the operating system to access the List of Patients on PC disk. To work properly with the List of Patients it is necessary to run the program as administrator. For that find the program icon on the desktop, click it with the right mouse button and in the appeared menu select Run as Administrator. You might need the administrator password; you can get it from the person who installed the operating system on your computer. Problems by ECG Signal Recording Fault Symptom: The device has been detected by the program but when pressing the button nothing happens. Check your Firewall Settings It is possible that your computer’s firewall has blocked the signal pickup from the device. To undo the block, read the section “Pre-starting Procedures” of this guide. Fault Symptoms: The signal is picked up but the recording does not start. Make Sure that the Electrodes are Connected Correctly The electrodes must be put on the patient’s arms the way it is described in the section “Prestarting Procedures” of this Guide. Check the Integrity of the Electrodes’ Cables Long and inaccurate use of the cables connecting electrodes to the device can cause their rupture. However, visually this damage is not noticeable, as only the copper wire is damaged, not its plastic armor. To check the integrity of the cables it is necessary to start the ECG signal registration by the program and then join the two plugs of the device so that their metallic parts are in tight contact with each other. By doing so the registered ECG signal must take the shape of straight line till the electrodes are joined. If this has not happened and the signal is still chaotic, it is indicative of the cable internal rupture. If this is the case, you need to contact the support service. Check the Signal Polarity It is possible that the signal polarity is disturbed as the electrodes for the right and the left hand have been confused. This can be easily recognized by the shape of the registered ECG signal: Correct Signal To rectify this, it is enough to press the polarity change button position of the electrodes on the patient’s hands. Polarity is disturbed in the program or to interchange the