1
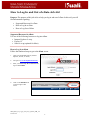
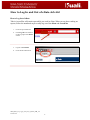
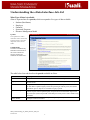
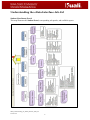
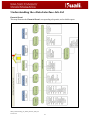
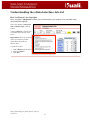
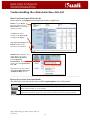
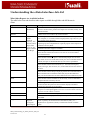
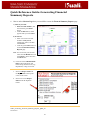
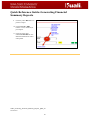
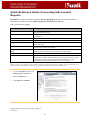
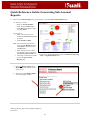
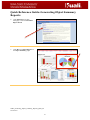
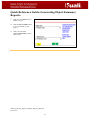
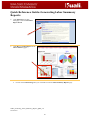
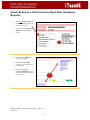
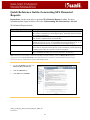
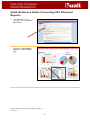
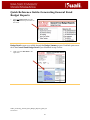
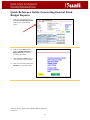
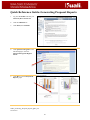
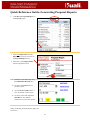
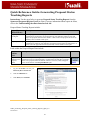
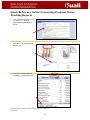
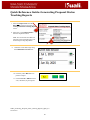
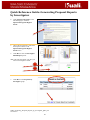
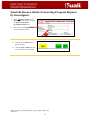
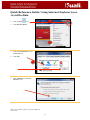
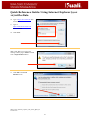
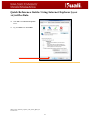
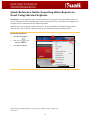
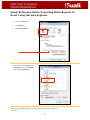
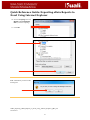
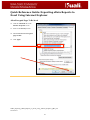
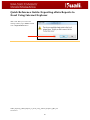
eData User Manual
REV 13/12/20 eData Reporting User’s Guide
Table of Contents
eData Basics
What's Changed with eData Job Aid .................................................................................. 1
Quick Reference Guide: How to Log In and Out of eData................................................. 3
Understanding the eData Interface Job Aid ........................................................................ 6
Using Filters to Generate Reports Job Aid ....................................................................... 15
Financial Reporting
Quick Reference Guide: Generating Financial Summary Reports ................................... 22
Quick Reference Guide: Generating Sub-Account Reports ............................................. 26
Quick Reference Guide: Generating Labor Summary Reports ........................................ 30
Quick Reference Guide: Generating Object Summary Reports ....................................... 34
Quick Reference Guide: Generating SPA Financial Reports ........................................... 38
Quick Reference Guide: Generating SPA Object Reports ............................................... 42
Quick Reference Guide: Generating General Fund Budget Reports ................................ 45
Sponsored Programs Reporting
Quick Reference Guide: Generating Proposal Reports .................................................... 51
Quick Reference Guide: Generating Proposal Status Tracking Reports .......................... 54
Quick Reference Guide: Generating Proposal Reports by Investigator ........................... 57
Quick Reference Guide: Generating Award Reports........................................................ 60
Quick Reference Guide: Generating Award Reports by Investigator .............................. 63
Troubleshooting
Configuring Your Browser to Open Tabs in eData .......................................................... 67
Using Internet Explorer with eData .................................................................................. 70
Exporting eData Reports to Excel Using Internet Explorer.............................................. 74
eData Basics
What’s Changed with eData: WebFM to eData Job Aid
Purpose: The purpose of this job aid is to help you become more familiar with using eData. The
tables below list and describe the reports you view in WebFM and compare them to the reports
you will view in eData. In this job aid, you will review:
•
•
•
Account Totals
Account Details
Sponsored Programs Financial Reports
Account Totals
This table shows the Account Totals menu items in WebFM and their eData equivalent.
WebFM Menu
WebFM Reports
eData Portal Name: eData Reports
WebFM: Account
Totals, Summary
WebFM: Account
Totals, Project Summary
WebFM: Account
Totals, Class
Financial Reporting: Financial Summary Reports,
Financial Summary
Financial Reporting: Sub Account Reports, Sub
Account Summary
Financial Reporting: Financial Summary Reports,
Object Summary by Consolidation, Level and
Object
Financial Reporting: Financial Summary Reports,
Encumbrance Detail
N/A for FY 14; Will be available for FY 15
WebFM: Account
Totals, Encumbrance
WebFM: Account
Totals, Multi-Year
WebFM: Account
Totals, Budget to Actual
Financial Reporting: General Funds Budget Reports
Account Details
This table shows the Account Detail menu items in WebFM and their eData equivalent.
WebFM Menu
WebFM Report
eData Portal Name: eData Report
WebFM: Account
Detail, Transaction
Detail
WebFM: Account
Detail, Dept
Commitments
WebFM: Account
Detail, P.O.
Encumbrances
WebFM: Account
Detail, Payrl
Encumbrances
WebFM: Account
Detail, Travel
Encumbrances
WebFM: Account
Detail, User Notes
Financial Reporting: Financial Summary Reports
Financial Reporting: Financial Summary Reports,
Transaction Detail
Financial Reporting: Financial Summary Reports,
Pre- Encumbrance Detail
eData_How_Your_Job_Will_Change_with_eData_JOB_2.0
Version 2.0
1
Financial Reporting: Financial Summary Reports,
Encumbrance Detail
Financial Reporting: Financial Summary Reports,
Account Overview, Notes
What’s Changed with eData: WebFM to eData Job Aid
Sponsored Programs Financial Reports
This table shows the Sponsored Programs menu items in WebFM and their eData equivalent.
WebFM Menu
WebFM Document
WebFM: Sponsored
Programs, Financial
Report
WebFM: Sponsored
Programs, Account
Totals
WebFM: Sponsored
Programs, Award
Budget Browse
WebFM: Sponsored
Programs, Award
Budgets
WebFM: Sponsored
Programs, Award Listing
WebFM: Sponsored
Programs, Award
Summary
WebFM: Sponsored
Programs, Class Tot by
Bdgt Cd
WebFM: Sponsored
Programs, EASE
Summary
WebFM: Sponsored
Programs, Indirect Cost
Detail
WebFM: Sponsored
Programs, RMM IDC
Distribution
WebFM: Sponsored
Programs, RMM IDC
Summary
eData Report or Attribute
Financial Reporting: SPA Financial Portal, SPA
Financial Report
Financial Reporting: SPA Financial Portal, Account
Totals Since Inception and Account Totals by Month
Financial Reporting: SPA Financial Portal, Budget
Browse link
Financial Reporting: SPA Financial Portal, Account
Listing link
Financial Reporting: SPA Financial Portal, SPA
Financial Report (header info and Account Overview
link)
Financial Reporting: SPA Object Portal, Transactions
Reports To, Level, and Object
No equivalent; this report will remain in WebFM. A
link to this report is available in eData.
Financial Reporting: SPA Financial Portal, SPA
Financial Report (in the report header)
Financial Reporting: SPA Financial Portal, RMM ICR
Distribution Link
Financial Reporting: SPA Object Portal, Select the
Indirect Cost Object
WebFM: Sponsored
Programs, Terms &
Conditions
Financial Reporting: SPA Financial Portal, SPA
Financial Report, Account Overview link
WebFM: Browse,
General
Browse Lists, General Browse
eData_How_Your_Job_Will_Change_with_eData_JOB_2.0
Version 2.0
2
How to Log In and Out of eData Job Aid
Purpose: The purpose of this job aid is to help you log in and out of eData. In this aid, you will
find information regarding:
•
•
•
Supported Browsers for eData
How to Log In to eData
How to Log Out of eData
Supported Browsers for eData
Use one of the following browsers to log into eData.
•
•
•
Internet Explorer 9 or up
Firefox 12
Safari 6 or up (optional for Macs)
How to Log In to eData
Follow the numbered steps to get to the eData screen.
1.
Open a recommended browser (Internet
Explorer, Firefox, or Safari).
2.
Navigate to www.accessplus.iastate.edu
3.
Enter your University ID and Password to
log into AccessPlus.
4.
Click on the uBusiness tab
on the far right of this
screen.
eData_How_To_Log_In_and_Out_of_eData_JOB_2.0
Version 2.0
3
How to Log In and Out of eData Job Aid
5.
Click eData under the Data
Warehouse menu item on the left.
6.
Click Continue.
5
6
6a. If you receive this prompt enter your
ISU Email Address and Password then;
click OK to enter the eData Reporting
Portals screen.
7.
Click the appropriate
Reporting Portal to
begin viewing reports in
eData.
Portals (written in blue)
include:
• Student
• Employee
• Financial
• Sponsored Programs
• Resource
Management Model
eData_How_To_Log_In_and_Out_of_eData_JOB_2.0
Version 2.0
4
How to Log In and Out of eData Job Aid
How to Log Out of eData
Tabs in AccessPlus will remain open while you work in eData. When you are done working on
reports, follow the numbered steps to safely log out of the eData and AccessPlus.
1.
Close all open eData tabs.
2.
Click Log off in the red area
on the top right of the eData
screens.
3.
Logout of AccessPlus.
4.
Close the tab and browser.
eData_How_To_Log_In_and_Out_of_eData_JOB_2.0
Version 2.0
5
Understanding the eData Interface Job Aid
Purpose: This job aid will help you understand the eData interface and generate reports from
University data. In this job aid, you will learn about:
•
•
•
•
•
•
•
Where University Data is Stored
What Type of Data is Available
How eData is Structured
How You Want to View Your Data
What Your Data Results Will Look Like
How to Save or Print Your Data Results
What Other Reports Are Available in eData
Where University Data is Stored
University data is stored in an online central repository called eData. The eData warehouse is
made up of portals and sub-portals containing current and historical data gathered from a variety
of University sources.
eData is accessible through the
uBusiness tab in AccessPlus
under Data Warehouse.
eData is used for business
purposes only and limited to
Iowa State University
employees with AccessPlus
login credentials.
eData_Understanding_the_eData_Interface_JOB_2.0
Version 2.0
6
Understanding the eData Interface Job Aid
What Type of Data is Available
eData is separated into five portals, which correspond to five types of data available:
•
•
•
•
•
Student (Enrollment)
Employee
Financial
Sponsored Programs
Resource Management Model
Updates
The Updates box offers
reminders about month-end,
announcements, and other
important notices about
eData.
Confidentiality
The eData Confidentiality
Statement at the bottom of
the screen outlines the
specific purpose and
conditions for eData users.
The table below lists and describes the portals available in eData:
Portals
Description
Student
This portal contains Official Census Day Student Enrollment reports.
Employee
This portal contains faculty and staff headcount and full time equivalent (FTE) reports
for each month.
This portal contains seven sub-portals that provide financial reports based on KFS and
KC data. Data is updated nightly. Financial reports begin with July 2013 (FY14) data.
Information prior to July 2013 is available in legacy systems.
This portal contains reports of Proposals and Awards in KC as well as a link to SPA
financial reports. Data is updated nightly. Proposal & Award information begins with
July 2010 (FY11) data. Proposal & Award data prior to July 2010 is still available using
InfoMaker.
This portal contains a collection of reports designed specifically to assist RMM
managers and decision makers.
Financial
Sponsored Programs
Resource Management
Model (RMM)
eData_Understanding_the_eData_Interface_JOB_2.0
Version 2.0
7
Understanding the eData Interface Job Aid
How eData is Structured
Behind each portal is a graphical display of sub-portals that further classify the types of data
available:
The sub-portal you select
will be based on the type of
data you would like to view
in a report.
For example, the
Residency sub-portal
within the Student portal
contains university reports
that provide student
residency data.
The maps below illustrate the portals, sub-portals, and reports currently available in eData.
eData_Understanding_the_eData_Interface_JOB_2.0
Version 2.0
8
Understanding the eData Interface Job Aid
Student (Enrollment) Portal
This map illustrates the Student Portal, corresponding sub-portals, and available reports:
eData_Understanding_the_eData_Interface_JOB_2.0
Version 2.0
9
Understanding the eData Interface Job Aid
Financial Portal
This map illustrates the Financial Portal, corresponding sub-portals, and available reports:
eData_Understanding_the_eData_Interface_JOB_2.0
Version 2.0
10
Understanding the eData Interface Job Aid
Sponsored Programs Portal
This map illustrates the Sponsored Programs Portal, corresponding sub-portals and available
reports:
eData_Understanding_the_eData_Interface_JOB_2.0
Version 2.0
11
Understanding the eData Interface Job Aid
How You Want to View Your Data
Once you enter a sub-portal in eData, you can choose how you want to view your data using
report and filter options:
Each screen displays a Sub-portal
Title and Report Type at the top
in bold.
A menu of Reports to choose from
is available on the left side of the
screen.
Report Filters allow you to further
narrow your search to produce
report details that meet your
specific needs.
To generate a report:
1. Click a Report from the menu.
2. Select your Filters.
3. Click Run.
eData_Understanding_the_eData_Interface_JOB_2.0
Version 2.0
12
Understanding the eData Interface Job Aid
What Your Data Results Will Look Like
Data results for your Report can be displayed in table or graph form:
Headers in your Report
provide a summary of the
Report Filters you selected to
generate the report.
The Footer provides a
summary of the data results
available in the Report.
Top, Page up, Page down, and
Bottom navigation links
provide more information.
Drill Downs that appear in your
reports allow you to link to
Other Reports, Resources,
and/or Supporting
Documentation. For best
results, right click Open Link in
New Tab.
Note: Refer to the section below
called What Other Reports Are
Available in eData for a list.
How to Save or Print Your Data Results
The table below lists and describes the available export options in the eData portals:
Visual Cue
Description
Click the Excel button to download the customized report to your desktop. This can be useful to
further arrange, modify, or review the data.
Click the PDF button to download the customized report to your desktop as a PDF. This can be
helpful when communicating specific report results with others without any change in the data.
eData_Understanding_the_eData_Interface_JOB_2.0
Version 2.0
13
Understanding the eData Interface Job Aid
What Other Reports Are Available in eData
The table below lists and describes other reports available through links and drill downs in
eData:
Report
Portal
Description
ISU Fact Book
Student Portal
(Dashboard)
Links to the ISU Fact Book prepared by ISU Institutional Research. This
electronic book contains profiles and comparisons of student, faculty, and
institutional data.
Prepared by the Office of the Registrar, these enrollment reports are
released on the 10th academic day of each semester.
This links goes to the General Browse screen, which offers a drop down
lists of reports (i.e. Accounts, Fund Group, Payments, Org Code, etc.) you
can generate lists by keyword.
The Controller’s Department creates these reports for one or more
requesting org unit or department for a specific purpose. Some reports are
available University Wide.
Links directly to the Controller’s Department website, where contact
information and other support is available.
This link appears when a specific account from the account filter drop
down has been selected. Provides an overview for one account and its
associated attributes.
This link appears when no specific account from the account filter drop
down has been selected. It opens a calendar that prompts users to select
days within or across a month and/or fiscal year. Once a calendar selection
is made, the report is downloaded directly into an Excel spreadsheet.
This link appears when a specific account from the account filter drop
down has been selected. Provides details (i.e. Tran Date, Description,
Object, Doc Type, Sub-Accounts, etc.) of the transactions for the selected
Account.
This link appears when a specific account from the account filter drop
down has been selected. Report displaying details about earmarked funds.
ISU Encumbrances are Purchase Orders (PO), Payroll Encumbrances
(PE), Travel Encumbrances and Telecommunications Encumbrances (TE).
This link appears when a specific account from the account filter drop
down has been selected. Summarizes the manually created commitments
of unpaid amounts created by the user.
This link appears when a specific account with intramural income from
the account filter drop down has been selected. Displays intramural
revenue for University service providers.
A summary of award budgets that the PI has submitted through the OSPA
Budget Form. This option appears below the Transaction Detail link when
a specific account number is selected.
Shows the Indirect Cost Recovery (ICR) distribution in percentage.
Registrar Enrollment
Statistics
Browse Lists
Custom Reports
Help
Account Overview
All Financial
Portals:
Financial
Summary; SubAccount; Labor;
Object; SPA
Financial; SPA
Object; General
Fund Budget
Transaction Download
Transaction Detail
Encumbrance Detail
Pre-Encumbrance
Detail
Intramural Cash Report
Budget Browse
SPA Financial
RMM ICR Distribution
EASE Summary
Support Forms
Sponsored
Programs –
Investigator
Detail Reports
Links to the current Employee Activity Summary of Effort (EASE) report
in WebFM.
Links to completed “Current and Pending” or “Just in Time” support
forms required by the National Science Foundation (NSF), US
Department of Agriculture (USDA), and National Institute of Health
(NIH).
eData_Understanding_the_eData_Interface_JOB_2.0
Version 2.0
14
Using Filters to Generate Reports Job Aid
Purpose: The purpose of this job aid is to help you use filters to generate reports in eData. Some
portals in eData share a set of common filters that allow you to produce reports to fit your
reporting needs. Other filters are unique to specific portals.
Note: Use of the Run button is not required for filters displayed in the report area.
In this job aid, you will learn about:
•
•
•
Student (Enrollment) Portal Filters
Financial Report Portal Filters
Sponsored Programs Register Portal Filters
Student (Enrollment) Portal Filters
The Student Portal contains seven main portals in eData:
•
•
•
•
•
•
•
College, Departments & Majors
Race/Ethnicity and Gender
Residency
Trends
Undergraduate
Graduate
Professional
The first portal, College, Departments & Majors, is divided into three sub-portals that include:
•
•
•
All College Reports
Single College Reports
Departmental Profile Reports
The table below lists and describes filters common to the Student Portal:
Filter
Portal
Description
All Colleges
Colleges, Departments
& Majors; All Colleges
College
All Portals*
Term
All Portals
Appears in the report area. Allows user to choose a view headcounts
by individual college across student levels (Undergraduate, Graduate,
or Professional) or a summarized view across levels.
Appears on the top left side of each screen. Allows user to select all
colleges or a single college from the drop down menu. Includes
Interdisciplinary Studies and Vet Med.
*Note: Single College portal does not include an “All Colleges” filter.
Appears on the top left side of each screen. Allows user to select a
specific term (Fall, Spring, or Summer) with year (i.e. 2013)
eData_Using_Filters_to_Generate_Reports_JOB_2.0
Version 2.0
15
Using Filters to Generate Reports Job Aid
Financial Report Portal Filters
The Financial Report Portal contains seven sub-portals:
Financial Summary Reports
Sub-Account Reports
Object Reports
Labor Reports
SPA Financial Reports
SPA Object Reports
Budget Reports
•
•
•
•
•
•
•
The table below (alphabetically) lists and describes filters common to Financial Report Portals:
Filter
Account
Fund Group
Org Department
Org Unit
Resource Unit
Sub Fund Group
Year, Calendar
Type, Period,
Month
Portal
Description
All
This is the 7-digit account number. Use this filter to generate a report for a
specific Account. The Transaction Detail report is available when a specific
account number is selected.
Used to identify major groups of accounts such as General University Funds.
Use this filter to select and view a Fund Group for a specific Resource Unit,
Org Unit, Org Department, and/or Account.
Previously known as the last three digits of the Org Code. This filter makes it
easier to report by Org Departments that exist in multiple Org Units.
Previously known as the first two digits of the Org Code. Use this filter to
select an Org Unit.
Identifies the budget unit as defined under the Resource Management Model
(RMM). Use this filter to select information by Resource Unit.
Used to further breakdown Fund Group. Used to identify major groups of
accounts such as General University Funds, which are broken down into
General University Other and General University Personnel. Use this filter to
select and view one or more Sub Fund Groups within a specific Fund Group.
Displays the data results for a given year, type (calendar, federal, fiscal), and
period (Monthly Periodic, Quarterly Periodic, Month YTD and Quarter YTD)
or single month.
eData_Using_Filters_to_Generate_Reports_JOB_2.0
Version 2.0
16
Using Filters to Generate Reports Job Aid
The table below lists and describes filters unique to specific Financial Report Portals:
Filter
Portal
Description
Account
Supervisor, Fiscal
Officer, and
Account Manager
Sub-Account
Financial
Summary;
Account
List by Role
Sub-Acct
View a list of accounts by Account Supervisor, Fiscal Officer, or Manager’s
name. These filters are displayed in the results section of the Account List by
Role report.
Consolidation
Object Code
Object and
Labor
Object,
Labor, and
SPA Object
Employee
Labor
Level
Sort by
Job Title
Fiscal Year
Principal
Investigator
Reports to Object
Rev Code
SPA Fin
SPA Object
Sub-Accounts replace section/projects in the legacy system. Use this filter to
view information about a Sub-Account assigned to a specific Account. SubAccount drill downs in the results area link to Transaction Details.
Use this filter to look at revenue and expense data by consolidated groups, i.e.
Tuition and Fees.
Allows users to look at revenue and expense data by Level within
consolidated groups, i.e. Tuition.
Allows users to look at revenue and expense data by Object within the Level
and Consolidation, i.e. Resident Tuition. Available check boxes allow you to
select and view multiple objects at once.
Use this filter to select an employee by name.
Displayed in the results section: Depending on the report selected, sort by
Account, Employee, RU, or Pay Base, and Job Title.
Displayed in the results section: Allows users to view employee job titles.
Use of the Run button is not required for this filter.
Allows users to search for Proposals and Awards by fiscal year.
Account Manager for a sponsored program or a PI Incentive account.
Changes to the PI name on accounts must be requested through OSPA but
processed through Sponsored Programs Accounting (SPA) office, which will
in turn update the Account Manager field. Please note that before OSPA or
SPA can make changes in KC or KFS, sponsors must approve any changes to
the PI on a sponsored program award.
Aggregation of object codes that report to other object codes.
Used in processes and reports to define type of funding.
Sponsored Programs Register Portal Filters
The Sponsored Programs Register Portal contains five main portals, which separate detailed
and summarized Awards and Proposal reports in eData:
•
•
•
•
•
Activity Detail Reports
Sub-Award Detail Reports
Investigator Detail Reports
Activity Summary Reports
Financial Reports (links to SPA Financial Reports portal in eData)
eData_Using_Filters_to_Generate_Reports_JOB_2.0
Version 2.0
17
Using Filters to Generate Reports Job Aid
Three of the five portals are divided into sub-portals:
•
Activity Detail Reports
o Proposal Report
o Proposal Status Tracking Reports
o Proposal Search
o Award Reports
o Award Search
•
Investigator Detail Reports
o Proposal Reports by Investigator
o Award Reports by Investigator
•
Activity Summary Reports
o Proposal Monthly Reports
o Proposal Quarterly Reports
o Award (monthly) Reports
The table below (alphabetically) lists and describes filters common to the Sponsored Programs
Register Portals:
Filter
Portal
Description
Activity Type
Activity Detail;
Investigator Detail;
Activity Summary
Award Status
Activity Detail–Award
Reports
Activity Detail–Award
Reports; Subaward
Allows user to limit search by activity type including: Academic
Support, Institutional Support, Instruction, Operations &
Maintenance, Public Service, Research, Scholarships & Fellowship,
Student Financial Aid, and Student Services. Also displayed in the
results section of Percent of Total reports in Proposal Monthly and
Award (monthly) Reports.
Allows user to limit search by status of award, i.e. Active, Closed,
Executed, Pending, Final, or Purged from KFS.
Allows users to enter a date range to search for Awards or
Subawards using calendar option filters.
(Award)
Register Date
Between
Award Status
Award Type
Category
Graph
Activity Detail–Award
Reports
Activity Detail–Award
Reports; Investigator
Detail–Award Reports by
Investigator
Activity Summary–
Proposal Monthly Reports
and Award (monthly)
Reports
Activity Detail–Proposal
Reports and Award
Reports
eData_Using_Filters_to_Generate_Reports_JOB_2.0
Version 2.0
Allows user to limit search by award status, i.e. Active, Executed,
Pending, Purged from KFS, or Withdrawn/Declined.
Allows user to limit search by award type, i.e. ISU Gift, IPA, Grant,
Other, Cooperative Agreement, or Contract Type.
Displayed in the results section of Summary by Source reports only:
allows users to limit search by federal or non-federal data.
Displayed in the results section of the Graph reports only: allows
users to view graphs by Sponsor Type, Activity Type,
Proposal/Award Status, or Lead Org Unit.
18
Using Filters to Generate Reports Job Aid
Filter
Portal
Description
Investigators
Activity Detail;
Investigator Detail
Investigator Org
Dept
Investigator Org
Unit
Fiscal Year
Activity Detail–Proposal
Status Tracking Reports
Activity Detail–Proposal
Status Tracking Reports
Activity Summary
Allows user to limit search by Investigator (PI or COI) assigned to
the Account. Listed by Last Name, First Name, and Middle Initial
(optional). Also displayed on the Investigator Detail Selection page.
A filter in the results section of the Investigator Detail–Investigator
Contribution report in both Proposals and Awards allows the user to
Show Selected Investigators Only or Show All.
Available under Report by Investigator report: Allows user to limit
search by Org Dept to which investigator is assigned.
Available under Report by Investigator report: allows user to limit
search by Org Unit to which investigator is assigned.
Allows users to search for Proposals and Awards by fiscal year.
Fund Group
Displayed in the results section of Acct Mngmnt Summary report
only: allows users to filter details by Fund Group or by Contracts &
Grants Only.
Allows users to select by Org Dept in charge.
Month
Investigator Detail–
Award Reports by
Investigator
Activity Detail–Proposal
Status Tracking Reports
Activity Detail–Proposal
Status Tracking Reports;
Activity Summary
Activity Summary
Org Unit
Activity Detail
Org Dept
Activity Detail
Percent Spent
Investigator Detail–
Award Reports by
Investigator
Activity Detail–Proposal
Reports
Activity Detail–Proposal
Reports and Proposal
Status Tracking Reports;
Investigator Detail–
Proposal Reports by
Investigator
Activity Detail–Proposal
Reports; Investigator
Detail–Proposal Reports
by Investigator
Activity Summary–
Award (monthly) Reports
Previously known as the first two digits of the Org Code. Use this
filter to select an Org Unit.
Previously known as the last three digits of the Org Code. This filter
makes it easier to report by Org Departments that exist in multiple
Org Units.
Displayed in the results section of Acct Mngmnt Summary report
only: allows users to filter results by percent spent for All Accounts,
those Spent 90 – 99.9 % Spent 100%, or Overspent.
Allows user to limit search by status of proposal, i.e. Funded,
Rejected, Pending, or Withdrawn.
Allows users to enter a date range to search for Proposal details
using calendar option filters. Also available in the Proposal Reports
by Investigator – Investigator Contribution report.
Lead Org Dept
Lead Org Unit
Proposal Status
(Proposal)
Submit Date
Between
Proposal Type
Report Choice
eData_Using_Filters_to_Generate_Reports_JOB_2.0
Version 2.0
Allows users to select by Org Unit in charge.
List months in the fiscal year (July through June).
Allows user to limit search by proposal type, i.e. New,
Continuation, Renewal, and Supplement Proposal Types.
Displayed in the results section of the Percent Change Over 1 Year
and Percent Change Over 4 Years reports only: allows user to sort
by Source or Activity Type.
19
Using Filters to Generate Reports Job Aid
Filter
Portal
Description
Report Type
Activity Detail–Proposal
and Award Reports;
Activity Summary–
Proposal Monthly and
Award (monthly)
Requisitioner
Subaward
Sort by
Activity Detail;
Investigator Detail;
Subaward
Activity Detail–Proposal
Reports and Award
Reports; Subaward;
Investigator Detail–
Proposal Reports by
Investigator and Award
Reports by Investigator
Displayed in the results section of Activity Detail–Sponsor Reports:
users can filter results to View Sponsors (and prime sponsors),
View Flow Through Only, View Flow Through and Sponsor, Non
Federal Sponsors. View Flow Through and Sponsor offers an
Account Number drill down. Available in results section of Awards
Reports–IDC/DC Ratio for reports by Lead Org Unit or Sponsor
Type. Also displayed in the results section of Proposal Monthly and
Award (monthly) Reports offering graph of results by Month or
Fiscal Trend.
Allows users to select from a list of individuals requesting the
award, usually the investigator.
Displayed in the results section in several portals: Used to sort by
Sponsor Type, Activity Type, Status, Investigator Org Unit, and/or
Lead Org Unit
Displayed in the results section of the following reports:
• Proposal Report (sort by Proposal Number or Proposal Amount)
• Award Report (sort by Award Number, Investigator, Sponsor
Number, or Awarded Amount)
• Sponsor Report (sort by Sponsor Name or Sponsor Type)
• All Proposals and Pending Proposals (sort by Proposal Number
or Proposal Amount)
• All Awards (sort by Award Number, Sponsor Number, or
Awarded Amount)
• Current Awards (sort by Award Number or End Date)
• Subaward (sort by Sub Award Number, Award Number, or Sub
Award Amount.
Allows user to limit search by Sponsor Name. Listed by Business
Name.
Sort By
Sponsor Name
Sponsor Type
Sub Recipient
Activity Detail;
Investigator Detail;
Subaward
Activity Detail;
Investigator Detail
Subaward
Allows user to limit search by sponsor type, i.e. commodity, local,
state, and federal government, foreign, Higher Ed, non-profit orgs,
industry, foundation, and more.
Allows users select from a list of recipients of subawards.
For more information about eData portals and reports, refer to the Understanding the eData
Interface Job Aid.
eData_Using_Filters_to_Generate_Reports_JOB_2.0
Version 2.0
20
Financial Reporting
Quick Reference Guide: Generating Financial
Summary Reports
Instructions: Use the steps below to generate Financial Summary Reports in eData. For more
information about reports in eData, refer to the Understanding the eData Interface Job Aid.
Financial Summary Reports include:
Report Type (Radio Buttons)
Description
Financial Summary
View summarized revenue, expense, encumbrance and balance totals.
Object Summary by
Consolidation
Object Summary by Level
View summarized revenue and expense totals broken down by object consolidation.
Object Summary by Object
View summarized revenue and expense totals broken down by object code.
Account List by RU
Account List by Role
View a list of accounts by RU. Report includes balance forward, revenue, expense,
encumbrance, and balance totals.
View a list of accounts by Sub Fund Group. Report includes balance forward,
revenue, expense, encumbrance, and balance totals.
View a list of accounts by Org Department. Report includes balance forward,
revenue, expense, encumbrance, and balance totals.
View a list of accounts by Account Supervisor, Fiscal Officer, or Account Manager.
Labor and Object Consolidation
Summary
View a list of accounts summarized by object consolidation. The personnel object
consolidation is broken down by object level.
Account List by Sub Fund Group
Account List by Department
View summarized revenue and expense totals broken down by object level.
1.
Log into AccessPlus and enter your
University ID and Password.
2.
Click the uBusiness tab
3.
Click eData, then Continue.
eData_Generating_Financial_Summary_Reports_QRG_2.0
Version 2.0
22
Quick Reference Guide: Generating Financial
Summary Reports
4.
Click Financial Reporting on the
blue homepage to enter the Financial
Report Portal.
5.
Click Here for Financial Summary
Reports on the Financial Summary
graph.
eData_Generating_Financial_Summary_Reports_QRG_2.0
Version 2.0
23
Quick Reference Guide: Generating Financial
Summary Reports
6. Choose on the Selection Page how you would like to enter the Financial Summary Reports page.
A) Select by Account
• Enter Account Number, and
then click the green Select
button.
• Click the Run button, which
appears after you click Select.
A
B
B) Or Search
• Enter one or more Account
Numbers or Keywords
separated by spaces, and then
click Search.
• Click the green Select button to
enter the Financial Summary
Reports page.
C
Note: You can choose your selected
items from the Results box and
click Insert to move them into
the Choice box.
C) Click one of the underlined blue
links in the Fund Group, Sub
Fund Group, Resource Unit, Org
Department, or Org Unit boxes.
7.
Select one Report Title from
the Report List in the top left
corner of the screen.
8.
Select one or more Report
Filters from the dropdown
menus.
7
eData_Generating_Financial_Summary_Reports_QRG_2.0
Version 2.0
24
Quick Reference Guide: Generating Financial
Summary Reports
9.
Click the yellow Run button to
produce a report.
10. Click the Excel or PDF
buttons to view, download, or
print reports.
11. Click one of the other
underlined blue links to view
detailed information or link to
other portals.
10
eData_Generating_Financial_Summary_Reports_QRG_2.0
Version 2.0
25
Quick Reference Guide: Generating Sub-Account
Reports
Instructions: Use the steps below to generate Sub-Account Reports in eData. For more information
about reports in eData, refer to the Understanding the eData Interface Job Aid.
Sub-Accounts reports include:
Report Type (Radio Buttons)
Description
Financial Summary
Object Summary by Level
View summarized revenue, expense, encumbrance, and balance totals for
accounts and sub-accounts.
View summarized revenue and expense totals broken down by object
consolidation.
View summarized revenue and expense totals broken down by object level.
Object Summary by Object
View summarized revenue and expense totals broken down by object code.
Object Summary by Account
View summarized revenue and expense totals broken down by object code for
each sub-account.
View monthly activity statement, including balance carried forward at subaccount level, sorted by sub-account.
View monthly activity statement, including balance and uncommitted balance
carried forward at sub-account level, sorted by sub-fund group.
View a list of all sub-accounts associated with a specific account.
Object Summary by Consolidation
Sub Account Summary
Sub Account Summary by Sub Fund
Group
Sub Account List
Miscode Report
Transactions that posted to an account with sub-accounts, that did not have
sub-accounts assigned. These transactions previously posted as the 99-9999
section-project. They now post to the null, which is blank. This report
summarizes these unassigned transactions for a given period.
Note: You can view a summary of all Accounts and Sub-Accounts with activity in eData. Go to the main page, click
Public Folders, Custom Reports, then University Wide, and select All Accounts Summary List.
1.
Log into AccessPlus and enter your
University ID and Password.
2.
Click the uBusiness tab
3.
Click eData, then Continue.
eData_Generating_Sub-Account_Reports_QRG_2.0
Version 2.0
26
Quick Reference Guide: Generating Sub-Account
Reports
4.
Click Financial on the blue
homepage to enter the Financial
Report Portal.
5.
Click Here for Sub Account
Reports on the Financial
Summary graph.
eData_Generating_Sub-Account_Reports_QRG_2.0
Version 2.0
27
Quick Reference Guide: Generating Sub-Account
Reports
6.
Choose on the Selection Page how you would like to enter the Sub Accounts Reports page:
A) Select by Account
• Enter an Account Number.
• Click the green Select button.
• Click Run, which appears after
you click Select.
A
B
B) Or Search
• Enter one or more Account
Numbers or Keywords separated
by spaces.
• Click Search then Run.
Note: You can choose your selected
items from the Results box and
click Insert to move them into
the Choice box.
• If the account has one or more
sub-accounts, they will appear in
the Select by Sub Account box.
• Select one or more Sub Accounts
to enter the Sub Account
Reports page.
7.
Select one Report Title from the
Report List in the top left corner
of the screen.
8.
Select one or more Report Filters
from the dropdown menus.
C
C) Click one of the underlined blue links in the Resource Unit, Org
Unit, or Org Department boxes.
7
eData_Generating_Sub-Account_Reports_QRG_2.0
Version 2.0
28
Quick Reference Guide: Generating Sub-Account
Reports
9.
Click the yellow Run button to
produce a report.
10. Click the Excel or PDF buttons to
view, download, or print reports.
11. Click one of the other underlined
blue links to view detailed
information or link to other portals.
10
eData_Generating_Sub-Account_Reports_QRG_2.0
Version 2.0
29
Quick Reference Guide: Generating Object Summary
Reports
Instructions: Use the steps below to generate Object Summary Reports in eData. For more
information about reports in eData, refer to the Understanding the eData Interface Job Aid.
Object Summary Reports include:
Report Type (Radio Buttons)
Description
Amount by Object
View account lists based on criteria selected; summarized by
Revenue/Expense Type, Consolidation, Level, and Object Code.
View account lists based on criteria selected; summarized by
Revenue/Expense Type, Consolidation, and Level.
View account lists based on criteria selected; summarized by
Revenue/Expense Type, and Consolidation.
View account lists based on criteria selected; summarized by Resource
Unit, Sub Fund Group, and Object.
View account lists based on criteria selected; summarized by Org
Department and Object.
Amount by Level
Amount by Consolidation
Amount by RU, Sub Fund Group and
Object
Amount by Department and Object
1.
Log into AccessPlus and enter
your University ID and
Password.
2.
Click the uBusiness tab
3.
Click eData, then Continue.
eData_Generating_Object_Summary_Reports_QRG_2.0
Version 2.0
30
Quick Reference Guide: Generating Object Summary
Reports
4.
Click Financial on the blue
homepage to enter the Financial
Report Portal.
5.
Click Here for Object Reports on
the Object Summary graph.
eData_Generating_Object_Summary_Reports_QRG_2.0
Version 2.0
31
Quick Reference Guide: Generating Object Summary
Reports
6.
Click one of the underlined blue
links on the Selection Page to enter
the Object Summary Reports page.
Note: Select by Object allows
multiple selections.
7.
Select one Report Title from the
Report List in the top left corner of the
screen.
8.
Select one or more Report Filters from
the dropdown menus.
7
eData_Generating_Object_Summary_Reports_QRG_2.0
Version 2.0
32
Quick Reference Guide: Generating Object Summary
Reports
9.
Click the yellow Run button to
produce a report.
10. Click the Excel or PDF buttons
to view, download, or print
reports.
11. Click one of the other
underlined blue links to link to
other portals.
eData_Generating_Object_Summary_Reports_QRG_2.0
Version 2.0
33
Quick Reference Guide: Generating Labor Summary
Reports
Instructions: Use the steps below to generate Labor Summary Reports in eData. For more
information about reports in eData, refer to the Understanding the eData Interface Job Aid.
Labor Summary Reports include:
Report Type (Radio Buttons)
Description
Labor Ledger
View summarized salary, wages, benefits, and encumbrances by employee
name, account, Resource Unit, or Pay Base.
View summarized labor expenses by account and pay base as well as by
object code.
View summarized labor by object and pay base within fund groups.
Labor Object Summary
Labor Object Summary by Fund
Group
Labor Budget Summary
Job Title Summary
Overtime Summary
View summarized labor expenses by account with budget displayed.
View employees by job title and pay base with monthly, YTD encumbrances
and original encumbrance.
View monthly or YTD overtime pay, by employee or account.
1.
Log into AccessPlus and enter your
University ID and Password.
2.
Click the uBusiness tab
3.
Click eData, then Continue.
eData_Generating_Labor_Summary_Reports_QRG_2.0
Version 2.0
34
Quick Reference Guide: Generating Labor Summary
Reports
4.
Click Financial on the blue
homepage to enter the Financial
Report Portal.
5.
Click Here for Labor Reports on the
Labor Summary graph.
6.
Choose on the Selection Page how you would like to enter the Labor Summary Reports page.
eData_Generating_Labor_Summary_Reports_QRG_2.0
Version 2.0
35
Quick Reference Guide: Generating Labor Summary
Reports
A) Click Account Search or Employee
Search tab.
• Enter an Account Number or
Employee Name or University ID.
• Click green Select then Run button,
which appears after you click Select.
A
B
B) Or Search
• Enter one or more Keywords (or
characters) separated by spaces, and
then click Search.
• Click the green Select button to enter
the Labor Summary Reports page.
C
Note: Choose your selected items from the
Results box and click Insert to move
them into the Choice box.
C) Click one of the underlined blue links
in the Fund Group, Sub Fund Group,
Resource Unit, Org Department, or Org
Unit boxes.
eData_Generating_Labor_Summary_Reports_QRG_2.0
Version 2.0
36
Quick Reference Guide: Generating Labor Summary
Reports
7.
Select one Report Title from
the Report List in the top left
corner of the screen.
8.
Select one or more Report
Filters from the dropdown
menus.
7
9.
Click the yellow Run button
to produce a report.
10. Click the Excel or PDF
buttons to view, download, or
print reports.
11. Click one of the other
underlined blue links to view
detailed information or link to
other portals.
10
eData_Generating_Labor_Summary_Reports_QRG_2.0
Version 2.0
37
Quick Reference Guide: Generating SPA Financial
Reports
Instructions: Use the steps below to generate SPA Financial Reports in eData. For more
information about reports in eData, refer to the Understanding the eData Interface Job Aid.
SPA Financial Reports include:
Report Type (Radio Buttons)
Description
SPA Financial Report
View reports with information about Sponsored Programs accounts, inception to
date expenses, and balances in each budget category. Especially useful if an award
has re-budget requirements.
Shows inception to date expenses in each budget category as well as cumulative
total revenue or expenses based on selected dates.
Shows monthly totals in each budget category as well as monthly total expenses or
monthly total revenue. A zero ‘0’ in the field means total transactions net to ‘0’. A
blank field means that there are no transactions for that budget category.
Represents the “bottom line” of the report. Shows the totals from inception to
current date for expenses and receipts, the current cash balance, and the percentage
of funding spent. Offers an overview of accounts at-a-glance.
Available when more than one account is selected. Shows the accounts that you
have consolidated and allows you to sort the accounts in several ways.
Account Totals Since Inception
Account Totals by Month
Cash Recap
Account Listing
Note: When an account number is selected in the SPA Financial Summary portal, the Budget Browse option
appears below the Transaction Detail link. Budget Browse is a summary of award budgets that the Principal
Investigator (PI) has submitted through the OSPA Budget Form.
1.
Log into AccessPlus and enter your
University ID and Password.
2.
Click the uBusiness tab
3.
Click eData, then Continue.
eData_Generating_SPA_Financial_Reports_QRG_2.0
Version 2.0
38
Quick Reference Guide: Generating SPA Financial
Reports
4.
Click Financial on the blue
homepage to enter the Financial
Report Portal.
5.
Click Here for SPA Financial
Reports on the SPA Summary
graph.
eData_Generating_SPA_Financial_Reports_QRG_2.0
Version 2.0
39
Quick Reference Guide: Generating SPA Financial
Reports
6.
Choose on the Selection Page how you would like to enter the Sponsored Programs Financial Reports page.
A) Select by Account
• Enter Account Number, and
then click the green Select
button.
• Click the Run button, which
appears after you click Select.
A
B
B) Or Search
• Enter one or more Account
Numbers or Keywords
separated by spaces, and then
click Search.
• Click the green Select button
to enter the Sponsored
Programs Financial Reports
screen.
Note: You can choose your selected
items from the Results box
and click Insert to move them
into the Choice box.
7.
Select one Report Title from the
Report List in the top left corner of
the screen.
8.
Select one or more Report Filters
from the dropdown menus.
C
C) Click one of the underlined blue links in the Select by
Investigator, Resource Unit, Org Unit, Org Department, Sub Fund
Group, or Control Account boxes.
7
eData_Generating_SPA_Financial_Reports_QRG_2.0
Version 2.0
40
Quick Reference Guide: Generating SPA Financial
Reports
9.
Click the yellow Run button to
produce a report.
10. Click the Excel or PDF buttons to
view, download, or print reports.
11. Click one of the other underlined
Blue Links to view detailed
information or link to other portals.
10
eData_Generating_SPA_Financial_Reports_QRG_2.0
Version 2.0
41
Quick Reference Guide: Generating SPA Object
Reports
Instructions: Use the steps below to generate SPA Object Reports in eData. For more
information about reports in eData, refer to the Understanding the eData Interface Job Aid.
SPA Object Reports include:
Report Type (Radio Buttons)
Description
Trans by Reports To, Level and
Object
Trans by Unit, Dept and Object
Shows transactions by object codes that report to other object codes, then
by level and object. Account numbers link to more details on the account.
Shows transactions by name of resource unit, department, and object.
Account numbers link to more details on account.
1.
Log into AccessPlus and enter your
University ID and Password.
2.
Click the uBusiness tab
3.
Click eData, then Continue.
4.
Click Financial on the blue
homepage to enter the Financial
Report Portal.
eData_Generating_SPA_Object_Reports_QRG_2.0
Version 2.0
42
Quick Reference Guide: Generating SPA Object
Reports
5.
Click Here for SPA Object Reports
on the SPA Summary graph.
6.
Click one of the underlined blue
links in the boxes (Select by Org Unit,
Org Department, Level, Report To
Object, or Object) on the Selection
Page to enter the SPA Object
Reports page.
eData_Generating_SPA_Object_Reports_QRG_2.0
Version 2.0
43
Quick Reference Guide: Generating SPA Object
Reports
7.
Select one Report Title from the
Report List in the top left corner of
the screen.
8.
Select one or more Report Filters
from the dropdown menus.
6
7
9.
Click the yellow Run button to
produce a report.
10. Click the Excel or PDF buttons to
view, download, or print reports.
11. Click one of the other underlined
blue links to view detailed
information or link to other portals.
9
eData_Generating_SPA_Object_Reports_QRG_2.0
Version 2.0
44
Quick Reference Guide: Generating General Fund
Budget Reports
Instructions: Use the steps below to generate General Fund Budget Reports and Budget
Detail Reports in eData. For more information about reports in eData, refer to the
Understanding the eData Interface Job Aid.
General Fund Budget Reports include:
Report Type (Radio Buttons)
Description
Budget Summary
Summarizes Budgeted and Actual revenue and expenses for one or more
Resource Units (RUs). This report also includes any Variance, Encumbrance,
and totals for Variance with Encumbrance.
Summarizes budgeted and actual revenue and expenses for one or more
Resource Units. It also shows the Budgeted and actual expense for each Org
Department within the RU(s) selected. This report also includes any Variance,
Encumbrance and totals for Variance with Encumbrance.
View Current Cash Balance, Encumbrances (Payroll, PO, Telecom, and
Travel), and Current Free Balance by Org Department and Sub Fund Group.
This report is displayed in two tables. The top table summarizes revenue and
percentage of Indirect Cost Recovery (ICR) for one or more RUs. This is the
revenue received in the RRC Control account (711-XX-XX ). The bottom
table displays the ICR by Org Department and object code.
This report shows the total Admin Overhead income received in the RRC
Control account (711-XX-XX) for each RU. It further breaks down income
based on the department the generated the income.
View summarized Tuition Budget, Revenue and Variance by term (Summer,
Fall and Spring). The table sorts Undergraduate, Graduate and Professional
student levels and breaks down Differential, Enrollment and Student Credit
Hours tuition.
Departmental Summary
Encumbrance Tracking
ICR Tracking
Admin Fee Tracking
Tuition Tracking
General Fund Budget Detail Reports offer revenue and expense details and include:
Report Type (Radio Buttons)
Description
All
Receipts
All budgeted and actual revenue (Receipts, RMM revenue, Other Transfers-In)
and expenses (Expenditures, Allocated Expenses, Other Transfers-Out). This
report also shows variance for revenue and expenses, encumbrance and
variance with encumbrance. Report shows Object Level and Object Code
detail.
View budget and actual receipts by Object Level and Object Code.
RMM Revenue
View budgeted and actual RMM Revenue by Object Level and Object Code.
Opening Entries
View Opening Entries by Object Level and Object Code.
Other Transfers-In
View Other Transfers-In by Object Level and Object Code.
Expenditures
View budgeted, actual and encumbered expenditures by Object Level and
Object Code.
View budgeted and actual allocated expenses by Object Level and Object
Code.
View Other Transfers-Out by Object Level and Object Code.
Allocated Expenses
Other Transfers-Out
eData_Generating_General_Fund_Budget_Reports_QRG_2.0
Version 2.0
45
Quick Reference Guide: Generating General Fund
Budget Reports
1.
Log into AccessPlus and enter your
University ID and Password.
2.
Click the uBusiness tab
3.
Click eData, then Continue.
4.
Click Financial on the blue
homepage to enter the Financial
Reporting Portal.
eData_Generating_General_Fund_Budget_Reports_QRG_2.0
Version 2.0
46
Quick Reference Guide: Generating General Fund
Budget Reports
Click Here for Budget Reports
under the Budget Summary
graph.
5.
Choose one or more Resource Units
on the Selection Page.
6.
Click Select then Run.
5
Note: The yellow Run button will appear
once you click the green Select
button.
6
eData_Generating_General_Fund_Budget_Reports_QRG_2.0
Version 2.0
47
Quick Reference Guide: Generating General Fund
Budget Reports
7.
Select one Report Title from the
Report List in the top left corner of
the screen.
Budget Detail reports are available through the Budget Summary report. Each link opens a new
tab to the General Fund Budget Detail report illustrated in step 9 below.
8.
Click one of the blue links in the
report area.
eData_Generating_General_Fund_Budget_Reports_QRG_2.0
Version 2.0
48
Quick Reference Guide: Generating General Fund
Budget Reports
9.
Click one of the radio buttons on
the General Fund Budget Detail
report to show other detailed
reports.
10. Click the yellow Run button to
produce a Budget Summary or
Budget Detail report from the
selected radio buttons.
11. Click the Excel or PDF buttons to
view, download, or print reports.
12. Click one of the other underlined
blue links to enter other portals.
eData_Generating_General_Fund_Budget_Reports_QRG_2.0
Version 2.0
49
Sponsored Programs Reporting
Quick Reference Guide: Generating Proposal Reports
Instructions: Use the steps below to generate Proposal Reports from the Sponsored Programs
Register Portal in eData. For more information about reports in eData, refer to Understanding
the eData Interface Job Aid.
Proposal Reports include:
Report Type
(Radio Buttons)
Description
Proposal Report
This report generates a list of proposals based on the filter selection and provides
aggregate information such as proposal amounts, counts, and proposed indirect and
direct cost. Shows Principal Investigators only.
This reports sorts information by Investigator Org Unit and Investigator Org Dept. The
filters labeled Org Unit and Org Dept will filter the Investigator Org Unit and
Investigator Org Dept fields (as opposed to the other reports where those filters are
applied to Lead Org Unit and Lead Org Dept fields).
Investigator Org Unit
Note: Since an investigator can list a department and a center on page 2 of the
GoldSheet, it is possible for the proposal to be listed twice on this list.
This report displays the list of proposals based on filters selected and by lead org unit
and department listed on the Goldsheet. The report includes PIs and COIs.
This report sorts proposals by primary sponsor and lists PIs only. Also allows you to
view information by “Report Type” where you can “View Flow Through Only” or
“View Flow Through and Sponsor”.
This report allows you to view proposals by pie chart and table with corresponding
amounts based on the total counts to be generated. Also allows you to view graph by
Sponsor Type, Activity Type, Proposal Status and Lead Org Unit. An export to Excel
will export the pie chart and the table but not the Total line. After exporting the data,
you can create a Total line in Excel using the SUM function.
Lead Org Unit
Sponsor Report
Graphs by Count
Graphs by Dollars
This report allows you to view proposals by pie chart and table with corresponding
amounts based on the total dollars to be generated. Also allows you to view graph by
Sponsor Type, Activity Type, Proposal Status and Lead Org Unit.
Links within the Proposal Report Data include:
Proposal
Number
Link
Description
Visual Cue
Proposal
Number link to
Proposal
Detail
This link takes you to the Proposal Detail screen displaying summary
information such as recommitted totals, requested start and end dates, proposed
direct costs, proposal status and awards. If there is an award, a link will appear
in the Award section of the Proposal Detail report.
eData_Generating_Proposal_Reports_QRG_2.0
Version 2.0
51
Quick Reference Guide: Generating Proposal Reports
1.
Log into AccessPlus and enter your
University ID and Password.
2.
Click the uBusiness tab
3.
Click eData, then Continue.
4.
Click Sponsored Programs on the
blue homepage to enter the
Sponsored Programs Register
Portal.
5.
Click Here on the Activity Detail
Reports graph.
eData_Generating_Proposal_Reports_QRG_2.0
Version 2.0
52
Quick Reference Guide: Generating Proposal Reports
6.
Click Here for Proposal Reports on
the Proposals graph.
7. Select one Report Title from the
Report List in the top left corner of
the Proposal Report screen.
8. Select one or more Report Filters
from the dropdown menus.
7
9.
Select the correct date range using
the Submit Date Between filter.
10. Click the yellow Run button to
produce a report.
11. Click the Excel or PDF buttons to
view, download, or print reports.
12. Click one of the other underlined
blue links to view detailed
information or link to other portals.
eData_Generating_Proposal_Reports_QRG_2.0
Version 2.0
53
Quick Reference Guide: Generating Proposal Status
Tracking Reports
Instructions: Use the steps below to generate Proposal Status Tracking Reports from the
Sponsored Programs Register Portal in eData. For more information about reports in eData,
refer to the Understanding the eData Interface Job Aid.
Proposal Status Tracking Reports include:
Report Type
(Radio Buttons)
Description
Report by
Investigator
This report generates a list of proposals based on the filter selection and provides
information by Investigator, the Investigator Org Unit and Dept, Lead Org Unit and
Dept, and proposal status and other details. A direct link to the proposal and award (if
funded) is also available in this report.
This report generates a list of proposals based on the filter selection, provides
information by Lead Org Unit and Dept, and offers proposal status and other details. A
direct link to the proposal and award (if funded) is also available in this report.
Report by Lead Org
Links within the Proposal Report Data include:
Proposal
Number
Link
Description
Proposal
Number link to
Proposal
Detail
This link takes you to the Proposal Detail screen displaying summary
information such as recommitted totals, requested start and end dates, proposed
direct costs, proposal status and awards. If there is an award, a link will appear
in the Award section of the Proposal Detail report.
1.
Log into AccessPlus and enter your
University ID and Password.
2.
Click the uBusiness tab
3.
Click eData, then Continue.
Visual Cue
eData_Generating_Proposal_Status_Tracking_Reports_QRG_2.0
Version 2.0
54
Quick Reference Guide: Generating Proposal Status
Tracking Reports
4.
Click Sponsored Programs on the
blue homepage to enter the
Sponsored Programs Register
Portal.
5.
Click Here on the Activity Detail
Reports graph.
6.
Click Here for Proposal Status
Tracking on the Proposals graph.
eData_Generating_Proposal_Status_Tracking_Reports_QRG_2.0
Version 2.0
55
Quick Reference Guide: Generating Proposal Status
Tracking Reports
7. Select one Report Title from the
Report List in the top left corner of
the Proposal Status Tracking Report
screen.
7
8. Select one or more Report Filters
from the dropdown menus.
Note: You can choose more than one
selection in the Investigator Org Unit
and Investigator Org Dept filters.
9.
8
Select the correct date range using
the Submit Date between filter.
10. Click the yellow Run button to
produce a report.
11. Click the Excel or PDF buttons to
view, download, or print reports.
eData_Generating_Proposal_Status_Tracking_Reports_QRG_2.0
Version 2.0
56
Quick Reference Guide: Generating Proposal Reports
by Investigator
Instructions: Use the steps below to generate Proposal Reports by Investigator from the
Sponsored Programs Register Portal in eData. For more information about reports in eData,
refer to the Understanding the eData Interface Job Aid.
Proposal Reports by Investigator include:
Report Type (Radio Buttons)
Description
All Proposals
This report generates a list of proposals based on the filter selection and
provides aggregate information such as proposal amounts, counts, and
indirect and direct costs. It also shows proposal title, number, status, start
and end dates, and Investigator’s name and role.
This report allows you to view proposals by those pending approval and by
proposal (also called GoldSheet number). The “Sort By” drop down filter
allows user to look up proposal numbers or amounts. Also offers sponsor
information, proposed direct and indirect cost, and proposed start and end
dates.
Pending Proposals
Investigator Contribution
Summary By Fiscal Year
Note: Only the PI is listed on this report.
This report shows all investigators on the proposal and their intended
contributions and percentage amounts for the proposal.
This report shows a summary of indirect, direct, and total proposal amounts
by fiscal year. The role of the investigator is also included in this report.
Proposal
Number Link
Description
Proposal
Number link to
Proposal Detail
This link takes you to the Proposal Detail screen displaying summary
information such as recommitted totals, requested start and end dates,
proposed direct costs, proposal status and awards. If there is an award, a link
will appear in the Award section of the Proposal Detail report.
1.
Log into AccessPlus and enter your
University ID and Password.
2.
Click the uBusiness tab
3.
Click eData, then Continue.
Visual Cue
eData_Generating_Proposal_Reports_by_Investigator_QRG_2.0
Version 2.0
57
Quick Reference Guide: Generating Proposal Reports
by Investigator
4.
Click Sponsored Programs on the
blue homepage to enter the
Sponsored Programs Register
Portal.
5.
Choose the Investigator’s name from
the drop down menu on the
Sponsored Programs Register
Portal screen.
6.
Click Here to enter the Investigator
Detail Reports portal.
Note: This link will appear only after you
select an Investigator’s name.
5
6
7.
Click Here on the Proposals by
Investigator graph.
eData_Generating_Proposal_Reports_by_Investigator_QRG_2.0
Version 2.0
58
Quick Reference Guide: Generating Proposal Reports
by Investigator
8. Select one Report Title from the
Report List in the top left corner of
the Sponsored Programs
Investigator Detail screen.
9. Select one or more Report Filters
from the dropdown menus.
8
10. Click the yellow Run button to
produce a report.
11. Click the Excel or PDF buttons to
view, download, or print reports.
eData_Generating_Proposal_Reports_by_Investigator_QRG_2.0
Version 2.0
59
Quick Reference Guide: Generating Award Reports
Instructions: Use the steps below to generate Award Reports from the Sponsored Programs
Register Portal in eData. For more information about reports in eData, refer to the
Understanding the eData Interface Job Aid.
Award Reports include:
Report Type
(Radio Buttons)
Description
Award Report
This report generates a list of awards based on the filter selection and provides aggregate
information such as total cost, counts, and indirect and direct cost. Shows activity by Award
Register Date and Principal Investigators only. Also provides Award Count, Award Total,
Total Direct Cost, and Total Indirect Cost summary information. Monies may come in at
different times during the life of an award.
This report provides award count summary information by investigator org unit. Since an
investigator can list a department and a center on page 2 of the GoldSheet, it is possible for
an award to show up twice on this list.
This report displays the list of awards by the lead org unit listed on the Goldsheet, including
the PI and COI. Also provides Award Amounts, Direct Cost and Indirect Cost information
per award, and award numbers that link to details.
This report allows you to view sponsor by name and type. To distinguish awards from subawards, the Report Type drop down in the report area allows you to “View Flow Through
Only” or “View Flow Through and Sponsors” to report information about the Prime Sponsor
(primary source of funds) and Sponsor (secondary source of funds).
This report provides a simplified (non-modified) ratio in a summary format of indirect cost,
direct costs, and award amounts. Also allows you to view awards by “Report Type”.
This report allows you to view awards by pie chart and table with corresponding amounts
based on the total counts generated. Sort by Sponsor Type, Award Count, and Award
Amount.
This report allows you to view awards by pie chart and table with corresponding amounts
based on the total counts generated by Sponsor Type, Award Count, and Award Amount.
Investigator Org
Unit
Lead Org Unit
Sponsor Report
IDC/DC Ratio
Graphs by Count
Graphs by Dollars
Links within the Proposal Report Data include:
Award Number Link
Description
Award Number link to Award
Detail
This link takes you to the Award Detail screen displaying summary
information such as start dates, direct costs, etc. If the award is connected to a
proposal, links to the Proposal Detail report are also available on this detail
screen. Additionally, if an associated account(s) is listed, an account link will
also be available.
eData_Generating_Award_Reports_QRG_2.0
Version 2.0
60
Quick Reference Guide: Generating Award Reports
1.
Log into AccessPlus and enter your
University ID and Password.
2.
Click the uBusiness tab
3.
Click eData, then Continue.
4.
Click Sponsored Programs on the
blue homepage to enter the
Sponsored Programs Register
Portal.
5.
Click Here on the Activity Detail
Reports graph.
eData_Generating_Award_Reports_QRG_2.0
Version 2.0
61
Quick Reference Guide: Generating Award Reports
6.
Click Here for Award Reports on
the Awards graph.
7.
Select one Report Title from the
Report List in the top left corner
of the Award Report screen.
8.
Select one or more Report Filters
from the dropdown menus.
7
9.
Select the correct date range using
the Award Register Date between
filter.
10. Click the yellow Run button to
produce a report.
11. Click the Excel or PDF buttons to
view, download, or print reports.
12. Click one of the other underlined
blue links to view detailed
information or link to other portals.
eData_Generating_Award_Reports_QRG_2.0
Version 2.0
62
Quick Reference Guide: Generating Award Reports by
Investigator
Instructions: Use the steps below to generate Award Reports by Investigator from the
Sponsored Programs Register Portal in eData. For more information about reports in eData,
refer to the Understanding the eData Interface Job Aid.
Award Reports by Investigator include:
Report Type
(Radio Buttons)
Description
All Awards
This report generates a list of awards based on the filter selection and provides aggregate
information such as award count, amount, direct and indirect costs. Shows Principal
Investigators only.
This report generates a list of active awards by award number (assigned by Kuali Coeus)
and based on filter selection. It also provides information such as the award count, amount,
direct and indirect costs.
This report shows all investigators on the award and their contributions and percentage
amounts for the award.
This report generates a list of awards by Investigator, then by Fiscal Year, then by Role. It
also provides Investigator, Fiscal Year, Role, Incremental Award Count, Investigator
Amount, Direct Amount, Indirect Amount, and Award Amount.
Current Awards
Investigator
Contribution
Summary by Fiscal
Year
Acct Mngmnt
Summary
Note: For this report, Incremental Award Count is the number of actions that can be
attributed to a particular investigator in a specific fiscal year for a specific role (PI or COI).
Awards can have multiple actions during their life span, including additional monies,
extensions of time, or reductions of funding.
This report displays the list of accounts and account number assigned to a particular
investigator (account manager).
Note: For more detailed information, use the account number blue links to navigate to SPA
Financial reports.
Links within the Proposal Report Data include:
Award Number Link
Description
Award Number link to Award
Detail
Provides details of a specific award in one location. If the award is connected
to a proposal, the specific proposal number will be an underlined blue link
that takes you to the Proposal Detail report. Additionally, if an associated
account(s) is listed, clicking on the account number’s blue link will take you
to the SPA Financial report for that account.
Note: As a Principal Investigator (PI), you can view account numbers and balances associated for your award using
the Financial Reports sub-portal on the Sponsored Programs Register portal page. Refer to View SPA Financial
Reports instructions at the end of this document.
eData_Generating_Award_Reports_by_Investigator_QRG_2.0
Version 2.0
63
Quick Reference Guide: Generating Award Reports by
Investigator
1.
Log into AccessPlus and enter your
University ID and Password.
2.
Click the uBusiness tab
3.
Click eData, then Continue.
4.
Click Sponsored Programs on the
blue homepage to enter the
Sponsored Programs Register
Portal.
5.
Choose the Investigator’s name from
the drop down menu on the
Sponsored Programs Register
Portal screen.
6.
Click Here to enter the Investigator
Detail Reports portal.
Note: This link will appear only after you
select an Investigator’s name.
5
6
eData_Generating_Award_Reports_by_Investigator_QRG_2.0
Version 2.0
64
Quick Reference Guide: Generating Award Reports by
Investigator
7.
Click Here on the Awards by
Investigator graph.
8.
Select one Report Title from
the Report List in the top left
corner of the Sponsored
Programs Investigator
Details screen.
9.
Select one or more Report
Filters from the dropdown
menus.
8
10. Click the yellow Run button to
produce a report.
11. Click the Excel or PDF buttons to
view, download, or print reports.
eData_Generating_Award_Reports_by_Investigator_QRG_2.0
Version 2.0
65
Troubleshooting
Quick Reference Guide: Configuring Your Browser to
Open New Tabs in eData
Instructions: Use the steps below to configure your browser to work in eData.
Supported Browsers for eData
Use one of the following browsers to log into eData.
•
•
•
Internet Explorer 9 or up
Firefox 12
Safari 6 or up (optional for MACs)
When Using Internet Explorer
1.
Click Tools (or the settings wheel
icon).
2.
Click Internet Options.
1
2
3.
On General tab, click Tabs.
3
eData_Configuring_Your_Browser_to_Open_New_Tabs_in_eData_JOB_2.0
Version 2.0
67
Quick Reference Guide: Configuring Your Browser to
Open New Tabs in eData
4.
Under the Tabbed Browsing
Settings and heading “When a
pop-up is encountered”, check
Always open pop-ups in a new
tab.
5.
Click OK at the bottom of the
Tabbed Browsing Settings
window.
4
5
6.
Click OK in the Internet
Options window.
7.
Click ‘x’ to close the settings.
Note: You should now be able to see
pop-ups in new tabs instead of new
windows.
eData_Configuring_Your_Browser_to_Open_New_Tabs_in_eData_JOB_2.0
Version 2.0
68
Quick Reference Guide: Configuring Your Browser to
Open New Tabs in eData
When Using FireFox
1.
Click Firefox.
1
2.
Then click Options.
3.
And Options again.
2
4.
Click the Tabs icon.
5.
Check the option “Open
new windows in a tab
instead”.
6.
Click OK.
7.
Click ‘x’ to close the
settings.
3
4
Note: You should now be able to see
pop-ups in new tabs instead of new
windows.
eData_Configuring_Your_Browser_to_Open_New_Tabs_in_eData_JOB_2.0
Version 2.0
69
5
Quick Reference Guide: Using Internet Explorer (9 or
10) with eData
Instructions: Use the following steps to enable your browser to trust content from eData. These steps
will help you to configure Internet Explorer (IE) 10 to log into eData through the local intranet.
Note: Please be sure to update your IE web browser. These instructions are designed to help with the
latest versions of IE (9 and 10). Other browsers are not affected and can be used instead of IE.
1.
Open Internet Explorer (IE).
2.
Click the Tool
3.
Click About Internet Explorer
to view your version of Internet
Explorer.
2
icon.
3
Note: If you are not using Internet
Explorer version 9 or 10, please
contact the Solution Center to help
update your browser.
4. Click Close to return to your
home screen.
eData_Using_Internet_Explorer_with_eData_QRG_2.0
Version 2.0
70
Quick Reference Guide: Using Internet Explorer (9 or
10) with eData
5.
Click the Tool
6.
Click Internet options.
5
icon.
6
7.
Click the Local intranet icon on
the Security tab.
8.
Click Sites.
7
9.
Click Advanced on the Local
intranet screen.
eData_Using_Internet_Explorer_with_eData_QRG_2.0
Version 2.0
71
Quick Reference Guide: Using Internet Explorer (9 or
10) with eData
10. Type in https://dw.iastate.edu then
click Add.
11. Type in
https://itsdw005.its.iastate.edu
then click Add.
12. Click Close.
Note: Click Yes if you receive this
message when trying to Add the trusted
sites in steps 10 and 11 above.
13. Click OK on the Local
intranet screen.
eData_Using_Internet_Explorer_with_eData_QRG_2.0
Version 2.0
72
Quick Reference Guide: Using Internet Explorer (9 or
10) with eData
14. Click OK on the Internet Properties
screen.
15. Log into eData from AccessPlus.
eData_Using_Internet_Explorer_with_eData_QRG_2.0
Version 2.0
73
Quick Reference Guide: Exporting eData Reports to
Excel Using Internet Explorer
Instructions: Use the following steps in Internet Explorer (IE) to export reports from eData to Excel. If
you are using Internet Explorer and trying to export a report using Excel, you will have to configure your
computer to trust content from the ITS website and eData.
Note: Please be sure to update your IE web browser. These instructions are designed to help with the
latest versions of IE (9 and 10). Other browsers are not affected and can be used instead of IE.
Disable Pop-up Blocker
1.
Open Internet Explorer.
2.
Click the tool
icon in
Internet Explorer.
3.
Click Internet options.
1
2
eData_Exporting_eData_Reports_to_Excel_Using_Internet_Explorer_QRG_2.0
Version 2.0
74
Quick Reference Guide: Exporting eData Reports to
Excel Using Internet Explorer
4. Click the Security tab.
5. Click Internet.
6. Click Custom Level.
7.
Scroll down in the Settings box to
Miscellaneous, then click Disable
under Use Pop-up Blocker.
eData_Exporting_eData_Reports_to_Excel_Using_Internet_Explorer_QRG_2.0
Version 2.0
75
Quick Reference Guide: Exporting eData Reports to
Excel Using Internet Explorer
Allow File Downloads
8. Scroll to Downloads and click
Enable to allow automatic
prompting for downloads.
9.
Scroll to Miscellaneous and
click Enable to allow META
FRESH.
eData_Exporting_eData_Reports_to_Excel_Using_Internet_Explorer_QRG_2.0
Version 2.0
76
Quick Reference Guide: Exporting eData Reports to
Excel Using Internet Explorer
10. Scroll to Scripting and click
Disable under Enable XSS
filter (cross-site scripting).
11. Click OK.
Note: Click Yes if you receive this
warning box.
eData_Exporting_eData_Reports_to_Excel_Using_Internet_Explorer_QRG_2.0
Version 2.0
77
Quick Reference Guide: Exporting eData Reports to
Excel Using Internet Explorer
Allow Encrypted Pages To Be Saved
12. Click the Advanced tab on the
Internet Properties screen.
13. Scroll to the Security section.
14. Deselect Do not save encrypted
pages to disk.
15. Click Apply.
eData_Exporting_eData_Reports_to_Excel_Using_Internet_Explorer_QRG_2.0
Version 2.0
78
Quick Reference Guide: Exporting eData Reports to
Excel Using Internet Explorer
Add eData to Your Trusted Sites
16. Click the Security tab on the Internet
Properties screen.
17. Select Trusted Sites then Sites.
18. Type in https://dw.iastate.edu then click
Add.
19. Type in https://itsdw005.its.iastate.edu
then click Add.
20. Click Close.
21. Click OK on the Internet Properties
screen.
22. Log into eData from AccessPlus.
eData_Exporting_eData_Reports_to_Excel_Using_Internet_Explorer_QRG_2.0
Version 2.0
79
Quick Reference Guide: Exporting eData Reports to
Excel Using Internet Explorer
Note: Click Yes if you receive this
message when trying to Add the trusted
sites in steps 18 and 19 above.
eData_Exporting_eData_Reports_to_Excel_Using_Internet_Explorer_QRG_2.0
Version 2.0
80
This concludes the User Manual.
For the most updated documentation, please go to:
www.kuali.iastate.edu/training
If you have any questions, please contact the Kuali Trainer or
your Super User:
www.kuali.iastate.edu/support


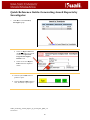


![New tool workshop: First step: After reading [TEXT] and based on](http://vs1.manualzilla.com/store/data/005783105_1-e6c0fd715dacf809f77868c696f00d08-150x150.png)