1
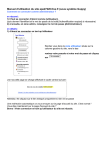
D.O.T.S. Method Indicator v.5 © 2015 CompassFX. All rights reserved. v.5.0 Table of Contents Disclaimer 2 What is the DOTS Method? 3 Why trade with the DOTS Method? 4 Before Installing D.O.T.S. 5 Installing DOTS in MetaTrader 4.0 9 Quick Start … Get started quickly after installation! 10 Applying the D.O.T.S Indicator 11 Adjust the Right Margin Setting 13 D.O.T.S. Indicator Options 16 Creating a Template 28 Creating a Profile 29 DOTS - Guppy Trade 30 Troubleshooting Index 31 Customer / Technical Support 51 © 2015 CompassFX. All rights reserved. v.5.0 1 Disclaimer CompassFX receives a volume based referral fee for its services. Trading Foreign Exchange (Forex) carries a high level of risk and may not be suitable for all investors. There is a possibility that you could sustain a loss of all or more of your investment therefore you should not invest money that you cannot afford to lose. You should be aware of all the risks associated with Foreign Exchange trading. Unique experiences and past performances do not guarantee future results! Testimonials herein are unsolicited and are non-representative of all clients; certain accounts may have worse performance than that indicated. Trading stocks, futures, options and spot currencies involves substantial risk and there is always the potential for loss. Your trading results may vary. Because the risk factor is high in the foreign exchange market trading, only genuine "risk" funds should be used in such trading. If you do not have the extra capital that you can afford to lose, you should not trade in the foreign exchange market. No "safe" trading system has ever been devised, and no one can guarantee profits or freedom from loss. CFTC RULE 4.41 - HYPOTHETICAL OR SIMULATED PERFORMANCE RESULTS HAVE CERTAIN LIMITATIONS. UNLIKE AN ACTUAL PERFORMANCE RECORD, SIMULATED RESULTS DO NOT REPRESENT ACTUAL TRADING. ALSO, SINCE THE TRADES HAVE NOT BEEN EXECUTED, THE RESULTS MAY HAVE UNDEROR-OVER COMPENSATED FOR THE IMPACT, IF ANY, OF CERTAIN MARKET FACTORS, SUCH AS LACK OF LIQUIDITY. SIMULATED TRADING PROGRAMS IN GENERAL ARE ALSO SUBJECT TO THE FACT THAT THEY ARE DESIGNED WITH THE BENEFIT OF HINDSIGHT. NO REPRESENTATION IS BEING MADE THAT ANY ACCOUNT WILL OR IS LIKELY TO ACHIEVE PROFIT OR LOSSES SIMILAR TO THOSE SHOWN. Substantial risk is involved. Forex trading has large potential rewards, but also large potential risk. You must be aware of the risks and be willing to accept them in order to invest in the Forex markets. Don't trade with money you can't afford to lose. Nothing in these instructions, our courses, or website shall be deemed a solicitation or an offer to Buy/sell futures and/or options. No representation is being made that any account will or is likely to achieve profits or losses similar to those discussed on our site. Also, the past performance of any trading methodology is not necessarily indicative of future results. Trading involves high risks and you can lose a lot of money. No representation is being made that any software or training will guarantee profits or not result in losses from trading. © 2015 CompassFX. All rights reserved. v.5.0 2 What is the D.O.T.S. Method? The D.O.T.S. (Daily Open Trading System) Method, exclusively designed by CompassFX, is an intraday price-based indicator that calculates and plots potential market entry, exit, and target levels from daily and historical price movement. The key advantage of the D.O.T.S. Method indicator is its simplicity. Most every trader, regardless of experience, trading style or trading system, can use D.O.T.S. in real-time at a glance. At the Open of the Day or a specific trading session, the D.O.T.S. algorithm identifies: Buy (Long) Entry Buy Target # 1 Buy Target # 2 Buy Stop Loss Sell (Short) Entry Sell Target #1 Sell Target #2 Sell Stop Loss Selectable trading sessions: Broker Daily Open Australian Open Tokyo Open Midnight NY Open European Open London Open New York Open The DOTS Method indicator has a variety of options including: Current trend direction Average Daily Range Previous Session High/Low Current Bid/Ask Spread © 2015 CompassFX. All rights reserved. v.5.0 3 Why Trade with the D.O.T.S. Method? The benefits of DOTS The benefits of trading with the DOTS Method are clear-cut: Plots entry, target and exit levels at the start of a trading session. Provides a road map of the market showing where to enter and exit. Appears in the right margin of the price chart – so not to interfere with trading systems. Works on any MT4 platform as a stand-alone indicator or combined with any trading method or system. © 2015 CompassFX. All rights reserved. v.5.0 4 Before Installing D.O.T.S The DOTS Method indicator works with the MetaTrader 4.0 trading platform on the following Window Operating Systems: Windows XP, Windows Vista, Windows 7, and Windows 8. BEFORE INSTALLING: 1. Update MetaTrader 4.0 to Build 765 or higher. 2. Allow DLL imports. 3. Set Maximum bar in Chart and download adequate historical data. To update the Build number of MetaTrader 4.0, follow these steps: 1. Open MetaTrader 4.0 (MT4). 2. Go to the top menu bar. 3. Select "Help". 4. In the drop-down menu, select "About". 5. A pop-up window will appear similar to the one to the right. 6. The Build number is located in the lower left corner (outlined in red). 7. If the Build number is less than 765, go to the broker's website and download a new demo. 8. When installing the new demo account, follow the prompt instructions. 9. Allow the update to complete. 10. The latest Build number will now appear in the "About" window of MT4. 11. Repeat this process for each MT4 platform on your computer. © 2015 CompassFX. All rights reserved. v.5.0 5 Before Installing D.O.T.S. The next step before installation is to "Allow DLL imports" within MetaTrader 4.0. The D.O.T.S. Method indicator will not operate properly without this setting. To Allow DLL imports, follow these steps: 1. Open MetaTrader 4.0. 2. Go to the Top Menu bar. 3. Select "Tools". 4. In the drop-down menu, select "Options". 5. In the Options window, select the “Expert Advisors” tab. 6. Check the box to the left of "Allow DLL imports" (marked by the red arrow). 7. Click the "OK" button. 8. Repeat this process for each MT4 platform on your computer. © 2015 CompassFX. All rights reserved. v.5.0 6 Before Installing D.O.T.S. To set Maximum bar in Chart and download adequate historical data, follow these steps: First, adjust the “Maximum Bars in History” and “Maximum Bar in Chart” as follows: 1. Open MetaTrader 4.0 (MT4). 2. Go to the top menu bar. 3. Click “Tools”. 4. Select “Options”. 5. Click the “Charts” tab. 6. Max bars in history…enter 100,000. 7. Max bars in chart… click 65,000. 8. Click “OK”. 9. Close and re-open MT4. Second, add more history to a MT4 chart by the following steps: 1. Open a new chart for the currency pair that needs more historical data (e.g., EURUSD). 2. Select the time frame of the chart that you want more data (e.g., EURUSD, M15). 3. Turn off "Auto Scroll" found in the top menu bar. 4. Click the left arrow key multiple times (or hold it down). 5. The chart will move back in time and import historical data automatically. 6. Depending on the time frame, the chart should go back about 3 months or longer. 7. Repeat steps 1 - 5 for each currency pair and time frame that requires more historical data. © 2015 CompassFX. All rights reserved. v.5.0 7 Before Installing D.O.T.S. Third, import historical data from another MetaTrader 4.0 platform or data source: 1. In the top menu bar, click Tools. 2. Select History Center. 3. Select the currency pair. 4. Select the time frame. 5. Click the “Import” button. 6. Browse to another MetaTrader 4 History folder. 7. Select the same currency pair and time frame. 8. Click “OK”. © 2015 CompassFX. All rights reserved. v.5.0 8 Installing D.O.T.S. in MetaTrader 4.0 After purchasing or updating the DOTS Method indicator, an email was sent to you with a Software Key. You will be prompted to enter this Software Key and the Email Address used when registering for DOTS during the installation process. The DOTS Method indicator is designed specifically for the MetaTrader 4.0 platform with Build 765 or later. Follow the steps outlined on page 5 of this manual to check the Build number. IMPORTANT: If a MetaTrader 4.0 platform has a Build number less than 765, the MetaTrader 4.0 platform may crash, freeze, or not respond when installing the DOTS Method Indicator. In this case, close the application and reboot the computer. To get the most up-to-date version of MetaTrader 4.0, click new MT4 platform to download a new demo or contact your broker for a new demo account. To install the DOTS Method indicator, follow the steps shown on this webpage to: http://www.compassfx.com/dots/install.html © 2015 CompassFX. All rights reserved. v.5.0 9 D.O.T.S. Method Indicator Quick Start The DOTS v5 installation includes six templates that are pre-formatted to ready to use. These templates are set to the three most popular trading sessions: Australian Open, European Open, and New York Open. The DOTS v5 installed templates: 1. 2. 3. 4. 5. 6. DOTS v5 Aussie Open DOTS v5 European Open DOTS v5 New York Open DOTS - Guppies v5 Aussie Open DOTS - Guppies v5 European Open DOTS - Guppies v5 New York Open (DOTS set to the Australian Open) (DOTS set to the European Open) (DOTS set to the New York Open) (DOTS with Guppies set to Australian Open) (DOTS with Guppies set to European Open) (DOTS with Guppies set to New York Open) Quick Start steps to using DOTS v5: 1. After install, open MetaTrader. 2. Click “File” in top menu bar. 3. Select “New Chart”. 4. Select currency pair. 5. Blank chart appears. 6. Click Template icon. 7. Select an installed D.O.T.S. template. 8. D.O.T.S. levels appear. 9. Adjust chart and DOTS options. Note: It is recommended to create a new DOTS template if the installed templates are modified in anyway. See the chapter “Creating Templates & Profiles”. © 2015 CompassFX. All rights reserved. v.5.0 10 D.O.T.S. Method Indicator Applying the Indicator to a Chart To apply the D.O.T.S. Method indicator to a chart, follow these steps: 1. Open the MetaTrader 4.0 (MT4) platform. 2. Open a new chart. 3. Locate the Custom Indicators folder in the Navigator window. 4. Double click on the “DOTS Method” indicator. 5. The “Custom Indicator – DOTS Method” window will appear. Under the “Common” tab, make sure the “Allow DLL imports” is checked. © 2015 CompassFX. All rights reserved. v.5.0 11 D.O.T.S. Method Indicator Applying the Indicator to a Chart 6. All the parameters and options are listed under the “Inputs” tab. 7. Use the side scrollbar (red arrow) to scroll through the options within the DOTS Method indicator. 8. To modify an option, double click on a value (red arrow) and enter a new value. For example, to change the Level Width, double-click on 3 and enter a number from 1 to 5. NOTE: If after applying DOTS to a chart, there is a red-lettered alert “Not enough bars on the chart”, follow the instructions of the alert. Review the “Troubleshooting” section of this manual for more details. © 2015 CompassFX. All rights reserved. v.5.0 12 D.O.T.S. Method Indicator Adjust the Right Margin Setting The DOTS Method indicator appears in the right margin of the MT4 price chart. If the indicator does not appear like the snapshot shown above, the first thing to do is check if the Auto Scroll and Chart Shift are in the “On” position. Look within the Charts toolbar near the top menu bar. Click both to turn each “On”. The chart should shift to the left and the DOTS price levels appear. © 2015 CompassFX. All rights reserved. v.5.0 13 D.O.T.S. Method Indicator Adjust the Right Margin Setting If the Auto Scroll and Chart Shift are “On” but the DOTS price levels still do not appear in the right margin, locate the small upside-down triangle in the upper right corner of the chart. Click the triangle and drag it to the left. The chart will move to the left and the prices will appear. If the price bars or candles appear larger than normal, the magnification of the chart may be set to high. Click the Zoom In / Zoom Out functions in the top menu bar to see less or more of the chart. By zooming out, the chart should reset and the DOTS price levels been seen. Also, adjust “Level Text Shift” indicator option discussed in the Indicator Options section. © 2015 CompassFX. All rights reserved. v.5.0 14 D.O.T.S. Method Indicator Adjust the Right Margin Setting At times the price movement of a currency pair will extend beyond the range of the chart for the prices shown. This will cause only a few DOTS levels to appear. The solution is to click and drag the prices in the far right margin down to adjust the vertical scale (as shown below) or change the time frame of the chart. One final solution is to scale the chart to match the price range of the market. Select Properties by clicking on the F8 key. Select the “Common” tab. Locate and check “Scale Fix”. This will allow you to adjust and position the chart vertically and horizontally. © 2015 CompassFX. All rights reserved. v.5.0 15 D.O.T.S. Method Indicator Indicator Options Index List of Indicator Settings & Options 17 Session Settings Session Open Settings Lookback Number of Days 18 19 Alert Settings Buy Sell Entry Alert Alert Pips to Entry Guppy Filter Alert 20 20 20 Display Settings Display Font Size Show Session Label ADR Number of Days Show Trend Show Spread 21 21 21 21 21 Level Settings Level Width Level Font Size Level Text Shift Extend Lines Show Session Open Show Session Separator Show ADR Levels Show Previous Session High / Low Show Targets in Pips 22 22 22 23 23 23 24 24 24 Clock Settings 25 Corner Display Settings 26 Color Settings 27 © 2015 CompassFX. All rights reserved. v.5.0 16 D.O.T.S. Method Indicator Indicator Options The DOTS Method indicator is designed with a number of settings: 1. 2. 3. 4. 5. 6. 7. Session settings Alert settings Display settings Level settings Clock settings Corner Display settings Color settings This is a snapshot showing all the options and parameters: © 2015 CompassFX. All rights reserved. v.5.0 17 D.O.T.S. Method Indicator Indicator Options Session Open Setting This option allows the user to choose which trading session open time to show the DOTS levels. In DOTS v5, the user can select each session by setting a “true” (On) or “false” (Off) condition. The default setting is “true” for all trading sessions except the Broker Daily Open. The Broker Daily Open is shown at 0:00 on the MetaTrader 4.0 chart. However, the broker’s server time may vary. For example, one broker may start a new day at 5:00 PM Eastern while another starts a new day at Midnight Eastern. Both will show 0:00 as the respective Daily Open. This can be quite confusing for traders! To simplify the time settings, DOTS v5 has built in time settings based on New York time. 1 = Broker Daily Open 2 = Australian Open 3 = Tokyo Open 4 = Midnight NY Open 5 = European Open 6 = London Open 7 = New York Open (Broker start of new day) ( 5:00 PM New York) ( 7:00 PM New York) (12:00 AM New York) ( 2:00 AM New York) ( 3:00 AM New York) ( 8:00 AM New York) Review the list of trading sessions and set each session to “true” or “false” for DOTS v5 to automatically update the DOTS level for that session. © 2015 CompassFX. All rights reserved. v.5.0 18 D.O.T.S. Method Indicator Indicator Options Session Settings For instance, to show the DOTS levels for the European Open ONLY, set the value to “true”. Then, set all other session values to “false” and double-click “OK”. © 2015 CompassFX. All rights reserved. v.5.0 19 D.O.T.S. Method Indicator Indicator Options Lookback Number of Days This option plots multiple DOTS levels separated by vertical lines representing the number of days. The default parameter is set to 1 for the current session’s DOTS levels. NOTE: The maximum number of local days is 22. The snapshot below shows the DOTS levels for 5 days. © 2015 CompassFX. All rights reserved. v.5.0 20 D.O.T.S. Method Indicator Indicator Options Alert Settings This option allows the user to set an alert which triggers a pop-up display and audible alert as price nears either a DOTS Buy Entry or Sell Entry level. It includes two parameters: Alert Pips to Entry and Guppy Filter Alert. Alert settings default to “true”. Buy Sell Entry Alert – This is the primary alert. It triggers when price is within the “Alert Pips to Entry” distance to either the Buy Entry or Sell Entry level. It triggers once per price bar with an audible pop-up alert (shown below). Alert Pips to Entry – The default setting is “10”. The Buy Sell Entry Alert triggers when price is 10 pips away from the Buy Entry level or the Sell Entry level. Guppy Filter Alert – This alert only triggers if Guppy Multiple Moving Averages are aligned. Default set to "true". Each alert includes the local time stamp, currency pair, the distance from the Entry level, trade direction, and the price. © 2015 CompassFX. All rights reserved. v.5.0 21 D.O.T.S. Method Indicator Indicator Options Display Settings Display Font Size – This option allows the user to change the font size of the Display text. The default setting is “9”. Double click and change the setting from 8 to 16. Show Session Label – This option displays the session for which the DOTS indicator is applied. Default set to “true”. Show ADR Display – This option displays the ADR number of days and ADR value in pips. Default set to “true”. ADR Number of Days – Enter the number of days to calculate the ADR. Show Trend – This option displays the current trend direction for the specific time chart. There are three trend directions: Up Trend, Down Trend, and Flat Trend. Default set to “true”. Show Spread – This option displays the current spread between the Ask and Bid prices. Default set to “true”. © 2015 CompassFX. All rights reserved. v.5.0 22 D.O.T.S. Method Indicator Indicator Options Level Settings Level Width – This option allows the user to adjust the width of the DOTS levels. The default setting is “3”. Double click and change the setting from 1 to 5. Level Font Size - This option allows the user to change the font size of the text. The default setting is “9”. Double click and change the setting from 8 to 16. Level Text Shift - This option allows the user to shift the DOTS levels and text to the left or the right. Enter a positive number shifts the levels and text to the right and a negative number shifts levels and text to the left. The number equals the number of price bars left or right. Enter “5” shifts the DOTS levels and text to the right by 5 price bars. © 2015 CompassFX. All rights reserved. v.5.0 23 D.O.T.S. Method Indicator Indicator Options Level Settings Extend Lines – This option plots horizontal lines representing each DOTS Level from the current Session Open to the DOTS Levels in the right margin. Default is set to “true”. Double-click and select “false” to remove the extended lines. Show Session Open – Extends a horizontal price line from Session Open. Default is set to “true”. Double-click and select “false” to remove. NOTE: The color of the Session Open line is defaulted to “White”. If using white background, change the color before selecting this option. Show Session Separator – Displays vertical line at start of the Session. Default set to “true”. © 2015 CompassFX. All rights reserved. v.5.0 24 D.O.T.S. Method Indicator Indicator Options Show ADR Levels – Displays the Average Daily Range High (ADRH) and Low (ADRL) levels on the price chart. These levels will adjust the ADR distance as the market sets the daily High and daily Low. Default set to “true”. Show Prev Session Hi Lo – Displays the previous session High and Low levels on the price chart. Trade these levels as Resistance and Support. Price will either bounce off or break through these levels. Default is set to “true”. Show Target in Pips – Displays the pip distance from the Entry level to the Target levels. Default set to “true”. © 2015 CompassFX. All rights reserved. v.5.0 25 D.O.T.S. Method Indicator Indicator Options Clock Settings Show Clock – Displays four clocks in 24-hour format: Local time, Broker time, New York time, and GMT. Default is set to “false”. Double-click and select “true” to view the clocks. Then, double-click “OK”. Observe DST – Default is set to “true” in observance of Daylight Saving Time. Clock Vertical Position – Change the number to adjust vertical position of Clock on the chart. © 2015 CompassFX. All rights reserved. v.5.0 26 D.O.T.S. Method Indicator Indicator Options Corner Display Settings Corner – Select the corner of the price chart for the Display to appear. This parameter allows the user to adjust the descriptive DOTS and Trend Direction display. The default parameter is in the upper left corner under the currency pair shown below. To adjust the corner setting, enter the number of choice and double-click “OK”. © 2015 CompassFX. All rights reserved. v.5.0 27 D.O.T.S. Method Indicator Indicator Options Color Settings Another option is the ability to modify the colors for: • Each DOTS Level • Text - Levels and Display • Session Open • Session Separator • Clock • Spread • Trend: Up, Down, & Flat • Previous High & Low • ADR High & Low To change a color, double-click the color and select a new color from the drop-down menu. © 2015 CompassFX. All rights reserved. v.5.0 28 D.O.T.S. Method Indicator Creating a New Template To create a new template: After DOTS is applied to a chart with the preferred options and appears properly, right click on the chart. Select Template. Select “Save Template…” Then, save the new template with a name DIFFERENT than the original template of choice. © 2015 CompassFX. All rights reserved. v.5.0 29 D.O.T.S. Method Indicator Creating a Profile A profile is a set of charts with specific templates and settings. The advantage of using a profile is that it allows a trader to change multiple charts to different settings quickly. To create a Profile template: 1. Open and set the charts with specific settings. 2. Arrange the charts. 3. Click “File” in the top menu bar. 4. Select “Profiles”. 5. Select “Save As”. 6. Enter a new profile name in the Save Profile window. 7. When that Profile is required, click File… select Profiles…then select the save Profile. NOTE: Modifying charts in a Profile will overwrite and save changes permanently. © 2015 CompassFX. All rights reserved. v.5.0 30 D.O.T.S. Method Indicator DOTS – Guppy Trade Hundreds of traders use the intelligence of the D.O.T.S. Method Indicator to assist them in their trading as it was designed to work with any trading system. However, we have found that many traders don’t have a consistent trading system that gives them an edge in their trading. We discovered the “DOTS-Guppy Trade” from a client, who is an experienced trader and previous floor broker. He referred to this strategy as the “perfect match”. By using the Guppy Multiple Moving Averages as a smart filter, traders can decipher market direction and momentum and look to enter the market when the DOTS entry levels are aligned with the Guppy Multiple Moving Averages. From the response of hundreds of clients, the “DOTS-Guppy Trade” is quick to learn, fun to use, and works. © 2015 CompassFX. All rights reserved. v.5.0 31 D.O.T.S. Method Indicator Troubleshooting Index Why do DOTS levels appear above or below price? 32 Why do I get the “DLL not allowed” alert? 33 Why do I get the “Not enough bars in chart” alert? 34 I still get “Not enough bars in chart” alert. 38 Why are the MT4 charts are not responding or freezing up? 39 Why doesn’t DOTS work when I apply another MT4 custom indicator? 40 Why don’t I see DOTS levels? 41 Why is the Lookback Number of Days not showing the number entered? 45 Why are the DOTS levels the same over 2 or 3 days? 46 Why do I get the message “No Key found in your registry”? 47 Why are there no DOTS levels beyond Target 2? 48 Why do the DOTS ADR levels move or appear not to display correctly? 49 Why do I get a Modify, Repair, Uninstall window when installing DOTS? 50 How do I uninstall DOTS Method v.4 from my computer? 50 © 2015 CompassFX. All rights reserved. v.5.0 32 D.O.T.S. Method Indicator Troubleshooting Why do the DOTS levels appear above or below current price? One of the idiosyncrasies of MetaTrader 4.0 is that it plots an indicator based on old data BEFORE collecting new data. The result is the indicator is displayed incorrectly on the chart. This will sometimes occur, especially when changing the DOTS from one trading session to another. When this occurs, the simple fix is to change the chart to a different time frame and then back. For instance, in the 15-minute chart above, change the time to 30-minutes and then back to 15minutes. This is called a “force reset”. MetaTrader 4.0 is forced to collect new data and re-plot the indicator with the new data. © 2015 CompassFX. All rights reserved. v.5.0 33 D.O.T.S. Method Indicator Troubleshooting Why do I get “DLL is not allowed” red alert? The DOTS indicator uses a DLL (Dynamic Link Library) file to get the local time of your computer in order to compare the broker’s server time to the “Session_Open_Setting” parameter. The red alert reads: “DLL is not allowed. Go to the top menu bar. Select Tools. Select Options. Under Expert Advisor tab, check Allow DLL imports. Close and reopen the MT4 platform.” Follow the instructions shown in the alert to resolve the issue! © 2015 CompassFX. All rights reserved. v.5.0 34 D.O.T.S. Method Indicator Troubleshooting Why do I get “Not enough bars in chart” red alert? The number one reason for most issues related to DOTS indicator is a lack of historical data. The DOTS Method indicator requires adequate historical data to run properly. To resolve a historical data issue, we included a red letter alert that will appear on your chart. Here is an example: The red alert reads: “Not enough bars in chart. Turn off Auto Scroll. Press Page Up Key repeatedly until this message disappears. Then press the End Key and the DOTS levels should appear. If not, close and reopen the chart. Re-apply DOTS to chart.” Follow the instructions shown in the alert to resolve the issue! © 2015 CompassFX. All rights reserved. v.5.0 35 D.O.T.S. Method Indicator Troubleshooting To add more history to a MT4 chart, follow these steps: 1. Open a new chart for the currency pair that needs more historical data (e.g., EURUSD). 2. Select the time frame of the chart that you want more data (e.g., EURUSD, M15). 3. Turn off "Auto Scroll" found in the top menu bar. 4. Click the left arrow key multiple times (or hold it down). 5. The chart will move back in time and import historical data automatically. 6. Depending on the time frame, the chart should go back about 3 months or longer. 7. Repeat steps 1 - 5 for each currency pair and time frame that requires more historical data. In the event the red alert display does not disappear, close the chart and attempt to download data from the broker using the History Center of the MT4 platform. Click on “Tools” in the top menu bar…then select History Center in the drop-down menu. © 2015 CompassFX. All rights reserved. v.5.0 36 D.O.T.S. Method Indicator Troubleshooting A window similar to this window will appear. Select a currency pair. If the time frame preferred is gray, select that time frame and double click it to collect historical data from the broker. In some instances, continuous clicking will collect additional data. © 2015 CompassFX. All rights reserved. v.5.0 37 D.O.T.S. Method Indicator Troubleshooting After downloading the data via the History Center, close and re-open the MT4 platform. Open a new chart and re-apply the DOTS indicator. In some instances, a MT4 broker may not provide enough data for a specific time frame. In this case, use a higher intraday chart. If your computer is a Mac, there may not be a Page Up key. In some instances, hold the Fn key and press the Up arrow key to page up. If this does not work, refer to your computers manual. © 2015 CompassFX. All rights reserved. v.5.0 38 D.O.T.S. Method Indicator Troubleshooting I still have “Not enough bars in chart” alert, and MT4 will not go back in time any further. Why? You may need to reset the “Max bar in chart” to a higher number. To set the number of bars on the chart, follow these steps: 1. Go to the top menu bar and click Tools. 2. Select Options. 3. Click the Charts tab. 4. Max bars in history…click on the drop-down menu and select 100,000. 5. Max bars in chart… click on the drop-down menu and select 65,000. 6. Click “OK”. 7. Close and re-open MT4. If you follow these instructions and the DOTS levels do not appear, close and re-open the chart… or close and re-open the MetaTrader 4.0 platform to force a reset. © 2015 CompassFX. All rights reserved. v.5.0 39 D.O.T.S. Method Indicator Troubleshooting Why are my MetaTrader 4.0 charts not responding or freezing up? There could be a number of issues related to MT4 charts not responding. However, we have found the most probably reasons related to DOTS Method are: 1. Old MT4 Build number. MT4 must be Build 765 or higher. 2. Lack of Historical data. 3. Another custom indicator conflicts with the DOTS indicator. To check for the Build number, see page 5. To resolve a lack of historical data, follow steps shown on pages 35-37. Why doesn’t DOTS work when I apply another MT4 custom indicator? The DOTS indicator works with all the standard MT4 indicators and most custom MT4 indicator. There are some MT4 custom indicators that may interfere with the plotting of the DOTS levels. First apply DOTS to a NEW chart and then apply the other custom MT4 indicator. If the DOTS levels disappear after applying the other custom indicator, there is a conflict. To resolve the conflict, apply the other custom indicator to the chart first and then apply the DOTS indicator. © 2015 CompassFX. All rights reserved. v.5.0 40 D.O.T.S. Method Indicator Troubleshooting Why don’t I see the DOTS levels? Did your computer recently do a Windows or Anti-virus update? In some cases, a Windows update or an Anti-Virus software update affects the computers registry files which in turn may disable or delete files deemed suspicious or potentially malicious. If a Windows update or Anti-virus update was done, there is a chance that a DOTS system file was deleted. In this case, do a re-install of DOTS to solve the issue. The re-install will restore all the DOTS files on your computer. To do a re-install of DOTS, follow these steps: 1. Close your MetaTrader 4.0 charts and platform. 2. Go to: http://www.compassfx.com/dots/install.html 3. Skip down to "Installing D.O.T.S. Method" and follow the steps. 4. Follow all the installation prompts and enter your DOTS Software Key when prompted. 5. After installation, turn off your computer and restart it. 6. After rebooting the computer, right-click on the MetaTrader 4.0 icon on your Desktop and select “Run as administrator”. 7. When MetaTrader 4.0 opens, apply the DOTS Method indicator to a new chart. The DOTS levels should appear. If DOTS Method indicator still does not appear, you may need to change your User Account security permissions. © 2015 CompassFX. All rights reserved. v.5.0 41 D.O.T.S. Method Indicator Troubleshooting Why don’t I see the DOTS levels? To change your User Account security permissions, let’s review the reason why? Microsoft has had a number of problems related to "missing files" while protecting computers from read-write executable (.exe) data files. Vista and later versions of Windows use what is called "file virtualization", which is a way of saving certain read-write files to virtual areas of the hard drive in order to protect computer programs and maintain a level of security. What does all this mean? Some of the DOTS installation files (especially the DLL files) may not be saved in the Program Files directory. Apparently Windows allocates them to a hidden directory instead of the Program Files or Program Files (x86)…where it should be installed. You can open the Program Files directory and see the files are listed; but, some of the files are not actually stored in the Program Files directory. This is confusing for the average computer user! Three solutions to stop this Windows behavior and let MT4 store files in Program Files: 1. Right-click the MT4 icon on the desktop and select "Run as administrator". 2. Change the security permissions on the MT4 directories within Program Files. Right click on a MT4 Program File. Select Properties. Click the Security tab. Then, click Edit. Select "Users" and then check "Full Control" (red arrow). If you change the security so that normal users can write and delete these directories, then file virtualization no longer kicks in. © 2015 CompassFX. All rights reserved. v.5.0 42 D.O.T.S. Method Indicator Troubleshooting To change your User Account security permissions (cont’d)… 3. Turn off User Account Controls. Look in the lower left corner of the desktop and click Start. Select Control Panel. Select User Accounts. Select Change User Account Control Settings. Then move the slider bar down to "Never Notify". In effect, this turns off User Account permission and allows MT4 to run properly from the Program Files directory. It is the easiest of the three solutions, but you must be fully aware of any updates or changes to your computer. In a nutshell, do one of the three solutions above. Number 2 may be best in order to have Windows maintain a level of security permissions. After settings are changed, turn off the computer and restart it. If you changed the settings correctly, then DOTS will appear after rebooting the computer and starting MT4. © 2015 CompassFX. All rights reserved. v.5.0 43 D.O.T.S. Method Indicator Troubleshooting Why don’t I see the DOTS levels? Inconsistencies with MetaTrader 4.0 Due to some inconsistencies with the MetaTrader 4.0 brokers and platforms, there is a chance the DOTS levels will not appear. Simply fixes: 1. Close all charts. Close and reopen the MetaTrader 4.0 platform, and then apply DOTS to a new chart. 2. Close and reopen a chart. 3. Change the chart to another timeframe and then return to the original timeframe. Also, there is a common misperception that the DOTS indicator will automatically refresh the chart by itself. The indicator does not refresh the chart if the historical data does not refresh. In most instances missing historical data, even data from the previous day, and the lack of new data at the start of the normal Broker Daily Open can cause issues with DOTS indicator plotting the levels. Time chart too small If you are on a small time chart, like the 1-minute or 5-minute, you may not see the DOTS levels due to the range of price. Click and drag down the prices in the far right margin. This will scale the chart to see the DOTS levels. © 2015 CompassFX. All rights reserved. v.5.0 44 D.O.T.S. Method Indicator Troubleshooting Time chart too small (cont’d)… In this case, do one of the following: 1. Use the “Zoom Out” feature. 2. Place the cursor in the far right margin where price is shown. Click and drag down. The chart will compress and you can see the levels. The DOTS levels are best viewed on a 15-minute or higher time frame when there is a lot of movement in a currency pair. NOTE: The DOTS Method levels are the same regardless of the time chart. A 1-hour chart will display the levels at the same price points as a 5-minute chart or any other intraday chart. © 2015 CompassFX. All rights reserved. v.5.0 45 D.O.T.S. Method Indicator Troubleshooting Why is the Lookback Number of Days not showing the number of days entered? Again, this is most likely a historical data issue. Follow the steps outlined previously to add more data to your chart. If you have enough data, you may need to “force a reset” of your MetaTrader 4.0 platform. Generally following these steps to resolve the issue: 1. Close all charts. Close and reopen the MetaTrader 4.0 platform, and then apply DOTS to a new chart. 2. Close and reopen a chart. 3. Change the chart to another timeframe and then return to the original timeframe. NOTE: In some cases, a MetaTrader 4.0 broker will only supply a certain amount of data regardless of what steps you might attempt to download more data. If you are unable to download additional data, use another time frame to view the number of days entered. For instance, if you want to see 20 days of DOTS levels using a 5-minute chart but you can’t get enough historical data, then use a 1-hour or 4-hour chart. © 2015 CompassFX. All rights reserved. v.5.0 46 D.O.T.S. Method Indicator Troubleshooting Why are the DOTS levels the same over the last 2 to 3 days? From time to time, a MT4 broker will not “force” an update of its Daily Open. This can cause the DOTS to plot the same level lines for the past 2 or 3 days. Here is an example: To resolve this issue, close the chart and reopen the chart. Sometimes, a quick fix is to simply change to another timeframe and then return to the original timeframe. If the problem is not resolved, go the History Center and follow the steps above to download data from the broker. © 2015 CompassFX. All rights reserved. v.5.0 47 D.O.T.S. Method Indicator Troubleshooting I get the message "No Key found in your registry (could be a bad install)". We recommend that you do a re-install of the DOTS Method. Before you do the re-install, temporarily disable your firewall/anti-virus software. It appears that your firewall/anti-virus software could be preventing a complete installation. 1. Right-click the DOTS Method Installer link and select "Save Target As". 2. Save the "DOTS Method v3.exe" to your desktop. 3. Right-click on “DOTS Method v3.exe” icon on your desktop and select "Run as administrator." 4. After the installation, right-click on the MT4 icon on your desktop and select "Run as administrator". Here are other ways to resolve a DOTS Method indicator issues: 1. Make sure the Visualization setting is checked for “All Timeframes”. 2. Check that you have the latest Build number. See page 5 for details. © 2015 CompassFX. All rights reserved. v.5.0 48 D.O.T.S. Method Indicator Troubleshooting Why are there no DOTS levels beyond Target 2? The reason there are no DOTS levels beyond Target 2 is because of the low probability of being hit on average. Generally, it requires a major news event to move the market beyond Target 2 level. We are considering a future version of DOTS with more levels. But, for now, the majority of market movement is generally within or near the daily range from the Buy Target 2 to the Sell Target 2. When the market runs beyond a Target 2 level, we recommend to “stack the levels” by adding another level that is the distance from the Entry to Target 1 or the distance from the Entry to Target 2. © 2015 CompassFX. All rights reserved. v.5.0 49 D.O.T.S. Method Indicator Troubleshooting Why do the DOTS ADR levels move or appear not to display as expected? The Average Daily Range built into the DOTS indicator is a "floating" ADR that becomes fixed as the market makes a Daily High to the Daily Low. From the open of the day, the ADR High level and ADR Low level are calculated and plotted from the open of the day. Then, as the market moves, the ADR Levels adjust according to the current Daily Low and Daily High. In the example below, the market moves higher from the Daily Low until the pip distance equals the ADR pip value. At this point, the ADR High level is achieved. Likewise, as the market continues higher, the Daily High price minus the ADR pip value becomes the ADR Low level. © 2015 CompassFX. All rights reserved. v.5.0 50 D.O.T.S. Method Indicator Troubleshooting Why do I get a Modify, Repair, or Uninstall window when installing DOTS? How do I uninstall DOTS Method v.4 from my computer? Whenever a DOTS Method v5 reinstallation or uninstall procedure occurs, the Installation program will show these windows: When attempting a reinstall, we recommend completing the Uninstall first. 1. Close all MetaTrader 4.0 platforms. 2. Click the “Start” button in the lower left corner of the desktop. 3. Locate and select “Control Panel”. 4. Locate and select “Programs”. 5. Select “Uninstall a Program”. 6. Locate “CompassFX DOTS Method 4.00” and click “Uninstall”. 7. After the uninstall is complete, go to http://www.compassfx.com/dots/install.html 8. Locate and select the “DOTS Method 4.0 Installer”. 9. Follow the prompts and instructions completely. If uninstalling DOTS, follow the prompts of the Installation program thru completion. DOTS Method v.4 will be removed automatically from all MetaTrader 4.0 platforms. © 2015 CompassFX. All rights reserved. v.5.0 51 D.O.T.S. Method Indicator Customer & Technical Support For additional information, go to this website: http://www.compassfx.com/dots http://www.compassfx.com/dots/install.html For technical support, send an email to CompassFX Customer Support: [email protected] Compass FX 2083 N. Collins Blvd., Suite 200 Richardson, TX 75080 Phone 800.577.3600 972.680.8080 972.680.3355 ( Fax ) © 2015 CompassFX. All rights reserved. v.5.0 52