1
Leaders & Laggers Indicator
User Manual
Software User Agreement & Product Disclaimer
IMPORTANT: PLEASE READ THIS AGREEMENT CAREFULLY BEFORE CONTINUING WITH THE
INSTALLATION PROCESS OF THE SOFTWARE ("THE SOFTWARE"). BY INSTALLING THE SOFTWARE,
YOU AGREE TO BE BOUND BY THE TERMS OF THIS AGREEMENT. IF YOU DO NOT AGREE TO THE
TERMS OF THIS AGREEMENT, DO NOT INSTALL THE SOFTWARE.
1. License. If you have purchased a license to the Software, Golden Zone Trading grants you a nonexclusive right and license to use the Software and the related documentation (the
"Documentation") as set forth in this Agreement. You may use the Software on a single
computer. You may also use the Software on a second (portable or home) computer so long as
only one copy is used at a time. You may make a single copy of the Software for backup and
archival purposes only provided that any copy must contain all proprietary notices included in
the original. You may use the Documentation to assist in your use of the Software. If you
download the Software without physical delivery of Documentation, you may review the
Documentation online, but you may not make further copies of the Documentation. You own the
media on which the Software is recorded, but not the Software itself or any copy of it. This
license is not a sale of the original or any copy of the Software.
2. Copying, Transferring or Modifying Software. The Software contains copyrighted material, trade
secrets and other proprietary intellectual property. You may not permit concurrent use of the
Software unless each user has an applicable license. You may not permit other individuals to use
the Software except under the terms listed above. For the purposes of protecting Golden Zone
Trading trade secrets, you may not decompile, disassemble, reverse-engineer or otherwise
display the Software in human-readable form. You may not modify, translate, rent, lease,
distribute or lend the Software, and you may not sell to others the right to use the Software on
your computer. You may not remove any proprietary notices or labels on the Software. You may
not copy, transfer, transmit, sublicense or assign this license or the Software except as expressly
permitted in this Agreement.
3. Term. If you have purchased a license to the Software, this Agreement and license are effective
from the time you accept the terms of this Agreement until this Agreement is terminated. You
may terminate this Agreement at any time by destroying all copies of the Software. This
Agreement will terminate immediately and without further notice if you fail to comply with any
provision of this Agreement. All obligations of confidentiality and restrictions on use, and all
other provisions that may reasonably be interpreted to survive termination of this Agreement,
will survive termination of this Agreement for any reason. Upon termination, you agree to
destroy all copies of the Software. If you have obtained an evaluation copy of the Software, and
have not purchased a license to the Software, this Agreement and license are effective for a
period of thirty (30) days from the date of installation of the Software.
4. Warranty Disclaimers. THE SOFTWARE AND THE DOCUMENTATION ARE PROVIDED "AS IS" AND
WITHOUT WARRANTIES OF ANY KIND, EXPRESS, STATUTORY OR IMPLIED, INCLUDING, BUT NOT
LIMITED TO, THE IMPLIED WARRANTIES OF MERCHANTABILITY, FITNESS FOR A PARTICULAR
PURPOSE AND NON-INFRINGEMENT. THE ENTIRE RISK AS TO THE QUALITY AND PERFORMANCE
OF THE SOFTWARE AND THE DOCUMENTATION IS WITH YOU. SHOULD THE SOFTWARE OR THE
DOCUMENTATION PROVE DEFECTIVE, YOU (AND NOT GOLDEN ZONE TRADING)
ASSUME THE ENTIRE COST OF ALL NECESSARY SERVICING OR REPAIR. GOLDEN ZONE TRADING
DOES NOT WARRANT THAT THE FUNCTIONS CONTAINED IN THE SOFTWARE WILL MEET YOUR
REQUIREMENTS OR OPERATE IN THE COMBINATION THAT YOU MAY SELECT FOR USE, THAT THE
OPERATION OF THE SOFTWARE WILL BE UNINTERRUPTED OR ERROR FREE, OR THAT DEFECTS IN
THE SOFTWARE WILL BE CORRECTED. NO ORAL OR WRITTEN STATEMENT BY GOLDEN ZONE
TRADING OR BY A REPRESENTATIVE OF GOLDEN ZONE TRADING SHALL CREATE A WARRANTY OR
INCREASE THE SCOPE OF THIS WARRANTY. Notwithstanding the above, you may have certain
warranty rights which vary from state to state and which cannot be disclaimed by contract. Any
warranties that by law survive the foregoing disclaimers shall terminate ninety (90) days from the
date you received the Software as shown by your receipt. Some states do not allow limitations
on how long an implied warranty lasts, so the foregoing limitation may not apply to you if
prohibited by law.
5. Limitation of Liability. YOUR SOLE REMEDIES AND GOLDEN ZONE TRADING’ ENTIRE LIABILITY ARE
SET FORTH ABOVE. IN NO EVENT WILL GOLDEN ZONE TRADING BE LIABLE FOR DIRECT, INDIRECT,
INCIDENTAL OR CONSEQUENTIAL DAMAGES RESULTING FROM THE USE OF THE SOFTWARE, THE
INABILITY TO USE THE SOFTWARE, OR ANY DEFECT IN THE SOFTWARE, INCLUDING ANY LOST
PROFITS, EVEN IF THEY HAVE BEEN ADVISED OF THE POSSIBILITY OF SUCH DAMAGE. IN NO
EVENT WILL GOLDEN ZONE TRADING’ TOTAL LIABILITY TO YOU FOR ALL DAMAGES, LOSSES, AND
CAUSES OF ACTION (WHETHER IN CONTRACT, TORT, INCLUDING NEGLIGENCE, OR OTHERWISE)
EXCEED THE AMOUNT YOU PAID FOR THIS PRODUCT. SOME JURISDICTIONS DO NOT ALLOW THE
EXCLUSION OR LIMITATION OF RELIEF, INCIDENTAL OR CONSEQUENTIAL DAMAGES, SO THE
ABOVE LIMITATION OR EXCLUSION MAY NOT APPLY TO YOU. You agree that Golden Zone
Trading will not be liable for defense or indemnity with respect to any claim against you by any
third party arising from your possession or use of the Software or the Documentation.
6. Export Control Laws. You agree to comply with all laws, rules and regulations applicable to the
export of the Software or the Documentation. Specifically, you shall not export, re-export or
transship the Software or the Documentation, or the direct product thereof, in violation of any
United States laws and regulations which may from time to time be applicable. None of the
Software or underlying information or technology may be downloaded or otherwise exported or
re-exported (i) into any country to which the U.S. has embargoed goods; or (ii) to anyone on the
U.S. Treasury Department's list of Specially Designated Nationals or the U.S. Commerce
Department's Table of Denial Order. By downloading or using the Software, you are agreeing to
the foregoing and you are representing and warranting that you are not located in, under the
control of, or a national or resident of any such country or on any such list.
7. Government Restricted Rights. The Software has been developed at private expense and is
"commercial computer software" or "restricted computer software" within the meaning of the
FARs, the DFARs, and any other similar regulations relating to government acquisition of
computer software. Nothing contained herein will be deemed to grant any government agency
any license or other rights greater than are mandated by statute or regulation for commercial
computer software developed entirely at private expense.
8. Entire Agreement. This Agreement is the complete agreement between Golden Zone Trading and
you and supersedes all prior agreements, oral or written, with respect to the subject matter hereof. If
you have any questions concerning this Agreement, you may write to Golden Zone Trading,
Customer Service, [email protected].
U.S. Government Required Disclaimer - Forex, futures, stock, and options trading is not appropriate for
everyone. There is a substantial risk of loss associated with trading these markets. Losses can and will occur. No
system or methodology has ever been developed that can guarantee profits or ensure freedom from losses. No
representation or implication is being made that using this methodology or system or the information in this
letter will generate profits or ensure freedom from losses.
CFTC RULE 4.41 - HYPOTHETICAL OR SIMULATED PERFORMANCE RESULTS HAVE CERTAIN LIMITATIONS. UNLIKE
AN ACTUAL PERFORMANCE RECORD, SIMULATED RESULTS DO NOT REPRESENT ACTUAL TRADING. ALSO, SINCE
THE TRADES HAVE NOT BEEN EXECUTED, THE RESULTS MAY HAVE UNDER-OR-OVER COMPENSATED FOR THE
IMPACT, IF ANY, OF CERTAIN MARKET FACTORS, SUCH AS LACK OF LIQUIDITY. SIMULATED TRADING
PROGRAMS IN GENERAL ARE ALSO SUBJECT TO THE FACT THAT THEY ARE DESIGNED WITH THE BENEFIT OF
HINDSIGHT. NO REPRESENTATION IS BEING MADE THAT ANY ACCOUNT WILL OR IS LIKELY TO ACHIEVE PROFIT
OR LOSSES SIMILAR TO THOSE SHOWN.
GOVERNMENT REGULATIONS REQUIRE DISCLOSURE OF THE FACT THAT WHILE THESE METHODS MAY HAVE
WORKED IN THE PAST, PAST RESULTS ARE NOT NECESSARILY INDICATIVE OF FUTURE RESULTS. WHILE THERE IS
A POTENTIAL FOR PROFITS THERE IS ALSO A RISK OF LOSS. A LOSS INCURRED IN CONNECTION WITH TRADING
FUTURES, STOCKS, FOREX, OPTIONS OR ANY KIND OF OTHER TRADING PRODUCTS CAN BE SIGNIFICANT. YOU
SHOULD THEREFORE CAREFULLY CONSIDER WHETHER SUCH TRADING IS SUITABLE FOR YOU IN LIGHT OF YOUR
FINANCIAL CONDITION SINCE ALL SPECULATIVE TRADING IS INHERENTLY RISKY AND SHOULD ONLY BE
UNDERTAKEN BY INDIVIDUALS WITH ADEQUATE RISK CAPITAL.
Leaders & Laggers Concepts Explained:
The GZT_Leaders_Laggers indicator is used as a market breadth tool. It is comprised of a % change
requirement that measures the strength of the applied markets based on (+/-) % change off either of
the following:
-
Session Template
Chart Start
Specific Date
The indicator is used to see which market is strongest (LEADING) and which market is weakest
(LAGGING) when looking at correlated & non-correlated markets. The tool is best applied to either
of the following groups of markets:
-
Equity indexes
Currencies
When applying the tool to monitor (equity index markets) we measure the following pegged against
the S&P500.
-
Dow Jones
Nasdaq
Russell
When applying the tool to monitor (currency markets) we measure the following pegged against the
US Dollar.
-
Aussie Dollar
British Pound
Canadian Dollar
Swiss Franc
Euro
The indicator can be used on all of the following markets:
-
Equities
Futures
Forex
For the GZT Mastery Trader Program we use the GZT_Leaders_Laggers indicator to monitor both
stock index futures and currency futures markets as our training program is solely focused on
futures trading. The indicator can be used with more markets and instruments that were not listed
above however, if you require additional information when applying it to equities or forex pairs
please email [email protected]
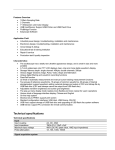
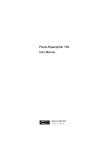
Measuring Market Breadth of Stock Market Indexes (Futures)
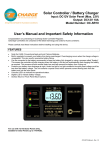
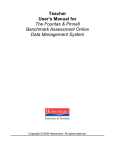
Measuring Market Breadth of Currencies (Futures)
Leaders & Laggers Base Concepts:
Concept
Leader
Lagger
Base Market
Definition
- The strongest market
- The weakest market
The market which is used as the base chart that all other markets are
pegged against.
- ES (S&P500) is the base for stock index markets
- DX (US Dollar Index) is the base for currency markets
Application to trading:
-
-
When looking at long positions/trades, one can consider choosing trades in the strongest
markets (leaders) as these represent the strongest % change against the other
correlated/non-correlated markets.
When looking at short positions/trades, one can consider choosing trades in the weakest
markets (laggers) as these represent the weakest % change against the other correlated/noncorrelated markets.
Leaders & Laggers Indicator Parameters & Settings:
Group
Info Box
Parameters
Box Color
Allowable Values
Custom/Web/System
Default = Bisque
Description
Allows for changing the color of the
leaders & laggers dialog box.
Text Color
Custom/Web/System
Default = Black
Custom/Web/System
Default = Black
True/False
Default = True
Identified Markets
(Instrument/Date/Contract)
Allows for changing the color of the text in
the leaders & laggers dialog box.
Allows for changing the outline color of the
leaders & laggers dialog box.
This function is to show or hide the leaders
& laggers dialogue box.
The following fields are to allow the user
to input the specific markets they wish to
show that are pegged against the base
market.
Instrument 1- always represents the base
market and is not shown here.
When Session is selected it applies the
leaders and laggers to start at the specific
session start time.
When Chart Start is selected it applies the
leaders and laggers to start at the
beginning of the chart time.
When Date is selected it applies the
leaders and laggers to start at a specific
date that is specified
Allows the user to specify the date they
wish to have the leaders and laggers start
from when the start type is set to date.
When set to false, indicator recalculates
with every incoming tick on real-time data
Outline Color
Show Box
Instruments
Instruments
2-9
Parameters
Start Type
Session/Chart Start/Date
Default = Session
Start Time
Specific Date
Calculate on
bar close
True/False
Default = False
Data
Lines
Zero Line
Color/Style/Width
Default = Transparent
Plots
Plot 1-9
Color/Style/Width
Allows the user to select the zeroline of
the indicator. (This is never applied or
used)
This allows the user to select each market
color/style/width for each market used in
the leaders and laggers graph which is
pegged against the base market.
These plots will be directly related to each
market listed in the instrument section.
All plots that are not used must be set to
(transparent)
Plot 1- always represents the base market.
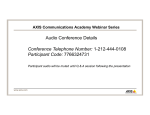
Application Explained:
-
The following chart represents the TF as the leading market followed by the NQ as the 2nd
strongest against the ES. Depending on your applied strategy, this tool identifies that if your
bias was to go long the market, the TF and the NQ would be higher probability markets to
trade long as they represent (+) % strength over the other 2 markets (ES/YM).
-
If you bias was to go short the market, your higher probability trades would most likely be
represented in the (ES/YM) as they demonstrate weakness against the other 2 (NQ/TF)
-
It is important to mention that the general market strength (either +/- % change as a
combined whole does not mean for you to go long or short the markets. The tool is to
identify which market is strongest and weakest against a pegged market. This can be best
demonstrated when applied to your chosen trade strategy and setups to increase odds of
success by trading the market that has strength or weakness in your favor.
-
When choosing a base chart timeframe (ie: 5 min) for these examples, it is best to apply the
chart timeframe to the style of your trading. If you are a day trader you will want to apply a
smaller timeframe to the base chart. If you are a swing trader you may wish to increase the
timeframe to a higher fractal (ie: hourly/daily).
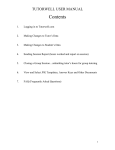
Application Explained:
-
When looking at the chart below we have 5 currency futures markets (6A/6B/6E/6S/6C) all
pegged against the US Dollar Index (DX). This chart represents which currency markets are
strongest and weakest against the US Dollar.
-
When we look at applying this to trading, longs would represent higher probabilities with the
3 stronger markets (6C/DX/6A). Shorts would represent higher probabilities with the 3
weaker markets (6B/6S/6E)
-
The things to consider for using this tool towards any type of market breadth analysis is to
factor in the variable that are independent of the tool (ie: your trade strategy and your
setups). We simply use this to enhance our original strategy by trading stronger and weaker
markets in correlation to our standard approach.