1
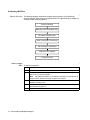
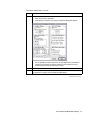
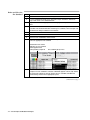
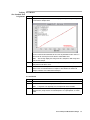
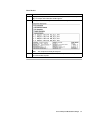
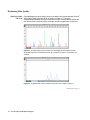
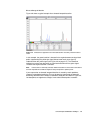
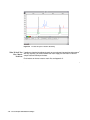
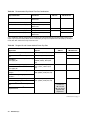
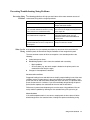
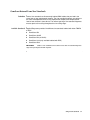
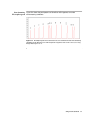
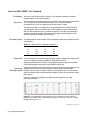
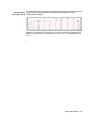
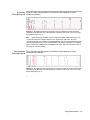
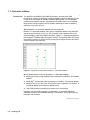
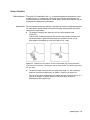
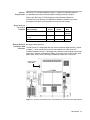
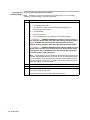
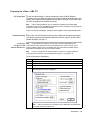
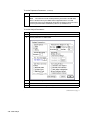
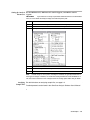
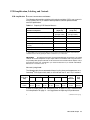
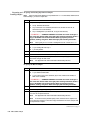
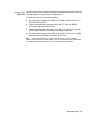
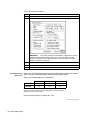
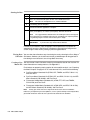
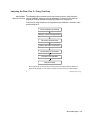
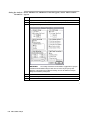
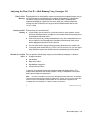
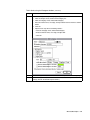
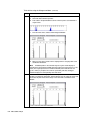
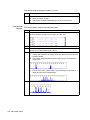
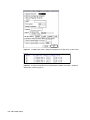
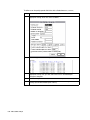
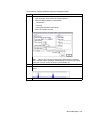
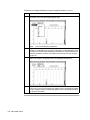
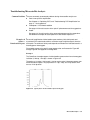
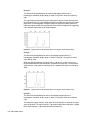
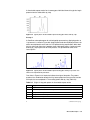
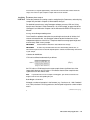
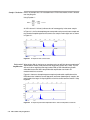
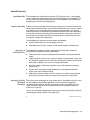
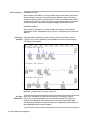
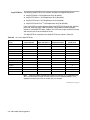
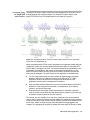
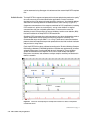
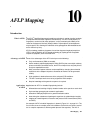
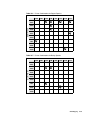
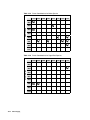
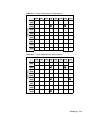
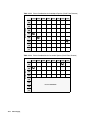
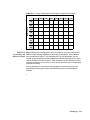
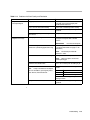
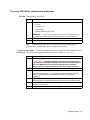
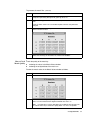
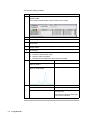
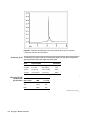
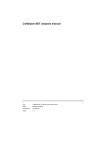
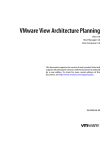
Verifying First Method
Size-Standard Peak
Step
Action
Assignments
1
Highlight each sample file of interest and display its sizing curve by selecting Size
Curve from the Sample menu.
The R^2 value and the coefficients of the curve are provided. The R^2 value is a
measure of the accuracy of fit of the best-fit second order curve.
Note
You can only display the sizing curve for a sample if a valid sizing curve
exists for that sample.
2
Check whether all the defined size standard peaks fall on the red sizing curve and
note peaks that lie off the curve.
3
If all of the size standard peaks did not lie on the sizing curve for any samples,
define a new size standard for those samples as described in the GeneScan
Analysis Software User’s Manual and reanalyze.
Second Method
Step
Action
1
Select Results Control from the Window menu (c R).
2
From the View menu, select Align By Size.
Note
3
If fragments are aligned by size, this option will not be available.
Examine the GeneScan size standard peaks in overlapping groups of 16 samples
(Quick Tile Off). Verify that the size standard peaks are superimposed, as shown
below.
General Analysis and Evaluation Techniques 3-5