1
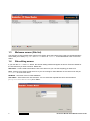
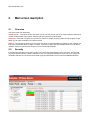
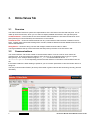
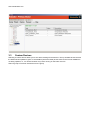
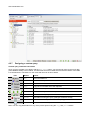
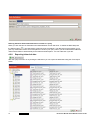
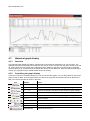
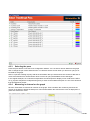
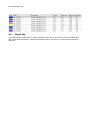
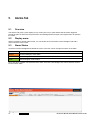
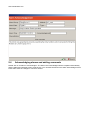
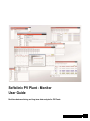
Softclinic PV Plant - Monitor
User Guide
Real time data monitoring and long term data analysis for PV Plants
Revision History
Contact details
Version
Date
Version
1.0
07/2011
First release (Australian
version)
Weidmuller Pty Ltd
43 Huntingwood Drive
Huntingwood
NSW 2148
Australia
Tel.
+61 (0) 2 9671 9999
Fax
+61 (0) 2 9671 9900
E-Mail [email protected]
Internet www.weidmuller.com.au
Contents
Revision History ............................................................................................................................................... 2
Contact details .................................................................................................................................................. 2
Contents ............................................................................................................................. 3
1.
Introduction ........................................................................................................... 5
1.1
General description........................................................................................................................... 5
1.2
Installing the software ...................................................................................................................... 5
1.3
Welcome screen (Site list) ................................................................................................................ 6
1.4
Site editing screen ............................................................................................................................ 6
2.
Main screen description ....................................................................................... 7
2.1
Overview ............................................................................................................................................ 7
2.2
Security .............................................................................................................................................. 7
3.
Online Values Tab ................................................................................................. 8
3.1
Overview ............................................................................................................................................ 8
3.2
Communications ............................................................................................................................... 8
3.3
Custom Devices ................................................................................................................................ 9
3.4
String Boxes .................................................................................................................................... 10
4.
Historical Tab ...................................................................................................... 11
4.1
Overview .......................................................................................................................................... 11
4.1.1
4.2
Display areas ..................................................................................................................... 11
Query Table ...................................................................................................................................... 12
4.2.1
Selecting the data for the Graph ........................................................................................ 12
4.2.2
Preset Queries ................................................................................................................... 12
4.2.3
Adding a WHERE clause to a query .................................................................................. 13
4.2.4
Query timeframe and interval ............................................................................................ 13
4.2.5
Adding a Custom Query group .......................................................................................... 14
4.2.6
Adding a new Custom Query ............................................................................................. 14
4.2.7
Designing a custom query ................................................................................................. 15
Custom query command line buttons ............................................................................................ 15
Defining which PV Plant measurements to include in a query ...................................................... 16
4.2.8
4.3
Exporting historical data..................................................................................................... 16
Historical graph display ................................................................................................................. 17
4.3.1
Overview ............................................................................................................................ 17
PV Clinics Monitor User Manual 21/07/11 01.00
3
4.3.2
Controlling the graph display ............................................................................................. 17
4.3.3
Selecting the pens ............................................................................................................. 18
4.3.4
Measuring an interval on the graph ................................................................................... 18
4.4
Graph key ......................................................................................................................................... 19
5.
Alarms Tab........................................................................................................... 20
5.1
Overview .......................................................................................................................................... 20
5.2
Display areas ................................................................................................................................... 20
5.3
Alarm Status .................................................................................................................................... 20
5.4
Acknowledging alarms and adding comments ............................................................................ 21
4
PV Clinics Monitor User Manual 21/07/11 01.00
www.weidmueller.com
1.
Introduction
1.1
General description
PV Clinics Monitor allows you to view (remotely over the internet):
•
Tables of alarms that have been triggered by events around the PV Plant
•
Current operation of the PV Plant
•
Graphs of historical values recorded around the PV Plant
Typically you would use the PV Clinics Monitor software if you had received an alert about the plant via
Email or SMS. For acknowledging and handling alerts the software lets you:
•
Investigate the cause of the fault remotely
•
Accept any alarms
•
View measurements and diagnostic messages from devices around the plant
•
View graphs of plant operation both current and historical
Access to areas of the PV Plant is governed by the user settings configured using PV Clinics Editor software
(as described in the installation manual).
You can set up links to several PV Plants using the same software on the same computer/laptop. The software allows you to perform diagnostic checks around the plant, if there are Ethernet connections back to the
Plant Room PC where the database is stored.
1.2
Installing the software
There are no options to select, simply run the file PV-Clinic Monitor.msi to install the program on your
PC. The file is on the USB stick supplied with your software, alternatively you can simply ask us for the latest
revision.
1.3
Welcome screen (Site list)
The welcome screen provides a list of links to PV Plants. Along the bottom of the page are command buttons
which allow you to Add (New), Edit and Delete links or to ‘Connect’ to the selected link. Click on a link to
select.
1.4
Site editing screen
If you click the Edit or the New button, the site link editing window will appear as shown. Enter the details for
the PV Plant that you wish to browse. Details are:
Site Name – a name used to describe the link in the site list so you can write anything you want here.
Host - fixed IP of PV Plant control room PC. If you are running PV Clinic Monitor on the control room PC put
localhost in as the host name.
DB Name – the name of the PV Plant database.
User Name – User Names are case sensitive. You can select the required format for site usernames
(Group.UserName or UserName) in PV Editor.
6
PV Clinics Monitor User Manual 21/07/11 01.00
www.weidmueller.com
2.
Main screen description
2.1
Overview
The main screen has three tabs:
Online Values – The online values Tab allows you to view the current (On-Line) communications status and
current measurements from Custom devices and String boxes around the plant.
Historical – Historical Tab gives you access to a system of Graphs showing trends around the plant. It also
allows you to query information for export to Excel.
Alarms – The Alarms tab shows a list of current (On-Line) or Historical alarms in tabular format. It allows you
to find out more detail about an Alarm condition, comment on them and acknowledge them. Once an alarm
condition clears it is moved from the On-Line to the Historical database.
2.2
Security
In the left hand side pane of the main screen is a system tree representation of the PV Plant. This tree will
only show devices which the User is allowed to view. To change the settings for each user your system administrator will have to use the PV Clinic Editor program (described in the PV-Clinics Installation Manual).
3.
Online Values Tab
3.1
Overview
The Online Values Tab has a system tree representation of the PV Plant in the left hand side pane. It is divided up into three sections, which you can select to display detailed information in the right hand pane:
Communications – shows a table of the communication status between the PV Plant Control Room Computer (Running PV Clinics Runtime) and each device in the network.
Custom Devices – shows the measurements from any custom devices that have been included in the PV
Plant. Typically these will include readings from Inverters, Weather Stations and other Modbus Devices from
various manufacturers.
String Boxes – shows the string currents and voltages measured around the PV Plant.
The large headline at the top of the Tab shows the total power production of the PV Plant in kW.
3.2
Communications
The communications Tab shows a table of communication status. There is a row for each custom device/string box. In the first column the status is show as Error (on a red background) or OK (on a green
background). In the example below string box cb1_east on communications device Inverter1StringBoxes is not responding however all other devices on the same communications link are
OK.
If the status is blank it is either waiting to update or you do not have permission to view the Custom device or
string box.
The text (“Communication Status”) at the top of the table is green if all links are functioning correctly (and red
otherwise).
8
PV Clinics Monitor User Manual 21/07/11 01.00
www.weidmueller.com
3.3
Custom Devices
Selecting a custom device allows you to see all the readings for that device. The top headline shows the time
the data was last updated in green. If the headline (above the table) shows red then the On-line database in
not being updated, i.e., PV Clinics Runtime may not be running on the Plant room PC.
Select a group to see a list of all devices in the group.
3.4
String Boxes
Selecting a string box allows you to see all the string currents for that string box. It also shows totals, temperature and average values in the headline along with the time the data was last updated.
Select a group to see a table of totals and average values for each device in the group and the total power
created by that group of string boxes (shown in the headline above the table).
Note: If the headline shows red then the On-line database in not being updated, i.e., PV Clinics Runtime
may not be running on the Plant room PC.
10
PV Clinics Monitor User Manual 21/07/11 01.00
www.weidmueller.com
4.
Historical Tab
4.1
Overview
The Historic Tab allows you to look back at specific details of the plants operation and export historical data
about the plant as .xml type Excel spreadsheets.
4.1.1
Display areas
The historical Tab pane is split into three horizontal areas, starting at the top these are:
•
Query table – this area is where the results of a query on the database are shown as a table. The
records shown in this table are available for export and are used to draw the graphs in the Graphical
display.
•
Historical Graphic display – this area shows the data in the Query Table as a continuous graph.
There are controls that allow you to examine different areas of the graph, change the pens, horizontal and vertical scaling, zoom in and out, etc.
•
Graph key – shows the pen colours assigned to each line on the chart and other useful data about
each measurement (maximum, minimum and average values).
You can vary the size of the panes by dragging the border between them around.
4.2
Query Table
4.2.1
Selecting the data for the Graph
To start analysing the Historical data you will have to select a set of data to view in graphical form or Export.
The first step is to query the MySQL database and you start this process by pressing the Query button:
The Query Design Screen (see picture above) will be shown. In the example shown we are looking at a Custom Query called ‘Conversion check’.
To run the selected query, click the OK button at the bottom right of the screen. PV Clinic Monitor will display
a screen that allows you to define the pen colours for each graph trace. Go to the Graphical interface section
for more information.
4.2.2
Preset Queries
Select a string box or custom device name from the System tree in the right hand pane for preset queries.
Once you have selected a preset query you can check or uncheck the boxes next to the different data types
to have them included or excluded from your query. The screen also gives the option of adding a ‘WHERE’
clause to the query.
Note: there are preset queries available that summarise String Box Group Data. They appear below the
group with names in the format group.summary.
12
PV Clinics Monitor User Manual 21/07/11 01.00
www.weidmueller.com
4.2.3
Adding a WHERE clause to a query
Click the checkbox to use a where statement. You can use any MySQL ‘Comparison Operator’ that works for
the version of MySQL that the site uses. These do not vary much between versions and a full list can be
found on the MySQL website.
To find the name of data field for the comparison, double click on a row in the query table. The data definition
screen (shown above) will open and you can cut and paste the ‘DB Field’ value to use in the WHERE clause.
Note: be aware that some DB fields may contain NULLs.
4.2.4
Query timeframe and interval
The top of the query design screen allows you to select the timeframe and the interval between readings.
You can either use the “Last Dates” selection (to view the most recent data) or specify a specific time period
for the query. Long timeframes and short intervals may lead to queries that take a long time to run so keep it
simple.
4.2.5
Adding a Custom Query group
By default the Query Design Screen as a single group (“Personal”) to keep Custom Queries in. You can
manage the folders using the New Group and Delete group buttons.
4.2.6
Adding a new Custom Query
To add a new custom query to a new group use the New Query button at the custom query group level. You
can also add and delete queries when a custom query is selected.
14
PV Clinics Monitor User Manual 21/07/11 01.00
www.weidmueller.com
4.2.7
Designing a custom query
Custom query command line buttons
Once you have created a new Query with the New Query button, you will need to make up the set of data
(from database fields) to be included. The DB Fields are show in table format and at the bottom of the table
is a command line. The buttons on the command line work as show below:
Icon
Button
Action
New
Add a new data line
Edit
Edit the currently selected line
Delete
Delete the current data line
Copy
Copy the current data line to the clipboard
Paste
Paste from the clipboard to after the current position
Shift
Shift the currently selected line up and down the table
OK
Run the selected query
Cancel
Exit without running the query (changes will still be saved)
Select
Select all data lines (for inclusion in the query)
Deselect
Deselect all data lines (no data will be included)
Note: You can copy data fields from any of the preset queries using the copy and paste buttons.
Defining which PV Plant measurements to include in a query
When you click the New or Edit buttons the Data Definition screen will show. To define the DB Field press
the Select button (
). The Data select screen will show (see below). The data select screen allows you to
pick any measurement from around the plant to include in your query. When you have selected the DB Field,
values will be filled out automatically for the Name and Description. You can edit these if you like.
4.2.8
Exporting historical data
After the query has been run by clicking the OK button you can export the data table using the Excel export
button.
16
PV Clinics Monitor User Manual 21/07/11 01.00
www.weidmueller.com
4.3
Historical graph display
4.3.1
Overview
The historical graph display provides a powerful tool for analysing the performance of your PV Plant. The
example above shows the total power output for five arrays. As you can see from the graph, arrays q2_5 and
q2_4 (the yellow and gray traces) are underperforming in relation to the others. Another query to separate
out each string of q2_5 could be used to identify the reason for this difference. Note also that the total output
of array q2_3 (purple trace) is shifted toward the end of the day.
4.3.2
Controlling the graph display
There are a number of command buttons you can use to alter the display. You can also select an area or the
graph to view in detail. In the example above, the data for a single day was selected from a far wider set of
data. The controls operate as shown in the table.
Icon
Button
Action
Pens
Choose colours for each trace and decide which data to include
Multi-Axis
Show all the traces on the same axis (toggles setting)
H. Zoom
Expands the display vertically to fit the window (toggles setting)
Time
Allows you to measure an interval on the graph
Label
Adds labels to each point on the graph (toggles setting)
Print
Prints the graph
Shift display
When you have zoomed in to an area, shifts the display across
Days
Select how many days data to show from the query data
Zoom
Select a percentage zoom to show more detail
Cancel Zoom
Cancel the zoom level
4.3.3
Selecting the pens
Press the pens button to see the Pens Configuration window. You can add or remove data from the graph
and or change the pen colour and thickness. You will also see this screen when you first run a query to select data for the graph.
Note: it is quicker to design a query with all the information that you want and use this screen to add and remove traces because PV Clinics Monitor does not have to query the database for the data again.
In the original example, we could select temperature and wind speed for display so we could see the effect
on q2_5 power. Maybe the underperforming array is closer to the middle of the park or is out of the wind and
that has affected its output.
4.3.4
Measuring an interval on the graph
Click the Time button to measure an interval on the graph. Then hold down the control key and click the
mouse on the graph to define the start point. The interval between the start and the cursor is displayed in a
yellow box next to the cursor.
18
PV Clinics Monitor User Manual 21/07/11 01.00
www.weidmueller.com
4.4
Graph key
The graph key pane shows the pen colours assigned to each line on the chart and other useful data about
each measurement (maximum, minimum and average values). There are no controls associated with the
graph key.
5.
Alarms Tab
5.1
Overview
The Alarms Tab gives a quick display of any current (On-Line) or past Alarms that have been triggered
around the plant. It allows service personnel to acknowledge alarms and put notes against them to describe
the cause.
5.2
Display areas
Alarms are listed in simple Table format. You can double click on an alarm to acknowledge it and add a
‘User Comment’ to the record.
5.3
Alarm Status
As alarms are acknowledged and cleared the colour of the first column changes as shown in the table.
Colour
Status
Orange
Unacknowledged, active alarm
Yellow
Acknowledged, active alarm
Green
Acknowledged, inactive alarm
Once and alarm condition has cleared and the alarm has been acknowledged, PV Clinics Runtime moves it
into the historic table.
20
PV Clinics Monitor User Manual 21/07/11 01.00
www.weidmueller.com
5.4
Acknowledging alarms and adding comments
Double click on an alarm to acknowledge it. The date it was acknowledged will be completed automatically
and the Alarm acknowledge screen will be shown. You can add comments to the alarm acknowledge screen.
Press OK to save the changes or cancel to discard.