1
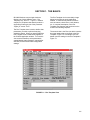
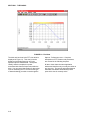
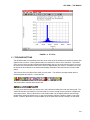
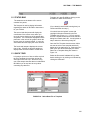
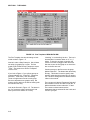
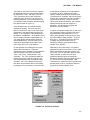
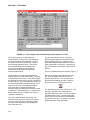
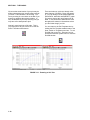
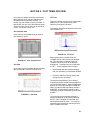
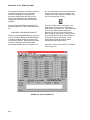
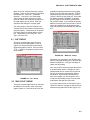
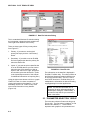
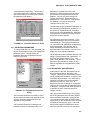
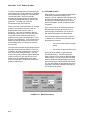
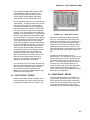
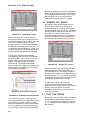
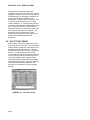
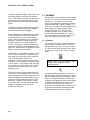
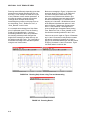
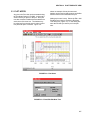
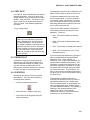
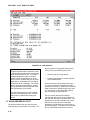
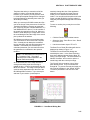
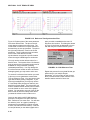
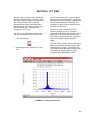
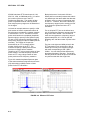
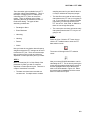
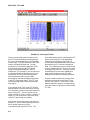
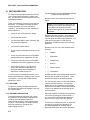
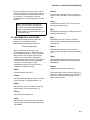
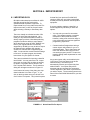
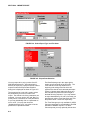
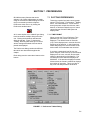
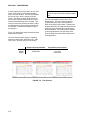
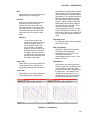
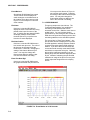
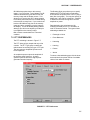
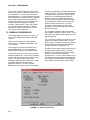
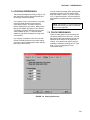
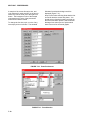
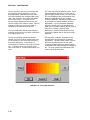
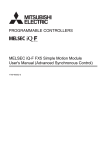
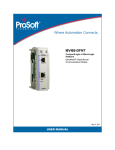
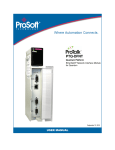
SECTION 2. PLOT TEMPLATE VIEW
Many of the Plot Template items are grouped
together. There are five of these groups which
are labeled “On”, “Data File”, “Parameter
Selection”, “Auto Scale”, and “Smoothing”.
These groups all have eight rows of check
boxes or buttons in them which correspond to
the eight graphs you can define. Each row
represents the settings for a single graph.
The lower portion of the Plot Template view
contains various items that are not specifically
grouped together. These items do not pertain
to a single graph but instead affect the entire
plot. These items are “Primary File”, “Plot
Type”, and “Plot Title”.
probably be plotting parameters on the graphs
that all come from the same data file. ID-2000
simplifies this procedure by having you load a
“primary” data file for the entire plot. If the Data
File button is labeled “PRIMARY” it indicates
that the graph will use whatever primary data
file you have loaded. If you change the primary
data file for the plot (we’ll tell you how to do that
later in this chapter) then all graphs that were
using the primary file automatically are changed
too!
2.1 “ON” GROUP
This group contains eight check boxes for
turning each of the eight graphs on and off
(Figure 2-5). Clicking the left mouse buttons
toggles the graph on and off. If the box has a
“X” or “√” inside it, the graph is turned on and
will be plotted.
FIGURE 2-6. “Data File” Group
Sometimes you may want to use different data
files for each graph allowing you to analyze data
between multiple files. This type of analysis is
called multi-file plotting.
FIGURE 2-5. “On” Group
Let’s say you were looking at temperatures from
a remote weather station. Perhaps you have
separate data files for several 24 hour periods
and you would like to compare them against
one another. By selecting a different file for
each of the graphs you can compare or even
overlay the data making it easy to see how the
temperature changed from day to day.
2.2 “DATA FILE” GROUP
This group contains eight buttons for selecting
the data file to be used for each of the eight
graphs (Figure 2-6). Most of the time you will
If you click (using the left mouse button) on the
“Data File” button for a graph you will see the file
selection dialog that looks like this (Figure 2-7):
2-3