1
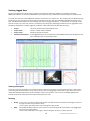
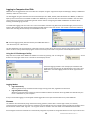
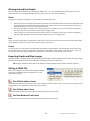
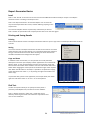
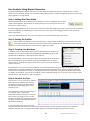
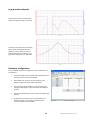
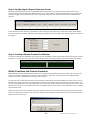
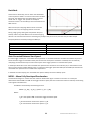
Step 5: Viewing the Data in a Graph Screen
To view any of the runs that the Report Generator window has captured first click the ‘Stop’
icon or press the ‘F3’ key to stop the Report Generator software scanning live data. Then click
the ‘Graph’ icon from whichever run you wish to view. This will then open the Graph screen,
loaded with the data from the selected run. If you wish to compare another run from the
data in the Report Generator window, click on the ‘Graph’ icon for the selected run and
select one of the ‘Compare Run X’ icons to load the second file as a compare file.
62
VBOXTools Software Manual Version 1.11