1
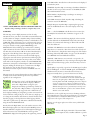
you double-tap the center point of the airspace (at wider view levels
there is a small dot there). This will show you the airspace, altitude
limits, last regular hours of operation, and even the controlling
facility frequency.
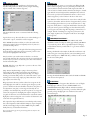
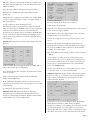
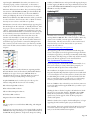
TOPO (Surface Features) Tab: Display options regarding
geographic features and terrain. In the Surface Features box, you
may display the lakes, highways, cities, state lines, and towers. You
may optionally display the name of the cities, lakes and highways.
Placing a check in the box next to Urban Areas will allow the user to
see the outer boundaries of urban areas in a slightly darker color
than the surrounding terrain. You can also choose to display
loitering-sensitive objects such as stadiums and nuclear power plants,
and may optionally display the 3 nm veil that surrounds them.
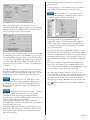
Data Tags are approach/departure frequency tags that appear around
some of the higher density airspace. When zoomed out, there is a
small green dot on which you can tap to see the frequency. When
zoomed in, the dot is replaced with a rectangular box in which the
frequency is displayed.
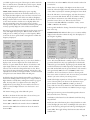
In the Terrain Elevations Map section, you can choose whether to
display terrain. Terrain is depicted in colored tiles that denote
elevation of a point within that tile. The size of each tile is 1 mile
square (high resolution at close zoom levels). Terrain resolution
increases as the zoom level is changed from wide to close. This is
done to keep the map performance optimized. Terrain color is also
adjustable. You can choose from light, medium, or dark. In the dark
setting the lower terrain altitude will be rich dark green.
In the light setting the low altitude terrain will be very light green.
Terrain color shading transitions from green to orange to brown at
higher altitudes to finally white, making the mountain tops appear
white. You may wish to use a lighter terrain color during the
daylight hours if you are flying in an area with low elevations to
improve contrast. In higher elevations it is often better to use a
darker color.
The Terrain Settings group select additional options:
Red Above: In this mode the terrain that is above and near your
GPS altitude is shown in 3 special colors:
Terrain 1000’ to 500’ below the aircraft is shown in YELLOW
Terrain 500’ to 200’ below the aircraft is shown in ORANGE
Terrain less than 200’ below and all terrain above the aircraft is
shown in RED
Terrain that is more than 1000 feet below the aircraft is rendered in
normal colors.
Values: Turns on the display of the highest terrain value in each
terrain tile. This is the highest elevation within that tile (in hundreds
of feet) This is very handy for estimating the height of terrain ahead.
Above Alt: This turns on terrain mapping only when the terrain is
above your current GPS altitude. This can be useful for reducing
screen clutter in mountainous areas while still seeing terrain of
particular concern (above you). This mode can be used in
conjunction with RED ABOVE to include the “nearby” terrain
(1000’ to 200’ below the aircraft).
Lat/Long Grid: Enables the drawing of Latitude and Longitude grid
lines on the map.
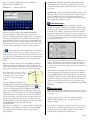
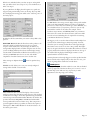
FORMAT (FMT) Tab: FMT tab allows you to set various ancillary
display features that either enhance the map, the data displayed, or
the navigation capability.
GPS Altitude: Displays GPS derived altitude in the upper right
corner. Note that GPS altitude is actually very close to the correct
geometric altitude, but it may vary significantly from the altitude
indicated by a pressure altitude, depending upon the altitude AGL
and the local deviation from ISA temperature. Temperatures +20C
above ISA standard will cause the pressure altimeter of the aircraft to
read approximately 200 feet low for each 5000 feet AGL. Cross
Track Error: Your course deviation is shown on the map in the
lower screen center in tenths of a mile. An arrow shows you in which
direction your course is from your current position.
VNAV: This displays required rate of descent data in the lower right
corner of the map when your descent to the destination airport
pattern altitude (assuming 1000’ PA) is 250 ft. per minute or
greater. This box must also be checked to show VNAV information
in flight plans. For more information see VNAV Concepts on page
12-13.
Lat/Long: Your current position in latitude/longitude is shown in
the bottom left corner of the map.
Track History: This feature leaves breadcrumbs (small dots) along
the path flown.
Bold Course Line: This function places a heavy black line on either
side of the flight plan course line in normal flight. The course line is
green for the active leg and aqua for all other legs of the flight plan.
Statute Miles: This toggles all map data between statute miles and
nautical miles.
Page 10