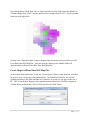
1
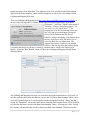
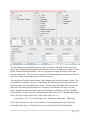
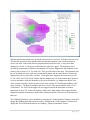
indicates that the maximum value for all the selected curves was used. If all the colors are set to
255 then the grid cell is white and this indicates that the minimum value for all the selected
curves was used. If the brine data was proportional between the wells, i.e. they brine data
changes by a factor “A” then you would expect the color to be grays. The brine data is not
necessarily proportional, in that the concentration of Calcium, Magnesium and Strontium is the
same by only a factor of “A” for each well. This gives the color of the map. The Strontium will
be at a maximum for some wells and a minimum for others and the same for the Calcium and
Magnesium will vary across the well area. As the plot above suggests the Green areas at well
15-191-10055 and 15-191-10107 implies that the Magnesium is at its maximum and Calcium is
set at its minimum, while the Strontium is also at its maximum, e.g. Magnesium (Red) Color
value is about 0 and the Calcium (Green) Color value is about 255 and Strontium (Blue) Color
value is about 0. The Red-Green-Blue color mix is Green. The area around the wells 15-19121608 and 15-191-10059 in the upper left area suggests that all the brine data are at their
minimums or set to 255, which will display a white color. Dark purple colors suggest that the
Magnesium and the Strontium are both at their minimum and the Calcium is at its maximum in
that area.
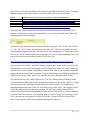
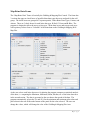
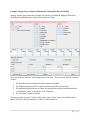
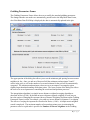
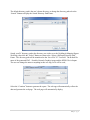
The Gridding Parameters can be modified by selecting the “Grid Parameters” Button, which will
change the gridding pattern between the wells. Clicking on the “Grid Parameters” Button will
display the “Select Search Parameters for Gridding – Input to Simulation” Frame.
7|Page