1
Software get red-y 5 Operating instructions Operating software for the thermal mass Handbuch PCU1000 flow meters and controllers red-y smart series TetraTec Instruments GmbH Gewerbestrasse 8 | 71144 Steinenbronn Tel. +49 (0)7157 53 87 - 0 | Fax -10 www.tetratec.de | [email protected] Vögtlin Instruments AG – flow technology Langenhagstrasse 1 | 4147 Aesch (Switzerland) Phone +41 (0)61 756 63 00 | Fax +41 (0)61 756 63 01 www.voegtlin.com | [email protected] Software get red-y Get red-y 5 software operating instructions Operating software for the thermal mass flow meters and controllers red-y for gasflow Version: get_redy_E1_5 For the latest information on our products, see our website at www.voegtlin.com © 2013 Vögtlin Instruments AG, Switzerland Manual Version get red-y Software get_redy_E1_5 Page © Vögtlin Instruments AG 02 Software get red-y Copyright and Liability Disclaimer All rights reserved. This publication or even just parts of it may not be reproduced without prior written permission of the publisher. The contents of this instruction manual are intended exclusively for information purposes. Vögtlin Instruments AG assumes no responsibility or liability for any errors or inaccuracies in this publication. This symbol alerts the user to important operating, maintenance and service information. Subject to change Due to our policy of ongoing product development, we reserve the right to change the information in this manual without prior notice. Manual Version get red-y Software get_redy_E1_5 Page © Vögtlin Instruments AG 03 Software get red-y Contents Copyright and Liability Disclaimer 3 Contents 1. Introduction 4 5 1.1 System requirements 5 1.2 What we supply 5 2. Setting Up the Workstation and Software 7 2.1. Installation 7 2.2 Setting up the RS485 interface 9 2.2.1 Driver software 9 2.3 Setting up the get red-y 5 software 10 3. Functions 16 3.1 General 16 3.2 Tabs 17 3.2.1 Connection Tab 17 3.2.2 Overview Tab 17 3.2.3 Adjustment tab 18 3.2.4 Parameters Tab 21 3.2.4.1 Alarm Settings 22 3.2.4.2 Measurement Range 25 3.2.4.3 Display filter 26 3.2.4.4 Analog signals 27 3.2.4.5 Tools 29 3.2.4.6 Backup 30 3.2.4.7 Profibus 32 3.2.4.8 Pressure controller 34 3.2 .4.9 Copying Gas Records 40 3.2.4.10 Functions/Set-point delay 41 3.2.4.11 Display 42 3.2.5 Data Logger Tab 44 3.2.6 The Mixer Tab 51 ATTENTION: Vögtlin Instruments AG rejects any responsibility for the translation of this Software. 57 3.4 Licenses 57 3.5 License Dialog (License center) 58 4. Instructions with concrete example Adjustment 58 58 5. Appendix 70 Abbreviations 70 6. Change history 71 Manual Version get red-y Software get_redy_E1_5 Page © Vögtlin Instruments AG 04 Software get red-y 1. Introduction The get red-y 5 software is a parametrizing and operating software for mass flow meters and mass flow controllers as well as for pressure controllers of the red-y smart series of Vögtlin Instruments AG. Several devices can be addressed on one interface via a suitable communications connection (such as e.g. RS485). Additional functions/modules can be activated via a licensing system (see Chapter 3.4 and 4.5). get red-y 5 control elements will be highlighted in this document with square brackets. 1.1 System requirements Operation of the get red-y 5 software requires at least: Hardware: 800 MHz or faster processors 256 Megs RAM or more 25 Megs free hard drive space CD-ROM or DVD drive or an Internet connection for downloading Graphics card with 16 bit color resolution and a monitor with 800x600 resolution or higher Operating system: The software has been developed and tested for the Windows 2000/XP/Vista/Windows 7 operating systems. Interfaces: The software supports the RS232 and RS485 interfaces The user-defined text size (DPI) and other elements on the screen must be set to 100% (default) so that the software is properly displayed. Other settings are not supported by the get red-y 5 software. 1.2 What we supply Hardware accessories for connection to a PC (one device): 1 PDM-U USB-RS485 Adapter Item No. 328-2169 1 AC adapter plug PSD Item No. 328-2234 For additional accessories for operation with more than one device on a bus see „Cable accessories for red-y smart series“, datasheet 329-2014. Supplied Software: The software can be downloaded from the Internet: http://voegtlin.sharepointhosting.ch/DOCUMENTS/Forms/SoftwareRedy.aspx The software is also on each CD-Rom, which comes supplied with the devices. Get red-y 5 has been divided into different access levels –Functions/Modules. The Basic functions/modules from Table 1 are available to standard users. The additional functions can be activated via a USB-Dongle (available for fee). Manual Version get red-y Software get_redy_E1_5 Page © Vögtlin Instruments AG 05 Software get red-y Basic Software modules Display device information such as reading, temperature, valve voltage Logging&Mixing4 Adjustmentmodule4 Calibrationmodule4 4 4 4 4 4 4 4 Adjust display filter Log measurement data CSV export of logged measurement data Set dynamic range Set full scale of measurement range Gas mixing function Define process profiles Totalizer Specify setpoint & adjust control speed² Assign device name Switch units of measurement Visualize & adjust PID parameters / Graphic tool Operating state monitoring Zoom function 3 (Enlarging screen display of momentary flow rate for all connected instruments) Switch analog signals Reset totalizer Save device data Restore device data 4 (Only with day password) Update device firmware 4 (Only with day password) Registertool 4 4 (Only with day password) Set-point delay (from Smart4S on) Pressure power-up setpoint Manual adjustment (Benötigt ein red-y smart Referenzgerät) Automatic adjustment5 (Requires a red-y smart reference device) Verify calibration Copy gas data sets Gas mixing function Power-up setpoint pressrue (ab Smart 6) Alarm-LED deactivate (ab Smart 6) 1 Requires a USB dongle. Multiple modules may be combined on one USB dongle. 2 Only flow and pressure controllers red-y smart controller & red-y smart pressure controller 3 Magnifies screen display of momentary flow rate for all connected instruments 4 Must be released by Vögtlin Instruments AG 5 Requires a red-y smart reference device Table 1: The get red-y software is divided into Functions/Modules, which offer a variety of possibilities Manual Version get red-y Software get_redy_E1_5 Page © Vögtlin Instruments AG 06 Software get red-y 2. Setting Up the Workstation and Software The following components must be available for startup: - Computer - Communications cable PDM-U USB-RS485 Adapter - 24V power supply - Instruments or Controllers smart 3, smart 4, smart4S, smart5 power supply AC 110V .. 240V PDM-U power supply 24V U SB SMART3 / 4 Figure 1: Structure of the workstation 2.1. Installation Using get-red-y requires a one-time installation of the software on your PC. The setup.exe-file is located in the Program directory. Figure 2: Directory structure in the get red-y 5 Directory 2.1.1 Running Installation Please exit all opened programs before you begin installing. 1. Double-clicking on setup.exe starts the installation process. The installation start-up process allows you to define the language. The User manual will be installed in the language you select. The language of the software can be changed during operation. Select the language and then press the [OK] button to run the installation process. 2. The Welcome screen appears. Click [Continue]. Manual Version get red-y Software get_redy_E1_5 Page © Vögtlin Instruments AG 07 Software get red-y 3. The License Agreement appears. After carefully reading the agreement, choose „I accept the agreement“ and click the [Continue] button. 4. The menu for the Target folder appears. To choose a different Target path, click the [Browse] button to define your target folder. 5. Click [Continue]. The Select Start Menu folder menu appears. Setup will create the program shortcut in the Start Menu folder of Windows unless you have not changed the path. This folder has links to the User manual, to the get red-y 5 software, for uninstalling the software and a link to the website of Vögtlin Instruments AG . You will find detailed information about our products here. 6. Click [Continue]. The Select Additional Tasks dialog box appears. Here you can create desktop shortcuts to get red-y 5 and register file extensions. 7. Click [Continue]. The Perform Installation dialog box appears. This dialog box displays all the steps to be performed during installation. Click [Back] if you want to change the settings in the previous dialog boxes. 8. Click [Install] to perform the installation. Once the installation is complete the [Exit] dialog box appears. Press [Finish]. The get red-y 5 files have been successfully installed. Manual Version get red-y Software get_redy_E1_5 Page © Vögtlin Instruments AG 08 Software get red-y 2.1.2 Contents of the Installation directory Directory /lookup Content Files for adjustment of the devices. Please do not edit User manual for get red-y 5 License agreements User instructions for get red-y 5 Uninstall file. Double-click to begin uninstalling Executable file. get red-y 5 Software Software settings and device settings are stored in this file. Please do not edit Configuration files for the connection of external references Newest firmware versions for the standard smart series Bedienungsanleitung getRed-y_de.pdf EULA_DE.rtf Readme_de.rtf unins000.exe voeRedy.exe voeRedy.INI /Instrument/Instrument /SWUpdate Table 2:Contents of the Installation directory 2.2 Setting up the RS485 interface A connection to the device can be made via an USB – RS485 adapter. Vögtlin Instruments AG offers an adapter to the smart devices which is geared to the requirements. A female connector on the D-Sub plug is used to feed the 24V supply voltage. 2.2.1 Driver software Before the USB connector can be connected to the computer the driver software for the RS485 product must be installed. In the case of Windows 7 the driver will be automatically installed if an Internet connection exists. The Vögtlin Instruments AG installation CD contains one driver. The user must make certain that the driver is compatible with the operating system. You can find the driver software for the PDM-U USB-RS485 adapter on the Vögtlin Instruments website under http://voegtlin.sharepointhosting.ch/DOCUMENTS/PDM-U.zip Figure 3: PDM-U USB-RS485 Adapter Manual Version get red-y Software get_redy_E1_5 Page © Vögtlin Instruments AG 09 Software get red-y 2.3 Setting up the get red-y 5 software 2.3.1 Starting the software Double-click the Desktop icon or the program shortcut in the Start menu folder starts get red-y 5. The get red-y 5 software has many functions activated for standard users (Basic) activated (see Table 1 on Page 6) 2.3.2 USB-Dongle If you purchased one more licenses, plug your personal Dongle (key) into a free USB slot. This activates the optional functionalities / modules in get red-y 5. Figure 4: Dongle for activating optional functionalities/modules Abbildung 5 2.3.3 Setting the port Use the selection list (1st port) above in the center to select the COM port . Figure 5 shows an example with the port set to COM 4. 1. Interface 2. Search for device Devices List Status Dongle Figure 5: Setting the port The software has been activated by a USB-Dongle. For more information see Chapters 3.4 and 3.5. 2.3.4 COM-Port active? To determine which COM-port in your configuration is active, use the Windows Device Manager. You can open the Device Manager either from the Start menu or by clicking the blue question mark in get red-y 5. Manual Version get red-y Software get_redy_E1_5 Figure 6: Open the Windows Device Manager via the Control Panel or by clicking the blue question mark in get red-y Page © Vögtlin Instruments AG 10 Software get red-y Remove the PDM-U USB-RS485 Adapter in your current configuration. This updates the active COM ports in the Device Manager. The COM port which is deleted in the list is the port which you must enter in the connection parameters. Connect the USB-RS485 adapter again at the same place. Figure 7: Device Manager for the recognition of the correct COM port Settings for the port can be made in the Configuration dialog box. To open this dialog, press the [Settings] button in get red-y 5. Figure 8: Dialog box for setting the baud rate Note: It is recommended that you do not change the factory setting of 9600 Baud. Please keep in mind that changing the baud rate can have negative effects on the communication between the device and the software. Changes during communication with the device are not permitted. The baud rate in Device and in get red-y 5 must be set identically. Manual Version get red-y Software get_redy_E1_5 Page © Vögtlin Instruments AG 11 Software get red-y 2.3.5 Searching for Devices After clicking the [Start Search] button the program searches for all the devices and enters those it finds in the Device list. The search goes through all 247 modbus addresses in ascending order. The search can be ended as soon as all the devices on the bus have been found. Click the Stop Search –button to end the search. Search for devices: Search wheel begins to turn Found devices in the Device List Figure 9: Starting the search for connected devices 2.3.6 Enlarging the Device List If you have found more than 4 devices you can enlarge the Device List down so that all the connected devices are visible at a glance. To do this move the mouse to the bottom of the main window until a double arrow appears. Now you can enlarge or reduce the Device List. Move the mouse to the bottom until a double arrow appears. Now you can enlarge or reduce the list. Figure 8.2: Enlarging the Device List By means of Modbus RTU one master (e.g. PC or SPS) and several slaves (e.g. field bus devices, MFC/MFM) can communicate via a common communications channel (e.g. RS485). Please note that more than one device cannot have the same address. At the time of delivery all the devices are set to modbus address 247 (Factory setting). Please connect one device after another and assign the addresses in the correct order. You can find more information about modbus protocol here: http://www.modbus.org/ Manual Version get red-y Software get_redy_E1_5 Page © Vögtlin Instruments AG 12 Software get red-y 2.3.6 Changing Modbus Address Select the device to be set to another address from the Device List. Use the right mouse button to open the Context menu for changing the modbus address. Click the [Change Modbus Address] button. The following dialog box appears. You can assign addresses between 1 and 247. Make sure the addresses are not double assigned. If the addresses are double assigned the data exchange between get red-y 5 and the devices will be incorrect. The tabs can no longer be operated, in case the currently selected device in the Device List is inactive. Figure 10: Context menu for the currently selected device Context menu via right mouse button Click the [Accept] button to set the new address. Note: Not all functions/modules in the Context menu are available to the standard user (Register tool, Add to Reference list). Manual Version get red-y Software get_redy_E1_5 Page © Vögtlin Instruments AG 13 Software get red-y 2.3.7 Activating Device If there are many devices on the same bus it can be advisable to disable the devices which are not currently required (Off state). As a result the communication rates of the remaining devices on the bus will increase. Click the right mouse button within the Device List to display the Context menu in Figure 10. If the device is active (On state), you can disable the device by clicking the [Disable Device] button. Click the Remove Device button to remove a device from Device List. This device will be completely removed from get red-y 5. As soon as a connected device is no longer communicating, a message will be generated in about 6 seconds: „ The Device is not in communication with the red-y 5 software“. The device will automatically be set to the off state. Second device is in off state and get red-y (as Bus Master) makes no more requests on this device. Figure 11: Second device in the Device List is not released (marked light blue in the off state). The tabs of this device can no longer be selected, since no information for this device is being loaded via Modbus. 2.3.7 Changing Measuring point ID Select the device from the Device List for which the Measuring point ID is to be changed. The Measuring point ID can be entered as clear text with a maximum of 50 characters. It has no function in the device and serves only informational purposes for the user of the device. Use the right mouse button to open the Context menu for changing the measuring point ID. Click the [Change Measuring point ID] button. The following dialog box appears in Figure 12: Changing Measuring point ID Figure 13. Enter the desired name for the measuring point. Click the [Accept] button to accept the Measuring point ID in the device and display it in the Device List. Manual Version get red-y Software get_redy_E1_5 Figure 13: Dialog for changing the Measuring point ID Page © Vögtlin Instruments AG 14 Software get red-y 2.3.8 Zoom window Clicking the Magnifying Glass icon in the Device List opens the Zoom window for the corresponding device. This window displays the actual value of the device in any font size. To make changes in the process, you can also view the actual value changes from a greater distance (see Figure 15). When the window size is changed the font size will be adapted. Four actions can be set for a controller. In Figure 15 you see the Zoom window for a controller with the name „Measuring point 2“. Clicking the Magnifying Glass icon in the Device List opens the Zoom window for the selected device. Figure 14: Opening the Zoom window by clicking the Magnifying Glass icon You can enter a [Low Limit] and a [High Limit]. If you fall below the low limit, the purple bar at the bottom or on the top as in the window for „Measuring point 1“will indicate this. In addition a [Set point deviation %] can be entered, i.e. the set point and the actual value are compared. In case the deviation is greater than the percentage set point deviation you have entered, this will be indicated by red with a red lower or upper bar. Figure 15: Zoom window for both connected devices The actions are activated by selecting the [Execute Actions] button or become deactivated by selecting the [Do Not Execute Actions] button. Set-Actual value change: If the actual value deviates from the set point by 10%, the [Actual value] field in Figure 15 appears in red font. With this the adjustment time is displayed. Manual Version get red-y Software get_redy_E1_5 Page © Vögtlin Instruments AG 15 Software get red-y 3. Functions 3.1 General The get red-y user interface has 5 „logical subdivisions“ with which it is possible to interact and in which important information can be viewed and changed. A B C D E Figure 16: Logical structure of get red-y 5 for subdividing the functionalities F A. Menu: Basic functions such as Change Language, End Program, Open Manual and Start important Help tools (Register tool, Reference Device list) can be performed in the menu. B. Tabs: Device specific functionalities are subdivided with the tabs and displayed in logical groups. C. Popup Menus: Some places have Popup menus for quick and easy startup of functionalities. You can specify a filter which relates to the software display in the [Actual value] field. D. Device List: The activated device is highlighted with a blue bar. All tabs now relate to this active device. The small green dot in the Device List indicates the device for which data are being read. The small red warning icon indicates an alarm state in the device. You can inspect the alarm in the [Parameters] tab. Click the small red warning icon and you will automatically be taken to a view with which you can inspect the alarm state of the device. E. Left Status Bar: Displays the actions which are being performed by the user or by get red-y 5. F. Right Status Bar: Displays the license and the activated option. Manual Version get red-y Software get_redy_E1_5 Page © Vögtlin Instruments AG 16 Software get red-y 3.2 Tabs With Tabs you can select the different Function Ranges/Functionalities. The [Connection] and [Overview] tabs are always available. The remaining tabs are displayed according to the activated functions/modules (Dongle). G H I J K L Figure 17: Logical subdivision of the Tabs G. Connection-Tab (available by default): Setting communications parameters and independent search of devices. H. Overview-Tab (default): Tab which displays the main information (Actual-, Set point, Totalizer, SW- and HW-Version) of the currently selected device in the Device List. I. Mixer-Tab (optional):This function is new in get red-y 5.4.0.0. It is used to define gas mixtures and regulate the mixtures in different modes; see Chapter 3.2.6. (optional) J. Adjustment-Tab (optional): Adjustment of the devices; see Chapter 3.2.3 and 4.1. (optional). K. Data Logger-Tab (optional): Offers versatile display options and export functionalities in order to graphically represent and save information (e.g. set, and actual value) of devices. L. Parameter-Tab (optional): Tab with which the parameterization of the currently selected device and visual representation of the alarm states of the device are made possible. 3.2.1 Connection Tab This tab contains the parameters required for communication with the device. The first time the software starts up it searches for devices. When the software is started again it first attempts to load the same structure as before. If the software does not find the last connected topology the [Start Search] button must be pressed again in order to find the connected devices. If a device is found, the program automatically switches to the [Overview] tab. 3.2.2 Overview Tab The most important operating parameters of the currently selected device are displayed. (blue highlighted device in the Device List). For a device with Controller function (MFC, with valve) in Figure 18 left the set point can be entered. With the [Accept] button or with the [Return] button a new set point is communicated to the device. There is no set point for devices without Controller function (MFM, without valve) in Figure 18 right. With the [All Set points 0] button all MFCs in the Device List receive the new set point 0. For MFCs and MFMs the [Reset Totalizer] button resets the Totalizer to 0. The new value is then displayed in the Device List in the [Total] column. With the [Graph Tool] button the quality of the control parameter setting for an MFC can be graphically viewed and the parameters can be changed. The progression of the actual value can be viewed for an MFM. Manual Version get red-y Software get_redy_E1_5 Page © Vögtlin Instruments AG 17 Software get red-y This button always increases or reduces the last digit by one. Figure 18: Device view with Controller function (MFC) left and without Controller function (MFM) right. 3.2.3 Adjustment tab Note: This Function/Module is only possible with a valid license. The Adjustment tab is a tool for adjusting red-y for gas flow devices (smart 3 & smart 4). In the process in a first step the measured values of the device under test and of a reference device are entered in a list (Calibration). After that a correction is calculated (Transfer function), which is saved to the device. In principle an adjustment for each device is identical in structure. Here only the basic functions will be explained. You will find step by step instructions in Chapter 4.1 Adjustment. Manual Version get red-y Software get_redy_E1_5 Page © Vögtlin Instruments AG 18 Software get red-y F G E A B C D Figure 19: View in Adjustment mode of a smart 4 A. Preview: In Preview you can do a preliminary check on an adjustment with the specified measured values. No changes will be made to the device. A new window opens, in which the correction curve is graphically displayed. B. Adjustment: After the preview has been displayed you can activate the Adjustment tab. The active record of the device will be adjusted in accordance with the corrected values in the table. Warning: This function changes the device parameters! Vögtlin Instruments AG assumes no liability for the adjusted flow curve and its consequences. C. Undo: Each time an adjustment is performed a backup copy is saved on your PC. Use the Undo function to reset the device to the state of the last adjustment operation. D. Default Setting: When a preview is performed for the first time, the parameters are saved and stored in a file as the Default Setting. You can return to these settings at any time by clicking [Default Setting]. E. Reset: The measured values are reset in the table to the default values. F. More: Clicking the [More] button opens a new window on the right margin. In this window you can configure the columns displayed in the table. You can show or hide columns and fill the columns with fixed presettings. G. * Spot: A measuring spot is calibrated. In the process during the automatic adjustment 20 measurements are performed and entered into the table.(see Chapter 4.1). Menu items Manual Version get red-y Software get_redy_E1_5 Page © Vögtlin Instruments AG 19 Software get red-y When you change to the [Adjustment] tab the menu is automatically expanded by the [Adjustment] item. Three additional functions are available here. B A C D Figure 20: Displays the menu items in the Adjustment tab A. New File: The standard template with 10 measuring spots in the calibration list is loaded. B. Open Template: A template is loaded and the values of the template are entered in the table. C. Save as Template: A template can be saved for additional adjustment operations D. From End Value: The values in the [Cor. [%] ] column in the Table in Figure 20 represent the measurement value errors in percentages. When you select a row the end value errors are also given in percentages. Manual Version get red-y Software get_redy_E1_5 Page © Vögtlin Instruments AG 20 Software get red-y Popup in the Calibration list (Table) B A C Figure 21: The Popup menu is activated with the right mouse button A. Export as File: You can export the measured values to a file B. Export to Clipboard: You can export the input measured values to the clipboard and import them with [CTRL+V] to Excel (or the editor of your choice). C. Import Whole Column: Data from the clipboard are imported to the selected column. Note: In the process all data of the selected column will be overwritten from the first line. 3.2.4 Parameters Tab Note: Not all functions/modules are available to the standard user. The Parameters tab is divided into 9 different pages: Measurement range; Display filter; Analog Signals; Alarm Settings; Extra; Backup; Profibus; Pressure controller; Copy Gas Records. The page Alarm Setting, Analog Signals; Measurement range; Backup is available by default. Manual Version get red-y Software get_redy_E1_5 Page © Vögtlin Instruments AG 21 Software get red-y The other pages require a Dongle with a license for parameter activation or special controller settings. If there is an alarm for the currently selected device, the user will be notified by the red Warning icon in the Parameters tab Settings page view. and by the red bell in the Alarm 3.2.4.1 Alarm Settings The alarm functions are divided into 5 groups. Groups B+D appear only when an instrument with backflow detection or backflow measurement is connected. Click the [Reset All Alarms] tab to reset all active alarms. A B C D F E Figure 22: Alarm page with active alarm „Communications error“ The alarms in the 5 groups have the following meanings: A. Sensor-Alarms: The alarms relate to the sensor a. Communication error: A communications error between the sensor and the electronics has been detected. The measured values are probably incorrect. b. RAM-Write error: A write error has occurred in the RAM of the device. Selected RAM memory locations were unintentionally overwritten or the contents can no longer be read. Manual Version get red-y Software get_redy_E1_5 Page © Vögtlin Instruments AG 22 Software get red-y c. EEPROM Access error: Alarm for Access error to EEPROM memory. EEPROM could not be read or written. The correct function of the device can no longer be guaranteed. d. Totalizer value lost: The Totalizer value has been lost. The correctness of the Totalizer cannot be guaranteed. The EEPROM cell for storing the Totalizer values has reached its maximum number of possible writings and is no longer working reliably. In this case, each time the device is switched on a Totalizer value of zero is assumed. Totalizer values are no longer being saved in the EEPROM. In case alarms a. through d. are displayed, we recommend sending the device to your Sales Partner. B. Backflow measurement: A backflow is indicated by a red LED . The output signal for backflow measurement is as follows: 4-12 mA = Backflow; 12-20 mA = Forward flow. C. Controller-Alarms: a. Power-Up Alarm: The supply voltage to the device has been interrupted. b. No Parameter Values: No parameters were found. c. Flow at Control Value 0%: Despite a control value of 0% (Valve completely closed electrically) a flow greater than zero was measured. This can be an indication of a valve that is no longer sealing tight, an internal leak or a zero point offset. This alarm is only active in the case of a flow controller. d. No Flow at Control Value 100%: Despite a control value of 100% (Valve completely open electrically) no flow was measured. This alarm is only active in the case of a flow controller. When the valve overload protection is switched on an alarm will only be set once. After the acknowledgement of the alarm it will no longer appear until you power on again. e. No Flow Change: The control value for the valve was lowered or enlarged, but the measured flow does not change. This alarm is only active in the case of a flow controller. f. Analog Input Alarm: The analog set point is outside the permitted range (21.6mA, or 10.8V) g. Current Input Alarm: The current at the analog input is too high. It will be switched to the voltage input for 4 seconds in order to protect the circuit. This will be repeated until the current lies within the valid range. D. Backflow detector-Limit: Backflow monitoring can be set in a range of 0-20% of the measurement range-end value. Enter this value in the editing box with the designation [0..20%]. After that the [Accept] button appears. Click this box in order to save the change. In case the negative flow exceeds the set limit an alarm is activated, which is indicated with a red LED . An instrument with an output signal of 4-20 mA generates a signal of 2 mA when the limit is exceeded. This function only possible with one instrument. E. Plausibility check: Here you can set the delay time after which an active alarm should be displayed. This delay time only applies for the following alarms: No Flow at Control Value 100%; Flow at Control Value 0% and No Flow Change. To use this plausibility check for the alarms, enter a value in seconds and confirm your input with Return. After that the [Accept] button appears. Press this button to save the change. F. Alarm-LED deactivate: If this function is checked the alarms on the right side of the window [Controller alarms] are not shown on the LED of the device. All the other alarms are shown since the functional capability is not warranted any more otherwise. This function is available for Smart6 with firmware versions greater than 6.0.10. Manual Version get red-y Software get_redy_E1_5 Page © Vögtlin Instruments AG 23 Software get red-y For regulators you can set valve protection mode. This mode is illustrated in Figure 23. A B Figure 23: Alarm page for switched on valve overload protection A. Valve overload protection: If you activate this field the control valve will be protected from overload. In the case of an interruption of the gas supply the control valve goes over to a continuous control mode, which becomes audible via a „clicking“ ca. every second. This spares the control valve so that it won’t have a massive „overshoots“ when the gas supply is activated again. This protection is activated upon delivery. We recommend leaving this function switched on. B. Alarm-LED deactivate: If this function is activated the alarms on the right side of the window [Controller alarms] are not shown on the LED of the device. All the other alarms are shown because the functional capability is not warranted any more if such a alarm is on. This function is available for Smart6 with firmware versions greater then 6.0.10. Manual Version get red-y Software get_redy_E1_5 Page © Vögtlin Instruments AG 24 Software get red-y 3.2.4.2 Measurement Range Note: This Function/Module is only possible with a valid license. On the Measurement Range page the gas type can be converted by default, provided the instrument has been calibrated with additional gases. In addition the flow unit can be adapted. The Measurement Range has the following functions: A B D C E F Figure 24: Measurement Range page for setting the current gas type and other parameters The parameters have the following meaning: A. Gas type: Provided the device has been designed for several gas types, you can convert the gas type. Select the appropriate gas type and click the [Accept] button. The control parameters for the control valve and any other operating conditions are stored in each Gas Record. B. Unit: The unit for the flow measurement can be converted. Please note the corresponding reference temperature of the units. C. Range: The measurement ranges end value can be changed within certain limits. You require the appropriate access rights to do this. D. Dynamics: The measurement range is limited below by the dynamics. The smallest measurement value is defined by the following relationship equation: Range Minimum Dynamics You require the appropriate access rights to do this. Please consult your sales partner. E. Minimum: Displays the smallest measurement value. This value is automatically adapted when the dynamic range is reprogrammed. (Item D). F. Unit related to: In case the unit is converted in B, the physical reference quantities of this unit are included in the display. You can select your own standard conditions here. Manual Version get red-y Software get_redy_E1_5 Page © Vögtlin Instruments AG 25 Software get red-y 3.2.4.3 Display filter Note: This Function/Module is only possible with a valid license. The Display filter page sets the measurement value and display filter. In the case of flow controllers the step response can be analyzed. In the case of a change of the position of the slider the set filter behavior is directly transferred to the device. The Display filter page can be divided into 3 logical groups –A,B,C. C A B Figure 25: The Display filter page for setting the measurement value and display filters A. Measurement value filter: The values of the measurement value filter are the input parameters for the PID-Control circuit (MFC) and in addition are the input parameters for the display filter. In the case of the measurement value filter it is a rolling mean filter with special dynamic behavior for optimum control. B. Display filter: The measured values of the device are filtered through the display filter. The filtered (damped) values are only used for the analog output and digital actual value display. C. Flow control: Changes to the measurement value filter have a direct effect on the control behavior. With the step response you can analyze how a change in the measurement value filter effects the control circuit. To do this enter the percentage values in the input boxes at Set point 1 or Set point 2 in Figure 25. (In % of the end value) After entering the set point presettings, you can change between Set point 1 and 2. Note: The PID-Control parameters are set with a specified measurement value filter. In the case of a change in the measurement value filter the PID-Parameters for this new measurement value filter should be checked. Manual Version get red-y Software get_redy_E1_5 Page © Vögtlin Instruments AG 26 Software get red-y 3.2.4.4 Analog signals The analog set point and output signals can be reprogrammed on site. Please keep in mind that a converted device should be correspondingly labeled. Vögtlin Instruments AG assumes no liability for damages which occur as a result of changing the signals. You can see the view for a flow controller in Figure 26. This page can be divided into 5 logical groups – A,B,C,D,E. B A E C D Figure 26: For the setting of analog signals and control mode for a flow controller A. Set point presetting: The analog input (current or voltage) is used for set point presetting. Select a signal format which reflects your technical circumstances. The analog input is always transformed (linear interpolated). This happens regardless of whether the controller gets the set point as analog or digital. Depending on the setting the unit is [mA] or [V]. B. Measurement value output: Represents the actual value of the analog output signal (Current mA or Voltage V) C. Zero suppression: The measured flow can be limited with this setting. If the measurement value is lower than the value set here, the instrument displays zero. D. Control mode: Here you can set the behavior of the controller. 6 different states can be set. a. automatic: Switching over the set point presetting source takes place automatically. Basically the analog input (current or voltage) is used for set point presetting. If a digital set point occurs (via ModBus, ProfiBus) the flow controller will assume this value. This corresponds to the default setting b. digital: The set point will be assumed exclusively via a digital port (ModBus, ProfiBus). c. analog: The set point will be assumed exclusively from the analog input. Manual Version get red-y Software get_redy_E1_5 Page © Vögtlin Instruments AG 27 Software get red-y d. manual: Deactivates the control function. Sets the control signal for the valve to the value which is preset in the Control Variable Control Valve tab (0x000a..0x000b). e. Set point 0%: Sets the set point digital to 0% of the end value. f. Set point 100%: Sets the set point digital to 100% of the end value. g. Valve 0%: Deactivates set point presetting and control function. Sets the control signal for the control valve to 0% (Valve closed). h. Valve 100%: Deactivates set point presetting and control function. Sets the control signal for the control valve to 100% (Valve completely open). E. Power-up value: This setting only makes sense if the same set point is to be used over a longer period of time. Once the device is supplied with 24 V it automatically goes to this previously set point. A digital or analog set point presetting is then omitted. This setting is only possible in the digital control mode. Figure 27 shows the Analog Signals page for an instrument. This page can be divided into 2 logical groups – A,B. A D Figure 27: Page for the setting of analog signaling formats and control modes for an instrument A. Zero suppression: The behavior is identical to the description of the controller B. Measurement value output: The behavior is identical to the description of the controller Manual Version get red-y Software get_redy_E1_5 Page © Vögtlin Instruments AG 28 Software get red-y 3.2.4.5 Tools Note: Not all functions/modules are available to the standard user. The Tools page is used to set important device functions and names. Changed settings are saved by clicking the [Accept] button. The Display filter page can be divided into 3 logical groups –A,B,C. A C B Figure 28: Setting important device functions and names A. Designation: Here you can enter the long Gas Name and the Measuring point ID. a. Measuring point ID: The Measurement Location Name can be entered as clear text with a maximum of 50 characters. It has no function in the device and serves only informational purposes for the user of the device. b. Long Gas Name: The Long Gas Name input box is available in the background once for each gas and can be entered as clear text with a maximum of 50 characters. It has no function in the device and serves only informational purposes for the user of the device. Manual Version get red-y Software get_redy_E1_5 Page © Vögtlin Instruments AG 29 Software get red-y B. Device Functions: Here you define the device function. a. Controller: If the Controller field is active, automatically all fields required for a flow controller are activated. (e.g. Control mode, Set point signals etc.) b. Totalizer: If the Totalizer field is activated, the measured values will be added up. We distinguish between two Totalizers. One is resettable and the other one is nonresettable. The resettable Totalizer appears in the Device List and can be reset to zero there. The non resettable Totalizer serves as an „Operating hours meter „ and is indispensable for measuring consumption. c. Negative Flow Detection: If this field is activated the limit for alarming is considered. You can set this limit on the Alarms page. Please note the description under „Alarms“. d. Negative Flow Measurement: If this field is activated the instrument also measures a backflow. Please note the description under „Alarms“. e. Profibus: If the device is equipped with a Profibus board the profibus communication can be enabled or disabled. f. Pressure controller: A flow controller can also be activated as a pressure controller. This option applies for devices with serial numbers > 100‘000. Please get in touch with your Sales Partner. Note: Changes in these tabs require detailed knowledge and understanding. Incorrect settings can impair the function. C. Totalizer: Here you can view the non-resettable Totalizer value. See Description B.b. Note: The meter reading of the Totalizer is saved in the EEPROM every 10 minutes. 3.2.4.6 Backup Note: You can only use the complete range of functions of the Backup page with a valid license. However, you can temporarily access the complete range of functions via a day password. Get in touch with your distributor to arrange for a day password. The Backup page lets you create backup copies. You can save the most important device parameters of devices here. Before making changes to a device, we recommend that you first create a backup copy. You can return to the original device setting at any time with the backup copy. The file is saved in a readable file format with the .vprm file extension. This file can be viewed with the editor of your choice and can be compared with other backup copies. Manual Version get red-y Software get_redy_E1_5 Page © Vögtlin Instruments AG 30 Software get red-y The Backup page can be divided into 5 logical groups –A,B,C,D,E. A B C D E Figure 29: The Backup page lets you create backup copies and compare device configurations A. Read: By clicking the [Read] button, the device parameters of the device are read out and displayed. This operation can take a few minutes. B. Save: The device parameters can be saved to a file with the .vprm extension by clicking the [Save] button. This file format in clear text can be compared with other versions. C. Device parameters: The current read device parameter status is displayed and can be viewed in logically contiguous parameters. D. Open: Clicking this button allows you to read device parameter states. These are displayed in C. E. Write: Clicking this button allows you to write the previously read device parameter status to the device. This operation takes a few minutes. Note: Setting incorrect parameters can impede the function of the device. Vögtlin Instruments AG assumes no liability for this! Please restart the software and the device after this operation. The Smart6 has a new functionality. A factory preset can be loaded i.e. the parameters which have been saved before shipping will be restored. If you click on the button [Restore] all of the factory preset parameters which have been stored on the device will be restored and all settings will be overwritten with this preinstalled factory preset. This process can last several seconds (30-45 sec). The device has to be then preselected in the window [Overview]. Manual Version get red-y Software get_redy_E1_5 Page © Vögtlin Instruments AG 31 Software get red-y F Figure 28.2: If the button [Restore] is clicked the factory preset is restore. F. Restore: Restores the factory preset in the device. All of the parameters are overwritten with the parameters from the shipped factory preset. 3.2.4.7 Profibus Note: The Profibus page is only active when an appropriate interface is available. The Profibus page and pressure controllers are located in Options 2 of the Parameters tab, since they are bound to special device configurations. The Profibus page is used to set the Profibus parameters. The devices of the red-y smart series support cyclical (DP-V0) and acyclical (DP-V1) communication. In the case of cyclical communication the information is exchanged in a defined message cycle between the master and the slaves. For complex field bus devices cyclical communication is often no longer sufficient. For this reason acyclical communication DP-V1 was introduced. This type of communication takes place parallel to cyclical communication. It is often used in order to change acyclical parameters in the field bus device. In other respects the acyclical parameters serve the purpose of making free access possible to random parameters, changing cyclical communication during the process and transferring data of variable length. The telegraph structure is modular, i.e. it is divided into slots/indexes. This is identical to what is found in slot-oriented, programmable logical controllers. A suitable analogy is the addressing of letters, in this analogy the street corresponds to the slot (plug-in Manual Version get red-y Software get_redy_E1_5 Page © Vögtlin Instruments AG 32 Software get red-y module addressing) and the index corresponds to the house number (e.g. the output or input of the plug-in module or the addressed record). The Master sends an empty pack with the street and house number. The recipient accepts this packet and fills it with data of variable length and gives it back to the mail carrier with the same index/slot. For more information about Profibus go to this webpage: http://www.profibus.com/ The Profibus page can be divided into 2 logical groups –A,B. Click the [Accept] button to transfer the settings to the device. A B Figure 30: The Profibus page is used to set the Profibus parameters A. Profibus: Input the Profibus address. Valid Profibus addresses in the system operation range between 1 and 125. By default our devices come supplied with the factory setting address 126 -. Enter a valid address in the input box. If you do not wish to allow further address changes for the device, you can enable the [Block Address Change] check box. Note: The blocking of the Profibus address change does not go into effect until you restart the computer B. Acyclical Communication: If the [Indexed Access] check box is enabled, you can define the address and data slot here. The slot can be in the range 0x00..0xFF, the index in range 0x00..0xFE. Click the [Accept] button to save your settings. Manual Version get red-y Software get_redy_E1_5 Page © Vögtlin Instruments AG 33 Software get red-y 3.2.4.8 Pressure controller Note: This page is only active if a pressure controller is connected. The Pressure controllers page allows you to set the parameters of a pressure controller. The Pressure controllers page can be divided into 5 logical groups – A,B,C,D,E. Clicking the [Accept] button saves your settings to the device. A B F C E D G Figure 31: The pressure controller page is used to set the pressure controller settings A. Measuring point ID: Enter the Measuring point ID in the input box. (max. 50 characters) B. Set point: Enter the pressure set points here. Click the [Accept Set point] button to transfer the set point to the pressure controller. In Item C you can look at the settling time of the set point change. C. Display Pressure, Flow and Valve Load: The actual values are displayed here. In the case of an optimally set pressure control the actual values of the flow and of the valve voltage move in a specified range. It is easier for the first settings and for startup if you switch to Graph mode. Click the [Graph] button. D. Flow Limiting: With flow limit you can influence the overshoot behavior and the speed of the pressure increase. This limit also makes sense when a master/slave function is combined. Thus there is a guarantee that the measuring part cannot exceed its maximum end value. In the case of applications that tolerate an overshoot the flow limit can be disabled. E. Settings: You can set the most important parameters for pressure regulation here. Clicking the [Settings>>] button to go to a new window (See Figure 32, [Pressure control setting]). Manual Version get red-y Software get_redy_E1_5 Page © Vögtlin Instruments AG 34 Software get red-y F. Graph >>: Clicking this button opens a window that allows you to set the PID-Parameter records for the pressure controller. G. Pressure power-up setpoint: This setting only makes sense if the same pressure set point is to be used over a longer period of time. Once the device is supplied with 24 V it automatically goes to this preset set point. This setting is only possible in the digital control mode. This function is applicable for Smart6 with a firmware version greater than 6.0.10. Note: Changes to these enhanced parameters can cause malfunctions of the pressure controller. Note down the factory settings so that you can return to the original values at any time. Pressure control setting window Click the [Accept] button to save your settings on the device. This window can be divided into 4 logical groups –A,B,C,D. B A C D Figure 32: Enhanced settings for control parameter records A. Pressure measurement device: You can define the basic settings of the connected pressure controller here. a. Scaling Zero point: This corresponds to the zero point of the pressure transmitter. b. Scaling End value: This corresponds to the end value of the pressure transmitter. c. Pressure unit: The unit of pressure can be entered in clear text. This specification has no effect on the function of the device and is purely for informational purposes. Manual Version get red-y Software get_redy_E1_5 Page © Vögtlin Instruments AG 35 Software get red-y d. Control mode: Setting for the control function of the pressure controller. Here you can specify whether it is a (post)pressure controller or initial pressure controller. In the case of the initial pressure controller the pressure is regulated after the process (before the control valve). If the actual value is greater than the set point, the valve is opened (provided the direction of flow is 'Normal'). In the case of the (post)pressure controller the pressure is regulated before the process (after the valve). If the actual value is greater than the set point, the valve is closed (provided the direction of flow is 'Normal'). e. Running Mean Filter for Pressure Measured Value: This setting is used to attenuate the actual value of the pressure transmitter. In the input box you can set a value between 0 – 25. This value stands for the number of the measured value which is used for the running mean. B. Scaling: These two factors can only be read. C. Control setting: The pressure controller consists of a total of 5 complete control parameter records. Three of these records are preset by the manufacturer and cannot be changed. Two additional records (User 1 and User 2) can be changed by the user. Click the [Accept] button to accept the new PID-Parameters. D. Graph >>: Clicking this button opens a window that allows you to set the PID-Parameter records for the pressure controller. Pressure controller window Select the [Graph >>] button to display the window in Figure 33. On the left side you can click on predefined set point jumps. By repeating the same set point jumps you can follow the change to the PID-Parameters. The I parameter has the strongest influence on the overshoots. Based on experience it ranges between 5 and 50. In summary the following behaviors can be named for the PID-Parameters: P-Part I-Part D-Part Generates a control variable proportionate to the control deviation Eliminates control deviations Fast reaction to control deviation, fast correction Never regulates completely off Delayed reaction to control deviations Makes control circuit faster and improves the stability of the control circuit Tends to overshooting and worsens the stability behavior of the control circuit Table 3: Behaviors of the PID-Parameters You can find more information in the user manual for the red-y smart series. Due to a very high sampling rate of approximately 100ms high resolution data displays can be realized in different data views with export options. Manual Version get red-y Software get_redy_E1_5 Page © Vögtlin Instruments AG 36 Software get red-y The form can be divided into 5 logical groups –A,B,C,D,E. F B C A E D Figure 33: Graphic representation of the measured value signals for determining the control parameter records in progressive temporal representation of the diagram A. Displaying the measured values: The most important signals for the setting of the control parameters are represented in chronological sequence. It is very easy to achieve an optimization of the control characteristics with this. With the [Stop] button you can interrupt data recording. To begin display again with the [Start] button, the old measured values will not be saved and a new data recording begins. Click the [Pause] button to stop recording, click the [Pause] button again to continue recording. Right clicking the mouse button within the diagram allows you to copy the CSV format to the clipboard or save the diagram as an image. The CSV-Format can be easily copied to Excel with [CTRL+C]. This function is available only with special rights. B. Hide/Show Signals: Select the check box to show or hide the individual signals. Manual Version get red-y Software get_redy_E1_5 Page © Vögtlin Instruments AG 37 Software get red-y C. Switching the data views: The measurement data can be displayed in different ways and with this analyzed at different levels. Click the following buttons to display the data in different views. a. The data is displayed as a graph (see Figure 33 and Figure 34). b. The data is represented in tabular form (see Figure 35). c. The data is represented in a separate window (see Figure 35 right). This is quite helpful if you have a second monitor or if you wish to show the data in one window as a table and in the other window as a diagram d. The measurement data is represented in progressive chronological sequence (see Figure 33, i.e. only a specified chronological section within the diagram is shown. e. Click the button in Item d to switch the image of the button and the measurement data is displayed in chronologically compressed form (see Figure 34), i.e. all data of the measurement value recording is shown in one diagram. F E D Figure 34: Graphic representation of the measurement value signals for providing the control parameter records in chronologically compressed form D. Set point presetting: You can select fixed preset set point jumps here. With 2 freely selectable set point jumps the step response can be analyzed. E. Setting the control parameter records: See page 33 / Control setting. For more information see red-y smart user manual F. View Data Values: If your mouse is directly over a measured value of a graph, the Y-value of this measured value will be given. Manual Version get red-y Software get_redy_E1_5 Page © Vögtlin Instruments AG 38 Software get red-y Figure 35: Representation of the measured values in tabular form (left) and representation of the data in separate windows (right). Scrolling in the diagram You can scroll in the diagram, i.e. you can view all of the data. We recommend selecting the [Stop] or [Pause] button in case chronological progressive display was selected. To scroll in the diagram press the right mouse button and hold the mouse button down. Drag the mouse in the direction in which you wish to scroll. When you release the mouse button the diagram remains in the new position. Zooming in the diagram You can zoom in the diagram, i.e. sections in the diagram will be shown enlarged or reduced. To zoom press the left mouse button on the upper border of the range which you wish to zoom. Hold down the mouse button and drag the zoom area which you wish to look at by dragging to the bottom left until a rectangle has appeared which corresponds to your zoom area. To remove the zoom area press the left mouse button anywhere in the diagram and hold down the mouse button. You have to move to the upper left with the pressed mouse button and then release the mouse button in order to remove the zoom. Manual Version get red-y Software get_redy_E1_5 Page © Vögtlin Instruments AG 39 Software get red-y 3.2 .4.9 Copying Gas Records Note: This Function/Module is only possible with a valid license. The Copying Gas Records page is used to copy gas records. By default every device has ten data fields available for gas records. You can copy a gas record that has already been calibrated for the non-calibrated gas records. This function is only required in conjunction with adjustment. This page can be divided into 3 logical groups –A,B,C. A C B Figure 36: The Copying Gas Records page. In this example the gas record at position 1 is copied to position 4. A. Select Gas Record: Use the check box to select the active gas record. This selects the new gas for the current measurement. B. Button: Use the [Delete] button to delete the selected gas record. Note: If the calibrated gas records are deleted, the device can no longer perform any measurements With [Rename] you can assign a name to the gas record which will be displayed in the Device List. Choosing the [Copy] button copies a gas record to a new gas data position. It appears the dialog in C. C. Copy to: The current selected gas record in A is copied to the current gas position in the dialog in C. Once copying is complete, the copy of the gas record is in the position which you previously specified in the dialog box in C. Manual Version get red-y Software get_redy_E1_5 Page © Vögtlin Instruments AG 40 Software get red-y 3.2.4.10 Functions/Set-point delay Note: The set-point delay function is only available for the Smart4S (from serial number 150000). By default the devices come supplied without Set Value Delay. In the event of a change to the set value the new set value will be activated in linear fashion in accordance with the set delay time in ms. Figure 36 explains this. The set-point delay time was set to 3 seconds (3000ms). The blue graph shows the set-point. A set-point jump from 2 ln/min to 3 ln/min was set. You can easily recognize the linear approximated set-point delay within 3 seconds to the end value of 3 ln/min with the help of the red graph. Figure 36: Representation of the function for the set point delay. The blue graph illustrates the set point jump. The red graph is the reaction of the controller with a set point delay of 3 seconds. This page for the set point delay can be divided into 2 logical groups –A,B. A B Figure 37: Setting the set-point delay time A. Set-point delay active: Select the check box to activate the set-point delay function. B. Delay time: You can set the delay time here, i.e. how long the linear increase to the new set point lasts (see Figure 37). The delay time has to range between 200 and 65535 ms. Manual Version get red-y Software get_redy_E1_5 Page © Vögtlin Instruments AG 41 Software get red-y 3.2.4.11 Display Remark: The display is only available for Smart6 and only optional like the profibus. With this page Display you are able to configure the display settings. The new configurations will be sent to the device if you click the button [Apply]. It is immediately shown on the display. This page can be divided into 5 logical groups –A,B,C,D,E. A B C D E Figure 37.1 : Settings of the display. A. Measuring value 4 digits: If the checkbox is selected, then 4 digits are shown for the flow respectively pressure value. Otherwise, 3 digits are shown. B. Display rotation 180°: If this checkbox is selected the display is rotated with 180°. This function can be useful for different fitting positions. C. Row 1: In the top row of the display the actual value can be configured. a. Flow value:The actual value of the flow is shown and the unit of the flow is automatically adjusted in row 2 of the display. b. Pressure actual value: The actual value of the pressure is shown and the unit of the pressure is automatically adjusted in row 2. This function is only available for pressure controllers. D. Row 2: In the middle row the setpoints for the controller can be adjusted. The setpoint settings are only available for displays with key buttons. a. Flow setpoint: The flow setpoint is shown. b. Pressure setpoint: The pressure setpoint is shown. This function also needs a pressure controller. Manual Version get red-y Software get_redy_E1_5 Page © Vögtlin Instruments AG 42 Software get red-y c. Gas name:The gas name of the current selected gas is shown. This option is applicable for both meter and controller. E. Row 3: In the lowest row of the display only two functions can be chosen. a. Total resetable: The resetable totalizer will be displayed. This option is applicable for both meter and controller. b. Total: The not resetable totalizer will be displayed. This option is applicable for both meter and controller. c. Valve utilization: The valve utilization is shown. This function is only applicable for a controller. d. Flow value: If you use the pressure controller you see the setpoint pressure and the actual pressure value.Often it is advisable to show the flow value as well. Manual Version get red-y Software get_redy_E1_5 Page © Vögtlin Instruments AG 43 Software get red-y 3.2.5 Data Logger Tab Note: The Data Logger tab is only available with a valid license. With the Data Logger function measured value signals of the devices of the red-y smart series can be analyzed and saved at a selectable time interval. This data can be represented in tabular or graphic form. The Data Logger tab can be divided into 2 logical groups –A,B. A B Figure 37: Representation of the Data Logger tab A. Projection tree of the Data Loggers: The Projection tree is the central administrative center for the Data Logger. You can set new channels (Instruments or controllers), signals and the time behavior. With most nodes you can use the right mouse button to open a dialog box in order to execute different functions (see Figure 37). Use the [Save Data as] button to save the settings of the Projection tree. Manual Version get red-y Software get_redy_E1_5 Page © Vögtlin Instruments AG 44 Software get red-y B. Setting the time behavior: Figure 37 Figure 38: The time axis node was selected, with this the B page for time control of the Data Logger appears. You can set the sampling rate (time interval). The fastest sampling rate is 100 ms. In other respects you can define whether the Data Logger should record infinitely or in time-controlled manner. To define a new channel click the time axis node in the Projection tree. Clicking the right mouse button opens a new window [New Channel] (See Figure 39 ). Figure 39: Behaviors of the PID-Parameters. Right-clicking the time axis node opens the [New Channel] dialog box with which a device is registered for recording in the Data Logger. In Figure 40 all devices located on the bus are listed. One device corresponds to a recording channel (channel). You can add several signals to each channel. Manual Version get red-y Software get_redy_E1_5 Page © Vögtlin Instruments AG 45 Software get red-y A Figure 40: You can register the channels (devices) in the Data Logger which are to be recorded A. Available Channels: All the available devices (Channels) are listed here. Double-click the serial number or click the [Accept] button to display a new window as shown in Figure 41. Figure 41: Signals can be added to Channel 131966 Now the device with serial number 131966 is registered in the Data Logger. You still need to assign the recording signals. Manual Version get red-y Software get_redy_E1_5 Page © Vögtlin Instruments AG 46 Software get red-y The following signals can be recorded/assigned: The following signals are available for a Controller (Flow or Pressure controller): Actual value Flow Set point Flow Temperature Totalizer Valve load (Actual value Pressure) (Set point Pressure) The following signals are available for an instrument: Actual value Flow Totalizer Temperature Color and visibility can be assigned for every individual signal. Choose the [Accept] button to register the signals for the channel. In other respects the Data Logger gives the opportunity to automatically control the set point. This makes possible a time-controlled sequence. This functionality is referred to as ScriptWalker. The automatic sequence control for the ScriptWalker is entered in the form of what is called a script. This script has a couple of clear commands: Commands of the Process Profile Function (ScriptWalker): Step: Here a step range is specified in a percentage, i.e. the set point is set. Wait: Number of seconds the script will pause. Ramp: This is a ramp function in percentage This page can be divided into 3 logical groups –A,B,C. A B C Figure 42: ScriptWalker for the automatic sequence of the set point presettings. Manual Version get red-y Software get_redy_E1_5 Page © Vögtlin Instruments AG 47 Software get red-y A. SkriptWalker: Here you can enter the scripts for the automatic sequence control for set point presetting. Clicking the [Calculate Diagram] button displays a diagram in B which displays the time behavior of the set point presetting. B. Graphic representation of a Script: Displaying the sequence of the script. The Y-axis of the diagram is set point presetting and the X-axis is the time dimension of he diagram. C. Apply: Click the [Apply] button to display the page of the measured value acceptance. (See Figure 42) Programming example Programming example for a process according to the graphic above Command ramp 2, 5 wait 3 step 3.5 ramp 1, 3 ramp -1, 3 step 2 wait 5 step 4 ramp 1, 2 step 0.5 wait 6 Step 0 Description Last value + 2 ln/min within 5 seconds Wait 3 seconds Go to Set value 3.5 ln/min Last value + 1 ln/min within 3 seconds Last value - 1 ln/min, within 3 seconds Go to Set value 2 ln/min Wait 5 seconds Go to Set value 4 ln/min Last value + 1 ln/min within 1 second Go to Set value 0.5 ln/min Wait 6 seconds Go to Set value 0 Manual Version get red-y Software get_redy_E1_5 Page © Vögtlin Instruments AG 48 Software get red-y This page can be divided into 6 logical groups –A,B,C,D,E, F. A B C D F E Figure 43: Representation of the registered signals (actual value flow, set point flow) of both channels (devices). A. Channel 1: Here the sequence of the Scriptwalker is graphically represented. In Figure 43 you see the sequence of the script. You see the set points (green) which are chronologically controlled by the script and the actual value (blue). Right mouse clicking within the diagram allows you to copy the measurement data to the clipboard. The data from the clipboard can be copied to Excel with [CTRL+C]. B. Selection of data view of Channel 1: You can select 3 different data views. a. The data of this channel is displayed in a separate window (See Figure 44). b. The data is displayed as a graph (See Figure 44). c. The data is represented in tabular form (See Figure 44). C. Channel 2: Similar to Item A D. Selection of data view of Channel 2: Similar to Item B E. Control of the Data Logger: Choose the [Start] button to start the Data Logger. You can interrupt the Data Logger with the [Pause] button and pressing the same button again continues the Data Logger without loss of data. Use the [Stop] and [Start] buttons to begin a new recording of the measurement data. Manual Version get red-y Software get_redy_E1_5 Page © Vögtlin Instruments AG 49 Software get red-y F. All Channels in one Window: When you select the magnifying glass button a new window opens which displays all registered channels and signals. You can change data views within this window. Figure 44: Representation of the measured values in tabular and graphic form If you opened a separate window for the Data Logger you can change to the Overview tab of a controller as shown in Figure 45 and preset the set point jumps yourself. Figure 45: Representation of the measured values in tabular and graphic form Manual Version get red-y Software get_redy_E1_5 Page © Vögtlin Instruments AG 50 Software get red-y 3.2.6 The Mixer Tab Note: The Mixer tab is only available with a valid license. This functionality is available beginning with get red-y Version 5.4.0.0. With the Mixer function a gas mixture can be produced from different pure gases. In principle we differentiate between two mixer types: - “Gas Mixture Fix”- mode consists of different gases which total 100%. (e.g. 30% CO2; 70% N2) A total flow rate is set with a defined gas mixture. In the case of this mixer type exclusively flow controllers are involved. - In the case of “Master-Slave” mode the flow controller/s (slave) orient themselves to a reference variable (master) and attempt to follow the reference variable according to their percentage settings. In the process the master is exclusively a measuring device. The Mixer tab can be divided into 2 logical groups (A,B). The Mixer is quite similar in structure to the Data logger. We recommend reading the section on the Data logger before concerning yourself with the Gas Mixer. A B Figure 46:: Representation of the Mixer Tab A. Projection tree of the mixer: The projection tree is the central administration center for the mixer. A correctly configured mixture of gas percentages can be saved with the [Save mix] and [Open mix] buttons and opened again later. Keep in mind that the saved device configuration is also present in the Device List when you are opening a mix. If you select Configuration node, View B appears (See Figure 46). Manual Version get red-y Software get_redy_E1_5 Page © Vögtlin Instruments AG 51 Software get red-y B. Setting the Mixer type and the time behavior: You can define the two mixer types here. In Gas Mixture Fix-Mode only flow controllers can be selected. The total of all involved gas percentages always equals 100%. In Master-Slave-Mode the first device you select is always the reference variable (Master). The master device consists exclusively of a measuring device. The subsequent selected flow controllers follow the master according to the percentage setting. In this case the involved measuring instruments and controllers do not have to equal 100%. Example: A mixture of 50% CO2 in N2 is desired: In the process the flow controller is set to 100% of the master. 100% of the master and 100% of the slave equals a 50% mixture. The remaining time settings have the identical behavior as in the Data logger. To add a new gas for your mixture click on [Configuration] node or [Mix] node in the tree (Figure 47 left). Clicking on the right mouse button opens a popup menu [New gas]. With this new gas can be added to your mixture. If you select this menu item the view shown in Figure 47 right appears. Figure 47: Dialog for adding a new gas (left) and the view for selecting a gas (right). You can either double-click on the list with the gases (Devices) or select a gas and press the [Apply] button. You can select the desired gas for your mixture and enter it in the mixer configuration. After selecting all the gases for the mixture, the associated signals still have to be assigned (e.g. Setpoint flow, Current flow etc.). (See Figure 48) Note: If your configuration includes a device of the Smart4S type (Serial number greater than 150,000), the Set-point delay function should be switched off. This function is described in 3.2.4.10 Functions/Set-point delay In the case of Master-Slave mode the connected controllers would have a delayed reaction to the actual value of the master and an unstable gas mixture would be the result. Manual Version get red-y Software get_redy_E1_5 Page © Vögtlin Instruments AG 52 Software get red-y Figure 48: Dialog for adding new signals to the gas (device). After you have activated the [Add Signal] menu item the following page appears in Figure 49. In Master-Slave mode the first node in the tree has to be a meter (Master). In the process this can only have the “Current flow” signal assigned to it. The “Slaves” are exclusively flow controllers, which readjust the flow in % of the actual value of the master. The “Current flow” can be added in order to be recorded and visualized. In the Gas mixture fix mode all the nodes in the tree are flow controllers, which receive their percentage values with the “Set-point flow” signal. Note: Keep in mind that all the involved devices are set to the same unit (e.g. ln/min). If this is not the case, the units can be adjusted in the Parameters/Measurement Range tab. This “Add Signals” page can be divided into 5 logical groups –A,B,C,D,E. If the “Current flow” signal is selected the display is identical to the one in the Data logger. Manual Version get red-y Software get_redy_E1_5 Page © Vögtlin Instruments AG 53 Software get red-y A C E B D Figure 49: Dialog for adding new signals to the gas (device). A. Add Signal: You add the signals here. For a controller the “Flow set-point” and optionally the “Current flow” are added. Only “Current flow” Signal can be selected for a meter. B. Percentage Setting for the Controller: You enter the percentage of the gases here in “Gas mixture fix” mode. The total of all individual components must equal 100%. C. Proposal for lacking value to 100%: If you select the field in B, you are offered a proposal for increasing the lacking value to 100%. D. Color, Designation and Visibility of the Signal: This behavior is identical to that of the Data logger. E. Display of the Total: You specify the current calculated total of the mixture in this field. If the sum is greater than 100% it will appear in red. Clicking on the [Apply] button displays the window shown in Figure 49.1 below. The display is similar for “Master-Slave” mode. In the process no set value (Total flow) can be predefined because the master is a measuring device. Manual Version get red-y Software get_redy_E1_5 Page © Vögtlin Instruments AG 54 Software get red-y This window can be divided into 5 logical groups –A,B,C,D,E. D A C B E Figure 49.1: This window allows you to set the set-point value for Gas Mixture fix mode and displays the resulting data in different views. A. Gas Components of the Mixture: The individual channels for the mixture are displayed here. The sequence of the tree also corresponds to the sequence of the chart. The signals which are below the node gas (here Gas1) can be visualized in the chart in different ways. B. Set Value Setting for the Total flow: You predefine the set-point setting for the gas mixture here in “Gas Mixture fix” mode. C. Buttons for the type of Data Visualization: The data can be run in the chart either as a table, graph or also in mixed form. The graphical representation can take place time compressed or updated. These buttons behave in the same manner as in the Data logger and are explained there more precisely. D. Legend: The legend can contain various information. Select the second button from the bottom in C. E. All Charts in one window: All gases can be visualized in one window. This window can also be viewed on a different monitor. This option is shown in Figure 50. A tabular and graphical representation can be displayed simultaneously for the same channel. Manual Version get red-y Software get_redy_E1_5 Page © Vögtlin Instruments AG 55 Software get red-y Figure 50: Show the fix mode regulation in several data views. 3.3 Menu Basic functions like Select Language, End Program, Open User Manual and Start Important Help tools (Register tool, Reference Device list) can be performed in the menu. A E B F G C H D I J K Figure 51: The individual menu items of get red-y 5 are displayed A. Interface Monitor: This option is not available to standard users B. Reference Device list: The reference devices are allocated here (Required exclusively for adjustment and is not available to standard users, see Chapter 4.1). C. Graph Tool: This form is quite similar to the Graph Tool for the pressure regulation and does not required a detailed explanation here. D. Firmware update: A firmware update is only necessary in exceptional cases and can only be activated with a day password. E. User manual: Opens the user manual for get red-y. The user manual can also be opened by pressing [F1]. Manual Version get red-y Software get_redy_E1_5 Page © Vögtlin Instruments AG 56 Software get red-y F. Day password: Special settings or adaptations require access to a specified tab. A day password is required for this. Please consult your sales partner. G. License: See Chapter 3.4 and 3.5 H. Info: You can get information here about the installed version of get red-y 5 I. Languages/Settings: Here you can change the language. You can make settings here to adapt the chart lines or legend size in the charts to your own requirements. J. Online User-Feedback: Selecting this menu item transfers you to our homepage. You can give us your feedback on get red-y 5 there. The developer team strives to cater to your wants and needs as quickly as possible. K. Online Error Report: This also takes you to our homepage to report errors. The developer team will then do its best to take care of the problem as quickly as possible. ATTENTION: Vögtlin Instruments AG rejects any responsibility for the translation of this Software. 3.4 Licenses The Get red-y 5 software makes access and operation of instruments of the red-y smart series of Vögtlin Instruments AG possible without a license. With optional licenses the functionality can be expanded: Note: The Data Logger and Adjustment modules are subject to fees. Your Sales Partner will inform you about the framework conditions of these modules. Manual Version get red-y Software get_redy_E1_5 Page © Vögtlin Instruments AG 57 Software get red-y 3.5 License Dialog (License center) Serial number Number of your Dongle. If the software is being operated without a Dongle, the number will be 000000000-000000000. Activation code The manufacturer can use this code to determine your license configuration. Modules Figure 52: License dialog The activated modules upgrade request form Generates text you can attach to an e-mail for ordering additional licenses. License File Loads a license file. This file will be generated for you upon request and sent to you by e-mail. When you load this file additional modules will be activated in your Dongle. Figure 53: License dialog for calling new functionalities/modules 4. Instructions with concrete example Adjustment With the adjustment software you can compare (calibrate) devices of the red-y smart series with a reference and make necessary adjustments. Note: The precision, reliability and traceability of the lies solely within the responsibility of the user. The manufacturer cannot be held responsible for the precision of the measurement means or for the correctness of the adjustment as well is its consequences. For the adjustment you will require the following: Reference device with high accuracy Device under test DUT Get red-y 5 software Suitable communications cable (i.e. PDM-U) Stable 24V power supply Stable operating conditions with reference to the pureness/homogeneity of the calibration gas; temperature; pressure; humidity and other parameters which could influence the adjustment. Manual Version get red-y Software get_redy_E1_5 Page © Vögtlin Instruments AG 58 Software get red-y supply AC 110V .. 240V PDM-U supply 24V PD A MU B N 1+ 2 Reference device Meter GSM or GSC with 100% valve opening USB bar a DUT SMART 4 GSC hand valve Figure 54: Typical structure for adjustment of the device Adjustment Tab Clicking the Adjustment tab displays the different adjustment options. Please define the appropriate configuration (Automation degree) before you begin making adjustments. The corresponding configuration will be graphically displayed in Figure 55. Figure 55: Adjustment tab with the five selection items on the left side and the corresponding contents page right for the selection item With Correction list Manual Version get red-y Software get_redy_E1_5 Page © Vögtlin Instruments AG 59 Software get red-y Reference Device List The Tools menu contains the Reference Device List. Before you can make adjustments, all the provided reference devices must be entered in this list. You can also have the devices from the Device List entered in the Reference Device List. To do this, select the device you wish to have defined as a reference in the Device List. Press the right mouse button and in the Popup window which appears select the [Add to Reference List] button. This device will then be added to the Reference List. Figure 56: Entering of a reference device into the list of reference devices During the adjustment operation it is possible to switch to a different Reference Device. In the case of the automatic adjustment however you can only use one Reference Device per adjustment operation. In the Calibration list you can identify the appropriate reference for each measuring point. Manual Version get red-y Software get_redy_E1_5 Page © Vögtlin Instruments AG 60 Software get red-y Manual Calibration Calibration List You can expand the list with fields like Temperature, Pressure etc. by clicking the [more]. Corresponding to the device the Set Column is initialized with the measurement range. With the right mouse button on the Set Column the Popup menu opens for display between [Absolute] and [Percent] of the end value. Press the [SHIFT+DELETE] buttons to delete measuring points or choose [INSERT] to add them. The value of a newly inserted measuring point must lie within the preceding and following table row. Figure 57: Calibration List is the foundation of the adjustment process The default setting of the software is 10 support points. Kalibration 10 - points Set set-point with hand valve With a suitable control valve the gas flow is set to the desired set point. no DUT.Wert within 10% of set-point? The actual value of the DUT (device under test) is automatically entered into the list by pressing the [Spot] button. The actual value of the reference is manually entered in the „Ref.“ column. insert DUT values into table Read reference value and insert into table other set-points? yes yes Adjusting is necessary because of differences betwenn DUT and REF values? Preview ok Adjust Save table (list) check testing stand End Figure 58: Flow chart of the individual steps of the adjustment process Manual Version get red-y Software get_redy_E1_5 Page © Vögtlin Instruments AG 61 Software get red-y In practice it has proven successful to start with the greatest measuring point. This makes sense above all in the case of a gas type change, since as a result the previously used gas will be rinsed from the device more rapidly. Equate unused value with set point Read value from reference device and enter With values that should not be changed the value of the DUT is equated with the reference. Figure 59: Entry of the measurement data in the Calibration list Preview After the list is complete, click [Preview] to display the deviation graphically. Note: In the Preview the data are not yet overwritten. The transfer function of the device is read and displayed! After the Preview the [Adjustment] and [Undo] buttons are enabled. Manual Version get red-y Software get_redy_E1_5 Figure 60: Correction curve, which results from the data of the Calibration list and the transfer curve of the device Page © Vögtlin Instruments AG 62 Software get red-y Adjustment After clicking [Adjustment] the is graphically represented once more and then saved in the device. The transfer takes a few seconds. The green progress bar will increase to 100% and then return in the direction of 0%. After successful transfer the following message appears:Adjustment „Data successfully transferred to the device“. Now the new adjustment applies, the measured value will be displayed with the corresponding modification. Figure 61: Successful adjustment, i.e. the newly calculated curve has been copied to the device Undo To undo the new adjustment, click the Undo button to restore the previous state. Autocalibration With Autocalibrate a higher degree of automation is achieved by networking of the device under test DUT and the Reference. There is no readout of the measured values or manual entry. This automation makes possible the averaging of measured values. A measuring point is averaged from 20 measurements. Currently only reference devices of Vögtlin Instruments AG (smart 3 & smart 4) can be connected in one bus. Reference devices of other manufacturers are not supported in the present version. Manual Version get red-y Software get_redy_E1_5 Page © Vögtlin Instruments AG 63 Software get red-y supply AC 110V .. 240V Structure PDM-U supply 24V DUT:smart 4 GSC is used as a controller Reference: smart 4 GSM PD A MU B N 1+ 2 Reference device Meter GSM USB DUT SMART 4 GSM Set-point adjuster SMART 4 GSC Figure 62: Typical structure of the adjustment Adjustment Tab Clicking the Adjustment tab opens the window as shown in Figure 63. Preset Set point Automation Condition for automatic adjustment: Option 2, For Gas Controllers MFC must be enabled. Switch Figure 63: Adjustment tab Buttons More: You can make adjustments to the list display. For the automatic adjustment in the Ref. Instr. field the correct serial number of the reference device must be given. Enter the serial numbers of the reference devices in the Tools/Reference Device List menu. Spot: A spot measurement will be performed only on the measuring point marked in blue in Figur Measure All: Beginning from the blue marked position all following measuring points will be automatically calibrated. Reset: A running measurement can be cancelled. All numerical values of the preceding measurements remain in the list. Manual Version get red-y Software get_redy_E1_5 Page © Vögtlin Instruments AG 64 Software get red-y Step by step Define the values of the support points. The default is 10 measuring points, which can be changed. However, recommend accepting the default. For each support point (measuring point) the corresponding reference device must be allocated. To do this define the serial number of the reference device under more… With Spot, a single support point can be measured. Measure All runs through the entire list. When all the measuring points have been measured, click the Preview button. (See Description Preview on Page 50) Exporting Measurement If you wish to make the measurement results available also outside of the Get red-y 5 software, you can use the Export function. Tables Window Export Figure 64: Exporting the measurement data Click the right mouse button to select the export format. Currently two options are possible: Export as Text File: With this option a File dialog box appears with which an existing file or a new file is selected. Click save to save the measurement results to the file. Export to Clipboard: The measurement results are copied to the clipboard, and can then be used in any program, e.g. in Excel or in a word processing program. Manual Version get red-y Software get_redy_E1_5 Page © Vögtlin Instruments AG 65 Software get red-y 4.2 Embedding external references Note: You can use this function if you have a adjustment module and partner rights. With this additional function you are able to embed external devices into the adjustment module. Hence you can also use devices beyond the smart series for the automatic adjustment process. To do that you have to select the external reference, like in Figure 65.1 displayed. If you select within the main menu [Extras/Reference device list], the window in Figure 65.1 will open. Name your reference and mark it as [External measuring device]. Add the new external reference device to the reference device list by clicking the [Add] button. Figure 65.1: Dialog box for adding new reference devices Figure 65.2: After adding the reference the module appears for the predefined external device After adding the device the module for embedding the external reference into the adjustment process will appear (Figure 65.2). This module handles all the communication from the reference to the adjustment process from get red-y. In this example the configuration file for a Fluke Molbox™ device has been chosen. The installation path of get red-y contains a folder /Instrument/Instruments where all configuration files for external references are stored. By default three configuration files with the file extension .mcf are contained in that folder. It is possible to add new configuration files to that folder in order to embed new reference devices into the adjustment process. Prerequisites for the reference is a serial communication and the commands sent and received need to be in ASCII format. The communication parameters and the interfacing commands are defined in those files. Within the context of this manual, no detailed explanation of the format and manifold settings can be given. If you select [File/New] in the main menu of the external reference module, you are able to load configuration files (Figure 65.2). The communication parameters for the serial communication can be changed with the menu [Setup/Communication] (Figure 66.1). Manual Version get red-y Software get_redy_E1_5 Page © Vögtlin Instruments AG 66 Software get red-y If the reference device is connected to another COM port, you can easily change this setting. You are also able to change the delimiter of the commands. By clicking [Setup] in the window [Setup interface] you are able to change the baud rate, parity, stop bits and mode of the serial communication. Figure 66.1:By clicking [Setup/Communication] the setup of the serial communication can be changed. You can also initialize the device with [Setup/Device initialization]. These settings can be saved with the menu [File save] respectively [File save as] to the configuration file. With [Setup/Commands] you are able to test your predefined commands defined in the configuration file of the given reference device (Figure 66.2). Figure 66.2: By clicking [Setup/Commands] the configurable commands can be tested. If the communication with the reference is set up properly, you are able to adjust the devices automatically. The process is the same as in chapter 4 described. Merely the new external reference has to be entered into the calibration list in order to give the adjustment module the information where the reference data should come from. For this you have to click the button [More]. The window in Figure 67 will appear. Chose your predefined reference from the reference devices, like in Figure 67 illustrated and click the green arrow button. For all measuring values the reference is given and added to the calibration list. Now you can proceed like in chapter 4 described. Manual Version get red-y Software get_redy_E1_5 Page © Vögtlin Instruments AG 67 Software get red-y 2. Select your external device in the combobox and press the green button in order to add it to the calibration list 1.Select [more] Figure 67: Embedding the external reference device for the automatic adjustment process. Different reference devices with different measuring principles have unequal measuring times for one sample. Also the time to get a stable flow is different. To cope with those circumstances within the adjustment software, you are able to set a flow stabilization time and a factor, which states how often the DUT in contrast to the reference takes samples. Those points are displayed in Figure 68. If you chose in the main menu [Question mark/Languages and Settings], the tab with the name [Adjustment] appears. Only if you have adjustment rights, you are able to see that function. Manual Version get red-y Software get_redy_E1_5 Page © Vögtlin Instruments AG 68 Software get red-y A B Figure 68: Setting flow stabilization time and amount of samples in contrast to amount of samples of the DUT A. Flow stabilization time: This measuring value will be purged in the given parameterized time in order to get a stable flow profil before the first measuring value is taken. B. Sample point external device: With this factor the given amount of sample points of the external device are calculated by the sample amount of the DUT. If 0 is entered then the measuring value of the external device is just taken once. If the factor is greater than 0 then the amount of samples of the external reference is equal to amount samples DUT / factor. Manual Version get red-y Software get_redy_E1_5 Page © Vögtlin Instruments AG 69 Software get red-y 5. Appendix Abbreviations GSC red-y smart controller, Mass flow controller for gases GSM red-y smart meter Mass flow meter for gases MFC Mass Flow Controller for gases MFM Mass flow meter for gases red-y smart series / smart Mass flow meter and controller from Vögtlin Instruments AG red-y compact series / compact Mass flow meter from Vögtlin Instruments AG with local display smart 3 MFC/MFM red-y smart of the third generation (up to SN 109999) smart 4 MFC/MFM red-y smart of the fourth generation (beginning with SN 110000) VIAG Vögtlin Instruments AG DUT Device Under Test GUI Calibrate: Graphical User Interface Compare measured measured values values between between Device Device under under test test and and reference Compare reference Adjustment: Synchronizing or matching of a device under test to the reference Verify: Checking a device under tests in comparison to the reference after the adjustment Manual Version get red-y Software get_redy_E1_5 Page © Vögtlin Instruments AG 70 Software get red-y 6. Change history Date Version Replaces Author Note 08.07.2010 get_red-y_D1_0 Predecessor MHU Adaptation to a new layout Draft 08.11.2010 get_red-y_D1_1 Predecessor SPR Revision of contents and extensions 15.02.2011 get_red-y_D1_2 Predecessor SPR 07.03.2011 get_red-y_D1_2 Predecessor SPR/JER 29.03.2011 get_red-y_D1_2 Predecessor SPR/FWA All extensions Data Logger, Parameter, Graph for Pressure controller and controller, Autoadjustment, Day password and others are included in the documentation All extensions Scriptwalker, adjustment with set point default, changes in the software, Zoom window and others are included in the documentation Proofreading FWA + Release PM 26.01.2012 get_red-y_D1_3 Predecessor SPR 24.09.2012 get_red-y_D1_4 Predecessor SPR 12.02.2013 get_red-y_D1_5 Predecessor SPR Manual Version get red-y Software get_redy_E1_5 All enhancements for the Smart4S (Set-point delay function et al.), the mixer module with the rights management and many other enhancements are documented. Set-point delay and functions for the Smart4S. All enhancements for Smart6, changes in rights access, new functions Smarts6 and LED functions are documented. Adjusting with external reference devices, new smart6 funcitions, new rights systems, all new units for the american market, new chapter for new external reference adjusting module Page © Vögtlin Instruments AG 71


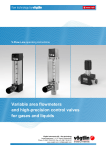


![600A01-manual-V1[1]](http://vs1.manualzilla.com/store/data/005768384_1-b36f8a87433f2b6e700f051b34ad2f22-150x150.png)