1
RF Communication and Signals Experiments
Step9
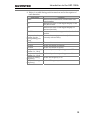
Marker
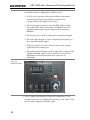
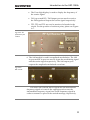
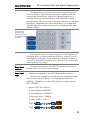
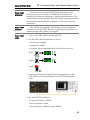
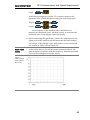
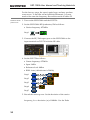
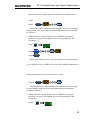
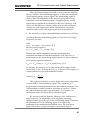
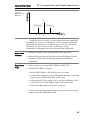
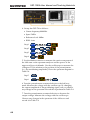
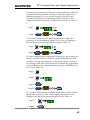
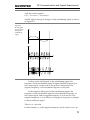
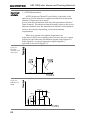
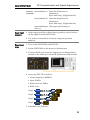
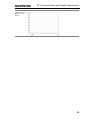
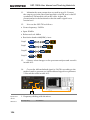
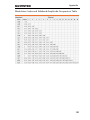
After the spectrogram on table 3-3 is drawn, measure the
harmonic ratio of each harmonic using the following steps:
Step10
1
Step11
2
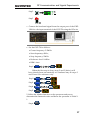
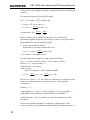
In accordance to the method that is used above to
measure the harmonic ratio, students can try to measure the
harmonic ratio of the higher order harmonics.
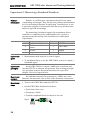
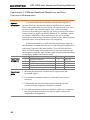
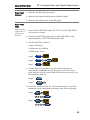
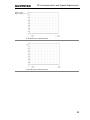
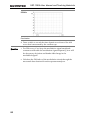
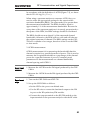
8. After measuring the spectrum, connect the output port to the
input port of the oscilloscope and measure the time domain
waveform of the triangle wave and square wave, and record
the results in Table 3-2 and Table 3-4.
Experiment
results
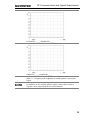
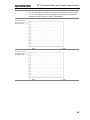
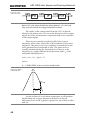
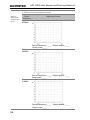
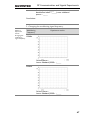
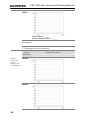
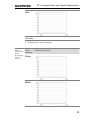
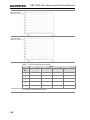
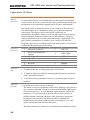
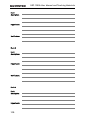
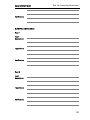
1. In the tables below, record the measurement results of the
time domain waveforms and the frequency domain spectrum
for both the triangle and square waves.
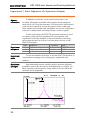
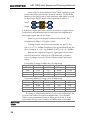
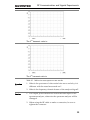
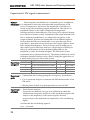
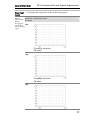
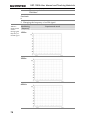
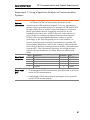
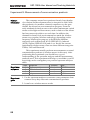
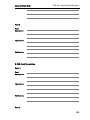
Table 3-1.
1MHz triangle
wave spectrum
test results.
43