1
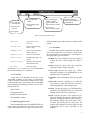
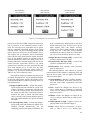
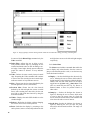
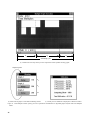
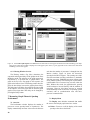
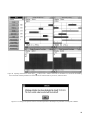
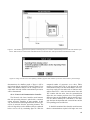
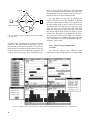
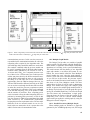
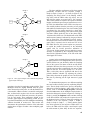
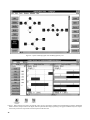
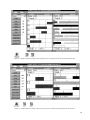
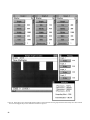
Figure 27. Single Resource Envelope window displays processor utilization associated with Single Graph Play window.
5.2.2. Select Menu
The Select menu includes commands that enable the
user to display only selected nodes, force the cursors to
jump to selected nodes and/or events, or set the time step
for the horizontal scroll. Since the commands are functionally equivalent to the Select menu commands provided by the SGP window, see section 5.1.2. for a
description of each command.
6. Measuring Concurrency and Processor
Utilization
The Concurrency windows plot processor requirements and utilization over time for the DFG schedules.
The plots are referred to as resource envelopes, and the
area under the curve is equal to the computing effort
required of the processors. The single resource envelope
(SRE) shows the steady-state processor requirements of
the DFG for the execution of a single computation or
data packet. The SRE for the dataflow schedule of figure 17 is shown in figure 27. For the Shared Memory/No
Contention and the Network with Com Controller models, the SRE is equivalent to counting the number of
overlapped execution bars within the SGP over the
schedule length time interval. The SRE determines the
minimum number of processors sufficient to execute the
algorithm for a desired schedule length and TBIO. For
the Network without Com Controller model, the SRE
includes the effort required for communication as modeled by the edge delays. The total resource envelope
(TRE) shows the steady-state, periodic processor
requirements for multiple computations of data packets
over a schedule cycle of period TBO, which is assumed
to repeat indefinitely. The TRE for the dataflow schedule
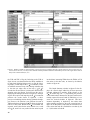
of figure 24 is shown in figure 28. The TRE determines
the maximum number of processors sufficient to execute
the algorithm periodically with period TBO. Like the
SRE, the TRE is equivalent to counting the number of
overlapped execution bars in the TGP when not using the
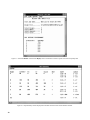
Network without Com Controller model. Processor utilization measurements can be taken from the TRE
window.
6.1. Display Menu
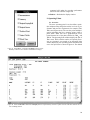
The Display menu includes the commands:
☛ Slice
☛ Previous Slice
☛ Whole
☛ Redraw
☛ Reset
that enable the user to zoom in, zoom out, or refresh the
picture. These are functionally equivalent to the same
commands provided in the graph play windows, so an
explanation of each will not be given here. Refer instead
to section 5.1.1 for detailed explanations of each
command.
21