1
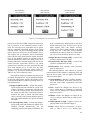
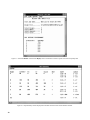
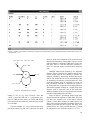
Task system (T, L, , Mo):
T Set of tasks
L Fixed-task latencies
Partial order on T
Mo Initial state
DFG
Dataflow
graph (DFG)
Performance bounds:
Schedule length ω
Time between input and output TBIOlb
Minimum iteration period To
Time between outputs TBOlb
Slack
Processor utilization
Run-time requirements:
Task instantiations
Processor requirement
Data buffers
Artificial , control edges
Graph
Analysis
Dataflow graph:
Nodes represent T
Edges describe
Tokens indicate presence of data
Initial marking = Mo
Graphical displays:
Gantt chart task execution
Single iteration (SGP)
Periodic execution (TGP)
Resource envelopes
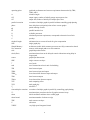
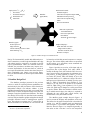
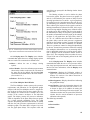
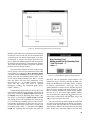
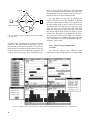
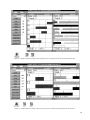
Figure 2. Dataflow Design Tool information flow.
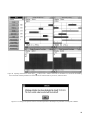
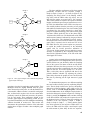
Design Tool automatically models this additional precedence constraint as a control edge and initializes the edge
with tokens (positive or negative), as needed, to provide
proper synchronization. That is, as a function of the new
schedule, the precedence constraint may impose intraiteration dependencies for the same data set, which do
not require an initial token. On the other hand, the precedence relationship may impose inter-iteration dependency for different data sets, which requires initial tokens
to occur.
3. Dataflow Design Tool
The dataflow paradigm presented in the previous
section is useful for exposing inherent parallelism constrained only by the data precedences. Such a hardwareindependent analysis can indicate whether a given
algorithm decomposition has too little or too much parallelism early on in the development stage before the user
attempts to map the algorithm onto hardware. The Dataflow Design Tool version 3.0, described in the remaining
sections, analyzes dataflow graphs and applies the design
principles discussed herein to multiprocessor applications. The software was written in C++2 and executes in
Microsoft Windows3 or Windows NT. The software can
2Version
3Version
3.1 by Borland International, Inc.
3.1 by Microsoft Corporation.
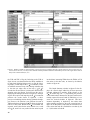
be hosted on an i386/486 personal computer or a compatible type. The various displays and features are presented
in this section. As a convention, menu commands are
denoted with the ☛ symbol.
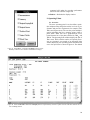
Figure 2 provides an overview of the input and output process flow of the Design Tool. After a DFG is
loaded, the Design Tool will search the DFG for recurrence loops (circuits) and determine the minimum iteration period To by using equation (2), where To is zero if
no circuits are present. TBO will initially be set to the
largest task latency or To, whichever is larger. The calculated processor requirement Rc is initially given by equation (5). TBIO is determined from equation (1). Any
changes to R will result in an update of the optimum
value for TBO (TBOlb) from equation (3). For a given
value of R, TBO may be changed to a value greater than
or equal to TBOlb. When the schedule is altered (resulting in added control edges), the analysis is repeated to
determine the new critical path, critical circuits, and
modifications to the performance bounds.
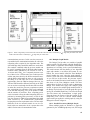
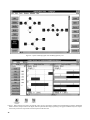
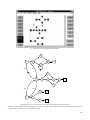
The dataflow graph example shown in figure 1 is
used to present the displays and capabilities of the tool.
The format for the graph description file is described in
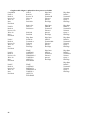
section 3.1.1, and the complete graph text description
used for figure 1 is provided in the appendix. The node
latencies shown in figure 1 are interpreted generally as
time units so that “real time” can be user interpreted.
5