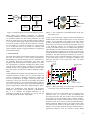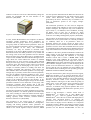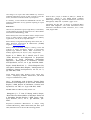
1
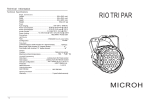
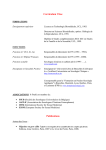
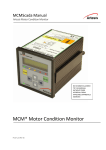
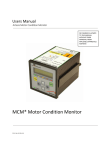
New Horizons on Predictive Maintenance İzzet Y. ÖNEL*, Engin ÇAĞLAR*, Ahmet DUYAR* [email protected], [email protected], [email protected] * Artesis Teknoloji Sistemleri A.S. Kemal Nehrozoğlu Cad. GOSB Teknoparkı Hightech Binası Kat : 3/B10 41480 Gebze Kocaeli Türkiye (0262) 678 88 60 www.artesis.com Abstract: This paper deals with predictive maintenance and its importance on industrial applications. After introduction, brief information is given about causes of electrical motor failures and then, predictive maintenance concept is introduced. Next, most popular techniques are told briefly. Model based fault detection technique which is utilized by Artesis MCM (Motor Condition Monitor) unit is mentioned. A case study is given at the end of the paper. Keywords: Predictive maintenance, condition monitoring systems, model based automatic fault diagnosis, Artesis MCM 1. INTRODUCTION Fundamental purpose of maintenance in any business is to provide the required capacity for production at the lowest cost. It should be regarded as a reliability function, not as a repair function. In the short term, lower reliability means an increased cost of production, or an inability to meet the required demand, except maybe at greater cost. In the longer term, increased reliability and hence production can save money by deferring on new plant. (Raymond, 2004) Fundamentally, it can be said that there are only two types of maintenance: 1. Breakdown maintenance 2. Preventive maintenance a. Maintenance on fixed time or duty basis b. Opportunity maintenance c. Design Out Maintenance d. Management Decision e. Condition-based Maintenance such as speed or load changes, rather than a developing fault. Setup and analysis costs have typically pushed such systems beyond the reach of many potential users. Maintenance is now a critical management issue since a global crisis is affecting the world’s economy. The cost of maintenance may represent as much as twenty percent of fixed manufacturing costs, and driving it down has a significant impact on profitability. Additionally, poor maintenance practices result in frequent breakdowns and unnecessary interventions that can reduced equipment productivity. Predictive maintenance was first introduced to address both of these challenges by providing advance warning of equipment faults through the use of condition monitoring systems. Despite the successful application of predictive maintenance in some industries, it is estimated that less than one percent of potential users have been able to deploy it successfully. The major reason for this is that existing condition monitoring systems are simply too complex and expensive for most people. (Duyar, 2008) 2. CAUSES OF MOTOR FAILURES The ultimate aim is to perform maintenance work only when it is really necessary. The old saying "If it ain't broke, don't fix it" becomes "monitor it, and if it is not deteriorating, leave it alone". The challenge for the maintainer is to find how to monitor this inevitable deterioration reliably. Raymond, 2004) The squirrel cage induction motor's versatility and ruggedness continue to make it the workhorse of the industry, but that doesn't mean it's invincible. Pushing it too hard for too long can cause the stator, rotor, bearings, and shaft to fail. Numerous industry surveys document which parts fail and how, but very little data is available to explain why. (Bonett, 2004) Traditional techniques for predictive maintenance have relied on observing trends in the levels of a number of key measurements over time. By selecting the range of measurements carefully, the skilled analyst was able to spot significant changes and got some idea of the fault that might be causing them. The analyst was often confused when the measurements were altered as a result of operational changes, The data provided by the Institute of Electrical and Electronics Engineers (IEEE) study shown in Fig. 1 below is helpful because in addition to identifying failed components, it suggests the most likely causes of failure based on which component failed. These percentages in Fig. 1 may vary based on industry or location. The real challenge lies in reducing the large category of “unknown” failures. It's these 1 “unknown” failures that make analyzing the entire motor system so critical. (Bonett, 2004) 2. Unbalanced dynamic force 3. Torsional vibration and transient torques 4. Residual forces from casting, welding, machining, and fits (radial, axial, other) 5. Magnetic force caused by slot leakage flux vibrating at twice the frequency of rotor current 6. Magnetic force caused by air-gap eccentricity Figure 1: Failure distribution statistics like these from IEEE Petro- Chemical Paper PCIC-94-01 are helpful, but it’s still necessary to conduct a thorough root cause analysis when determining modes of failure. (Bonett, 2004) 7. Centrifugal force 8. Thermal stress caused by end-ring heating 9. Thermal stress caused by temperature differential in bar during start (skin effect) The summary of the stresses which cause failures in electrical motor is given in Table I 10. Thermal stress caused by axial bar growth axial force caused by skewing the rotor bar. Unknown 11% External 17% Shaft/Coupling 2% Bearing 53% Stator Winding 17% Electrical /Dielectric Mechanical Dynamic Shear Vibration /Shock Residual Electro - Magnetic Enviromental Shaft Bearings Thermal Rotor Assembly Type of stress WindingStator Table I : Motor component / Stresses (Bonett, 2000) Some example photos of motor failures are given in Fig.2 Stator short circuit Effect of bearing current If a motor is designed, manufactured, applied, installed, operated, and maintained properly, these stresses remain under control, and the motor will function as intended for many years. However, as each of these elements (from design through maintenance) varies from user to user, so does the anticipated life of each motor. (Bonett, 1992) 3. FAULT DIAGNOSIS TECHNIQUES A typical online induction motor fault diagnosis system is plotted in Fig. 3. It consists of four parts: Data acquisition, Data preprocessing, Detection algorithm and Post processing. Some popular detection methods to identify the motor faults are, listed as follows 1. Vibration monitoring; 2. Motor current signature analysis (MCSA); 3. Electromagnetic field monitoring using search coils; 4. Chemical analysis (Lubricating oil; cooling gas); 5. Temperature measurement; 6. Infrared measurement; 7. Acoustic noise measurement; 8. Radio frequency emission monitoring; 9. Partial discharge measurement. (Zhongming, 2000) Figure 2 : Examples for some motor failures These stresses are the result of the following forces and conditions: 1. Working torque 2 I.M . Data Acquisition Pre Processing Actual Current y(n) + Voltage Σ u(n) Detection Algorithm Figure 3. Scheme diagram of online fault diagnosis system Most popular fault detection techniques are vibration monitoring and MCSA. Vibration measuring is a reliable tool for mechanical failures just like bearing, unbalance etc. and MCSA is good at electrical and mechanical failures. MCSA is very sensitive about supply voltage changes. Both methods need expert people to interpret the measurements. Generally it’s too difficult to examine the vibration or current signal curves to find the cause of the failure. An automatic and robust technique against to supply disturbance is required for wide industrial usage. 4. ARTESIS MCM The main shortcoming of the methods told previous section is that they are based only on the external manifestations, disregarding any internal dynamics that are responsible for the particular behaviour. Consequently, they offer little insight into the actual dynamics of motor operation. It is thus not surprising that a particular technique may detect certain types of faults but fail on others. Furthermore, the traditional methods are not always applicable in arbitrary settings since they may require controlled environment conditions. (Albas, 1999) Artesis MCM is developed to meet manufacturers’ need for a condition-monitoring product that can provide simple and accurate maintenance scheduling information, without the need for interpretation by highly trained personnel. The technology used for the detection of impending mechanical and electrical faults is a proven patented technology that has been previously employed in space and aviation applications (Duyar, 1992), (Duyar, 1994), (Litt, 1995), (Musgrave 1997) MCM uses model-based fault detection and diagnosis techniques. The principle of this approach, as illustrated in Fig. 4, is to compare the dynamic behaviour of the mathematical model of the machinery or process with the measured dynamic behaviour. (Walt,2006) Differences v(n) Calculated current Figure 4 : The Comparison of the Mathematical model with the actual system In Fig. 4, u(n) is the input voltages to both the mathematical model and the actual motor-based system, it is the measured voltages. y(n) corresponds to the output of the motor-based system, it corresponds to the measured currents. v(n), on the other hand, is the currents calculated by the model. y(n)-v(n) is the difference between the measured and calculated currents. The model consists of a set of differential equations, which describe the electromechanical behavior of the motor. The real-time data acquired from the system is processed by system identification algorithms for the calculation of model parameters. The motor driving the machinery or process is being used as a sensor. Faults developing in the motor as well as the motor-based system or unexpected conditions that affect the operation of the system also affect the model parameters. [11] Power Factor Motor Operating Curve C3 MOTOR LOAD Post Processing - C1 C2 MOTOR LOAD C4 Gain (Current / Voltage) Frequency (Hz) Figure 5 : Motor operating curve which helps Artesis MCM to learning motor and load characteristic MCM first learns the motor-based system regarding motor operation curve for a period of time by acquiring and processing the motor data. The results of the processed data are stored in its internal database and a reference model is established. This reference model basically consists of model parameters, their mean values and their standard deviations. While monitoring, MCM processes the acquired motor data and compares the results to the data stored in its internal database. If the results obtained from the acquired data are significantly different from the reference model, MCM 3 indicates a fault level. The level is determined by taking into account the magnitude and the time duration of the difference. (Walt,2006) Figure 6: Artesis MCM; Motor Condition Monitor Unit In total, Artesis MCM monitors and compares 22 different parameters (model parameters). These parameters are classified into three groups. There are 8 parameters in the first group which are called electrical parameters. These are the network equivalent parameters and are correlated to the physical parameter of the motor, like inductances, resistances, etc. They are sensitive to electrical faults developing in the motor. MCM evaluates and analyzes the differences between the model parameters at any instant and the average value of the same parameters that are obtained during the learn stage. These differences are normalized with respect to their standard deviations obtained during the learn stage. Hence the values indicate the number of standard deviations they are away from the average values obtained during the learn stage. If they exceed threshold values, than an alarm is given. The changes in their values are associated with the faults that are developing in the system. As an example an isolation problem in winding will affect the parameters associated with resistances. Their change will allow MCM to detect the isolation problem at an early stage. Though they are primarily used to detect electrical problems, they also can indicate mechanical problems as well. As an example an imbalance or gear problem would cause dynamic eccentricity in the air gap. This eccentricity will cause a change in the induction parameters and therefore in the model parameters. By monitoring the changes in these model parameters imbalance can be detected at an early stage. This eccentricity eventually affects bearing and it will also eventually damage the bearing. Therefore its detection at an early stage can prevent further damages. (Walt,2006) The electrical parameters are further classified in two groups. Electrical parameters 1-4 indicate problems associated with rotor, stator, winding etc. while 5-8 indicate electrical supply problems such as voltage imbalance, isolation problem of cabling, capacitor, motor connector, terminal slackness, defective contactors etc. (Walt,2006) The parameters in the second group are sensitive to mechanical faults such as load imbalance, misalignment, coupling and bearing problems. These parameters are obtained from the frequency spectrum of the electrical signals similar to the current signature analysis. However, MCM uses the spectrum obtained from the differences between the expected current obtained from the model and the actual current. These differences include only abnormalities generated by the motor. Therefore, they are immune to the noise or harmonics present in the supply voltages. (Walt,2006) The mechanical parameters are also used for diagnostic purposes. Similar to the vibration as well as current signature analysis techniques, the frequencies they occur indicate the type of fault, i.e., an imbalance, loose foundation, oil whip, fan blades, inner or outer race of bearing etc. These parameters as well as their frequency intervals are provided to the user for trending and diagnostic purposes. (Walt,2006) The parameters in the third group are sensitive to changes in the behaviour of the system. These are called fit parameters (or residuals). There are 2 fit parameters. These are deviations between the actual currents (d phase and q phase) and the currents calculated from the model. If these parameters increase above their threshold values the system is considered to behave differently than it did during the learn stage which indicates that a fault is developing in the system. In addition to the above parameters MCM also monitors the supply voltage as well as the load conditions. If the supply voltage changes abnormally, has imbalance or very high harmonic content then it issues a “Watch Line” alarm. Similarly if the load conditions do not match with the conditions observed during the learn stage then it issues a “Watch Load” alarm. Watch load alarm means that either the load conditions changed or there is a fault developing in the system. If the user determines that there is a change in the process, then the user can add this new load condition into the conditions observed during the learn period by giving the UPDATE command to MCM. (Walt,2006) Using the measured three phase voltage and current signals, MCM also calculates a set of physical parameters such as RMS-values of three phase voltage and current, power factor, etc. This set also includes parameters such as total harmonic distortion, harmonic content of the incoming signal and voltage imbalance which give an idea about the quality of supply power. Active and reactive power parameters in this set might be used for energy consumption estimations. Therefore, it combines many physical quantities that are of interest to both production and maintenance operators just in one device. (Walt,2006) Artesis is also developed a software which name is MCMSCADATM to monitor one or more MCM units remotely on a PC. With its graphical interface (GUI), MCMSCADATM allows the user to obtain and display data in real-time from networked devices, to configure the performance of the devices and to save and subsequently retrieve data for display from its database, in a transparent and intuitive manner. Modern networking procedures permit monitoring of processes on remote machines using TCP/IP protocols over the Ethernet. MCMSCADA can also use 4 RS485 / RS232 communication protocols. MCMSCADA harnesses the power afforded by these techniques and allows remote access to the database so that the status of motors monitored by MCM can be viewed from within the local area network. (Artesis,2009) MCMSCADA has a user-friendly graphic interface to inform user about motor condition. It is possible to see all the motor information in diagnosis window. The user could get diagnostic information without having any detailed information or experience about motor failures with MCMSCADA. Fault diagnosis and severitylevel Motor or generator data Condition assessment report Advanced analysis Figure 8. : Diagnostic window of Unit 2 motor Loose foundation Unbalance Action urgency Figure 7 : MCMSCADA diagnostic window 5. CASE STUDY Artesis MCM has been used for many years in different industrial applications. In the following case a pump motor failure is demonstrated. The motor is named as Unit 2 and its label data is given in Table II Table II : Pump motor data Motor Data Nominal Voltage 380V Nominal Current 284 A Connection Type Delta Nominal Speed 1480 Power Factor 0,85 Figure 9 : PSD curve of Unit 2 motor When the deviation of loose foundation failure in short and long term, it could be seen the failure’ development. Regarding Fig 10, loose foundation failure started to grow on 29.04.2008 and it reached its maximum value on 17.02.2009. Actually, when MCM gave alarm, maintenance team decided to check the Unit 2 motor next periodical maintenance on 19.02.2009. During maintenance, they realised some loosen bolts on the motor and fixed them. Just after maintenance on 19.02.2009, magnitude of failure went down obviously. 29.04.2008 19.02.2009 12.11.2008 (a) Unit 2 motor is running as a pump in a water distribution centre in İstanbul. MCMSCADA gave an alarm on 12.11.2008. The diagnostic screen of Unit 2 motor is given in Fig. 8. Regarding diagnostic window, there was loose foundation, unbalance and driven equipment failures. Loose foundation failure manifest itself frequency spectrum of the motor current. It is mostly shown between 0 – 20 Hz. When the PSD curve of Unit 2 is examined, it could be seen evidence of loose foundation failure clearly. PSD curve is given in Fig. 9. Unbalance produces harmonic signals around supply frequency. There are two symmetrical harmonic components close to supply frequency. 19.02.2009 (b) Figure 10 : Loose foundation deviaton of Unit 2 motor (a) long term (b) short term 6. CONCLUSIONS This paper presents a new and easy to use tool to detect and diagnosis failures on three phase induction motors. Although all failure detection and diagnosis techniques require expert people, Artesis MCM could be utilized by any person who has minor electrical information. MCM uses motor’ current 5 and voltage as an input. This makes MCM very useful on industrial applications, because it does not need to reach the motor, since motor could be located very hard places. In summary, Artesis MCM and MCMScada become the predictive maintenance an easy operation requiring no expert information. References : Albas Evren, Durakbasa Tugrul, Eroglu Deniz, Turan Hakan, Cizmeci Hasmet, Proving the Performance of a Novel Motor Fault Detection Methodology, 1999 Walt van der C, Duyar, A. Walker G., Bates, A. , MCM; An Inexpensive, Simple to Use Model Based Condition Monitoring Technology, Journal of Maintenance And Asset Management, 2006, VOL 21; Numb 3, pages 13-22 Zhongming YE, Bin WU, “A Review on Induction Motor Online Fault Diagnosis”, The Thidr International Power Electronics and Motion Control Conference, Vol. 3 13531358, August 2000 Bonett Austin, Root Cause AC Motor Failure Analysis with a Focus on Shaft Failures, IEEE Transactions on Industry Applications, Vol 36, No:5, September 2000 Bonett Austin, Young Chuck Explaining motor failure, Oct 1, 2004, Electrical Construction & Maintenance (EC&M) magazine, www.ecmweb.com Bonett, Austin H. Bonnett, George C. Soukup, Cause and Analysis of Stator and Rotor Failures in Three-phase Squirrel-Cage Induction Motors, IEEE Transactions on Industry Applications, vol. 28, no. 4, July / August 1992 Duyar A., V. Eldem, W. C. Merrill, and T. Guo, “Fault Detection and Diagnosis in Propulsion Systems: A Fault Parameter Estimation Approach,” AIAA Journal of Guidance, Control and Dynamics, vol. 17, no. 1, pp. 104-108, 1994. Duyar A.and Merrill W. C., ”Fault Diagnosis For the Space Shuttle Main Engine,” AIAA Journal of Guidance, Control and Dynamics, vol. 15, no. 2, pp. 384-389, 1992. Duyar Ahmet, Bates Andy, Kuzkaya Caner, Chang Tim, Artesis – Simplifying Predictive Maintenance, 4th World Congress On Maintenance, 2008 Litt J., M. Kurtkaya, and A. Duyar, ”Sensor Fault Detection and Diagnosis of the T700 Turboshaft Engine,” AIAA Journal of Guidance, Control and Dynamics, vol. 187, no. 3, pp. 640-642, 1995. MCMSCADA User Manual, 2009, Artesis A.S. Musgrave J. L., T. Guo, E. Wong, and A. Duyar, “Real-Time Accommodation of Actuator Faults on a Reusable Rocket Engine,” IEEE Trans. Cont. Syst. Technol., vol. 5, no. 1, pp. 100-109, Jan. 1997. Raymond S.,Predictive Maintenance of Pumps Using Condition Monitoring , ISBN: 1856174085, Pub. Date: April 2004, Publisher: Elsevier Science & Technology Books 6