1
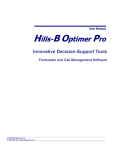
IBM Tealeaf cxView
Version 9 Release 0.1
December 4, 2014
cxView User Manual
Note
Before using this information and the product it supports, read the information in “Notices” on page 105.
This edition applies to version 9, release 0, modification 1 of IBM Tealeaf cxView and to all subsequent releases and
modifications until otherwise indicated in new editions.
© Copyright IBM Corporation 1999, 2014.
US Government Users Restricted Rights – Use, duplication or disclosure restricted by GSA ADP Schedule Contract
with IBM Corp.
Contents
cxView User Manual . . . . . . . . . v
Chapter 1. Overview of cxView . . . . . 1
Access . . . .
Scorecards . . .
Dashboards . . .
Report Scheduling
Import/Export. .
Administration .
cxView Features .
.
.
.
.
.
.
.
.
.
.
.
.
.
.
.
.
.
.
.
.
.
.
.
.
.
.
.
.
.
.
.
.
.
.
.
.
.
.
.
.
.
.
.
.
.
.
.
.
.
.
.
.
.
.
.
.
.
.
.
.
.
.
.
.
.
.
.
.
.
.
.
.
.
.
.
.
.
.
.
.
.
.
.
.
1
1
2
2
3
3
3
Chapter 2. Using Scorecards . . . . . . 5
Scorecard Terminology . . . .
General Scorecard Terms . . .
Scorecard types . . . . . .
Business Process Scorecard Terms
KPI Scorecard Terms. . . . .
Scorecard Report Data . . . .
Displaying Scorecards . . . .
Scorecard toolbar . . . . . .
Opening a Scorecard. . . . .
Date Selector . . . . . . .
Configuring scorecard period .
Configuring for different dates
periods . . . . . . . .
Scheduling Scorecard Snapshots
Exporting Scorecards . . . .
Overview of KPI Scorecards . .
KPI Summary . . . . . .
Details . . . . . . . . .
KPI Details . . . . . . .
Metrics . . . . . . . .
Total Activity . . . . . .
Indicator . . . . . . .
Multiple KPI Scorecards . . .
Overview of Process Scorecards
Key Metrics . . . . . . .
Rates . . . . . . . . .
Process Step . . . . . . .
Detail drilldown . . . . .
Process Step Dropoff . . . .
Count drilldown. . . . .
. . . . . .
. . . . . .
. . . . . .
. . . . . .
. . . . . .
. . . . . .
. . . . . .
. . . . . .
. . . . . .
. . . . . .
. . . . . .
and comparison
. . . . . .
. . . . . .
. . . . . .
. . . . . .
. . . . . .
. . . . . .
. . . . . .
. . . . . .
. . . . . .
. . . . . .
. . . . . .
. . . . . .
. . . . . .
. . . . . .
. . . . . .
. . . . . .
. . . . . .
. . . . . .
Chapter 3. Configuring Scorecards
Overview . . . . . . .
General Tab_b . . . . .
History Tab_a . . . . .
Purging Scorecard Data . .
Overview . . . . . . .
General Tab . . . . . .
Selecting dimension values
KPIs Tab . . . . . . .
KPI Properties . . . .
Permissions Tab . . . . .
Saving . . . . . . . .
© Copyright IBM Corp. 1999, 2014
.
.
.
.
.
.
.
.
.
.
.
.
.
.
.
.
.
.
.
.
.
.
.
.
.
.
.
.
.
.
.
.
.
.
.
.
.
.
.
.
.
.
.
.
.
.
.
.
.
.
.
.
.
.
.
.
.
.
.
.
.
.
.
.
.
.
.
.
.
.
.
.
.
.
.
.
.
.
.
.
.
.
.
.
5
5
6
6
6
7
7
8
8
9
9
10
10
12
13
13
14
14
14
14
14
15
15
16
17
17
18
18
18
. . 19
.
.
.
.
.
.
.
.
.
.
.
.
.
.
.
.
.
.
.
.
.
.
.
.
.
.
.
.
.
.
.
.
.
20
21
23
24
24
25
26
26
27
29
29
KPI Scorecard Calculations . . . . . . .
Event Counts and Weighting . . . . . . .
Unweighted KPI Calculations . . . . . . .
Weighted KPI Calculations . . . . . . . .
Configuring Process Scorecards . . . . . . .
Accessing . . . . . . . . . . . . . .
General tab_a. . . . . . . . . . . . .
Events tab . . . . . . . . . . . . . .
Process Steps . . . . . . . . . . . .
Overall Abandonment Event. . . . . . .
Step Abandonment Events . . . . . . .
Overall Failure Event . . . . . . . . .
Failure Events . . . . . . . . . . .
Grades tab. . . . . . . . . . . . . .
Permissions tab . . . . . . . . . . . .
Saving . . . . . . . . . . . . . . .
Creating Events for Business Process Scorecards
Process step events . . . . . . . . . . .
Failure step events . . . . . . . . . . .
Abandonment step events . . . . . . . .
Example Scorecards . . . . . . . . . .
Example Business Process . . . . . . . .
Process Steps . . . . . . . . . . . .
Process Web Pages . . . . . . . . . . .
Example 1: Checkout Process Scorecard . . . .
Example 2: Checkout Process Scorecard with
Advanced Abandonment . . . . . . . . .
Example 3: New User Registration. . . . . .
Example 4: Insurance Policy Purchase . . . .
KPI Scorecard Example 1: Checkout . . . . .
KPI Scorecard Examples: Retail Shopping Site . .
Events used . . . . . . . . . . . .
KPI Scorecard Example 2: Checkout . . . . .
KPI Scorecard Example 3: Site Errors . . . . .
KPI Scorecard Example 4: Spiders . . . . . .
KPI Scorecard Example 5: Transaction Failures. .
KPI Scorecard Example 6: Unacceptable Response
Time. . . . . . . . . . . . . . . .
KPI Scorecard Example 7: Multiple Applications .
Scorecards . . . . . . . . . . . . . .
Dashboards . . . . . . . . . . . . .
Scorecard Aggregation Dates . . . . . . .
Overview . . . . . . . . . . . . . .
Rolling Back Scorecard Aggregation Dates . . .
Verifying Scorecard Data . . . . . . . .
Forcing Scorecard Recalculation Using All
Available Data . . . . . . . . . . .
.
.
.
.
.
.
.
.
.
.
.
.
.
.
.
.
.
.
.
.
.
.
.
.
30
30
30
31
31
32
33
33
34
35
36
36
36
37
38
38
38
39
39
39
39
40
40
40
41
.
.
.
.
.
.
.
.
.
.
41
42
42
43
43
43
45
45
46
46
.
.
.
.
.
.
.
.
46
46
47
47
47
47
48
49
. 49
Chapter 4. Using Dashboards . . . . . 51
Dashboard Options . . . . .
Report Access Permissions . .
Configuring Dashboards . . .
Dashboard Report Data . . .
Dashboards Provided by Tealeaf
Dashboard Tabs and Components
.
.
.
.
.
.
.
.
.
.
.
.
.
.
.
.
.
.
.
.
.
.
.
.
.
.
.
.
.
.
.
.
.
.
.
.
.
.
.
.
.
.
52
52
53
53
53
54
iii
Exporting Dashboards .
.
.
.
.
.
.
.
.
.
. 55
Chapter 5. Configuring Dashboards . . 57
Overview . . . . . . . . . . . .
Overview of Configuring Dashboards . .
Configure email address . . . . . .
Configuration options . . . . . . .
Getting Started . . . . . . . . . .
Creating a Dashboard . . . . . . . .
General Tab . . . . . . . . . . .
Tabs tab . . . . . . . . . . . .
Adding and arranging tabs . . . . .
Organizing components in a tab . . .
Permissions Tab . . . . . . . . . .
Components Screen. . . . . . . . .
Adding or Removing Components from a
Dashboard. . . . . . . . . . . .
Adding a report component . . . . .
Editing a Component . . . . . . . .
Removing a Component . . . . . . .
Component Templates . . . . . . . .
Adding a component . . . . . . .
Dashboard Component Templates . . . .
Accessing Dashboard Component Templates
Common Dashboard Component Properties
Common properties in the Data tab . .
Common properties in the Display tab .
Dashboard Component Template Types . .
Alerts . . . . . . . . . . . .
Basic Components . . . . . . . .
Client Performance Page Detail . . . .
Client Performance Summary . . . .
CX: Active Status . . . . . . . .
CX: Canister Status . . . . . . . .
CX: Database Size . . . . . . . .
CX: DecoupleEx Status . . . . . .
CX: HBR Status . . . . . . . . .
CX: Storage Status . . . . . . . .
Live Event Counts . . . . . . . .
Performance Reports . . . . . . .
iv
IBM Tealeaf cxView: cxView User Manual
.
.
.
.
.
.
.
.
.
.
.
.
.
.
.
.
.
.
.
.
.
.
.
.
.
.
.
.
.
.
.
.
.
.
.
.
57
57
57
58
58
59
59
60
60
61
62
63
.
.
.
.
.
.
.
.
.
.
.
.
.
.
.
.
.
.
.
.
.
.
.
.
.
.
.
.
.
.
.
.
.
.
.
.
.
.
.
.
.
.
.
.
.
.
.
.
.
.
.
.
.
.
.
.
.
.
.
.
.
.
.
.
.
.
.
.
.
.
.
.
64
65
65
66
66
66
66
66
67
68
68
69
69
70
70
71
72
74
76
76
77
78
79
80
Report Builder . . . . . . . . .
Scorecards: KPI . . . . . . . . .
Scorecards: Process . . . . . . . .
Top Movers . . . . . . . . . .
User Activity Reports . . . . . . .
Visitor Segment Reports . . . . . .
Setting the Default Dashboard . . . . .
Overview . . . . . . . . . . . .
General Tab . . . . . . . . . . .
History Tab . . . . . . . . . . .
Managing Report Templates for Dashboards
.
.
.
.
.
.
.
.
.
.
.
.
.
.
.
.
.
.
.
.
.
.
.
.
.
.
.
.
.
.
.
.
.
81
82
83
84
85
87
89
90
91
93
94
Chapter 6. Importing and Exporting
Reports . . . . . . . . . . . . . . 95
Exporting Report Data.
Report Templates . .
.
.
.
.
.
.
.
.
.
.
.
.
.
.
.
.
.
.
. 95
. 95
Chapter 7. Exporting Report Templates 97
Limitations . . . . .
Recommended Workflow .
Export Template Steps . .
.
.
.
.
.
.
.
.
.
.
.
.
.
.
.
.
.
.
.
.
.
.
.
.
Chapter 8. Importing Report Templates
Limitations . . . .
Import Template Steps.
.
.
.
.
.
.
.
.
.
.
.
.
.
.
.
.
.
.
. 97
. 97
. 98
99
. 99
. 99
Chapter 9. Enhancements to Top
Movers for cxView . . . . . . . . . 101
Features . . . . . . .
Creating Top Movers . . .
Reporting on Top Movers .
.
.
.
.
.
.
.
.
.
.
.
.
.
.
.
.
.
.
.
.
.
. 101
. 101
. 102
Chapter 10. IBM Tealeaf
documentation and help. . . . . . . 103
Notices . . . . . . . . . . . . . . 105
Trademarks . . . . . . .
Privacy Policy Considerations .
.
.
.
.
.
.
.
.
.
.
.
.
. 107
. 107
cxView User Manual
cxView enables to configuration and use of scorecards and dashboards. Through
the Tealeaf® Portal, you can create and edit scorecards that are based on current
Tealeaf data. You can also populate them into dashboards that can be scheduled for
generation and shared with other Tealeaf users. Use the following links to access
sections of the cxView User Manual.
© Copyright IBM Corp. 1999, 2014
v
vi
IBM Tealeaf cxView: cxView User Manual
Chapter 1. Overview of cxView
IBM Tealeaf cxView enhances the IBM Tealeaf cxImpact portal with scorecards and
dashboards. These features serve as entry points for drill-down into session and
visitor data for further analysis. Scorecards and dashboards can be configured
through the Tealeaf Portal.
Note: IBM Tealeaf cxView is a separately licensable component of the IBM Tealeaf
CX system. please contact your IBM Tealeaf representative.
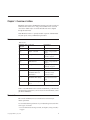
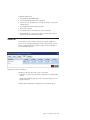
Access
Table 1. Access
IBM Tealeaf cxView Portal menu
Component
Documentation
Scorecards
Using
Analyze > Scorecards
Chapter 2, “Using Scorecards,”
on page 5
Configuring
Configure > Scorecards
Chapter 3, “Configuring
Scorecards,” on page 19
Using
Dashboards menu
Chapter 4, “Using Dashboards,”
on page 51
Configuring
Configure > Dashboards
Chapter 5, “Configuring
Dashboards,” on page 57
Users
Tealeaf > Portal Management >
IBM Tealeaf cxView User
Administration
"cxView User Administration" in
the IBM Tealeaf cxImpact
Administration Manual
Settings
Tealeaf > Portal Management >
IBM Tealeaf cxView Settings
"cxView Settings" in the IBM
Tealeaf cxImpact Administration
Manual
Scorecards Settings
Tealeaf > Portal Management
various
“Scorecards” on page 47
Dashboards
Administration
Note: To access IBM Tealeaf cxView scorecards and dashboards, you must have the
appropriate menu permissions in your user account. For more information, contact
your Tealeaf administrator.
Scorecards
KPI Scorecards and Business Process Scorecards can be used to track your
website's performance.
You can track the business performance of your website through scorecards. There
are two types of scorecards.
v For more information about using scorecards, see Chapter 2, “Using Scorecards,”
on page 5.
© Copyright IBM Corp. 1999, 2014
1
1. KPI Scorecards - These scorecards measure key performance indicators and
score the health of online business services that are based on visitors' actual
experiences. They measure availability of a functional unit to your visitors.
v Trends can be indicated by using color-coded status indicators and
easy-to-understand charts. Changes in success rates or KPIs are measured in
both absolute and percentage terms and are illustrated by using an
easy-to-read up/down arrow indicator. Metrics can be viewed for the current
hour or day or across days, weeks, and months.
v See “Overview” on page 24.
2. Business Process Scorecards - Scorecards automatically measure and score
overall success, abandonment, and failure rates within each step of a business
process. This procedure can be implemented for a critical online business
process or across entire process. A process scorecard tracks the success or
failure of each step in the business process. They can also be configured to
detect events that summarily indicate failure or abandonment of the process.
v For any business process, you can test hypotheses to determine the issues or
occurrences that cause changes in success rates. For example, you can test the
impact of a usability issue or an error on your overall conversion rate,
customer completions, and even top-line revenue.
v See “Configuring Process Scorecards” on page 31.
For more information about using scorecards, see Chapter 2, “Using Scorecards,”
on page 5.
For more information about configuring scorecards in general, see Chapter 3,
“Configuring Scorecards,” on page 19.
Dashboards
Use dashboards to view reports of the data that is captured by Tealeaf in a rich
graphical layout. They can be easily customized for specific roles and
responsibilities to show only the most relevant reports and metrics.
Dashboard reports can include:
1. Scorecards
2. Reports that are provided by Tealeaf
3. Ad hoc reports that you build in the Report Builder. See "Tealeaf Report
Builder" in the IBM Tealeaf Reporting Guide.
For more information about using dashboards, see Chapter 4, “Using Dashboards,”
on page 51
. For more information about configuring dashboards, see Chapter 5, “Configuring
Dashboards,” on page 57
Report Scheduling
Snapshot reports of scorecards and dashboards can be distributed through email
on demand or scheduled on a daily, weekly, or monthly basis. Emailed snapshots
include a link back to the live report for immediate click-through to deeper
analysis.
v For more information about scheduling scorecards, see Chapter 3, “Configuring
Scorecards,” on page 19.
v For more information about scheduling dashboards, see Chapter 5, “Configuring
Dashboards,” on page 57.
2
IBM Tealeaf cxView: cxView User Manual
Import/Export
You can import and export report templates and other Tealeaf data for use across
Tealeaf environments and in other enterprise systems.
See "Importing and Exporting Reports" in the IBM Tealeaf cxView User Manual.
v Tealeaf publishes report templates that you can download through Tealeaf. These
templates can be imported and customized to meet the requirements of your
Tealeaf solution.
Administration
IBM Tealeaf cxView provides user permission controls to manage users and
groups, which enables careful control over access to scorecards and dashboards.
v See "cxView User Administration" in the IBM Tealeaf cxImpact Administration
Manual.
You can configure settings that apply specifically to scorecard and dashboard
configuration and data retention.
v See "cxView Settings" in the IBM Tealeaf cxImpact Administration Manual.
You can also configure global settings that apply to all Tealeaf scorecards in the
system.
v See “Scorecards” on page 47.
cxView Features
For more information about portal features that are enabled with cxView, see
"Portal Navigation" in the IBM Tealeaf cxImpact User Manual.
Chapter 1. Overview of cxView
3
4
IBM Tealeaf cxView: cxView User Manual
Chapter 2. Using Scorecards
Scorecards can be used to monitor site performance that is based on pre-defined
performance metrics. You can use scorecards to measure specific Tealeaf events,
visitor conversion rates, and other key performance indicators.
v You can also apply dimensions or dimensional values as filters to your scorecard
data. Scorecards with dimensional filters include only the data where the
dimensional values are also present.
Note: Use and configuration of scorecards requires the IBM Tealeaf cxView
license. For more information, contact your Tealeaf administrator.
v To access scorecards, select Analyze > Scorecards in the Tealeaf Portal.
v For more information about creating scorecards, see Chapter 3, “Configuring
Scorecards,” on page 19.
Scorecard Terminology
Before you begin, familiarize yourself with the following scorecard terms.
General Scorecard Terms
Term
Definition
Business Process
A coherent unit of a workflow that is meaningful in a business sense.
Examples include placing an order for products at an online shopping site
or registering for a new user account at an online banking site.
Availability
Measure of the percentage of all occurrences of a functional unit usage on
the website when it responded normally. Timeouts, missing pages, and
other errors render a web application less than 100 percent available to its
users.
Focus Period
The time period that is the principal focus of the scorecard currently being
viewed.
Comparison Period
The time period that provides the baseline scorecard to which the focus
period's scorecard is compared.
v If the comparison feature is enabled, the scorecard for the focus period is
compared to the scorecard generated from data for the comparison
period.
Positive Comparison
For the purposes of rating and grading, positive comparison means that
higher numerical percentage values for specific quantity result in a higher
scorecard letter grade.
Negative Comparison
For the purposes of rating and grading, negative comparison means that
lower numerical percentage values are for specific quantity result in a
© Copyright IBM Corp. 1999, 2014
5
higher scorecard letter grade. This comparison is useful when the rated
indicator is undesirable, such as the frequency of occurrence of an HTTP
error status code.
Scorecard types
IBM Tealeaf cxView provides two different types of scorecards:
Table 2. Scorecard types
Type
Description
Terminology
Key Performance
Indicators (KPI)
Scorecards
KPI Scorecard Terms “Overview” on
These scorecards measure
page 24
key performance indicators
and score the health of
online business services
that are based on visitors'
actual experiences. They
measure availability of a
functional unit to your
visitors.
Process
Scorecards
These scorecards
automatically measure and
score overall success,
abandonment, and failure
rates within each step of a
critical online business
process or across the entire
process.
Business Process
Scorecard Terms
Configuration
“Configuring
Process Scorecards”
on page 31
Business Process Scorecard Terms
These terms pertain to business process scorecards specifically:
Term
Definition
Process Steps
The sequence of steps that is defining the required flow through a business
process. For example, the process of placing an order for products includes
steps to specify the kinds and quantities of products to order. It also
includes customer's identification and shipping address, and payment
method information.
Abandon Step
An event or a set of events that represents abandonment of a business
process by the visitor. For example, a request from the visitor's web
browser for the Order Canceled page signifies the abandonment of an
order placement process.
Failure Step
An event or set of events that represent the failure of a business process.
For example, the appearance of an HTTP 500 (internal server error) page
signifies failure of a business process.
KPI Scorecard Terms
These terms pertain to key performance indicator (KPI) scorecards specifically:
Term
6
Definition
IBM Tealeaf cxView: cxView User Manual
Activity Indicator
An indicator of the general activity or traffic on a web application
regardless of success, failure, or availability. It can be the total number of
web application sessions, hits, or the count of a particular Canister event. It
is used as the denominator in KPI percentage rating calculations.
Availability Indicator
An event that indicates either that the system is available or unavailable.
The count of HTTP responses whose HTTP status code is 200 (success)
indicates availability, while HTTP 500 (internal server error) is an indicator
of non-availability.
Scorecard Report Data
At regular intervals, the Tealeaf data collector polls each canister for session data to
aggregate and store in the appropriate databases. When a scorecard or dashboard
is queried, this aggregated data is used to populate the report.
v Typically, the Data Collector polls at 5-minute intervals. For more information
about settings, see "CX Settings" in the IBM Tealeaf cxImpact Administration
Manual.
The Data Collector requires access to all Canisters in the Tealeaf environment, and
all Canisters must be receiving data. If an active Canister is not receiving data or
cannot be reached because of network interruption, the Data Collector fails the
data collection process. It happens as running a partial collection corrupts the
reports that use it.
Note: All Tealeaf Canisters must be receiving session data and must be accessible
over the network. If any canister is unavailable or not receiving data, report data
collection is suspended. Scorecards and dashboards are not updated with new data
until the problem is fixed. When collection resumes, reports are not updated until
all spooled canister data is collected, aggregated, and stored in the database.
v Hits are evaluated against the set of current set of events at the time of
evaluation. If hits are spooled or otherwise not processed immediately, there can
be effects in reporting if changes are made to event-related objects in the interim.
For more information, "Tealeaf Event Manager" in the IBM Tealeaf Event Manager
Manual.
v For more information about data collection, see "Data Aggregation and
Retention" in the IBM Tealeaf cxImpact Administration Manual.
v For more information about managing Canisters, see "Managing Tealeaf Servers"
in the IBM Tealeaf cxImpact Administration Manual.
Displaying Scorecards
To display existing scorecards, you must select the scorecard, the period, and the
focus period.
Chapter 2. Using Scorecards
7
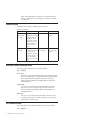
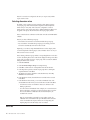
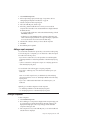
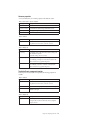
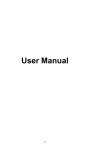
Scorecard toolbar
Figure 1. Scorecard toolbar
Table 3. Scorecard toolbar.
Icon
Command
Description
Date Selector
Select a current focus date range
and optionally a comparison
date range for the scorecard.
Open
Open a selected scorecard.
Schedule Snapshot
Schedule a snapshot of the
scorecard for delivery to
selected recipients through
email.
Export Report
Export the currently configured
scorecard to Excel or PDF.
Add to Dashboard
Add the current scorecard to a
selected dashboard tab. See
"Tealeaf Report Builder" in the
IBM Tealeaf Reporting Guide.
Period
Select the period for the
scorecard, which determines
what data period to use for the
aggregated data: counts in daily,
weekly, monthly, or quarterly
periods. Based on this selection,
the calendar selects ranges of
the appropriate size.
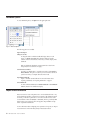
Opening a Scorecard
Complete the following steps to open a scorecard.
v Scorecards can be configured through the Portal menu and made available to
other Tealeaf users for selection. See Chapter 3, “Configuring Scorecards,” on
page 19.
1. To begin, select Analyze > Scorecards from the Tealeaf Portal menu.
) icon.
2. In the toolbar, click the (Open
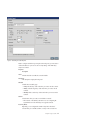
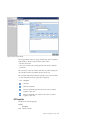
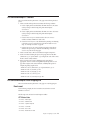
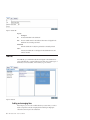
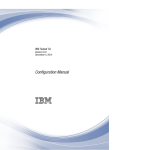
3. The Scorecard Selector is displayed:
8
IBM Tealeaf cxView: cxView User Manual
Figure 2. Scorecard Selector
4. Browse the list of available scorecards.
v To filter the list, enter text in the textbox and press Return.
v For the filter string, do not include wildcards. For example, entering check
can return Calculated checkout, checkout, and Checkout Metrics, which can
be in different categories.
v To display the scorecards by their scorecard type, select the View by Labels
check box.
Note: You can view all scorecards that you create or that are shared to you.
If you cannot find a shared scorecard, contact your Tealeaf administrator or
the creator of the scorecard.
5. To display the scorecard, click Select. The scorecard is displayed.
6. To change the focus period and the comparison period for the scorecard, click
the date in the toolbar. The Date Selectoris displayed.
You can use the controls in the toolbar to change the scorecard, as needed.
v For more information about displaying key performance indicator scorecards,
see “Overview of KPI Scorecards” on page 13.
v For more information about displaying business process scorecards, see
“Overview of Process Scorecards” on page 15.
v Displayed scorecards can be exported to Excel, HTML, and PDF formats, and
also sent to the printer. See “Exporting Scorecards” on page 12.
Date Selector
By default, scorecards are configured to display report data from the current date.
Configure report to display data from a period of days, compare the data from the
focus period to a comparable period, or both.
Configuring scorecard period
You can configure the scorecard to aggregate data based on the selected period.
Select one of the following options from the Period drop-down
Chapter 2. Using Scorecards
9
v
v
v
v
Day
Week - business week
Month
Quarter
This selection defines the period to use for the aggregated data, which forces the
calendar to select ranges of the appropriate size. The scorecard is updated to
display report data for the relevant period.
For reporting purposes, the beginning of the week is defined as Sunday.
v The beginning of each quarter is January, April, July, and October.
Configuring for different dates and comparison periods
To change the base date for the focus period and optionally to configure a
comparison period, complete the following steps.
v When configured, a comparison period scorecard is displayed side-by-side
on-screen and in exported reports with the focus period scorecard.
1. To change the focus period, click the date in the toolbar. The Date Selector is
displayed:
2. In the Date Selector, select the first day of the time period on which to focus.
v You can use << and >> to choose time periods relative to the current date.
v If you have select a period other than Day, a range of dates around the
selected date is automatically selected for you.
3. Comparison Period: Optionally, you can create a side-by-side comparison of the
focus period with another period in the scorecard. Click the Compare to Date
Range check box.
a. A yellow range box is displayed. Select the start date of the comparison
period. Press SHIFT and select the end date of the comparison period.
4. To generate the scorecard for the selected focus period and comparison period,
click Apply.
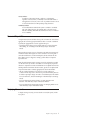
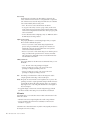
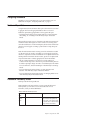
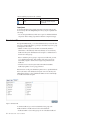
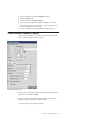
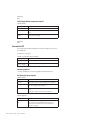
Scheduling Scorecard Snapshots
You can schedule the snapshot and delivery of scorecards. Scorecards snapshots are
delivered in PDF, HTML, or Excel format to specified email addresses on a daily,
weekly, or monthly basis.
v For more information about configuring access permissions, see "Report Access
Permissions" in the IBM Tealeaf cxImpact Administration Manual.
10
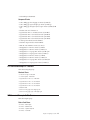
IBM Tealeaf cxView: cxView User Manual
Figure 3. Scheduling Scorecard Snapshots
Note: To configure and deliver report snapshots from the portal, you must enter a
valid email address for your user account. See "My Settings" in the IBM Tealeaf
cxImpact User Manual.
Properties
Description
Active
Click the check box to enable the scorecard schedule.
Description
This description is displayed in the portal.
Schedule
Schedule the scorecard by type:
v Daily-Select the days of the week when you want to run the scorecard.
v Weekly -Select the single day of the week when you want to run the
scorecard.
v Monthly -Click to set the day of the month when you want to run the
scorecard.
Send At
Select the time when you want to run and deliver scorecard.
v Time is based on the Tealeaf system time zone. See "Configuring the
System Timezone" in the IBM Tealeaf CX Configuration Manual.
Focus Day Offset
Optionally, you can configure the number of days before the date of
execution that you would like to define as "today" in the scorecard. For
Chapter 2. Using Scorecards
11
example, you might configure a scorecard to be run on Tuesday morning
to delivers Monday's data to users. In this case, you would set the offset
value to 1.
Language
Select the language to use in the scorecard from the Language drop-down..
Recipients
Enter a comma-separated list of email addresses or aliases to whom to
send the scorecard.
Scorecard
Click the link to select the scorecard to send. Select the scorecard and click
Select.
Data Interval
Select the scorecard date interval. The period is defined relative to the date
of the scorecard execution, factoring the Focus Date Offset. For example, a
scorecard that run on Sunday evening with an offset of three days with a
Data Interval of Day delivers scorecard data from Thursday.
v To generate a scorecard that includes comparison data from the
preceding Data Interval, select the Comparecheck box.
Email Format
Select the format of the email scorecard:
v PDF - Scorecard is attached to the email as a PDF file.
v HTML - Scorecard is rendered as an HTML page.
v
Excel (XML) - Scorecard is attached to the email as an XML file that is
readable in Excel.
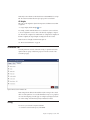
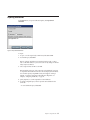
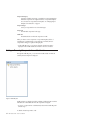
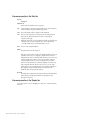
Exporting Scorecards
You can export scorecards into three different formats: Excel, PDF and email.
) in the toolbar. Select the
To export a displayed scorecard, click the Export (
type of export:
v Excel - Export the report data in XML format for use in Microsoft Excel.
v PDF - Generate the report in PDF format.
v Email - Mail the report to selected email addresses:
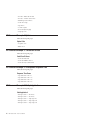
12
IBM Tealeaf cxView: cxView User Manual
Figure 4. Email Scorecard
1. Choose the format for the delivered report. You can select more than one:
v Send PDF
v Send XLS
v Send HTML
2. In the Message textbox, you can include an optional message that is inserted as
the body of the email.
3. In the Recipientstextbox, enter a comma-separated list of recipient email
addresses.
4. To email the report, click Send.
v To cancel, click Cancel.
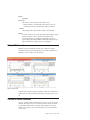
Overview of KPI Scorecards
KPI scorecards typically show how values or ratios are comparing to your site's
predefined scoring model. For example, values such as the number of page views
or ratios such as conversion rates can be represented in chart form. Ratios such as
conversion rates across time can be displayed in pie charts, bar charts, and other
representations.
KPI Summary
The summary for a KPI scorecard displays a grade distribution for the scorecard's
KPIs for the selected period. Based on the configuration, the grades indicate
whether the KPIs are in a good or bad state. The pie charts for the Focus period
(and the Comparison period, if any) show the breakdown of grades by KPI group.
Each slice of the pie corresponds to one letter grade. The proportion of each letter
grade as a fraction of the number of distinct grades that received is shown. For
example, if you have three KPI groups and two are receiving an A grade while the
third group is receiving a C. The pie chart indicates that 66.67% of the KPI groups
are getting an A and 33.33% are receiving a C.
Chapter 2. Using Scorecards
13
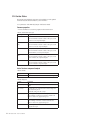
Details
For each KPI group, you can review the following quantities for the Focus period
and any available Comparison period, including the rate of change.
Column
Description
KPI
Name of the KPI
v You can click links in the KPI column of the table go to the detail page
for each KPI group.
Goal
The optimal rate for the group.
Grade
Letter grade: A, B, C, D, or F.
Rating Numerical ratio which is underlying the letter grade:
KPI indicator count divided by activity indicator count
Change If there is a comparison period that is shown, the change between the
comparison period and the focus period is shown.
v A green upward-pointing or red downward-pointing arrow is displayed
corresponding to positive or negative change.
v The numerical difference between the rating of the focus period and that
of the comparison period is also displayed.
KPI Details
Click a KPIlink to open the KPI Detailwindow, which provides a breakdown of
each event in the KPI and the base activity count.
v You can select an event count to display the Event Chart for period that is
showing a daily or hourly breakdown of the event.
v If compared to another period, the comparison counts and the appropriate delta
markers (Up and Down Arrows) are displayed.
The summary row is calculated based on the Summary Calculation setting.
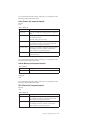
Metrics
Field
Description
Rating The KPI level during the time period that is reported.
Goal
The required KPI level that is defined in the scorecard. A Change value is
not shown for this quantity because it is a property of the scorecard, not a
value that is calculated from collected data.
Grade
The letter grade corresponding to the Rating value.
Total Activity
The total count of the scorecard's KPI events for the focus period.
If a comparison period is enabled, the count for the comparison period is also
shown. It also shows change in the count from the comparison period to the focus
period.
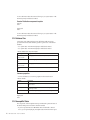
Indicator
For each KPI indicator in the scorecard, this table shows the following quantities:
14
IBM Tealeaf cxView: cxView User Manual
Column
Description
Event Count
The absolute count of occurrences of the indicator event.
v Click this number to search and retrieve the relevant sessions. See
"Searching Session Data" in the IBM Tealeaf cxImpact User Manual.
% Activity
The percentage of the count of the Base Activity event for the KPI.
Change
If comparison period is shown, the change between the comparison period
and the focus period is shown. A green upward-pointing or red
downward-pointing arrow is displayed corresponding to positive or
negative change. The numerical difference between the rating of the focus
period and that of the comparison period is also displayed.
Multiple KPI Scorecards
Multiple scorecards can be defined, and each can be composed of multiple
user-defined components and component types. As seen in the example below, a
distribution of scores can be shown with a pie chart.
Figure 5. KPI Scorecard
A trend diagram and today/yesterday comparisons of KPIs can be used. KPIs can
be built upon other KPIs, providing enhanced analysis of specific aspects of your
site.
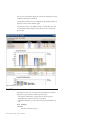
Overview of Process Scorecards
A process scorecard is based on defined steps for processes on your site. A typical
example is the checkout process for a retail site, in which each step is monitored
by a pre-defined Tealeaf event. For each step, absolute numbers of visitors are
counted, and a conversion rate is calculated. A grade can be associated with the
conversion rate.
Chapter 2. Using Scorecards
15
The Process scorecard summary displays the counts for the selected process: Starts,
completions, abandonments, and failures.
If abandonment and failure events are configured, the appropriate percentages are
displayed on the Success Rate Indicators graph.
The grades for each process are displayed with the associated rating. The counts
for each individual step are displayed, along with the conversion rate from the
previous step.
Figure 6. Business Process Scorecard
Key Metrics
Key Metrics shows the value of each of the following business process statistics
during the focus period and any available comparison period.
v The change in values from the comparison period to the focus period is
displayed, both as an absolute count and as a percentage.
v Click links in the table to go to the event chart for the event that defines each
step.
Field
Description
Total Starts
Total starts of the business process.
16
IBM Tealeaf cxView: cxView User Manual
Total Completions
Total completions of the business process.
Total Abandonments
Total abandonments of the business process.
Total Failures
Total failures of the business process.
Completion Rate
Ratio of Total Completions to Total Starts.
Change
If there is a comparison period, the change between the comparison period
and the focus period is shown. A green upward-pointing or red
downward-pointing arrow is displayed corresponding to positive or
negative change. The numerical difference between the rating of the focus
period and that of the comparison period is also displayed.
Success Rate Indicators - This column chart and table indicate Completion Rate,
Abandonment Rate, andFailure Rate as percentages of the Total Starts for the
focus period (and the comparison period, if any).
Rates
Field
Description
Grade
Letter grades corresponding to the numerical rates. Focus: Shows the
success rate indicator during the focus period.
Focus
The focus period.
Compare
Shows the success rate indicator during the comparison period, if
comparison is enabled.
Change If comparison period is shown, the change between the comparison period
and the focus period is shown. A green upward-pointing or red
downward-pointing arrow is displayed corresponding to positive or
negative change. The numerical difference between the rating of the focus
period and that of the comparison period is also displayed.
Conversion Count Between Steps - Shows a column chart and table for the
conversion counts between adjacent steps in the business process. It shows the
conversion count during the focus period (and the comparison period, if any).
Click links in the table to go to the event chart for the event that defines each step.
Conversion Rate Between Steps - Shows a column chart and table for the
conversion rates between adjacent steps in the business process. It shows the
conversion rate during the focus period (and the comparison period, if any).
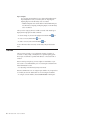
Process Step
In the Process Step report, you can examine the session count breakdowns for each
step of the process. These counts indicate the number of occurrences for each step
of the process and the conversion rate from the previous step to the current one.
Field
Description
Count
Raw count of occurrences of each step of the business process.
v Drilldown links are provided for these counts.
Chapter 2. Using Scorecards
17
Conv
Conversion rate is the count of occurrences of each step, which is divided
by the count of occurrences of the immediately preceding step. Given this
definition, it is impossible to define the conversion rate of the first step in a
process.
Change If comparison period is shown, the change between the comparison period
and the focus period is shown.
A green upward-pointing or red downward-pointing arrow is displayed
corresponding to positive or negative change. The numerical difference between
the occurrence count of each process step in the focus period and comparison
period is displayed as an absolute number and percentage.
Detail drilldown
You can drill down into the individual step counts for a process to a detail chart
for that event over the mentioned period. For a single day, an hourly breakdown is
displayed, and a daily breakdown is shown for multi-day periods.
Process Step Dropoff
In the Process Step Dropoff report, you can examine the number of sessions that
dropped-off of the process between individual steps.
Field
Description
Count
Count of sessions that includes a step in the process (for example, Step 1)
yet drop off and do not include the subsequent step (Step 2).
v Drilldown links are provided for these counts.
Drop % Percentage of the sessions in the previous step that were dropped in the
current step.
Count drilldown
In the Process Step Dropoff report, you can drilldown into individual sessions that
contain a step in the process but not the subsequent one. These drilldown links
examine abandonment between specific steps.
18
IBM Tealeaf cxView: cxView User Manual
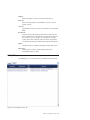
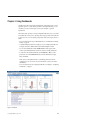
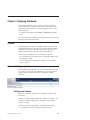
Chapter 3. Configuring Scorecards
You can create your own custom scorecards through the Tealeaf Portal.
v To configure scorecards, select Configure > Scorecards in the Portal menu. The
list of Process Scorecards is displayed.
Note: Configuring scorecards requires the appropriate permissions in your user
account. For more information, contact your Tealeaf administrator.
Figure 7. Configuring Scorecards page
v Active scorecards are indicated with a check box in the Active column.
v The cxResults Compatible column includes a check box if all of the events in the
scorecard are configured to be included in IBM Tealeaf cxResults.
Note: Scorecards that are not compatible with IBM Tealeaf cxResults cannot be
loaded into for Visitor analysis. See "Analyzing Visitor Segments" in the IBM
Tealeaf cxResults User Manual.
To begin creating or editing a scorecard, select the type of scorecard in the left
panel.
Category
Description
Process Scorecards
Process scorecards are used to track business process in your web
application. See “Configuring Process Scorecards” on page 31.
KPI Scorecards
Key Performance Indicator scorecards identify and measure performance
metrics that are critical to your web operations. For more information, see
“Overview” on page 24.
Scorecard Schedules
You can configure execution of scorecards on a daily, weekly, monthly basis
for a configured reporting period and deliver them through email to
selected users. See “Overview” on page 20.
Aggregation Dates
You can review and reset the last date of data to process for the scorecards.
When this button is clicked, the last process date is displayed in the right
panel. You can change the date, if you want to reset or reprocess scorecard
data. See “Scorecard Aggregation Dates” on page 47.
Purge Data
Purge scorecard data for selected scorecards. See “Purging Scorecard Data”
on page 24.
© Copyright IBM Corp. 1999, 2014
19
Report Templates
You can export report templates for use in other Tealeaf installations and
import templates for use in your current system. See "Importing and
Exporting Reports" in the IBM Tealeaf cxView User Manual.
v Additional templates can be downloaded from Tealeaf Online Help. For
more information, "Importing and Exporting Reports" in the IBM Tealeaf
cxView User Manual.
After you select a category, the list of available scorecards of the selected type is
displayed in the right panel. Available commands:
v To edit an existing one, select it in the right panel and click the Edit (
v To create a scorecard, click the New (
)icon.
) icon.
v To delete a scorecard, select it and click Delete (
) icon.
For more information about scorecards, see IBM Tealeaf cxImpact Administration
Guide.
Overview
After you create scorecards, you can configure the execution of snapshots of
scorecards on a daily, weekly, or monthly basis for a specified reporting period.
These reports are delivered to specified email addresses or aliases at the time of
execution.
Note: To email report snapshots, you must configure an email address in your
user account. It is recommended that you do not create snapshot schedules from a
Tealeaf administration account.
v See "My Settings" in the IBM Tealeaf cxImpact User Manual.
Note: Non-administrator users can configure report schedules only for reports that
are owned by the user. The Tealeaf admin can see and configure all schedules.
v To configure scorecard schedules, click Scorecard Schedules in the left pane.
20
IBM Tealeaf cxView: cxView User Manual
Figure 8. Scorecard Schedules
v To configure a new scorecard schedule, click <Create Schedule.
v To edit an existing schedule, select it in the middle pane. The schedule is
displayed in the General tab.
v To save the current schedule, click Save.
– To cancel changes to the currently selected schedule, click Cancel.
v To remove a schedule, select it and then click the Minus (
corner.
) in the upper-right
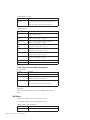
General Tab_b
To configure a new or existing schedule, specify the properties in the General tab.
Chapter 3. Configuring Scorecards
21
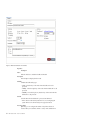
Figure 9. Scorecard Schedules - General Tab
Properties
Description
Active
Click the check box to enable the scorecard schedule.
Description
This description is displayed in the Portal.
Schedule
Schedule the scorecard by type:
v Daily- Select the days of the week when you want to run a scorecard.
Weekly- Select the single day of the week when you want to run a
scorecard.
v Monthly - From the drop-down, select the day of the month when you
want to run a scorecard.
v
Send At
Select the time when you want to run and deliver a scorecard.
v Time is based on the Tealeaf system time zone. See "Configuring the
System Timezone" in the IBM Tealeaf CX Configuration Manual.
Focus Day Offset
Optionally, you can configure the number of days before the date of
execution that you would like to define as "today" in the scorecard. For
example, you might configure a scorecard to be run Tuesday morning to
delivers Monday's data to users. In this case, you would set the offset
value to 1.
22
IBM Tealeaf cxView: cxView User Manual
Language
Select the language to use in the scorecard from the drop-down.
Recipients
Enter a comma-separated list of email addresses or aliases to whom to
send the scorecard.
Scorecard
Click the link to select the scorecard to send. Select the scorecard and click
Select.
Data Interval
Select the scorecard with reporting period from the drop-down list. The
period is defined relative to the date of the scorecard execution, factoring
the Focus Date Offset. For example, a scorecard that runs on Sunday
evening with an offset of three days with a Date Period of Week delivers
scorecard data from the previous Thursday back to the Thursday before it.
Compare
Click this check box to include the preceding Data Interval in the report.
Email Format
Select the format in which to send the dashboard: PDF, HTML, or
Excel-readable XML (Excel (XML)).
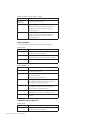
History Tab_a
In the History tab, you can review the history of scheduled scorecard executions.
Figure 10. Scorecard Schedules - History Tab
Chapter 3. Configuring Scorecards
23
Column
Description
Created At
Time stamp for when the schedule was created.
Scheduled At
Time stamp for next execution of the schedule.
Log Level
Success or failure of the scheduled report.
Message
Detail message on status of report execution.
Purging Scorecard Data
If needed, you can purge data for individual scorecards. For example, if your
scorecard definition is changed significantly, the event-related data in it can no
longer be valid.
Note: Purging scorecard data permanently deletes data specific to the selected
scorecard. Scorecard data is stored separately from base IBM Tealeaf cxImpact data,
which is unaffected by this operation.
Note: If a fact is used by multiple scorecards, its count data is not purged. If the
fact is used only for the selected scorecard, all data that is associated with it is
removed.
You can repopulate the scorecard by purging the scorecard data. Set the
Aggregation Date to an earlier date after you purge the data. This action forces the
reaggregation of all scorecard data that begins with that date. See “Scorecard
Aggregation Dates” on page 47.
v If you do not repopulate the scorecard, data is accumulated in the scorecard
from the time when its data was purged onward.
To purge data:
1. In the Scorecard Configuration page, click the Data Management link.
2. Click Purge Data.
3. Click <Select a Scorecard.
4. In the Scorecard Selector, choose a scorecard whose data you want to purge.
Click Select.
5. To permanently delete the data for the selected scorecard, click Purge Data.
v To cancel without deleting any data, click Cancel.
6. Confirm the deletion. The data is purged.
Overview
KPI scorecards are used to measure the relationship between event counts and a
baseline count. These counts include the number of sessions, number of page
views, or another event count. Each KPI scorecard can have any number of
individual defined KPIs, each containing a list of events to report, their grades, and
the base count.
24
IBM Tealeaf cxView: cxView User Manual
Figure 11. KPI Scorecard
To access KPI scorecards:
1. In the Tealeaf Portal menu, select Configure > Scorecards.
2. In the Configuration pane, click KPI Scorecards. The list of available KPI
scorecards is displayed. Available commands:
Command
Description
To edit an existing scorecard, select it and click the Edit at the top of
the pane.
To create a new one, click the New.
To delete a scorecard, select it and click the Delete.
Before you add or edit a KPI scorecard, configure it through the following tabs:
Tab
Description
General
The general information for the scorecard.
KPIs
Specify the key performance indicators to use in the scorecard.
Permissions
The User Group-level permissions for viewing the selected scorecard
within the portal.
For more information about configuring schedules for scorecards, see Chapter 3,
“Configuring Scorecards,” on page 19.
v For more information about configuring access permissions for reports, see
"Report Access Permissions" in the IBM Tealeaf cxImpact Administration Manual.
General Tab
Figure 12. KPI Scorecard - General tab
The General tab for KPI scorecards defines the title of the scorecard. It also applies
the specific report group and dimension value filtering, and activate the scorecard.
Chapter 3. Configuring Scorecards
25
Note: If a scorecard is not configured to be active, it is not processed, and the
report contains no data.
Selecting dimension values
By default, a newly created scorecard is assigned to the No Dimension Report
Group report group. In the General tab, this assignment is indicated by the No
Dimension Report Group entry. If the scorecard is configured to use the No
Dimension Report Group report group, then no additional dimension filtration can
be applied on the report, since all events share this report group by default.
Note: Scorecards that use a dimension to filter data cannot be used in IBM Tealeaf
cxResults.
Note: If you select a different report group:
v All events that are used in the scorecard must include this report group.
v Any events that do not include this report group yet are already part of the
scorecard are automatically removed from the scorecard.
Optionally, you can select a single whitelisted dimension value to display in the
scorecard. Complete the following steps to select a whitelist value for use in your
KPI scorecard or Process scorecard.
Note: Selecting a dimension group without a corresponding dimension value does
not have any filtering effect on the counts that are displayed in the report. It effects
report counts if a specific fact (event + report group) in the scorecard are disabled
during the lifetime of the scorecard.
Click the General tab.
Click No Dimension Report Group next to Report Group.
Click OK to confirm removal of incompatible events after the selection.
In the Report Group Selector, select the report group that is containing the
required dimension. Click Select.
5. The Report Group entry is updated. To select the dimension, click <Any
Dimension next to Dimension.
1.
2.
3.
4.
6. In the Dimension Selector, select the dimension to include in the scorecard.
Click Select.
7. In the Dimension Value Selector, you can select a whitelisted value of the
selected dimension with which you want to filter the scorecard. Click Select.
v If no dimension values are available for selection, no dimension value
filtering is performed.
v You cannot select non-whitelisted values to display in a scorecard. It means
that it is important to verify that you select appropriate values to record in
the scorecard. Whenever whitelisted values are encountered, they are
recorded in the scorecard.
Note: If a report template is exported for use in another system, only
whitelisted values are included in the export. Blacklisted values and other
values are excluded in the export to limit its size. See "Importing and
Exporting Reports" in the IBM Tealeaf cxView User Manual.
KPIs Tab
26
IBM Tealeaf cxView: cxView User Manual
Figure 13. KPI Scorecard - KPIs tab
Each key performance indicator is a group of related events, which are displayed
together relative to the base activity for the KPI. A KPI contains:
v One base activity event
v One or more events that are measured against the base activity to determine
performance
KPI scorecards can contain any number of KPIs. KPIs are graded according to the
sum of the KPI events that are divided by the base activity count.
KPIs are created, deleted, and reordered by using the icons above the list of KPIs.
v To edit a KPI, select it in the list. Its properties are displayed.
Icon
Description
Add a KPI.
Delete the selected KPI
Move the selected KPI higher in the list. Event counts are summed
regardless of their order.
Move the selected KPI lower in the list. Event counts are summed
regardless of their order.
KPI Properties
Each KPI has the following properties:
Property
Description
Title
The title of the KPI
Chapter 3. Configuring Scorecards
27
Base Activity
The denominator for the KPI events. This number is compared to the
values of the KPI events. It must have a count greater than or equal to the
sum of the KPI event counts. The rating for the KPI is the sum of the KPIs
event counts divided by the base activity count:
v Event - The event to count as the denominator for the KPI.
v To stop your event activity of session or pages counts, use the Session
Count or Hit Count event as the base activity in the denominator. These
events must be configured in the General tab to share report group same
as the scorecard itself.
v For more information about configuring events, see "TEM Events Tab" in
the IBM Tealeaf Event Manager Manual.
Comparison To Previous
This property identifies how to mark rating changes when you compare
KPI scorecards for different time periods:
v Increase is preferable - If the current rating is higher than the
previous rating, it is marked with a green Up Arrow. Decreases are
marked with a red Down Arrow. Desirable events such as purchase
events must be marked in this manner.
v Decrease is preferable - If the current rating is lower than the previous
rating, it is marked with a green Down Arrow. Increases are marked
with a red Up Arrow. Undesirable events such as abandonment events
must be marked in this manner.
Summary Calculation
This property defines how the KPI events are summarized when you view
KPI details:
v Total - The sum of the event percentages is displayed
v Average (including zero values) - The average of the event
percentages are displayed, including counts of 0.
v Average (excluding zero values) - The average of the event
percentages are displayed, omitting counts of 0.
Goal
The visible goal for the KPI has no effect on the rating and is used to
compare against the actual rating on the scorecard report.
Grades KPI grades are used to mark the overall completion rate of a process. The
percentages are used to compare against the rating for the KPI. If increases
are preferable for the KPI, the grades range from 100% to 0%; if negative,
they range from 0% to 100%. The grades that themselves are displayed on
the scorecard report.
v To toggle the display of aliases in the scorecard configuration page, click the
View Aliases check box. This setting is not saved with the scorecard itself.
KPI events
In the Events pane, you can select the events to include as the numerators for the
KPI in the scorecard.
v The listed events can be assigned weights in the overall scoring calculation.
v For more information about how KPIs are calculated, see “KPI Scorecard
Calculations” on page 30.
Select KPI events so that related events are joined in a KPI, especially in relation to
the Comparison To Previous setting.
28
IBM Tealeaf cxView: cxView User Manual
Note: Only events in the KPI can be included once in the General tab for each per
KPI. The events must include the same report group as the scorecard itself.
KPI Weights
KPI events can be weighted to adjust for the importance of different events within
a single KPI.
v To assign weights, click the Weight (
) icon.
For example, consider a KPI had three errors as events (Error 1, Error 2 and Error
3). You can weight Error 1 twice as much as the others by assigning it a weight of
50%. The other two weights of 25% until the KPI was configured to be weighted. If
the KPI is weighted, the assigned weights are displayed in the list of events.
Note: The sum of all weights for the KPI must equal 100.
See “KPI Scorecard Calculations” on page 30.
Permissions Tab
Scorecard permissions are used to restrict the viewing of a particular scorecard to
specific Portal user groups. Selected user groups can view the scorecard on the
Scorecard report page.
Figure 14. KPI Scorecard - Permissions tab
Note: Settings that are defined in this tab affect only the viewing of the scorecard
and do not affect permissions for scorecard administration. Any user or group that
can access the Configuring Scorecards page can configure any displayed scorecard.
See "cxView Settings" in the IBM Tealeaf cxImpact Administration Manual.
Saving
You can save your scorecard at any time. Click Save.
v To cancel the scorecard creation process, click Cancel.
Chapter 3. Configuring Scorecards
29
Note: Canceling stops the scorecard creation process without saving changes to
other tabs. All unsaved changes are lost.
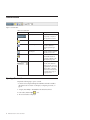
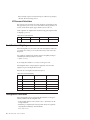
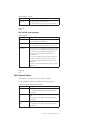
KPI Scorecard Calculations
This section provides an example of how KPI calculations are formulated. For this
KPI, suppose that you have a set of five events. The Base Activity parameter is set
to Event, and for the time period, suppose that the count of events is 50.
Grade assignments are straightforward, with the following grade assignments that
are targeting a goal of 100.
Table 4. KPI Scorecard Calculations
A
B
C
D
F
90%
80%
70%
60%
50%
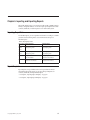
Event Counts and Weighting
In the following table, you can see how event counts and weights are related. For
our example of five events, you can see the Event Counts for each event for the
time period.
If no weights are assigned for the selected events, the unweighted percentage is
calculated by the following formula for each event:
1 / (Number of events)
In our example, this calculation is 1/5 or 20% for each type of event.
In the Weighted column , example weights are applied for each event. These
weights are as part of creating the KPI scorecard.
Note: The sum of all weights for the KPI must equal 100.
Table 5. Event Counts and Weighting
Event
ID
Event Count
Unweighted
Weighted
Event1
10
20%
50%
Event2
8
20%
20%
Event3
6
20%
10%
Event4
4
20%
10%
Event5
0
20%
10%
Unweighted KPI Calculations
In the following table, each row represents the KPI calculation for each type of
Summary Calculation for the unweighted values.
v In the preceding table, the count for Event5 is set to 0, which factors into the
average calculations.
v Grade Rating is computed by the following formula. Grades are assigned by
comparing this Grade Rating to the Grade buckets.
Value / Base Activity
30
IBM Tealeaf cxView: cxView User Manual
Table 6. Unweighted KPI Calculations
Summary
Calculation
Type
Value
Formula
Total
28
Count
Count
Count
Count
Count
Average
Including
0
5.6
(Value of Total /
#Events (5))
11.20%
Average
Excluding
0
7
(Value of Total) / 4)
14.00%
of
of
of
of
of
Grade Rating
Event1
Event2
Event3
Event4
Event5
+
+
+
+
56.00%
v Excludes Event5
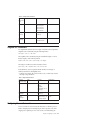
Weighted KPI Calculations
For weighted KPI calculations, the base weight of each KPI is factored against the
weighted counts of each KPI by using the following formulas:
base weight = 100% / # of KPI events
The weighted count is calculated by using the user-defined weights as a ratio to
the base weight, as in the following formula:
weighted count= event count * (event weight / base weight)
The rating for each KPI event is then calculated as follows:
grade rating = sum of weighted counts / base activity count
In the table below, each row represents the KPI calculation for each type of
Summary Calculation for the Weighted values.
v In the previous example, the count for Event5 is set to 0, which factors into the
following average calculations.
Table 7. Weighted KPI Calculations
Summary
Calculation Type
Value
Formula
Grade Rating
Total
38
Sum of ((Count of
Event) *
(Weighted/
Unweighted)) for all
event types
76.00%
Average
Including 0
7.6
(Value of Total /
#Events (5))
15.20%
Average
Excluding 0
9.5
(Value of Total) / 4)
19.00%
v Excludes Event5
Configuring Process Scorecards
Process scorecards are used to measure the effectiveness of a business process or
function. Example processes include placing an order for products at an online
shopping site or registering for a new user account at an online banking site.
Chapter 3. Configuring Scorecards
31
These scorecards automatically measure and score overall success, abandonment,
and failure rates within each step of a critical online business process or across the
entire process.
v Abandon step: An event or a set of events that represents abandonment of a
business process by the visitor. For example, a request from the visitor's web
browser for the Order Canceled page signifies the abandonment of an order
placement process.
v Failure step: An event or set of events that represents failure of a business
process. For example, the appearance of an HTTP 500 (internal server error)
page might signify failure of a business process.
v For more information about terminology, see Chapter 2, “Using Scorecards,” on
page 5.
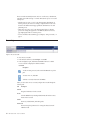
Accessing
Figure 15. Process Scorecard
To access Process scorecards:
1. In the Tealeaf Portal menu, select Configure > Scorecards.
2. In the Configuration pane, click Process Scorecards. The list of available
Process scorecards is displayed. Available commands:
Command
Description
To edit an existing scorecard, select it and click Edit at the top of the
pane.
To create a new one, click New.
To delete a scorecard, select it and click Delete.
When you add or edit a Process scorecard, configure the scorecard through the
following tabs:
Tab
Description
General
The general information for the scorecard.
Events
Select the Tealeaf events, including Abandonment and Failure events to
monitor in the scorecard.
Grades
The Process, Abandonment, and Failure grades.
Permissions
The User Group-level permissions for viewing the selected scorecard
within the Portal.
32
IBM Tealeaf cxView: cxView User Manual
For more information about scheduling scorecards, see Chapter 3, “Configuring
Scorecards,” on page 19.
v For more information about configuring access permissions for reports, see
"Report Access Permissions" in the IBM Tealeaf cxImpact Administration Manual.
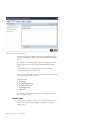
General tab_a
The General tab for Process Scorecards is where the title and state of the scorecard
can be configured.
Note: If a scorecard is not set to active, it is not processed, and the scorecard's
report contains no data.
Figure 16. Process Scorecard - General tab
By default, a newly created scorecard is assigned to the No Dimension Report
Group report group, which means that you cannot apply dimension filters on any
of the report data. Optionally, you can filter the scorecard to display data only
when a specific dimension value is present. For example, you can build a Process
scorecard to track conversion rates for the State dimension value CA (California).
Note: Scorecards that use a dimension to filter data cannot be used in IBM Tealeaf
cxResults.
v If you apply a specific report group to the scorecard, all events in the scorecard
must also contain that report group. If they do not, they are discarded.
v For more information about filtering by dimension values, see Chapter 2, “Using
Scorecards,” on page 5.
Tealeaf can automatically calculate the Overall Abandonment Rate and the Step
Abandonment Rate. To auto-calculate abandonment, select Automatically
Calculate Abandonment.
v If this option is cleared, you can specify abandonment steps in the Events tab.
Events tab
In the Events tab, you select the events that are used to define the steps of the
process and the abandonment and failure states. This tab is used to specify the
events that define an entire business process from start to completion, in the order
of occurrence.
v To toggle the display of aliases in the scorecard configuration page, click the
View Aliases check box. This setting is not saved with the scorecard itself.
Chapter 3. Configuring Scorecards
33
Figure 17. Process Scorecard - Events tab
The Events tab for Process Scorecards reviews the events that define the process
and the ones that determine whether a visitor completed, abandoned, or failed the
process.
You can define one overall Abandonment event and one overall Failure event for
the process. These events are used to calculate the Abandonment and Failure
grades.
v Abandonment events are often used to mark a process as incomplete.
v Failure events signify an error in the process.
For an overview of how to add events for Process scorecards, see “Creating Events
for Business Process Scorecards” on page 38.
Configuration steps:
1. Process Steps
2. Overall Abandonment Event
3. Step Abandonment Events
4.
5.
Overall Failure Event
Failure Events
For a tutorial on creating some of these events, see “Creating Events for Business
Process Scorecards” on page 38.
Process Steps
A business process is defined as a series of two or more events. There must be at
least two steps: a start event and a completion event. There is no maximum
number of steps.
34
IBM Tealeaf cxView: cxView User Manual
Note: When you configure process scorecard, verify that each included process
step is achieved by 100 percent of visitors who complete the business process.
Otherwise, the process abandonment count on the scorecard is inaccurate.
v When you define process events, define the minimum set to exactly match the
requirements of the process. Events do not have to be defined whether they
occur on consecutive pages.
To define the events of a process:
1. In the Events tab, click Process Steps.
2. The events of the process are listed in the order in which they are expected for
successful completion of a process.
3. Using the icons above the list of events, you can edit, add, or remove steps or
shift them up or down in the list:
Icon
Description
Edit the selected process step.
Add Process step.
Delete the selected Process step.
Move the selected Process step higher in the list.
Move the selected Process step lower in the list.
4. You can reorder events as needed.
Configure Aliased Event
When you add or edit an event in the process scorecard, the Configure Aliased
Eventdialog is displayed:
1. Enter an alias for the event. The alias can be used as a friendly name for the
event, which is useful for technical or otherwise complicated event names. The
alias is displayed for Tealeaf users in the Scorecard report.
2. Click the link next to event. The Event Selector displays all events that can be
included in the business process.
Note: If a report group is configured for the scorecard in the General tab, only
events that share this report group are available for inclusion as a Process step.
3. To save the event to the process, click Save.
Overall Abandonment Event
Each business process can have one event that signifies that the visitor abandoned
the process. If defined, the overall Abandonment event is used to calculate the
Abandonment grade. If it is not defined, the total of the individual Abandonment
events is used instead.
v Abandonment means that the visitor stopped work on completing the process to
either explore elsewhere on your website or to go to another website.
v If wanted, you can configure the scorecard to automatically calculate
abandonment rates for you in the General tab.
To define the overall Abandonment event:
1. In the Events tab, click Overall Abandonment Event.
2. The event that is defined as the Abandonment event is displayed. To change it,
click the Edit or the Plus icon.
Chapter 3. Configuring Scorecards
35
3. The Configure Aliased Event dialog is displayed.
4. Make necessary changes.
5. To save the Abandonment event, click Save.
Step Abandonment Events
You can define one or more Step Abandonment events, which you can use to track
abandonment at individual steps in the process.
Note: To avoid double-counting, no step must occur more than one time in the
process.
v If wanted, you can configure the scorecard to automatically calculate
abandonment rates for you in the General tab.
To define the Step Abandonment events:
1. In the Events tab, click Step Abandonment Events.
2. Any currently defined Step Abandonment events are displayed.
3. To add, click the Plus icon. To change an existing one, select it and click the
Edit icon.
4. The Configure Aliased Eventdialog is displayed.
5. Make necessary changes.
6. To save the Step Abandonment event, click Save.
7. In theEvents tab, you can use the arrow keys to reorder how the events are
displayed in all scorecards that reference them.
Overall Failure Event
Each business process can have one event that signifies that the visitor failed to
complete the process. If defined, the overall Failure event is used to calculate the
Failure grade. If it is not defined, the total of the individual Failure events is used
instead.
v Failure means that the visitor tried to complete the process but failed because of
a workflow or technical issue. For example, the event can be a combination of
events that monitor 1) the start of the process, 2) status code errors, and 3)
session end.
To define the overall Failure event:
1. In the Events tab, click Overall Failure Event.
2. The event that is defined as the Failure event is displayed. To change it, click
the Edit or Plus icon.
3. The Configure Aliased Event dialog is displayed.
4. Make necessary changes.
5. To save the failure event, click Save.
Failure Events
You can define one or more Failure events, which you can use to track failures at
individual steps in the process. These failures might be status code errors or error
messages that are presented to the visitor through the application.
Note: To avoid double-counting, no step should occur more than once in the
process.
36
IBM Tealeaf cxView: cxView User Manual
To
1.
2.
3.
define the Failure events:
In the Events tab, click Failure Events.
Any currently defined Failure events are displayed.
To add a new one, click the plus icon. To change an existing one, select it and
click the edit icon.
4. The Configure Aliased Event dialog is displayed.
5. Make necessary changes.
6. To include the Failure event in the process scorecard, click Save.
7. In the Events tab, you can use the arrow keys to reorder how the events are
displayed in all scorecards that reference them.
Grades tab
Process grades are used to mark the overall rate of successful completion of a
process. You can assign letter grades that are based on the percentage of sessions.
It can be completed, abandoned, or failed in comparison to the total number of
sessions that began the process.
Figure 18. Process Scorecard - Grades tab
Depending on the event, 100% can be a good or a bad result.
v Completions of a process are good results, so grades improve as the percentage
increases.
v Abandonment and failure grades go from 0% to 100%, becoming worse as the
percentage increases.
The grades that are defined here are displayed on the Scorecard report page.
Chapter 3. Configuring Scorecards
37
Permissions tab
Scorecard permissions are used to restrict the viewing of a particular scorecard to
specific Portal user groups. Selected user groups can see and select the scorecard
on the Scorecard Report page.
Figure 19. Process Scorecard - Permissions tab
Note: Settings that are defined in page apply only to viewing Scorecards and do
not affect permissions for administration of Scorecards. Any user or group that can
access the Configuring Scorecardspage can configure any displayed scorecard. See
"cxView Settings" in the IBM Tealeaf cxImpact Administration Manual.
Saving
You can save your scorecard at any time. Click Save.
v To cancel the scorecard creation process, click Cancel.
Note: Canceling stops the scorecard creation process without saving changes to
other tabs. All unsaved changes are lost.
Creating Events for Business Process Scorecards
Events for business process steps must be defined carefully. The event count of
process completions, abandonments, and failures must match total of 100 percent
of the number of process starts.
Suppose a business process consists of three pages:
1. pageA.jsp
2. pageB.jsp
3. pageC.jsp
You must define simple page events to detect that pages are displayed to the
visitor. Page events, called page A through page C, can be triggered by the URLs.
For the Process scorecard definition, the following events must be added.
38
IBM Tealeaf cxView: cxView User Manual
Note: For every step of the process, verify that the first step is present in the
session.
Process step events
1. Start process step: event page A.
2. Process step 2: session-level event of start process step (page A) AND page B.
This definition ensures that the session contains both the starting step and the
second step of the business process.
v For this process and all subsequent process steps, the starting step of the
process must be present in the session. A session fragmentation can result in
attempting to grade a session fragment that does not contain the start of the
business process.
3. End process step: session-level event of start process step (page A) AND page C.
This definition ensures that the session contains both the starting step and the
ending step of the business process.
Failure step events
Session-level event of start process step (page A) AND process step 2 AND NOT the
end process step AND NOT the Abandonment step.
Start process step ensures that session fragmentation does not cause this event to
fire falsely in session fragments that do not contain the beginning portion of the
business process.
Excluding the Abandonment step event ensures that the count of process failures
does not overlap the count of process abandonments.
Abandonment step events
Session-level event of start process step (page A) AND NOT the end process step AND
NOT the Failure step. The start process step ensures that session fragmentation does
not cause this event to fire falsely in session fragments that do not contain the
beginning portion of the business process.
Excluding the Failure step event ensures that the count of process abandonments
does not overlap the count of process failures.
If there are more process steps between the beginning and end steps, each step
must be a session-level event including the start process step.
Note: Session fragmentation can cause the Abandonment or Failure steps to fire if
the session times out and is fragmented partway through the business process. To
avoid systematic fragmentation, configure the Canister session idle timeout to be
equal to your application's session timeout, if possible.
Example Scorecards
This section contains examples of how to define KPI scorecards and process
scorecards to report on typical availability indicators and a typical business
process. Decisions about the definition of process steps and availability indicators
must be tailored to your own business and application when you configure your
own scorecards.
Chapter 3. Configuring Scorecards
39
Example Business Process
These examples are illustrations of the Example Business Process.
Suppose you want to define a commonly encountered business process: order
placement. In this example, the business process is defined as follows:
Process Steps
1. The beginning of the order placement process is defined as the moment when
the visitors first add an item to their shopping basket. It also includes retrieval
of a previously saved shopping basket.
2. The next major step of the process is when the visitor begins the order
submission sequence by clicking Checkout.
3. On the next page, the visitor provides shipping and payment information.
4. Following that is the final order inspection/submission page.
v If the visitor clicks Submit Order here, the order confirmation page is
presented.
v If the Cancel Order button is clicked instead, the order cancellation page is
presented.
5. Finally, if the Continue Shopping button is clicked, the visitor is returned to
the site's home page and can continue to shop for more items.
If order confirmation page or order cancellation page is displayed after order
inspection/submission page, then it marks the end of this business process.
Note: Order cancellation page or any other failure to reach the order confirmation
page after you begin the ordering process represents abandonment of this business
process.
At any point in the process, the visitor can click Save Basket to save the current
list of items in the shopping basket for later retrieval.
Process Web Pages
The product that is ordering business process on our example website consists of
the following sequence of pages, listed here by name:
1. Beginning of the business process, either of the:
a. Add item to shopping basket: /addtobasket.jsp. This step can occur
multiple times, with visits to other pages in the site. For example, product
search or browsing pages, other products' detail pages interspersed.
b. Retrieve previously saved shopping basket: /getsavedbasket.jsp.
2.
3.
4.
5.
Checkout page: /checkout.jsp.
Shipping and payment information entry page: /shipping.jsp.
Order inspection and submission page: /confirm.jsp.
End of this business process through either of the following pages:
v Order confirmation page: /ordercompleted.jsp.
v Order canceled page: /ordercanceled.jsp.
Presentation of the order canceled page or any other failure to reach the order
confirmation page, represents abandonment of this business process.
40
IBM Tealeaf cxView: cxView User Manual
v Saving a basket through /savebasket.jsp or continuing to shop for more items
after the order inspection/submission page is presented does not constitute an
abandonment. These events are postponement of completion of the ordering
process.
v Special handling is required for orders that are saved during a session but never
submitted during that session. It can be necessary to define two slightly different
business processes account for saving a shopping basket.
Tealeaf users can decide whether they are interested in just the workflow of
submitting an order or it is friendly and usable, regardless of beginning of the
order.
Example 1: Checkout Process Scorecard
Define per-hit events to detect the URLs listed and assign them to the sections of
the scorecard definition as shown.
v You can create events by using the pre-configured pattern to match the URL,
setting the condition of each event to be one of following file names listed. See
"TEM Events Tab" in the IBM Tealeaf Event Manager Manual.
Process Steps: The sequence of steps in the process is defined by events that detect
the following URLs, occurring in this order:
v /addtobasket.jsp OR /getsavedbasket.jsp
v /checkout.jsp
v /shipping.jsp
v /confirm.jsp
v /ordercompleted.jsp
Abandonment Step: /ordercanceled.jsp
Failure Step: Define the failure step to be a compound event by using as conditions
the output of all error events that can apply to the process pages. These conditions
must be configured to a logical OR evaluation.
Example 2: Checkout Process Scorecard with Advanced Abandonment
This example creates a more sophisticated measure of abandonment. Define the
following events that are listed and assign them to the sections of the scorecard
definition as shown.
Process Steps: The sequence of steps in the process is defined by events that detect
the following URLs and evaluation to true if they are present.
v /checkout.jsp
v /shipping.jsp
v /confirm.jsp
v /ordercompleted.jsp
Abandonment Step: Create an event with an End of Session trigger that evaluates
all of the following things:
v /checkout.jsp OR /shipping.jsp OR /confirm.jsp
v NOT /ordercompleted.jsp
v NOT the failure step event (next step)
Chapter 3. Configuring Scorecards
41
Failure Step: Create an event with an End of Session trigger that evaluates all of
the following things:
v /shipping.jsp AND /confirm.jsp, NOT /ordercompleted.jsp
In the previous example, the process can be abandoned or failure, but not both.
Example 3: New User Registration
The following process scorecard definition can be used as a template for measuring
the process for registering a new user. This process is defined by three simple
steps:
v /registernewuser.jsp
v /registrationcompleted.jsp
– If the registration is successful, a message is included in the response:
Thank you for registering.
Define the events that are listed and assign them to the sections of the scorecard
definition as shown.
Process Steps: The sequence of steps in the process is defined by events that detect
the following URLs.
v /registernewuser.jsp
v /registrationcompleted.jsp
Abandonment Step: Create an event with an End of Session trigger that evaluates
all of the following things:
v /registernewuser.jsp
v NOT response contains the phrase "Thank you for registering."
Example 4: Insurance Policy Purchase
The following scorecard definition monitors a simple transaction to purchase an
insurance policy.
Define the following events and assign them to the sections of the scorecard
definition as shown.
Process Steps: The sequence of steps in the process is defined by events that detect
the following pages of the application.
v Policy Holder Information
v Insured Party Details
v Review
v
v
v
v
v
Notices
Payment Information
Payment Method
Confirmation
Policy Welcome
Abandonment Step: Create an End of Session event that is composed of events 1
AND NOT 8 AND NOT 6.
Failure Step: Create an End of Session event that is composed of Events 1 AND 7
AND Global Error Page AND NOT 8.
42
IBM Tealeaf cxView: cxView User Manual
KPI Scorecard Example 1: Checkout
This scorecard measures the performance of key pages in the following checkout
process.
1. Create scorecard: Define per-hit events to detect the following conditions:
a. Create a simple per-hit event that detects all HTTP client error (4xx) status
codes by looking for the following string in the Tealeaf request:
\nStatusCode=4
b. Create a simple per-hit event that detects all HTTP server error (5xx) status
codes by looking for the following string in the Tealeaf request:
\nStatusCode=5
c. Create an After Every Hit event that uses the above two events as
conditions to detect all HTTP error status codes.
d. Create five After Every Hit events that detect the preceding error-detecting
event when it occurs on each of the five pages that are listed as Process
Steps. See “Example Scorecards” on page 39.
e. Create an After Every Hit event of all the page-specific events that are
defined in the previous step to detect the error-detecting event when it
occurs on any of the Process Step pages.
2. Create scorecard: Create a KPI scorecard that uses Negative Comparison.
3. Use the event that is detecting the process's first page (which can be either
/addtobasket.jsp or /getsavedbasket.jsp). Configure the count of this event to
be the scorecard's activity indicator.
4. In the scorecard, create a single availability group by using the five
page-specific "all errors" events and weight them by the importance of each
page. These weights can be used to define the availability letter grade. For
example, the grading weights can be:
v HTTP error code on /addtobasket.jsp OR /getsavedbasket.jsp: 5%
v
v
v
v
HTTP
HTTP
HTTP
HTTP
error
error
error
error
code
code
code
code
on
on
on
on
/checkout.jsp: 20%.
/shipping.jsp: 10%.
/confirm.jsp: 15%.
/ordercompleted.jsp: 50%.
KPI Scorecard Examples: Retail Shopping Site
This scorecard measures the performance of key pages in a retail shopping site.
Events used
For the following examples, the list of events that are used in the scorecard
definition is as follows.
The following events are based on Tealeaf request variables:
HTTP Status Code
v HTTP 400 - Bad Request
v HTTP 401 - Unauthorized
v HTTP 402 - Payment Required
v HTTP 403 - Forbidden
v HTTP 404 - Not Found
v HTTP 405 - Method Not Allowed
Chapter 3. Configuring Scorecards
43
v HTTP 500 - Internal Server Error
HTTP USER AGENT
v Googlebot Visit
v MSNbot Visit
Hit property exceeds threshold value
v Large Page Size
v Long Page Generation Time
v Page Generation > 5s - Create this Boolean event to evaluate the output of the
Page Generation Time event.
v Page Generation Time > 10s - Create this Boolean event to evaluate the output
of the Page Generation Time event.
v Page Generation Time > 15s - Create this Boolean event to evaluate the output
of the Page Generation Time event.
v Page Generation Time > 20s - Create this Boolean event to evaluate the output
of the Page Generation Time event.
0-sized response
v Create Boolean event to detect value of the Session Response MB event is equal
to 0.
URL
Note: These events must be created for your specific web application to detect the
URLs of the pages where these business functions are performed.
v
v
v
v
v
v
Checkout: Sign-in
Checkout: Billing and Shipping
Checkout: Payment
Checkout: Summary
Checkout: Confirmation
Web Application 1
v Web Application
HTTP REFERER
v Came from Login Page - Create this event to detect the value of the REFERRER
item in the request that is indicating the login page of your web application.
v Came from shopping cart - Create this event to detect the value of the REFERRER
item in the request that is indicating the shopping cart page of your web
application.
Login field in [urlfield] section of Tealeaf request
v Non-blank login field
v Login field not present
Useful events based on response text
v
v
v
v
44
Error uncompressing page
Global Error Page
Credit Card Declined
Credit Card Number Invalid
IBM Tealeaf cxView: cxView User Manual
v Credit Card Zip Code Mismatch
Compound Events
v Came to Billing page from shopping cart: Events 1(e)ii AND 1(f)ii
v Came to Billing page sign-in through login: Events 1(e)ii AND 1(g)i
v Came to Billing page through anonymous sign-in: Events 1(e)ii AND 1(f)i AND
1(g)ii
v Checkout count: OR of all Events in 1e
v Page Generation Time > 5s in Checkout: Events 1(c)iiA AND 3d
v Page Generation Time > 10s in Checkout: Events 1(c)iiB AND 3d
v Page Generation Time > 15s in Checkout: Events 1(c)iiC AND 3d
v
v
v
v
v
v
v
Page Generation Time > 20s in Checkout: Events 1(c)iiD AND 3d
0-sized response in Checkout: Events 1d AND 3d
Global Error Page in Checkout: Events 2b AND 3d
HTTP 40x - 403 OR 404 Errors: Events 1(a)iv OR 1(a)v
Web Application 1 - 40x Errors: Events 1(e)vi AND 3k
Web Application 1 - 500 Errors: Events 1(e)vi AND 1(a)vii
Web Application 1 - Long Page Time: Events 1(e)vi AND 1(c)iiE
v Web Application 1 - Large Page Size: Events 1(e)vi AND 1(c)i
v
v
v
v
Web Application
Web Application
Web Application
Web Application
2
2
2
2
-
40x Errors: Events 1(e)vii AND 3k
500 Errors: Events 1(e)vii AND 1(a)vii
Long Page Time: Events 1(e)vii AND 1(c)iiE
Large Page Size: Events 1(e)vii AND 1(c)i
KPI Scorecard Example 2: Checkout
Define the following KPI groups.
Checkout Errors
v
v
v
v
Global Error Page in Checkout
0-sized response in Checkout
Page Generation Time > 5s in Checkout
Page Generation Time > 10s in Checkout
v Page Generation Time > 15s in Checkout
v Page Generation Time > 20s in Checkout
v Checkout Paths
v Came to Billing page from shopping cart
v Came to Billing page sign in through login
KPI Scorecard Example 3: Site Errors
Define following KPI groups.
Status Code Errors
v HTTP 400 - Bad Request
v HTTP 401 - Unauthorized
v HTTP 402 - Payment Required
v HTTP 403 - Forbidden
Chapter 3. Configuring Scorecards
45
v
v
v
v
v
HTTP 405 - Method Not Allowed
HTTP 500 - Internal Server Error
Handled Application Errors
Global Error Page
Page Errors
v 0-sized response
v Error uncompressing page
v Large Page Size
KPI Scorecard Example 4: Spiders
Define the following KPI groups.
Spider Visits
v Googlebot Visit
v MSNbot Visit
KPI Scorecard Example 5: Transaction Failures
Define the following KPI groups.
Credit Card Failures
v Credit Card Declined
v Credit Card Number Invalid
v Credit Card Zip Code Mismatch
KPI Scorecard Example 6: Unacceptable Response Time
Define the following KPI groups.
Response Time Errors
v Page Generation Time > 5s
v Page Generation Time > 10s
v Page Generation Time > 15s
v Page Generation Time > 20s
KPI Scorecard Example 7: Multiple Applications
Define the following KPI groups.
Web Application 1
v
v
v
v
Web
Web
Web
Web
Application
Application
Application
Application
1
1
1
1
-
40x Errors
500 Errors
Long Page Time
Large Page Size
v Web Application 2 - Large Page Size
46
IBM Tealeaf cxView: cxView User Manual
Scorecards
The following IBM Tealeaf cxView settings apply to scorecard data retention:
v Data Trimming
v Scorecard Data - Days Retain
v Scorecard Data - Months Retain
v Scorecard Data - Weeks Retain
v Scorecard Email - Attach HTML
v Scorecard Update Frequency
See "cxView Settings" in the IBM Tealeaf cxImpact Administration Manual.
The following IBM Tealeaf cxImpact settings apply to scorecards:
v SMTP From Address(Scorecards)
v SMTP From Name(Scorecards)
For more information about these settings, see "CX Settings" in the IBM Tealeaf
cxImpact Administration Manual.
Dashboards
The following IBM Tealeaf cxView settings apply to dashboards:
v Dashboard distribution frequency (seconds)
v Dashboard distribution priority
v Data Trimming
See "cxView Settings" in the IBM Tealeaf cxImpact Administration Manual.
Scorecard Aggregation Dates
From the Scorecard Configuration page, you can review the dates when scorecard
data was last retrieved from the database and aggregated for use by individual
scorecards.
Overview
When the Data Collector performs an aggregation run for scorecards, the IBM
Tealeaf CX database is polled for data that is related to individual scorecards.
These scorecards are captured and stored since the last successful run. This data is
then aggregated and stored in the Scorecard data tables, which are queried when
scorecards are displayed. Thus, scorecard data is stored separately from report data
and can be queried and trim independently.
v Separate scorecard runs are performed for daily, weekly, and monthly scorecard
data.
To review:
1. In the Portal menu, select Configure > Scorecards.
2. The Scorecard Configuration page is displayed. In the left navigation pane,
click the Data Management link.
3. Click Aggregation Dates.
4. The dates of the most recent scorecard aggregation runs are displayed in the
right panel.
Chapter 3. Configuring Scorecards
47
Figure 20. Scorecard Aggregation Dates
In the right panel, you can change the date for the daily scorecard aggregation run
for any date that has an Edit icon next to it. When the date is changed, any
scorecards that use the date ID are regenerated on the next scorecard run based on
the newly selected date. Any of the other intervals between the newly selected date
and the current date are also regenerated.
v To edit a scorecard processing interval, select the entry and click the Edit (
icon.
)
In the Portal Management page, you can also query for this information from each
Search Server in your environment. See "Managing Tealeaf Servers" in the IBM
Tealeaf cxImpact Administration Manual.
Rolling Back Scorecard Aggregation Dates
If scorecard definition changes must be applied retroactively, you can use the
rollback feature to apply the changes.
Suppose that you change your scorecard definition and must populate the changed
scorecard data retroactively. If the latest Aggregation Date for a specific interval is
rolled back, then scorecard data is reaggregated from the date forward, across all
intervals.
Note: Depending on the number of scorecards in your Tealeaf solution, rolling
back the scorecard aggregation date can be expensive in terms of processing
resources. Tealeaf recommends performing this rollback at an off-peak time.
Note: Rolling back the scorecard date also performs reaggregations for any full
weekly or monthly intervals that occur between the previous aggregation date and
the new one. For example, if you set the scorecard date back 32 days, 32 daily
aggregations, 4 weekly aggregations, and one monthly aggregation are performed.
Note: Before you roll back the scorecard date, you must verify that the Scorecard
tables contain data for all intervals that are reaggregated. For example, if your
Scorecard tables contain only six days of data. Now, setting the scorecard date back
32 days results in all weekly and monthly aggregations to be based on empty data.
For more information about scorecard data trimming, see the data retention
settings in "cxView Settings" in the IBM Tealeaf cxImpact Administration Manual.
After the scorecard date is reset, when the scorecard data for that interval is next
processed, Tealeaf effectively recalculates the scorecard data from that date
forward. After a scorecard definition is changed by adding or removing events,
previously calculated data becomes invalid.
48
IBM Tealeaf cxView: cxView User Manual
Verifying Scorecard Data
Complete the following steps to verify that scorecard data is present in the current
system.
1. Log in to the Tealeaf Portal as an administrator.
2. From the Portal menu, select Analyze > Scorecards.
3. In the toolbar, click the Folder icon to open a scorecard.
4. Select a scorecard that is known to have daily data updates. Click Select.
5. The scorecard is loaded. By default, the scorecard displays data from the
current day.
6. In the toolbar, click the Calendar tool.
7. Select a range of dates. For example, if you recently upgrade the system, you
can choose to select a range of dates from before the date of the upgrade.
8. The scorecard must show data.
Notes on upgrades
If no data is displayed, it is likely that the scorecard data was not successfully
moved during the inline database upgrade. Tealeaf recommends upgrading and
moving the databases after the software upgrade is completed. In some situations,
this out-of-line upgrade cannot be possible, so you must force a recalculation of all
scorecard data through the Tealeaf Portal.
Note: Scorecard recalculation occurs at the top of the next hour after the
recalculation is issued. Depending on the number of scorecards, this process can
take a while. After upgrade, you can schedule this recalculation during off-peak
hours.
Note: Recalculation of scorecards can take significant time and system resources. It
depends on the number of scorecards and volume of data that was moved from
Release 7. Tealeaf recommends completing the scorecard recalculation during
off-peak hours.
Forcing Scorecard Recalculation Using All Available Data
Use the following steps to force a recalculation of all scorecards by using all data
available in the system. You can also apply previously calculated data to redefined
scorecards. For example, if you switch a scorecard definition to use a new event,
you can force a recalculation of all scorecards by using the available historical data.
Note: The number of days that you extend the scorecard calculation range in the
past is directly correlated to how long the recalculation takes. Depending on the
length of time and number of scorecards in the system, this recalculation can
impact system performance. If possible, you should conduct lengthy recalculations
during off-peak periods.
1. Log in to the portal as an administrator.
2.
3.
4.
5.
From the portal menu, select Tealeaf > Portal Management.
In the left navigation panel, click the IBM Tealeaf CX Settings entry.
Click theData Retention link.
Review the value for Reporting Data (daily)-Days Retain. This setting
determines the maximum amount of reporting data that is retained in the
database. Typically, this value is set to 365.
Chapter 3. Configuring Scorecards
49
Note: If Tealeaf system was installed after the date indicated by this setting,
you must calculate elapsed days since the first installation. Use the smaller of
the Reporting Data (daily)-Days Retain value or the elapsed number of
days since installation.
6. Using Excel, you can calculate the following date:
Today - (Smaller of two dates above)
7.
8.
9.
10.
11.
12.
13.
50
v This date is used in the following steps to configure the date from which
the next scorecard recalculation begins.
In the portal menu, select Configure > Scorecards.
In the left panel, click the Data Management entry.
Click the Aggregation Dates link.
For the Last Interval for Scorecards (SID=5/Day) entry, click the edit icon.
Click the Date field. From the Calendar tool, select the previously calculated
date.
Click Save.
If the Data Collector's next run is at the top of the subsequent hour, all
scorecards in the system are recalculated from the specified date to the current
hour.
IBM Tealeaf cxView: cxView User Manual
Chapter 4. Using Dashboards
A dashboard can be used to monitor fundamentals of the Tealeaf system or track
high-level reports on overall website performance. Through dashboards, you can
customize your suite of Portal reports to meet your enterprise or personal
requirements.
The Tealeaf system provides several pre-configured dashboards, and you can create
more dashboards to meet various reporting and user group needs. Each dashboard
is composed of one or more reporting components, which can be reports, charts, or
tables.
v For more information about provided dashboards, see “Dashboards Provided by
Tealeaf” on page 53.
v A dashboard displays data from a single day. You can configure the dashboard
to display data from a different date in the Dashboard Options window.
v You can select dashboards from the Dashboardsmenu in the portal, which
contains your default dashboard and the five used most recently dashboards.
v To select from all available dashboards, select Dashboards > More... in the
portal menu. From the Dashboard Selector, select the dashboard to display.
Then, click Select.
Note: Access to the dashboard menu is controlled by permissions that are
configured for your user account. For more information, contact your Tealeaf
administrator.
v For more information about configuring dashboards, see Chapter 5, “Configuring
Dashboards,” on page 57.
Figure 21. Dashboard
© Copyright IBM Corp. 1999, 2014
51
Dashboard Options
To access dashboard options, click Options in the upper-right corner.
Figure 22. Dashboard Options
The following options are available.
Option Description
Change Focus Date
To change the date for which the dashboard displays data, move the
mouse over Change Focus Date. The calendar is displayed. Use the
calendar controls to select the date whose data you want to display in the
dashboard.
Note: For dashboards that display current system data or data from a
fixed period, the focus date does not apply.
Launch in Remote Window
To display your dashboard in a second browser window, click Launch in
Remote Window. This option is useful if you want to monitor activities in
your browser while you complete other tasks in the Portal.
Export/Email Dashboard
Export or email the current dashboard. For more information about
exporting a dashboard, see “Exporting Dashboards” on page 55.
Switch Dashboard
To select a different dashboard, click Switch Dashboard. In the Dashboard
Selector, select the new dashboard to display.
Report Access Permissions
Note: You must have access and permissions to view the dashboard menu or any
specific dashboard with all its components. For example, if the dashboard contains
scorecards, you must have permissions to view each scorecard and access to the
scorecard feature in the Portal (Analyze > Scorecards), which is governed by IBM
Tealeaf cxView group permissions. The same applies to Report Builder and Top
Mover components of dashboards.
For more information about configuring access permissions for reports, see "Report
Access Permissions" in the IBM Tealeaf cxImpact Administration Manual.
52
IBM Tealeaf cxView: cxView User Manual
Configuring Dashboards
Depending on your account permissions, you can create and share your own
dashboards. See Chapter 5, “Configuring Dashboards,” on page 57.
Dashboard Report Data
At regular intervals, the Tealeaf Data Collector polls each Canister for session data
to aggregate and store in the appropriate databases. When a scorecard or
dashboard is queried, this aggregated data is used to populate the report.
v Typically, the Data Collector polls at 5-minute intervals. For more information
about settings, see "CX Settings" in the IBM Tealeaf cxImpact Administration
Manual.
The Data Collector requires access to all Canisters in the Tealeaf environment, and
all Canisters must be receiving data. If an active canister is not receiving data or
cannot be reached because of network interruption, the data collector fails the data
collection process. It happens as running a partial collection corrupts the reports
that use it.
Note: All Tealeaf Canisters must be receiving session data and must be accessible
over the network. If any canister is unavailable or not receiving data, report data
collection is suspended. Scorecards and dashboards are not updated with new data
until the problem is fixed. When collection resumes, reports are not updated until
all spooled canister data is collected, aggregated, and stored in the database.
v Hits are evaluated against the set of current set of events at the time of
evaluation. If hits are spooled or otherwise not processed immediately, there can
be effects in reporting if changes are made to event-related objects in the interim.
For more information, "Tealeaf Event Manager" in the IBM Tealeaf Event Manager
Manual.
v For more information about data collection, see "Data Aggregation and
Retention" in the IBM Tealeaf cxImpact Administration Manual.
v For more information about managing Canisters, see "Managing Tealeaf Servers"
in the IBM TealeafcxImpact Administration Manual.
Dashboards Provided by Tealeaf
Tealeaf provides the following dashboards:
Note: Depending on the menu profile in your user account and the licensed
Tealeaf products, you cannot have access to these dashboards. For more
information, contact your Tealeaf administrator.
Table 8. Dashboards Provided by Tealeaf
Dashboard
Name
Tealeaf Product
Description
Tealeaf
System
Status
IBM Tealeaf cxView
Dashboard contains status reports on
Active, Canister, DeCoupleEx, and
Storage aspects of the Tealeaf system.
See "System Status" in the IBM Tealeaf
cxImpact Administration Manual.
Chapter 4. Using Dashboards
53
Table 8. Dashboards Provided by Tealeaf (continued)
Dashboard
Name
Tealeaf Product
Description
Technical
Site Metrics
IBM Tealeaf cxView
This dashboard provides detail
reports on current user, session, and
page-level data. See "Technical Site
Metrics Dashboard" in the IBM Tealeaf
Reporting Guide.
IBM Tealeaf
cxReveal
Executive
Dashboard
IBM Tealeaf cxReveal
For IBM Tealeaf cxReveal executives
and managers, this dashboard
provides insight into IBM Tealeaf
cxReveal user searches and replays.
See "cxReveal Overview Dashboard"
in the IBM Tealeaf cxReveal User
Manual.
Dashboard Tabs and Components
Components can be placed into one or more tabs. Each tab contains the
components that are defined by the creator of the dashboard. Each component has
controls for editing, drill-down, and refresh.
A dashboard tab is composed on multiple dashboard components, which are
independent pieces of dashboards. Each dashboard component panel contains a
graphical or numerical display of the component's content.
At the top of each panel, you can make the following selections:
Button Description
To edit the component, click the Editicon. See Chapter 5, “Configuring
Dashboards,” on page 57.
To view the underlying data, click View Report Dataicon.
View report details on the underlying report.
v See "Tealeaf Report Builder" in the IBM Tealeaf Reporting Guide.
To refresh the display of the dashboard component, click the Refreshicon.
v To refresh all dashboard components, click the Refresh on your browser.
Change dashboard options. See Chapter 4, “Using Dashboards,” on page
51.
If you own the dashboard, any changes to the layout are saved and are applied to
other users who are sharing your dashboard. Otherwise, changes to the layout for
a dashboard that you do not own are temporary.
v Multiple dashboards can use the same component.
Note: If you change the component in one dashboard, it affects all instances of
the component in other dashboards.
54
IBM Tealeaf cxView: cxView User Manual
Exporting Dashboards
In the Optionsmenu, to export a dashboard snapshot, click Export/Email
Dashboard.
Figure 23. Export/Email Dashboards
To export:
1. To open or save the report locally in PDF format, click Save as PDF.
2. To email the report, click Email.
Note: To configure and deliver report snapshots from the Portal, you must
enter a valid email address for your user account. See "My Settings" in the IBM
Tealeaf cxImpact User Manual.
3. Choose output format: Send PDF or Send HTML.
Note: Depending on the size of the components on the dashboard, some parts
of components with insufficient screen size cannot be displayed in PDF format.
You can either export by using HTML format, which supports scrolling of
elements, or resize the components in the dashboard configuration. See
Chapter 5, “Configuring Dashboards,” on page 57.
4. Specify recipients as a comma-separated list of email addresses.
5. To send the configured export, select to export the entire dashboard or the
current tab.
v To cancel dashboard export, click Cancel.
Chapter 4. Using Dashboards
55
56
IBM Tealeaf cxView: cxView User Manual
Chapter 5. Configuring Dashboards
Through Tealeaf dashboards, you can customize your suite of portal reports to
meet your specific needs. A dashboard can be used for monitoring the system
fundamentals of the Tealeaf system or for tracking high-level reports on overall
website performance.
v To configure your Dashboards, select Configure > Dashboards in the Portal
menu.
For more information about Dashboards, see IBM Tealeaf cxResults User Manual and
IBM Tealeaf cxImpact Administration Manual.
Overview
A single dashboard can be composed of multiple dashboard components, which
are independent pieces that can be added or removed from dashboards. Multiple
dashboards can use the same component. Changes to the component in one
dashboard affects all instances of the component in other dashboards.
Tealeaf report charts and tables can be used as dashboard components.
v For more information about creating reports, see "Tealeaf Report Builder" in the
IBM Tealeaf Reporting Guide.
v For more information about adding them to dashboards, see “Components
Screen” on page 63.
Overview of Configuring Dashboards
In the Configuring Dashboards screen, you can create and edit dashboards, which
can contain one or more components. Additionally, you can manage dashboard
snapshots, sharing, and import and export of your dashboards and their
components.
Figure 24. Configuring Dashboards
Configure email address
Dashboards are emailed by using the owner's configured email address as the
From address.
Note: Before you begin configuring dashboards, verify that you configure a valid
email address in the My Settings page. See "My Settings" in the IBM Tealeaf
cxImpact User Manual.
Alerts and scorecard use system settings to specify the From email address.
v See "CX Settings" in the IBM Tealeaf cxImpact Administration Manual.
© Copyright IBM Corp. 1999, 2014
57
Configuration options
In the Configuring Dashboard screen, you access the available dashboards and
components by using the links on the left side of the page. You can also use them
to manage import or export.
Section
Description
Dashboards
Display dashboards that you can edit. The set of available dashboards is
the default display for this screen. See “Getting Started.”
Note: Tealeaf users and administrators can see any dashboard that they
create or that are shared to them.
Components
Click this link to review the available components to add, edit, or remove
components from dashboards, or to create new dashboard components
from the available templates. See “Components Screen” on page 63.
Set Default Dashboard
After login, select the default dashboard to display in the Dashboards
menu. See “Setting the Default Dashboard” on page 89.
Dashboard Schedules
Configure the scheduled execution and delivery options of emailed
dashboards. See “Overview” on page 90.
Report Templates
Import or export report templates. See “Managing Report Templates for
Dashboards” on page 94.
Getting Started
From the list of available dashboards, you can select the dashboard to edit or
create a new one. Available dashboards are listed in the Dashboards tab:
v Plain text - Owned by the current user.
v Bold text - Default dashboard.
- Shared to the current user, who is defined as a Dashboard Admin for it.
v
User can edit.
- Shared to the current user, who is defined as a Dashboard User for it.
v
Dashboard Users cannot edit shared dashboards.
Permissions are configured in the Permissions tab.
Field
Description
Name
The displayed name of the dashboard.
Active If inactive, you cannot see the dashboard in the Dashboards menu.
Flags
Entries in this column indicate whether the dashboard is shared or
editable. See the icons.
The following actions are available for dashboards:
58
IBM Tealeaf cxView: cxView User Manual
Table 9. Getting Started
Button
Command
Description
View
View the dashboard. See Chapter 4,
“Using Dashboards,” on page 51.
Edit
Configure the dashboard's properties.
Copy
Create a copy of the dashboard for
the current user.
v If you are copying a shared
dashboard, this command creates
an instance of the original for the
new owner.
v To create an independent instance
of the dashboard, select Duplicate
Components. When this option is
selected, the new dashboard is
owned independently of the
original one. The new dashboard is
owned by the current user and has
no further association with the
original.
Create
Create a dashboard.
Delete
Delete the selected dashboard, if
owned by the current user.
Note: Any components that are used
by the dashboard are retained and
must be deleted separately.
Creating a Dashboard
To create a dashboard:
) button.
1. To create a dashboard, click the Add (
2. Enter the name of the dashboard and click OK.
3. The dashboard is saved, and you can begin editing the dashboard in the
General tab.
4. Configure properties in each tab:
v General tab
v Tabs tab
v Permissions tab
5. You can save the dashboard at any time. To save it, click Save. Changes on all
tabs are saved.
6. The configured dashboard is now displayed in the Dashboards screen.
7. You can populate the dashboard with components. See “Components Screen”
on page 63.
General Tab
Chapter 5. Configuring Dashboards
59
Figure 25. General Tab
Property
Description
ID
An internal identifier for the dashboard.
Title
The user readable name for the dashboard. This name is displayed in the
Dashboard screen and the portal menu.
Default Tab
When the dashboard is loaded, the specified tab is selected by default.
Active
If inactive, the dashboard is not displayed in the dashboards menu and
cannot be emailed.
Tabs tab
In the Tabs tab, you can define the tabs that are displayed in the dashboard. You
can use individual tabs to organize dashboard components along common types of
information, such as site statistics, visitor activities, or goal conversion.
Figure 26. Tabs Tab
Adding and arranging tabs
In the left pane, you can see the available tabs that you create. When you select a
tab, the components on the tab are displayed in the middle pane. Right pane
contains the current layout for the selected tab.
60
IBM Tealeaf cxView: cxView User Manual
Following are the command buttons:
Table 10. Adding and arranging tabs
Button
Command
Description
Edit
Select the tab and click Editto rename
it.
Copy
Click the Copyto copy the selected
tab. In the dialog, enter a name for
the new tab, and select the dashboard
to which to copy the tab. Select the
check box if you want to copy the
components on the selected tab. Click
OK.
Create
Enter a name for the new tab, and
click OK. It is displayed in list of
available tabs.
Delete
Click Delete to remove the selected
tab.
You can use the Up and Down arrow to reorganize the display order of the tabs in
the dashboard.
Organizing components in a tab
For the selected dashboard tab, you can add and remove components in the
middle pane and arrange their screen layout in the right pane.
Above the Components pane, the following commands are available:
Table 11. Organizing components in a tab
Button
Command
Description
Edit
To edit a component, select it and
click the Edit button.
Create
Add a component to the tab from a
new or existing component template:
Note: Before you add a component,
review the set of existing component
templates to avoid redundancy or
creating a template that Tealeaf
already provides.
v Existing Component - Opens the
list of available components. To
add one of the displayed
components to the current tab,
select it and click Select. You can
edit the properties after it is added.
v New Component - Opens the list of
available component templates. To
build your new component, select
one of the displayed components
to the current tab, select it and
click Select. The Component
Properties window is displayed,
where you can configure the new
component.
Chapter 5. Configuring Dashboards
61
Table 11. Organizing components in a tab (continued)
Button
Command
Description
Delete
Removes the selected component
from the tab.
Layout pane
To rearrange the display of the selected components for the tab, use the up and
down arrow keys above the Components pane. The Layout pane is updated with
each change.
v You can add a placeholder item, which reserves space for unfinished dashboard
components. Add an existing component from the Basic Components category.
Permissions Tab
Through the Permissions tab, you can share dashboards that you create with other
user groups. Sharing dashboards is a good way to ensure that everyone in a group
is looking at the same content.
v Members of Admin Group and cxView Admin are automatically defined as
administrators of all dashboards, which means that they can see and edit any
dashboard in the system. Administration and use rights to a dashboard cannot
be removed for these groups.
Note: To enable the previous groups to assign access to dashboards, you must
save a dashboard and reload it. Then, members of the previous groups are
automatically assigned as admins and can assign access permissions to the
dashboard.
v All Portal users can access the System Status and Technical Site Metrics
dashboards, regardless of user or group permissions.
Note: More users can be given administrator permissions to a specified dashboard.
However, the creator of the dashboard is always the owner of it and always has
administration privileges, even if all Dashboard Admins are removed. Ownership
of a dashboard cannot be reassigned.
Figure 27. Permissions Tab
To share the dashboard, you can allow selected Tealeaf user groups to be
Dashboard Admins or Dashboard Users for the current dashboard.
v Dashboard Admins - Users in these groups can view and edit the dashboard.
62
IBM Tealeaf cxView: cxView User Manual
Note: Dashboard Admins can accidentally remove their user group from the list,
which prevents further editing of the dashboard from those accounts.
v Dashboard Users - The users in these groups can view the dashboard yet are
forbidden from editing it.
Note: The reports that are displayed on the dashboard are subject to the
permissions of the group to see it. This is applicable even if a user group has
User or Admin access to a dashboard. Reports that are restricted by the group's
permissions are not displayed.
Note: Regardless of their permissions to access the dashboard in the Portal, all
recipients receive the dashboard snapshot. If they lack permissions to see
individual components, those components are hidden from display in the Portal
and are blocked in emailed snapshots of the dashboard.
When you create a dashboard, you are automatically assigned as a Dashboard
Admin forever.
v To create a personal dashboard that is a variation of an existing one, use the
copy button in the Dashboards page. See Creating a Dashboard or Editing a
Component.
Note: To view all contents of a dashboard, you must access to the Dashboard
menu. You must have permissions to view the specific dashboard and all
components inside of it. For example, if the dashboard contains scorecards, you
must have permissions to view each scorecard and scorecard feature in the Portal
(Analyze > Scorecards), which is governed by IBM Tealeaf cxView group
permissions. The same applies to Report Builder and Top Mover components of
dashboards. See "Report Access Permissions" in the IBM Tealeaf cxImpact
Administration Manual.
Components Screen
Through the Components screen, you can configure components and add or
remove them from dashboard tabs.
Figure 28. Configuring Components
Select this view of dashboard to verify that important components are
well-organized and represented in the appropriate dashboard. The screen is split
into four panels:
Chapter 5. Configuring Dashboards
63
Component Category
Select from available components or assemble from component templates.
Individual components are configured instances of component templates.
You can create new components from templates. See “Managing Report
Templates for Dashboards” on page 94.
Component Type
Select your component from one of the listed types.
Component
The individual components for the type.
Visible On
The dashboard tabs on which the component is visible.
When you select to review components or component templates, the list of
available types is updated. When a Component Type is selected, the list of
components of that type is updated in the right pane.
v In the Visible On pane, you can review where the selected component is
displayed in the available dashboards and add or remove it as needed.
Adding or Removing Components from a Dashboard
Through the Visible On pane, you can review the dashboard tabs in which the
currently selected component is displayed.
Figure 29. Visible On pane
Dashboard names are displayed as folders. Clicking a dashboard name reveals the
individual tabs of that dashboard where the component is displayed.
v To remove a component from a dashboard tab, select it in the Visible On panel.
Click the -sign.
To add the selected component to a tab:
64
IBM Tealeaf cxView: cxView User Manual
1. Select Available Components.
2. In the Component Type panel, select the type of component to add. See
“Managing Report Templates for Dashboards” on page 94.
3. Select the component in the Component pane.
4. Above the Visible On pane, click the +sign.
5. In the dialog, click the dashboard name to which you want to add the
component. The current tabs on the selected dashboard are displayed beneath
the dashboard name.
v To view the dashboard tab names without the dashboard headings, click the
Individually check box.
v To filter the view, select the Filter check box and enter a filter string with
which to filter the display. Wildcards are accepted. The display is updated to
show only those items whose name contains the filter string.
6. Click the name of the tab to which you want to add the component.
7. Click Select.
8. The Visible On panel is updated.
Adding a report component
You can add charts and tables from reports that you create in the Portal reporting
tools. In the categories of components, you can select charts or tables from reports
from either of the following sources:
v Report Builder contains the set of saved reports that are created through the
Tealeaf Report Builder. See "Tealeaf Report Builder" in the IBM Tealeaf Reporting
Guide.
v Top Movers contains the saved Top Mover reports. See "Analyzing Top Movers"
in the IBM Tealeaf Reporting Guide.
You can add either of the following types of reporting components:
v Report Chart - Add the pie, bar, or line chart for the selected report to your
dashboard.
Note: You can add a report chart to your dashboard only if the underlying
report can be made into a chart. See "Tealeaf Report Builder" in the IBM Tealeaf
Reporting Guide.
v Report Table - Add the tabular detail data for the selected report to your
dashboard.
Optionally, you can edit the configuration for the component.
v See "Tealeaf Report Builder" in the IBM Tealeaf Reporting Guide.
v See "Analyzing Top Movers" in the IBM Tealeaf Reporting Guide.
Editing a Component
To edit a component:
1. Select Available Components.
2. The available types of components are displayed in the Component Type pane.
If a component type is selected, the individual components of that type are
displayed in the right pane. Select a component type and the individual
component of that type to edit.
3. If the component is in use, in the Visible On pane you can see the dashboards
and tabs where it is displayed.
Chapter 5. Configuring Dashboards
65
4. Above the Component pane, click Edit.
5. The Configure Component dialog is displayed. See “Dashboard Component
Templates.”
6. Make your changes and click Save.
Removing a Component
You can remove components from individual dashboards or delete them from use
in the system.
v To remove a template from a dashboard tab, use the Visible On pane.
To delete a component, select it in the Component tab. Then, click the Delete
button at the top of the pane. Confirm that you want to delete the component.
Note: Deleting a component removes it from all dashboard tabs.
v To add a component, you can add an existing component or create it from a
component template.
Component Templates
You can use the provided component templates as the basis for creating your own
dashboard components.
v See “Dashboard Component Templates.”
Adding a component
To add a component:
1. Click Component Templates.
2. Select the Component Type and then the component template from which to
build the new component.
3. Above the Component Template pane, click the +.
4. The Configure Component dialog is displayed. Edit the properties as needed.
5. When you finish configuring it, click Save to save the component.
6. The component is now available for review through the list of Available
Components. See Creating a Dashboard or Editing a Component for more
information.
v You can add the component to dashboard tabs through the Available
Components screen or through the Dashboards screen. See “Getting Started”
on page 58.
Dashboard Component Templates
Use a pre-configured set of dashboard component templates to build your suite of
dashboard components to include Portal report data in your dashboards. You can
find information about the dashboard component templates with their property
descriptions.
Accessing Dashboard Component Templates
To access the available dashboard component templates:
1. From the Portal menu, select Configure > Dashboards.
2. The Dashboards screen is displayed. See Chapter 5, “Configuring Dashboards,”
on page 57.
66
IBM Tealeaf cxView: cxView User Manual
In the left navigation panel, click the Configuration category.
Select the Components link.
In the main panel, click Component Templates.
In the Component Type panel in the middle, select the type of component.
In the Component panel on the right, select the component template to use as
the basis for building your own component.
8. To create a component from the selected template, click the plus(+) icon.
3.
4.
5.
6.
7.
Common Dashboard Component Properties
After a component or template is selected, the Configure Componentis displayed,
where you can edit the properties of the component:
Figure 30. Dashboard Component
Below the common component parameters are the component-specific parameters,
split into two sections: Data and Display.
Note: Some components do not have both data and display parameters. If the
parameter type does not apply, the relevant tab is hidden.
To save the component to the dashboard, click Save.
Chapter 5. Configuring Dashboards
67
Common properties in the Data tab
Property
Description
Component ID
Internal read-only identifier for the component.
Type
Component Type to which the component belongs. For more information,
see the Dashboard Component Template Types section.
Title
The component title, which is displayed on the dashboard.
Size
The size of the component, in Portal space units. The small grid to the
right of the size inputs indicates the area that is occupied by the
component on the page.
Dashboard components can be sized both horizontally and vertically, with
a minimum value of 1 and a maximum value of 4 in both directions.
v A dashboard tab can have an unlimited number of rows.
Color
The color of the component title bar.
Updates
The update interval for the component.
Note: The component that you add to the dashboard references data from
completed sessions only. So configuring an update interval to be more
frequent than the interval at which the data collection process is run is not
useful. By default, data collection occurs every 5- minutes. In this case,
component updates must not occur more frequently than a 5-minute
interval for components that are containing completed session data only.
If the component references data from active sessions, you can set the
update interval to be more frequent than every5- minutes. Depending on
the configured component and the number of components in the
dashboard, there can be performance impacts.
Drilldown
Available button is displayed in the component title bar. Title bar links the
button directly to the full report with the same parameters used to
generate the component.
Common properties in the Display tab
Some components do not have a Display tab, so there are no common properties
in this tab.
68
IBM Tealeaf cxView: cxView User Manual
Dashboard Component Template Types
In the Component Templates screen, you can review the available component
templates by type and create new component instances from them.
Figure 31. Component Templates Screen
v Component templates can be imported and exported as part of defined reports.
See "Importing and Exporting Reports" in the IBM Tealeaf cxView User Manual.
The following component type templates are available for using as the basis for
creating new templates:
Note: Drill-downs on report data available in the standard report are not available
when the report is added as a dashboard component.
Alerts
You can insert charts from alerts onto dashboards.
See "TEM Alerts Tab" in the IBM Tealeaf Event Manager Manual.
Common properties
v For more information, see "Common properties in the Data tab" section.
Table 12. Data tab:
Property
Description
Alert
Click the link to select an alert whose status is posted in the
configured dashboard component.
Table 13. Display tab:
Property
Description
Chart Style
Select the style of chart to display in the component:
v Full View - In Full View, the alert component includes the axis
labels, alert title, and units indicators.
v Gallery View - In Gallery View, only the alert data is displayed.
Chapter 5. Configuring Dashboards
69
Table 13. Display tab: (continued)
Property
Description
Unit Scaling
As needed, the Y-axis of the chart can be scaled according to the
units selected in drop-down.
v To disable scaling, select <No Scaling>.
Basic Components
In the Basic Components section, you can select basic dashboard components for
inclusion in your dashboard.
Available components:
v Header is used to segregate dashboard content.
v Image is an image URL.
Common properties
v For more information, see "Common properties in the Data tab" section.
Image Basic Component template
Property
Description
Image URL
For the image component template, you must specify the URL where the
image is located.
Client Performance Page Detail
Page detail dashboard components, as reported from the client.
Note: These reports require the installation and deployment of the UI Capture. See
"UI Capture FAQ" in the IBM Tealeaf UI Capture for Ajax FAQ.
All Client Performance reports are pre-configured to record URL, Host, App, and
Server information. This information is stored in the URL/Host/App/Server report
group of dimensions, with which each client performance event is automatically
associated.
v For more information about this report group, see "TEM Dimensions Tab" in the
IBM Tealeaf Event Manager Manual.
See "Analyzing Performance" in the IBM Tealeaf Reporting Guide.
Table 14. Client Performance Page Detail component templates:
Report Type
Description
Client Performance
Page Detail: Broken
Image Times
Page-level detail on broken images
v For more information about the contents of this report, see
"Analyzing Performance" in the IBM Tealeaf Reporting Guide.
Client Performance
Page-level detail on browser dimensions
Page Detail: Browser v For more information about the contents of this report, see
Dimensions
"Analyzing Performance" in the IBM Tealeaf Reporting Guide.
70
IBM Tealeaf cxView: cxView User Manual
Table 14. Client Performance Page Detail component templates: (continued)
Report Type
Description
Client Performance
Page Detail: Client
Statistics
Page-level detail on various statistics, as gathered and computed
from client-reported information
Client Performance
Page Detail: Dwell
Times
Page-level detail on dwell times
Client Performance
Page Detail:
JavaScript Alerts
Page-level detail on JavaScript alerts
Client Performance
Page Detail: Render
Times
Page-level detail on render times
v For more information about the contents of this report, see
"Analyzing Performance" in the IBM Tealeaf Reporting Guide.
v For more information about the contents of this report, see
"Analyzing Performance" in the IBM Tealeaf Reporting Guide.
v For more information about the contents of this report, see
"Analyzing Performance" in the IBM Tealeaf Reporting Guide.
v For more information about the contents of this report, see
"Analyzing Performance" in the IBM Tealeaf Reporting Guide.
Common properties
v For more information, see "Common properties in the Data tab" section.
Table 15. Data tab:
Property
Description
Period
Select the focus period to display in the component from the
drop-down.
URL
Optionally, you can pre-filter the displayed data in the component
for a specific value of the normalized URL dimension.
Host
Optionally, you can pre-filter the displayed data in the component
for a specific value of the Host dimension.
App
Optionally, you can pre-filter the displayed data in the component
for a specific value of the Application dimension.
Server
Optionally, you can pre-filter the displayed data in the component
for a specific value of the Server dimension.
To apply any of the dimension filters, select the check box next to the name. Click
the link to select the value with which to filter the report.
v You can filter the report by using multiple dimensions.
v You cannot filter the report by using multiple values of a single dimension.
Client Performance Summary
Summary report information about client user-interface data, as reported from the
client.
Note: These reports require the installation and deployment of UI Capture. See "UI
Capture FAQ" in the IBM Tealeaf UI Capture for Ajax FAQ.
See "Analyzing Performance" in the IBM Tealeaf Reporting Guide.
Chapter 5. Configuring Dashboards
71
Table 16. Client Performance Summary component templates:
Report Type
Description
Client Performance
Summary: Broken
Image Times
Summary information about broken images
Client Performance
Summary: JavaScript
Alerts
Summary information about JavaScript alerts
Client Performance
Summary: Render
Times
Summary information about render times
v For more information about contents of this report, see
"Analyzing Performance" in the IBM Tealeaf Reporting Guide.
v For more information about contents of this report, see
"Analyzing Performance" in the IBM Tealeaf Reporting Guide.
v For more information about contents of this report, see
"Analyzing Performance" in the IBM Tealeaf Reporting Guide.
Common properties
v For more information, see "Common properties in the Data tab" section.
Table 17. Data tab:
Property
Description
Period
Select the focus period to display in the component from the
drop-down.
Host
Optionally, you can pre-filter the displayed data in the component
for a specific value of the Host dimension.
Application
Optionally, you can pre-filter the displayed data in the component
for a specific value of the Application dimension.
Server
Optionally, you can pre-filter the displayed data in the component
for a specific value of the Server dimension.
Display Others
When selected, the values for the [others] values for the
configured dimensions are also displayed in the report.
To apply any of the dimension filters, select the check box next to the name. Click
the link to select the value to filter the report.
v You can filter the report by using multiple dimensions.
v You cannot filter the report by using multiple values of a single dimension.
Table 18. Display tab:
Property
Description
Display
Select the topmost values to display.
v To display the all of the recorded values for the configured
report, select All.
CX: Active Status
You can add charts and tables from the Active Status report.
See "Monitoring Active Status" in the IBM Tealeaf cxImpact User Manual.
72
IBM Tealeaf cxView: cxView User Manual
Common properties
v For more information, see "Common properties in the Data tab" section.
Table 19. Active Status component templates:
Report Type
Description
Hit Distribution
Distribution of hits across servers in the environment
Session Distribution Session distribution between single and multi-hit sessions
Single Page Sessions Percentages of single-hit sessions and stand-alone hits
Top Active Events
Counts of the top active events.
Table 20. Data tab:
Property
Description
Tealeaf CX
Select the server from which the report data is gathered.
v To gather data from all servers, select <All Servers>.
Table 21. Display tab:
Property
Description
Unit Scaling
As needed, the Y-axis of the chart can be scaled according to the
units selected in drop-down.
v To disable scaling, select <No Scaling>.
Scaled Warning Value Optionally, you can configure a marker to be placed on the chart
that is indicating a warning level. Units that are entered in the
textbox are based on any applied scaling factor.
Scaled Alert Value
Optionally, you can configure a marker to be placed on the chart
that is indicating an alert level. Units that are entered in the
textbox are based on any applied scaling factor.
Top Active Events component template
For the Top Active Events dashboard component, the following properties are
available.
Table 22. Data tab:
Property
Description
Tealeaf CX
Select the server from which the report data is gathered.
v To gather data from all servers, select <All Servers>.
Grouped
Select this check box to group events by event label in the report.
Limit Event Count
When selected, the specified number of top events (Top-N) are
tabulated in the report.
Table 23. Display tab:
Property
Description
Display
Select the topmost values to display.
v To display the all of the recorded values for the configured
report, select All.
Chapter 5. Configuring Dashboards
73
CX: Canister Status
The Canister Status dashboard components can be included to provide updated
information about the Tealeaf Canisters in your environment.
See "System Status" in the IBM TealeafcxImpact Administration Manual.
Common properties
v For more information, see "Common properties in the Data tab" section.
Table 24. Canister Status report types:
Report Type
Description
Active Sessions
Counts of active sessions for the selected Canister
v For more information about the contents of this report, see the
"Active Sessions component template".
Active Sessions
(All)
Counts of active sessions across all Canisters
v For more information about the contents of this report, see the
"Active Sessions (All) component template".
Canister Memory Used Currently used memory in the selected Canister
v For more information about the contents of this report, see the
"Canister Memory Used component template".
CPU Utilization
(All)
CPU utilization across all Canisters in the environment
v For more information about the contents of this report, see the
"CPU Utilization (All) component template".
Session Distribution Distribution of sessions across all servers in the environment
v For more information about the contents of this report, see the
"Session Distribution component template".
Active Sessions component template
Table 25. Data tab:
Property
Description
Tealeaf CX
(Active Sessions) Select the server from which the data is gathered.
Table 26. Display tab:
Property
Description
Data Coloring
You can choose whether data is displayed in mono or multi-color
format.
Unit Scaling
As needed, the Y-axis of the chart can be scaled according to the
units selected in drop-down.
v To disable scaling, select <No Scaling>.
Scaled Warning Value Optionally, you can configure a marker to be placed on the chart
that is indicating a warning level. Units that are entered in the
textbox are based on any applied scaling factor.
74
Scaled Alert Value
Optionally, you can configure a marker to be placed on the chart
that is indicating an alert level. Units that are entered in the
textbox are based on any applied scaling factor.
Show Data Values
Select this option to show the recorded values for data that is
displayed in the report.
IBM Tealeaf cxView: cxView User Manual
For more information about the contents of this report, see "System Status" in the
IBM Tealeaf cxImpact Administration Manual.
Active Sessions (All) component template
Data tab:
None.
Table 27. Display tab:
Property
Description
Data Coloring
You can choose whether data is displayed in mono or multi-color
format.
Unit Scaling
As needed, the Y-axis of the chart can be scaled according to the
units selected in drop-down.
v To disable scaling, select <No Scaling>.
Scaled Warning Value Optionally, you can configure a marker to be placed on the chart
that is indicating a warning level. Units that are entered in the
textbox are based on any applied scaling factor.
Scaled Alert Value
Optionally, you can configure a marker to be placed on the chart
that is indicating an alert level. Units that are entered in the
textbox are based on any applied scaling factor.
Show Data Values
Select this option to show the recorded values for data that is
displayed in the report.
For more information about the contents of this report, see "System Status" in the
IBM Tealeaf cxImpact Administration Manual.
Canister Memory Used component template
Table 28. Data tab:
Property
Description
Tealeaf CX
(Active Sessions) Select the server from which the data is gathered.
Display tab:
None.
For more information about the contents of this report, see "System Status" in the
IBM Tealeaf cxImpact Administration Manual.
CPU Utilization (All) component template
Data tab:
None.
Table 29. Display tab:
Property
Description
Scaled Warning Value Optionally, you can configure a marker to be placed on the chart
that is indicating a warning level. Units that are entered in the
textbox are based on any applied scaling factor.
Scaled Alert Value
Optionally, you can configure a marker to be placed on the chart
that is indicating an alert level. Units that are entered in the
textbox are based on any applied scaling factor.
Chapter 5. Configuring Dashboards
75
For more information about the contents of this report, see "System Status" in the
IBM Tealeaf cxImpact Administration Manual.
Session Distribution component template
Data tab:
None.
Display tab:
None.
For more information about the contents of this report, see "System Status" in the
IBM Tealeaf cxImpact Administration Manual.
CX: Database Size
Components of the database Filegroup Size and database Table Size reports
provide information about the trends in growth for specific areas of the Tealeaf
databases.
v See "System Status" in the IBM TealeafcxImpact Administration Manual.
v See "System Status" in the IBM TealeafcxImpact Administration Manual.
Table 30. Database Size component templates:
Report Type
Description
Database Daily
Percent Growth
Percentage growth in database size day over day
Database Filegroup
Size
Growth of filegroup sizes for the selected database
Database Table
Percent Growth
Percentage growth in database table size day over day
Database Table Row
Count
Counts of rows in database tables for all databases
Common properties
v For more information, see "Common properties in the Data tab" section.
Table 31. Data tab:
Property
Description
Database
Select the Tealeaf database from which the dashboard component
gathers its data.
Data Group
(Database Table Percent Growth) Select the data group from which
to gather report data.
Period
Select the set of preceding days to include in the component's data.
Display tab:
None.
CX: DecoupleEx Status
The components of the DecoupleEx Status report indicate the operational status of
the Tealeaf Transport Service and the Short Term Canister.
v If you have product license for IBM Tealeaf cxReveal and install a cxReveal
Server, you can optionally display DecoupleEx status information in this report.
76
IBM Tealeaf cxView: cxView User Manual
v See "System Status" in the IBM Tealeaf cxImpact Administration Manual.
Table 32. DecoupleEx Status component templates:
Report Type
Description
Hits/Sec
Report on the hits per second being processed by the selected
Canister
Hits/Sec Rate
Overview (All)
Summary report on the rate of hits that is processed across all
servers
MB/Sec
Megabytes processed per second report
Queue Overview (All) Overview of the queue performance across all components
Common properties
v For more information, see "Common properties in the Data tab" section.
Table 33. Data tab:
Property
Description
Tealeaf CX
Select the server from which the report data is gathered.
v To gather data from all servers, select <All Servers>.
Include Transport
Servers
(Hits/Sec Rate Overview (All) and Queue Overview (All)) Select
this check box to include data from Transport Servers.
Include cxReveal
Servers
(Hits/Sec Rate Overview (All) and Queue Overview (All)) Select
this check box to include data from cxReveal search servers.
Table 34. Display tab:
Property
Description
Data Coloring
You can choose whether data is displayed in mono or multi-color
format.
Unit Scaling
As needed, the Y-axis of the chart can be scaled according to the
units selected in drop-down.
v To disable scaling, select <No Scaling>.
Scaled Warning Value Optionally, you can configure a marker to be placed on the chart
that is indicating a warning level. Units that are entered in the
textbox are based on any applied scaling factor.
Scaled Alert Value
Optionally, you can configure a marker to be placed on the chart
that is indicating an alert level. Units that are entered in the
textbox are based on any applied scaling factor.
Show Data Values
Select this option to show the recorded values for data that is
displayed in the report.
CX: HBR Status
For Tealeaf systems that use Health-Based Routing to manage Canister load, you
can add components of the HBR Status report to your dashboards.
See "System Status" in the IBM TealeafcxImpact Administration Manual.
Table 35. HBR Status component templates:
Report Type
Description
Healthy Canisters
Report displaying the overall % of working canisters
Chapter 5. Configuring Dashboards
77
Table 35. HBR Status component templates: (continued)
Report Type
Description
Healthy Traffic
Distribution
Breakdown report that is showing the traffic distribution and
health of each individual canister
Traffic Health
Report displaying the over % of traffic that is being routed to
working canisters
Common properties
v For more information, see "Common properties in the Data tab" section.
Table 36. Data tab:
Property
Description
Tealeaf CX
Select the server from which the report data is gathered.
v To gather data from all servers, select <All Servers>.
Display tab:
None.
CX: Storage Status
These components provide status information about long-term storage for the
Canisters of the environment.
See "System Status" in the IBM Tealeaf cxImpact Administration Manual.
Table 37. Storage Status component templates:
Report Type
Description
Avg. Total
Index/LSSN Size Per
Day
Average total size of the index files per day
Index/LSSN Size
Ratio
Ratio of index to LSSN file size
Sessions
Sessions that are stored by day
Common properties
v For more information, see "Common properties in the Data tab" section.
Table 38. Data tab:
Property
Description
Tealeaf CX
Select the server from which the report data is gathered.
Table 39. Display tab:
Property
Description
Data Coloring
You can choose whether data is displayed in mono or multi-color
format.
Unit Scaling
As needed, the Y-axis of the chart can be scaled according to the
units selected in drop-down.
v To disable scaling, select <No Scaling>.
78
IBM Tealeaf cxView: cxView User Manual
Table 39. Display tab: (continued)
Property
Description
Scaled Warning Value Optionally, you can configure a marker to be placed on the chart
that indicates a warning level. Units that are entered in the textbox
are based on any applied scaling factor.
Scaled Alert Value
Optionally, you can configure a marker to be placed on the chart
that indicates an alert level. Units that are entered in the textbox
are based on any applied scaling factor.
Show Data Values
Select this option to show the recorded values for data that is
displayed in the report.
Avg. Total Index/LSSN Size Per Day dashboard component
Data tab:
None.
Table 40. Display tab:
Property
Description
Byte Scale
Specify the units for the report (for example bytes, kilobytes).
Scaled Warning Value Optionally, you can configure a marker to be placed on the chart
that is indicating a warning level. Units that are entered in the
textbox are based on any applied scaling factor.
Scaled Alert Value
Optionally, you can configure a marker to be placed on the chart
that is indicating an alert level. Units that are entered in the
textbox are based on any applied scaling factor.
Live Event Counts
Dashboard components that are created from events that are configured to capture
minute-level event counts.
v You cannot select Canister events or events that are not configured to be
Searchable & Reportable for these dashboard components.
v Data is available for live event counts for the preceding 24-hour rolling period.
v Minute-level tabulation of event counts requires enabled Alert Service and at
least one alert is configured and active.
– If the Alert Service is stopped or restarted, all data from the preceding
24-hour period is lost. When the Alert Service resumes, it immediately
calculates minute-level data.
– For more information about enabling the alert service, see "Configuring the
Alert Service" in the IBM Tealeaf CX Configuration Manual.
– For more information about configuring alerts, see "TEM Alerts Tab" in the
IBM Tealeaf Event Manager Manual.
v For more information about configuring events to capture minute-level counts,
see "TEM Events Tab" in the IBM Tealeaf Event Manager Manual.
Chapter 5. Configuring Dashboards
79
Common properties
v For more information, see "Common properties in the Data tab" section.
Table 41. Data tab:
Property
Description
Event
Select the event whose minute-by-minute counts you would like to
display.
v The event must be configured to tabulate minute-by-minute
counts. See "TEM Events Tab" in the IBM Tealeaf Event Manager
Manual.
Period
Select the period over which to display the minute-by-minute
event counts.
Table 42. Display tab:
Property
Description
Data View
Select the type of graph to use to display the report data.
Unit Scale
As needed, the Y-axis of the chart can be scaled according to the
units selected in the drop-down.
v To disable scaling, select <No Scaling>.
Scaled Warning Value Optionally, you can configure a marker to be placed on the chart
that is indicating a warning level. Units that are entered in the
textbox are based on any applied scaling factor.
Scaled Alert Value
Optionally, you can configure a marker to be placed on the chart
that is indicating an alert level. Units that are entered in the
textbox are based on any applied scaling factor.
Zoom Scale
When selected, the Y-axis scale is automatically zoomed for the
Tealeaf user.
Performance Reports
Dashboard components that are derived from system performance reports.
See "Analyzing Performance" in the IBM Tealeaf Reporting Guide.
Table 43. Performance Reports component templates:
Report Type
Description
Response Time Trend
Response time trending report
Segmented Response
Time
Segment response times for page generation, network trip, and
render times
Top Pages
Top performing pages
Common properties
v For more information, see "Common properties in the Data tab" section.
Table 44. Data tab:
80
Property
Description
Period
Select the focus period to display in the component from the
drop-down.
URL
Optionally, you can pre-filter the displayed data in the component
for a specific value of the normalized URL dimension.
IBM Tealeaf cxView: cxView User Manual
Table 44. Data tab: (continued)
Property
Description
Host
Optionally, you can pre-filter the displayed data in the component
for a specific value of the Host dimension.
App
Optionally, you can pre-filter the displayed data in the component
for a specific value of the Application dimension.
Server
Optionally, you can pre-filter the displayed data in the component
for a specific value of the Server dimension.
Display Others
(Segmented Response Time and Top Pages) When selected, the
values for the [others] values for the configured dimensions are
also displayed in the report.
Display Render Times When selected, render times are also displayed in the report.
Table 45. Display tab:
Property
Description
Display
(Segmented Response Time and Top Pages) Select the topmost
values to display.
v To display the all of the recorded values for the configured
report, select All.
Report Builder
You can include charts and data tables from reports to which you have access in
Report Builder.
v See "Tealeaf Report Builder" in the IBM Tealeaf Reporting Guide.
v For more information about the visitor Report Builder, see "Tealeaf Visitor
Report Builder" in the IBM Tealeaf cxResults User Manual.
Table 46. Report Builder component templates:
Report Type
Description
Report Chart
Report Builder report in chart format
Report Chart
(Visitor Segment)
Visitor Report Builder report in chart format
Report Table
Report Builder report in table format
Report Table
(Visitor Segment)
Visitor Report Builder report in table format
Common properties
v For more information, see "Common properties in the Data tab" section.
Report Builder component template
Table 47. Data tab:
Property
Description
Report
Select the Report Builder report to include in the dashboard
component.
Period
Select the focus period to display in the component from the
drop-down.
Chapter 5. Configuring Dashboards
81
Display tab:
None.
Visitor Report Builder component template
Table 48. Data tab:
Property
Description
Report
Select the Visitor report to include in the dashboard component.
Visitor Segment
When selected, you can configure the source segment for the
report.
Visitor Search
Schedule
When selected, you can configure the scheduled search to use to
generate the source segment.
Display tab:
None.
Scorecards: KPI
You can add any Key Performance Indicator scorecard to which you have access to
your dashboards.
See “Overview” on page 24.
Table 49. Scorecards: KPI component templates:
Report Type
Description
Scorecard: KPI
KPI scorecard report.
Scorecard: KPI
(Visitor Segment)
KPI scorecard report on a visitor segment.
Common properties
v For more information, see "Common properties in the Data tab" section.
KPI Scorecard report template
Table 50. Data tab:
Property
Description
Scorecard
Click the link to select a scorecard to display in the component.
Period
From the drop-down, select the period to display. Period is relative
to the date configured for the dashboard.
Comparison
To include comparison data in the scorecard, select Previous
Period.
v To disable a comparison period, select No Comparison.
Table 51. Display tab:
82
Property
Description
Grade Distribution
Chart
Select this option to include a grade distribution chart.
Note: As part of the scorecard definition, Grades must be
assigned. For more information about scorecard grading, see
“Overview” on page 24.
IBM Tealeaf cxView: cxView User Manual
Table 51. Display tab: (continued)
Property
Description
Grade Detail Table
Select this option to include a grade distribution table.
Note: As part of the scorecard definition, Grades must be
assigned. For more information about scorecard grading, see
“Overview” on page 24.
Visitor KPI Scorecard report template
Table 52. Data tab:
Property
Description
Visitor Segment
When selected, you can configure the source segment for the
report.
Visitor Search
Schedule
When selected, you can configure the scheduled search to use to
generate the source segment.
Table 53. Display tab:
Property
Description
Grade Distribution
Chart
Select this option to include a grade distribution chart.
Note: As part of the scorecard definition, Grades must be
assigned. For more information about scorecard grading, see
“Overview” on page 24.
Grade Detail Table
Select this option to include a grade distribution table.
Note: As part of the scorecard definition, Grades must be
assigned. For more information about scorecard grading, see
“Overview” on page 24.
Scorecards: Process
You can add any Process scorecard to which you have access to your dashboards.
See “Configuring Process Scorecards” on page 31.
Table 54. Scorecards: Process component templates:
Report Type
Description
Scorecard: Process
Process scorecard report.
Scorecard: Process
(Visitor Segment)
Process scorecard report on a visitor segment.
Common properties
v For more information, see "Common properties in the Data tab" section.
Process Scorecard dashboard component
Table 55. Data tab:
Property
Description
Scorecard
Click the link to select a scorecard to display in the component.
Period
From the drop-down, select the period to display. Period is relative
to the date configured for the dashboard.
Chapter 5. Configuring Dashboards
83
Table 55. Data tab: (continued)
Property
Description
Comparison
To include comparison data in the scorecard, select Previous
Period.
v To disable a comparison period, select No Comparison.
Table 56. Display tab:
Property
Description
Summary Metrics
Includes summary metrics in dashboard component. See Chapter 2,
“Using Scorecards,” on page 5.
Rate Indicators
Chart
Includes Rates in chart form in dashboard component. See
Chapter 2, “Using Scorecards,” on page 5.
Rate Indicators
Table
Includes Rates in table form in dashboard component. See
Chapter 2, “Using Scorecards,” on page 5.
Step Conversion
Chart
Includes Step Conversion in chart form in dashboard component.
See Chapter 2, “Using Scorecards,” on page 5.
Step Conversion
Table
Includes Step Conversion in table form in dashboard component.
See Chapter 2, “Using Scorecards,” on page 5.
Abandonment Chart
Includes Abandonment in chart form in dashboard component. See
Chapter 2, “Using Scorecards,” on page 5.
Abandonment Table
Includes Abandonment in table form in dashboard component. See
Chapter 2, “Using Scorecards,” on page 5.
Failure Chart
Includes Failure in chart form in dashboard component.
Failure Table
Includes Failure in table form in dashboard component.
Visitor Process Scorecard dashboard component
Table 57. Data tab:
Property
Description
Scorecard
Click the link to select a scorecard to display in the component.
Period
From the drop-down, select the period to display. Period is relative
to the date configured for the dashboard.
Comparison
To include comparison data in the scorecard, select Previous
Period.
v To disable a comparison period, select No Comparison.
Display tab:
For more information about these properties, see Display tab in the previous
section.
Top Movers
Dashboard components for top mover reports that you select.
See "Analyzing Top Movers" in the IBM Tealeaf Reporting Guide.
Table 58. Top Movers component templates:
84
Report Type
Description
Top Movers Chart
Top Movers report in chart format
IBM Tealeaf cxView: cxView User Manual
Table 58. Top Movers component templates: (continued)
Report Type
Description
Top Movers Table
Top Movers report in table format
Common properties
v For more information, see "Common properties in the Data tab" section.
Table 59. Data tab:
Property
Description
Report
Click the link to select a Top Movers report to include in the
dashboard component.
Hour
If the selected report is an Hourly report, then you can configure
the hour of report data to include in the dashboard component.
Display tab:
None.
User Activity Reports
Tealeaf provides a pre-configured set of reports on user activities in the Tealeaf
system.
See "Monitoring User Activity" in the IBM Tealeaf cxImpact Administration Manual.
Table 60. User Activity component templates:
Report Type
Description
Replay Use
Number of replays per user group.
v For more information about the contents of this report, see
"Monitoring User Activity" in the IBM Tealeaf cxImpact
Administration Manual.
Search Effectiveness Effectiveness of user searches in locating sessions
v For more information about the contents of this report, see
"Monitoring User Activity" in the IBM Tealeaf cxImpact
Administration Manual.
Sessions Replayed
Number of sessions that are replayed by user group
v For more information about the contents of this report, see
"Monitoring User Activity" in the IBM Tealeaf cxImpact
Administration Manual.
Sessions Returned
Number of sessions that are returned by user group
v For more information about the contents of this report, see
"Monitoring User Activity" in the IBM Tealeaf cxImpact
Administration Manual.
Usage Metrics By
User
Summary of usage statistics individual user.
Usage Metrics
Summary
Summary of Tealeaf usage metrics by user group.
v For more information about the contents of this report, see
"Monitoring User Activity" in the IBM Tealeaf cxImpact
Administration Manual.
v For more information about the contents of this report, see
"Monitoring User Activity" in the IBM Tealeaf cxImpact
Administration Manual.
Chapter 5. Configuring Dashboards
85
Table 60. User Activity component templates: (continued)
Report Type
Description
Usage Metrics
Summary Detail
Detail version of the previous report.
User Inactivity
Usage report on Tealeaf user accounts that is accessed recently.
v For more information about the contents of this report, see
"Monitoring User Activity" in the IBM Tealeaf cxImpact
Administration Manual.
User Searches
Summary of searches by user group
v For more information about the contents of this report, see
"Monitoring User Activity" in the IBM Tealeaf cxImpact
Administration Manual.
Common properties
v For more information, see "Common properties in the Data tab" section.
Table 61. Data tab:
Property
Description
Period
From the drop-down, select the period to display. Period is relative
to the date configured for the dashboard.
User Groups
Select the user groups to include in the report.
v To include data for all user groups, select <All User Groups>.
Aggregate To Period
Select this option to aggregate all reporting data to the selected
period.
Table 62. Display tab:
Property
Description
X-Label Orientation
Choose the axis orientation of labels that are displayed for the
X-axis: Horizontal or Vertical.
Unit Scale
As needed, the Y-axis of the chart can be scaled according to the
units selected in drop-down.
v To disable scaling, select <No Scaling>.
Scaled Warning Value Optionally, you can configure a marker to be placed on the chart
that is indicating a warning level. Units that are entered in the
textbox are based on any applied scaling factor.
Scaled Alert Value
Optionally, you can configure a marker to be placed on the chart
that is indicating an alert level. Units that are entered in the
textbox are based on any applied scaling factor.
Prune X-Axis Labels
Optionally, the scorecard can be allowed to automatically prune
X-axis labels that are too large for the available display space.
Zoom Scale
When selected, the Y-axis scale is automatically zoomed for the
Tealeaf user.
Usage Metrics report components
Table 63. Data tab:
86
Property
Description
Period
From the drop-down, select the period to display. Period is relative
to the date configured for the dashboard.
IBM Tealeaf cxView: cxView User Manual
Table 63. Data tab: (continued)
Property
Description
User Groups
Select the user groups to include in the report.
v To include data for all user groups, select <All User Groups>.
Display tab:
None.
User Inactivity report component
Table 64. Data tab:
Property
Description
Period
From the drop-down, select the period to display. Period is relative
to the date configured for the dashboard.
User Groups
Select the user groups to include in the report.
v To include data for all user groups, select <All User Groups>.
Portal Events
You can select one or more portal application events that are used
to track user activities to be included in the dashboard component.
v If a list of Portal events is supplied, the selected users are
checked to see whether they do not complete any of the
specified events.
– If a list is not supplied, the selected users are evaluated for
failing to complete any of the monitored portal activities.
v To add a portal event to the dashboard component, click the
Plus (+) icon.
v To delete a portal event to the dashboard component, click the
Minus (-) icon.
Display tab:
None.
Visitor Segment Reports
Components from visitor reports for specific segments or schedules.
See "Analyzing Visitor Segments" in the IBM Tealeaf cxResults User Manual.
Table 65. Visitor Segment Reports component templates:
Report Type
Description
Page Counts
Number of pages in the segment by date
v See "Analyzing Visitor Segments" in the IBM Tealeaf cxResults
User Manual.
Pages by Hour
Number of pages in the segment for each hour of the reporting
period
v See "Analyzing Visitor Segments" in the IBM Tealeaf cxResults
User Manual.
Search Term Session
Matches
Counts of session matches for each search term parameter
v See "Analyzing Visitor Segments" in the IBM Tealeaf cxResults
User Manual.
Chapter 5. Configuring Dashboards
87
Table 65. Visitor Segment Reports component templates: (continued)
Report Type
Description
Search Term Visitor
Matches
Counts of visitor matches for each search parameter
Session Length
Distribution
Distribution of session lengths across the reporting period
Session Page Count
Distribution
Distribution of counts of pages across sessions in the segment
Sessions by Hour
Counts of sessions for each hour of the reporting period
v See "Analyzing Visitor Segments" in the IBM Tealeaf cxResults
User Manual.
v See "Analyzing Visitor Segments" in the IBM Tealeaf cxResults
User Manual.
v See "Analyzing Visitor Segments" in the IBM Tealeaf cxResults
User Manual.
Sessions Counts
Session counts across dates in the reporting period
v See "Analyzing Visitor Segments" in the IBM Tealeaf cxResults
User Manual.
Top Entry Pages
Counts of most common entry pages for sessions in the segment
v See "Analyzing Visitor Segments" in the IBM Tealeaf cxResults
User Manual.
Top Events
Counts of most common events for sessions in the segment
Top Exit Pages
Counts of most common exit pages for sessions in the segment
v See "Analyzing Visitor Segments" in the IBM Tealeaf cxResults
User Manual.
Top Logins
Counts of most common login identifiers for sessions in the
segment
v See "Analyzing Visitor Segments" in the IBM Tealeaf cxResults
User Manual.
Top Session Referrer Counts of most common referrers for sessions in the segment
v See "Analyzing Visitor Segments" in the IBM Tealeaf cxResults
User Manual.
Top Visitors
Counts of most common visitors for sessions in the segment
v See "Analyzing Visitor Segments" in the IBM Tealeaf cxResults
User Manual.
User Def 1 Values
Counts of values that are stored in Session Attribute 00 for
sessions in the segment
v User Def is an existing term from Release 7.x and earlier.
v See "Analyzing Visitor Segments" in the IBM Tealeaf cxResults
User Manual.
User Def 2 Values
Counts of values that are stored in Session Attribute 01 for
sessions in the segment
v User Def is an existing term from Release 7.x and earlier.
v See "Analyzing Visitor Segments" in the IBM Tealeaf cxResults
User Manual.
User Def 3 Values
Counts of values that are stored in Session Attribute 02 for
sessions in the segment
v User Def is an existing term from Release 7.x and earlier.
v See "Analyzing Visitor Segments" in the IBM Tealeaf cxResults
User Manual.
88
IBM Tealeaf cxView: cxView User Manual
Table 65. Visitor Segment Reports component templates: (continued)
Report Type
Description
User Def 4 Values
Counts of values that are stored in Session Attribute 03 for
sessions in the segment
v User Def is an existing term from Release 7.x and earlier.
v See "Analyzing Visitor Segments" in the IBM Tealeaf cxResults
User Manual.
Common properties
v For more information, see "Common properties in the Data tab" section.
Table 66. Data tab:
Property
Description
Visitor Segment
When selected, you can configure the source segment for the
report.
Visitor Search
Schedule
When selected, you can configure the scheduled search to use to
generate the source segment.
Scope
Defines the scope of the report:
v Only matching sessions per visitor - returns for each visitor
only session from the segment in the specified time frame
v All sessions per visitor - include for each visitor all sessions
from the segment that actively match the specified search criteria
v See "Analyzing Visitor Segments" in the IBM Tealeaf cxResults
User Manual.
Aggregate Dates
When selected, data is aggregated in the dashboard component at
the day level.
v Hourly reports and Distribution reports do not have this option.
Zero Fill Dates
When selected, dates that do not contain data are filled with zeros.
v Distribution reports do not have this option.
Report Count
For Top reports and User Def reports, you can select how the
counts are tabulated:
v Report specific - Counts are tabulated specific to the selected
report.
v By visitor - Counts are tabulated by detected visitor in the
segment.
v By session - Counts are tabulated by session in the segment.
v This option is available for Top reports and User Def reports
only. The Top Visitors report does not include this option, since
it is tabulated by visitor.
Display tab:
None.
Setting the Default Dashboard
From the dashboards available to you, you can select the dashboard to display as
your personal default in the Dashboards menu.
1. In the Configuring Dashboards page, click the Set Default Dashboard link.
2. In theDashboards drop-down, select the dashboard that you like to display at
the top of the Dashboards menu.
Chapter 5. Configuring Dashboards
89
3. Click OK.
4. When you next log in, this dashboard is displayed at the top of the dashboards
menu.
v To refresh the portal menu, click theRefresh button on your browser.
Tealeaf administrators can configure this dashboard to be the startup page for your
account. The start page can be configured at the individual user or group level by
a Tealeaf administrator.
v See "CX User Administration" in the IBM Tealeaf cxImpact Administration Manual.
v See "cxReveal User Administration" in the IBM Tealeaf cxReveal Administration
Manual.
v See "cxView User Administration" in the IBM Tealeaf cxImpact Administration
Manual.
Overview
After you create dashboards, you can configure the execution of snapshots of
dashboards on a daily, weekly, or monthly basis for a selected day. These reports
are delivered to specified email addresses or aliases at the time of execution in PDF
or HTML.
Note: You cannot email snapshots of inactive dashboards.
Note: To email report snapshots, you must configure an email address in your
user account. Do not create snapshot schedules from a Tealeaf administration
account.
v See "My Settings" in the IBM Tealeaf cxImpact User Manual.
Note: Non-administrator users can configure report schedules for reports that they
own or are shared to them. The Tealeaf admin can see and configure all schedules.
v For more information about configuring access permissions for reports, see
"Report Access Permissions" in the IBM Tealeaf cxImpact Administration Manual.
v To configure dashboard schedules, click Dashboard Schedules in the left pane.
90
IBM Tealeaf cxView: cxView User Manual
Figure 32. Dashboard Schedules
Note: A dashboard schedule is visible only to the owner of the schedule.
v To configure a new dashboard schedule, click <Create Schedule>.
v To edit an existing schedule, select it in the middle pane. The schedule is
displayed in the General tab.
v To disable a schedule, select it and then clear the Activecheck box in the
General tab.
General Tab
To configure a new or existing schedule, specify the properties in the General tab.
Chapter 5. Configuring Dashboards
91
Figure 33. Dashboard Schedules - General Tab
Properties
Description
Active
Click the check box to enable the dashboard schedule.
Description
This description is displayed in the Portal.
Schedule
Schedule the dashboard by type:
v Daily - Select the days of the week when the dashboard is to be
processed.
v Weekly - Select the single day of the week when the dashboard is to be
processed.
v Monthly - From the drop-down, select the day of the month when the
dashboard is to be processed.
Send At
Select the time when the dashboard is processed and delivered.
v Time is based on the Tealeaf system time zone. See "Configuring the
System Timezone" in the IBM Tealeaf CX Configuration Manual.
Focus Day Offset
Optionally, you can configure the number of days before the date of
execution that you would like to define as "today" in the dashboard. For
92
IBM Tealeaf cxView: cxView User Manual
example, you might configure a dashboard to be processed Tuesday
morning to delivers Monday's data to users. In this case, you would set the
offset value to 1.
Language
Select the language to use in the dashboard from the drop-down.
Recipients
Enter a comma-separated list of email addresses or aliases to whom to
send the dashboard.
Dashboard
Click the link to select the dashboard to send. Select the dashboard and
click Select.
Tab
Optionally, you can configure the schedule to deliver the contents of a
single tab in the dashboard.
v To deliver all tabs in the scheduled dashboard, select <All Tabs>.
Email Format
Select the format in which to send the dashboard: PDF, HTML or both.
History Tab
In the History tab, you can review the history of scheduled dashboard executions.
Figure 34. Dashboard Schedules - History Tab
Chapter 5. Configuring Dashboards
93
Column
Description
Created At
Time stamp for when the schedule was created
Scheduled At
Time stamp for when the schedule's next execution.
Log Level
Success or failure of the scheduled report
Message
Detail message on status of report execution
Managing Report Templates for Dashboards
In the Report Templates section, you can choose to begin import or export of a
dashboard template. A report template includes the base container for the template,
specified components, and the required events to populate the dashboard with
data.
During import, you can selectively choose which elements of the dashboard to
include.
v To import a dashboard, click Import Template.
v To export a dashboard, select a dashboard and click Export Template.
Dashboards are exported in .tlt format.
v See "Importing and Exporting Reports" in the IBM Tealeaf cxView User Manual.
94
IBM Tealeaf cxView: cxView User Manual
Chapter 6. Importing and Exporting Reports
Through the Tealeaf Portal, you can export report data in PDF or HTML format for
delivery to designated addresses. You can also export report templates that contain
scorecards, dashboards, or Tealeaf reports for use in other Tealeaf systems.
Exporting Report Data
For individual reports, you can export them on demand or according to a schedule
you define. Use the following links to access information about export of
individual reports.
Table 67. Exporting Report Data
Report Type On-Demand Export
Scheduled Export
Report
Builder
report
"Tealeaf Report Builder" in the IBM
Tealeaf Reporting Guide
"Tealeaf Report Builder" in the IBM
Tealeaf Reporting Guide
Top Movers
report
"Analyzing Top Movers" in the IBM
Tealeaf Reporting Guide
"Analyzing Top Movers" in the IBM
Tealeaf Reporting Guide
Scorecard
"Using Scorecards" in the IBM Tealeaf
cxView User Manual
"Configuring Scorecards" in the IBM
Tealeaf cxView User Manual
Dashboard
"Using Dashboards" in the IBM
Tealeaf cxView User Manual
"Configuring Dashboards" in the IBM
Tealeaf cxView User Manual
Report Templates
Report templates are report definitions that can be passed between Tealeaf
environments. Through the Portal, you can export the report templates for
scorecards, dashboards, and Report Builder reports.
v See Chapter 7, “Exporting Report Templates,” on page 97.
v See Chapter 8, “Importing Report Templates,” on page 99.
© Copyright IBM Corp. 1999, 2014
95
96
IBM Tealeaf cxView: cxView User Manual
Chapter 7. Exporting Report Templates
Through the Portal, you can export scorecard templates, dashboard templates, and
templates for Report Builder types for use in other Tealeaf systems. This feature
enables easy migration of reports in development from your test environments to
your production environment.
Limitations
The following limitations apply to importing report templates:
1. If an item in a report, such as an event, dimension, or the report itself exists in
the destination system, it is used as-is and is not updated. This comparison is
based on internal identifiers, instead of display names.
2. The report import feature does not provide full support for any scorecards or
reports that reference specific dimension values.
3. You cannot remap events that are used by a report during the import process.
4. You cannot map a report template that is imported to an existing report in the
destination system. If five template imports reference a single report, they
reference the single instance that is created by the first template import.
Note: After you import a report template, you cannot re-import it to overwrite
the previous version. You must delete the report in the destination system
before you attempt to re-import it.
Recommended Workflow
If you are attempting to migrate reports, scorecards, and dashboards from one
system to another, Tealeaf recommends the following workflow.
1. Create Report Builder reports with all of the events you want to migrate.
v These reports must contain events that are used by any dashboards or
scorecards that you want to migrate.
v These reports do not have to be actively used in your Tealeaf environment;
the purpose of creating these reports is to bundle up sets of events, which
are migrated with the report.
2. Export all Report Builder report templates that you want to migrate or that
contain events you want to migrate. Follow the Export Template Steps below.
3. Import them into the destination system. See "Importing Report Templates" in
the IBM Tealeaf cxView User Manual.
4. Verify that the events and related event objects are properly imported.
5. In the source system, you can choose to export scorecards and dashboards.
Follow the Export Template Steps.
Note: Tealeaf recommends re-creating scorecards and dashboards in the
destination system. However, in some cases, it can be problematic to do so.
Issues can occur during the import of these items, which do not affect the
events that are already imported through Report Builder reports.
6. Import them into the destination system. See "Importing Report Templates" in
the IBM Tealeaf cxView User Manual.
© Copyright IBM Corp. 1999, 2014
97
Export Template Steps
To export:
1. Go to the appropriate configuration page:
v To export a scorecard, select Configure > Scorecards in the Portal menu.
v To export a dashboard, select Configure > Dashboards in the Portal menu.
v To export a Report Builder report or Tealeaf report, select Configure >
Report Manager in the Portal menu.
2. Click theReport Templates category.
v For scorecards and dashboards, you must select the item to export.
3. Then, click Export Template.
v For Report Builder reports, the Report Select dialog is displayed. Select the
report or reports that you want to export.
4. Click Select.
5. Click Save. The report template is saved to your local system.
Note: Scorecard and report templates are exported in .tlt format, which is a
proprietary format of Tealeaf.
98
IBM Tealeaf cxView: cxView User Manual
Chapter 8. Importing Report Templates
Exported or downloaded report templates can be imported into your Tealeaf
system.
v Scorecards must be customized to meet individual requirements of the system
on which they are installed. After you import a scorecard, you can add, delete,
or modify the events that trigger them.
v During import, the event creation process attempts to use existing event
definitions on the destination system, including events that were previously
created as a part of the current import process.
– For scorecards and dashboards, regardless of how the original events were
used in the source template, if any of those events are exact duplicates except
for their names, the event on the destination system will be used whenever
event definitions between the source and destination systems are determined
to be exact matches.
– For Report Builder reports, the logic is improved to selectively import events.
For this reason, Tealeaf recommends exporting and importing Report Builder
reports first.
– Dependent objects in the report are displayed during the import process.
v Schedules cannot be exported and imported, as the scheduling information can
not be valid for the system to which it was imported.
Limitations
The following limitations apply to importing report templates:
1. If an item in a report, such as an event, dimension, or the report itself exists in
the destination system, it is used as-is and is not updated. This comparison is
based on internal identifiers, instead of display names.
2. The report import feature does not provide full support for any scorecards or
reports that reference specific dimension values.
3. You cannot remap events that are used by a report during the import process.
4. You cannot map a report template that is imported to an existing report in the
destination system. If five template imports reference a single report, they
reference the single instance that is created by the first template import.
Note: After you import a report template, you cannot re-import it to overwrite
the previous version. You must delete the report in the destination system
before you attempt to re-import it.
Import Template Steps
To import:
Note: The ability to import report templates is governed by the Default Allow
Report Template Import permission at the group level and the Allow Report
Template Import permission at the individual user level. See "CX User
Administration" in the IBM Tealeaf cxImpact Administration Manual.
1. Go to the report configuration page:
v To import a scorecard, select Configure > Scorecards in the Portal menu.
© Copyright IBM Corp. 1999, 2014
99
2.
3.
4.
5.
6.
7.
v To import a dashboard, select Configure > Dashboards in the Portal menu.
v To import a custom report, select Configure > Report Manager in the
Portal menu.
Click the Report Templates category.
Click Import Template.
Click Browse....
Go to your local environment to select the .tlt file to import. Then, click
Open.
To upload the template, click OK.
The Import Objects dialog is displayed:
Figure 35. Import Objects dialog
v You can expand the top-level node of any object to display its
dependencies. Dependent objects are also imported.
v To overwrite any objects in the destination system that share internal
identifier with objects that are imported, click the Overwrite Existing
Objects check box.
8. To import the uploaded template, click Import.
v To cancel the import, click Cancel.
9. If the import is successful, the following message is displayed:
The import was successful.
10. Click Close.
Note: If events are imported with your report template, it can take a few
minutes before they are available in the event manager.
The report is available for use in the appropriate screen of the destination system.
100
IBM Tealeaf cxView: cxView User Manual
Chapter 9. Enhancements to Top Movers for cxView
The Top Movers feature enables the tracking and reporting on deviations of values
that are monitored by Tealeaf. In IBM Tealeaf cxImpact, Top Movers can be created
and reported for event data on a daily basis.
v When an event is created, you can optionally create a top mover to track the
changes in values for the event. The top mover enables easier monitoring of
changes in key site metrics.
IBM Tealeaf cxView enhances the base Top Mover capabilities with the features
listed in the section.
Features
IBM Tealeaf cxView enhances Top Movers with the following features:
1. Hourly Top Movers: Licensees of IBM Tealeaf cxView can create top movers
that monitor deviations on an hourly basis. Hourly top movers enable the
tracking of changes in key metrics within the day. It detects and responds to
changes in visitor behavior and site performance that occur within a single day.
v Hourly top movers are specified in the top mover definition. For more
information about creating hourly top movers, see "TEM Top Movers Tab" in
the IBM Tealeaf Event Manager Manual.
v For more information about reporting hourly top movers, see "Analyzing Top
Movers" in the IBM Tealeaf Reporting Guide.
2. Dimension Top Movers: IBM Tealeaf cxView customers can optionally create
top movers to track changes in dimension values.
v For more information about creating dimension top movers, see "TEM Top
Movers Tab" in the IBM Tealeaf Event Manager Manual.
v For more information about reporting dimension top movers, see "Analyzing
Top Movers" in the IBM Tealeaf Reporting Guide.
3. Ratio Top Movers: IBM Tealeaf cxView customers can also track deviations in
values for ratios between events and dimensions.
v For more information about creating ratio top movers, see "TEM Top Movers
Tab" in the IBM Tealeaf Event Manager Manual.
v For more information about reporting ratio top movers, see "Analyzing Top
Movers" in the IBM Tealeaf Reporting Guide.
4. Alerts on Top Movers: IBM Tealeaf cxView users can create alerts that are based
on Top Movers or reports by using Top Movers.
v For more information about creating Top Mover alerts, see "TEM Alerts Tab"
in the IBM Tealeaf Event Manager Manual.
v For more information about creating alerts on Top Mover reports, see "TEM
Alerts Tab" in the IBM Tealeaf Event Manager Manual.
Creating Top Movers
For more information about creating top movers, see "TEM Top Movers Tab" in the
IBM Tealeaf Event Manager Manual.
© Copyright IBM Corp. 1999, 2014
101
Reporting on Top Movers
For more information about reporting for top movers, see "Analyzing Top Movers"
in the IBM Tealeaf Reporting Guide.
102
IBM Tealeaf cxView: cxView User Manual
Chapter 10. IBM Tealeaf documentation and help
IBM Tealeaf provides documentation and help for users, developers, and
administrators.
Viewing product documentation
All IBM Tealeaf product documentation is available at the following website:
https://tealeaf.support.ibmcloud.com/
Use the information in the following table to view the product documentation for
IBM Tealeaf:
Table 68. Getting help
To view...
Do this...
Product documentation
On the IBM Tealeaf portal, go to ? > Product
Documentation.
Help for a page on the IBM Tealeaf Portal
On the IBM Tealeaf portal, go to ? > Help
for This Page.
Help for IBM Tealeaf CX PCA
On the IBM Tealeaf CX PCA web interface,
select Guide to access the IBM Tealeaf CX
PCA Manual.
Available documents for IBM Tealeaf products
Use the following table to view a list of available documents for all IBM Tealeaf
products:
Table 69. Available documentation for IBM Tealeaf products
IBM Tealeaf products
Available documents
IBM Tealeaf CX
v IBM Tealeaf Customer Experience Overview
Guide
v IBM Tealeaf CX Client Framework Data
Integration Guide
v IBM Tealeaf CX Configuration Manual
v IBM Tealeaf CX Cookie Injector Manual
v IBM Tealeaf CX Databases Guide
v IBM Tealeaf CX Event Manager Manual
v IBM Tealeaf CX Glossary
v IBM Tealeaf CX Installation Manual
v IBM Tealeaf CX PCA Manual
v IBM Tealeaf CX PCA Release Notes
© Copyright IBM Corp. 1999, 2014
103
Table 69. Available documentation for IBM Tealeaf products (continued)
IBM Tealeaf products
Available documents
IBM Tealeaf CX
v IBM Tealeaf CX RealiTea Viewer Client Side
Capture Manual
v IBM Tealeaf CX RealiTea Viewer User
Manual
v IBM Tealeaf CX Release Notes
v IBM Tealeaf CX Release Upgrade Manual
v IBM Tealeaf CX Support Troubleshooting
FAQ
v IBM Tealeaf CX Troubleshooting Guide
v IBM Tealeaf CX UI Capture j2 Guide
v IBM Tealeaf CX UI Capture j2 Release Notes
IBM Tealeaf cxImpact
v IBM Tealeaf cxImpact Administration Manual
v IBM Tealeaf cxImpact User Manual
v IBM Tealeaf cxImpact Reporting Guide
IBM Tealeaf cxConnect
v IBM Tealeaf cxConnect for Data Analysis
Administration Manual
v IBM Tealeaf cxConnect for Voice of Customer
Administration Manual
v IBM Tealeaf cxConnect for Web Analytics
Administration Manual
IBM Tealeaf cxOverstat
IBM Tealeaf cxOverstat User Manual
IBM Tealeaf cxReveal
v IBM Tealeaf cxReveal Administration Manual
v IBM Tealeaf cxReveal API Guide
v IBM Tealeaf cxReveal User Manual
IBM Tealeaf cxVerify
IBM Tealeaf cxVerify Administration Manual
IBM Tealeaf cxView
IBM Tealeaf cxView User Manual
IBM Tealeaf CX Mobile
v IBM Tealeaf CX Mobile Android Logging
Framework Guide
v IBM Tealeaf Android Logging Framework
Release Notes
v IBM Tealeaf CX Mobile Administration
Manual
v IBM Tealeaf CX Mobile User Manual
v IBM Tealeaf CX Mobile iOS Logging
Framework Guide
v IBM Tealeaf iOS Logging Framework Release
Notes
104
IBM Tealeaf cxView: cxView User Manual
Notices
This information was developed for products and services offered in the U.S.A.
IBM® may not offer the products, services, or features discussed in this document
in other countries. Consult your local IBM representative for information on the
products and services currently available in your area. Any reference to an IBM
product, program, or service is not intended to state or imply that only that IBM
product, program, or service may be used. Any functionally equivalent product,
program, or service that does not infringe any IBM intellectual property right may
be used instead. However, it is the user's responsibility to evaluate and verify the
operation of any non-IBM product, program, or service.
IBM may have patents or pending patent applications covering subject matter
described in this document. The furnishing of this document does not grant you
any license to these patents. You can send license inquiries, in writing, to:
IBM Director of Licensing
IBM Corporation
North Castle Drive
Armonk, NY 10504-1785
U.S.A.
For license inquiries regarding double-byte (DBCS) information, contact the IBM
Intellectual Property Department in your country or send inquiries, in writing, to:
Intellectual Property Licensing
Legal and Intellectual Property Law
IBM Japan, Ltd.
19-21, Nihonbashi-Hakozakicho, Chuo-ku
Tokyo 103-8510, Japan
The following paragraph does not apply to the United Kingdom or any other
country where such provisions are inconsistent with local law: INTERNATIONAL
BUSINESS MACHINES CORPORATION PROVIDES THIS PUBLICATION "AS IS"
WITHOUT WARRANTY OF ANY KIND, EITHER EXPRESS OR IMPLIED,
INCLUDING, BUT NOT LIMITED TO, THE IMPLIED WARRANTIES OF
NON-INFRINGEMENT, MERCHANTABILITY OR FITNESS FOR A PARTICULAR
PURPOSE. Some states do not allow disclaimer of express or implied warranties in
certain transactions, therefore, this statement may not apply to you.
This information could include technical inaccuracies or typographical errors.
Changes are periodically made to the information herein; these changes will be
incorporated in new editions of the publication. IBM may make improvements
and/or changes in the product(s) and/or the program(s) described in this
publication at any time without notice.
Any references in this information to non-IBM Web sites are provided for
convenience only and do not in any manner serve as an endorsement of those Web
sites. The materials at those Web sites are not part of the materials for this IBM
product and use of those Web sites is at your own risk.
© Copyright IBM Corp. 1999, 2014
105
IBM may use or distribute any of the information you supply in any way it
believes appropriate without incurring any obligation to you.
Licensees of this program who wish to have information about it for the purpose
of enabling: (i) the exchange of information between independently created
programs and other programs (including this one) and (ii) the mutual use of the
information which has been exchanged, should contact:
IBM Bay Area Lab
1001 E Hillsdale Boulevard
Foster City, California 94404
U.S.A.
Such information may be available, subject to appropriate terms and conditions,
including in some cases, payment of a fee.
The licensed program described in this document and all licensed material
available for it are provided by IBM under terms of the IBM Customer Agreement,
IBM International Program License Agreement or any equivalent agreement
between us.
Any performance data contained herein was determined in a controlled
environment. Therefore, the results obtained in other operating environments may
vary significantly. Some measurements may have been made on development-level
systems and there is no guarantee that these measurements will be the same on
generally available systems. Furthermore, some measurements may have been
estimated through extrapolation. Actual results may vary. Users of this document
should verify the applicable data for their specific environment.
Information concerning non-IBM products was obtained from the suppliers of
those products, their published announcements or other publicly available sources.
IBM has not tested those products and cannot confirm the accuracy of
performance, compatibility or any other claims related to non-IBM products.
Questions on the capabilities of non-IBM products should be addressed to the
suppliers of those products.
All statements regarding IBM's future direction or intent are subject to change or
withdrawal without notice, and represent goals and objectives only.
This information contains examples of data and reports used in daily business
operations. To illustrate them as completely as possible, the examples include the
names of individuals, companies, brands, and products. All of these names are
fictitious and any similarity to the names and addresses used by an actual business
enterprise is entirely coincidental.
COPYRIGHT LICENSE:
This information contains sample application programs in source language, which
illustrate programming techniques on various operating platforms. You may copy,
modify, and distribute these sample programs in any form without payment to
IBM, for the purposes of developing, using, marketing or distributing application
programs conforming to the application programming interface for the operating
platform for which the sample programs are written. These examples have not
been thoroughly tested under all conditions. IBM, therefore, cannot guarantee or
imply reliability, serviceability, or function of these programs. The sample
106
IBM Tealeaf cxView: cxView User Manual
programs are provided "AS IS", without warranty of any kind. IBM shall not be
liable for any damages arising out of your use of the sample programs.
Trademarks
IBM, the IBM logo, and ibm.com® are trademarks or registered trademarks of
International Business Machines Corp., registered in many jurisdictions worldwide.
Other product and service names might be trademarks of IBM or other companies.
A current list of IBM trademarks is available on the Web at “Copyright and
trademark information” at www.ibm.com/legal/copytrade.shtml.
Privacy Policy Considerations
IBM Software products, including software as a service solutions, ("Software
Offerings") may use cookies or other technologies to collect product usage
information, to help improve the end user experience, to tailor interactions with
the end user or for other purposes. A cookie is a piece of data that a web site can
send to your browser, which may then be stored on your computer as a tag that
identifies your computer. In many cases, no personal information is collected by
these cookies. If a Software Offering you are using enables you to collect personal
information through cookies and similar technologies, we inform you about the
specifics below.
Depending upon the configurations deployed, this Software Offering may use
session and persistent cookies that collect each user's user name, and other
personal information for purposes of session management, enhanced user usability,
or other usage tracking or functional purposes. These cookies can be disabled, but
disabling them will also eliminate the functionality they enable.
Various jurisdictions regulate the collection of personal information through
cookies and similar technologies. If the configurations deployed for this Software
Offering provide you as customer the ability to collect personal information from
end users via cookies and other technologies, you should seek your own legal
advice about any laws applicable to such data collection, including any
requirements for providing notice and consent where appropriate.
IBM requires that Clients (1) provide a clear and conspicuous link to Customer's
website terms of use (e.g. privacy policy) which includes a link to IBM's and
Client's data collection and use practices, (2) notify that cookies and clear gifs/web
beacons are being placed on the visitor's computer by IBM on the Client's behalf
along with an explanation of the purpose of such technology, and (3) to the extent
required by law, obtain consent from website visitors prior to the placement of
cookies and clear gifs/web beacons placed by Client or IBM on Client's behalf on
website visitor's devices
For more information about the use of various technologies, including cookies, for
these purposes, See IBM's Online Privacy Statement at: http://www.ibm.com/
privacy/details/us/en section entitled "Cookies, Web Beacons and Other
Technologies."
Notices
107
108
IBM Tealeaf cxView: cxView User Manual
Printed in USA