1
SIPLUS CMS X-Tools - User Manual - 01 - Introduction
SIPLUS CMS
Preface
1
Scope of Delivery
2
Product Characteristics
3
Installation
4
Quick Reference
5
Tutorials
6
Reference Part - Overview
7
List of Abbreviations
8
Contact Information
9
SIPLUS CMS
SIPLUS CMS X-Tools
User Manual - 01 - Introduction
English
Release 2012-09
English
Release 2012-09
1 / 182
SIPLUS CMS X-Tools - User Manual - 01 - Introduction
SIPLUS CMS
Safety Guidelines
This document contains notices which you should observe to ensure your own personal safety as well as to avoid property damage. The
notices referring to your personal safety are highlighted in the manual by a safety alert symbol, notices referring to property damage only
have no safety alert symbol
Danger
Indicates an imminently hazardous situation which, if not avoided, will result in death or serious injury.
Warning
Indicates a potentially hazardous situation which, if not avoided, could result in death or serious injury.
Caution
Used with the safety alert symbol indicates a potentially hazardous situation which, if not avoided, may result in minor or moderate injury.
Notice
Used without the safety alert symbol indicates a potential situation which, if not avoided, may result in an undesirable result or
state.
When several danger levels apply, the notices of the highest level (lower number) are always displayed. If a notice refers to personal
damages with the safety alert symbol, then another notice may be added warning of property damage.
Qualified Personnel
The device/system may only be set up and operated in conjunction with this documentation. Only qualified personnel should be allowed to
install and work on the equipment. Qualified persons are defined as persons who are authorized to commission, to earth, and to tag circuits, equipment and systems in accordance with established safety practices and standards.
Intended Use
Please note the following:
Warning
This device and its components may only be used for the applications described in the catalog or technical description, and
only in connection with devices or components from other manufacturers approved or recommended by Siemens. This product can only function correctly and safely if it is transported, stored, set up and installed correctly, and operated and maintained as recommended.
Trademarks
All designations marked with ® are registered trademarks of Siemens AG. Other designations in this documentation might be trademarks
which, if used by third parties for their purposes, might infringe upon the rights of the proprietors.
Copyright Siemens AG 2012. All rights reserved.
Reproduction, transmission or use of this document or its contents is not permitted without express written authority. Offenders will be
liable for damages. All rights, including rights created by patent grant or registration of a utility model or design, are reserved.
Disclaimer of Liability
We have checked the contents of this document for agreement with the hardware and software described. Since deviations cannot be
precluded entirely, we cannot guarantee full agreement. However, the data in the manual are reviewed regularly, and any necessary corrections will be included in subsequent editions. Suggestions for improvement are welcomed.
Siemens AG
Industry Sector
P.O. Box 4848
90327 Nuremberg
Germany
English
Release 2012-09
Siemens AG 2012
Technical data subject to change
2 / 182
SIPLUS CMS X-Tools - User Manual - 01 - Introduction
SIPLUS CMS
Table of Contents
1
Preface ..............................................................................................................................................12
1.1
Purpose of this Document............................................................................................................12
1.2
Validity of this Document..............................................................................................................12
1.3
Audience ......................................................................................................................................12
1.4
Notations ......................................................................................................................................13
2
Scope of Delivery ..............................................................................................................................14
2.1
Scope of Delivery .........................................................................................................................14
2.2
Unpacking and Checking .............................................................................................................14
3
Product Characteristics .....................................................................................................................15
3.1
Introduction ..................................................................................................................................15
3.1.1
What is SIPLUS CMS? ...........................................................................................................15
3.1.2
Software Structure ..................................................................................................................15
3.1.2.1
General ..............................................................................................................................15
3.1.2.1.1
Executables ..................................................................................................................15
3.1.2.1.2
X-Tools Client ...............................................................................................................15
3.1.2.1.3
X-Tools Server..............................................................................................................16
3.1.2.1.4
X-Tools Tray .................................................................................................................16
3.1.2.1.5
X-Tools Service ............................................................................................................16
3.1.2.2
MDS Explorer - Master Data System Explorer ..................................................................16
3.1.2.3
MMS - Main Management System ....................................................................................16
3.1.2.4
DMS - Device Management System..................................................................................17
3.1.2.5
MTS - Monitoring System ..................................................................................................17
3.1.2.6
ANS - Analyzing System....................................................................................................17
3.1.2.7
STS - Storage System .......................................................................................................18
3.2
Hard- and Software Requirements ..............................................................................................19
3.2.1
Hardware.................................................................................................................................19
3.2.2
Software ..................................................................................................................................19
3.3
License Management...................................................................................................................20
3.4
Order Numbers ............................................................................................................................22
4
Installation .........................................................................................................................................23
4.1
Software Installation.....................................................................................................................23
4.1.1
Install X-Tools and the System Documentation......................................................................23
4.1.2
Create Shortcuts on the Desktop............................................................................................27
4.1.3
Migration from earlier Versions of X-Tools .............................................................................28
4.1.3.1
Overview ............................................................................................................................28
4.1.3.2
New IEEE1394 Driver in V 03.03.......................................................................................28
4.1.3.3
Update of Analyzing Models ..............................................................................................29
4.1.3.4
Update from V 03.01 SP1 or earlier to V 03.05 .................................................................29
4.1.3.4.1
4.1.3.5
English
Release 2012-09
Parallel Installation to the old Version ..........................................................................29
Update from V 03.02 or later to V 03.05 ............................................................................30
3 / 182
SIPLUS CMS X-Tools - User Manual - 01 - Introduction
SIPLUS CMS
4.1.3.5.1
Overwriting of the old Version ......................................................................................30
4.1.3.5.2
Parallel Installation to the old Version ..........................................................................30
4.2
Hardware Installation ...................................................................................................................31
4.2.1
How to connect SIPLUS CMS to your Application..................................................................31
4.2.2
Communication Interfaces ......................................................................................................31
4.2.3
How to connect IEEE1394 Devices to the PC ........................................................................32
4.2.4
How to connect Ethernet IONs to the PC ...............................................................................32
4.2.5
How to connect USB CTNs to the PC ....................................................................................33
4.2.6
How to connect OPC UA Servers to the PC...........................................................................33
4.2.7
How to connect OPC UA Clients to the PC ............................................................................33
4.2.8
Video Card Driver ...................................................................................................................34
4.2.9
Minimal Firmware Versions.....................................................................................................34
5
Quick Reference................................................................................................................................35
6
Tutorials.............................................................................................................................................36
6.1
General Description .....................................................................................................................36
6.2
X-Tools Basics .............................................................................................................................36
6.2.1
General Description ................................................................................................................36
6.2.2
Running X-Tools for the first Time ..........................................................................................36
6.2.3
X-Tools User Interface ............................................................................................................37
6.2.4
Available Data .........................................................................................................................39
6.2.5
Configuration Files ..................................................................................................................40
6.3
Client to Server Connectivity........................................................................................................41
6.3.1
General Description ................................................................................................................41
6.3.2
Creation of new Main Profiles .................................................................................................41
6.3.3
Opening of existing Main Profiles ...........................................................................................43
6.3.4
Starting and Stopping of Main Profiles ...................................................................................44
6.3.5
Securing of the X-Tools Server...............................................................................................44
6.3.6
X-Tools Server Connectivity Dialog ........................................................................................45
6.4
Global Configurations...................................................................................................................45
6.4.1
General Description ................................................................................................................45
6.4.2
The Global Options Editor.......................................................................................................46
6.4.3
The User Accounts Editor .......................................................................................................47
6.4.4
The System Log Viewer..........................................................................................................48
6.5
Configuration File Locations.........................................................................................................49
6.5.1
General Description ................................................................................................................49
6.5.2
Adding of a Configuration File Location..................................................................................49
6.5.3
Removing of a Configuration File Location.............................................................................50
6.6
Simulated Devices and Interface Profiles ....................................................................................50
6.6.1
General Description ................................................................................................................50
6.6.2
Creation of a new Interface Profile for the Simulation Interface .............................................51
6.6.3
Opening of existing Interface Profiles .....................................................................................52
6.6.4
Starting and Stopping of Interface Profiles .............................................................................54
English
Release 2012-09
4 / 182
SIPLUS CMS X-Tools - User Manual - 01 - Introduction
6.7
SIPLUS CMS
Device Configuration and Device Profiles....................................................................................55
6.7.1
General Description ................................................................................................................55
6.7.2
Creation of a new Device Profile for an ION AnalogInput T001 .............................................55
6.7.3
Opening of existing Device Profiles ........................................................................................58
6.7.4
Starting and Stopping of Device Profiles ................................................................................59
6.8
Visualization of Online Data and Monitoring Views .....................................................................60
6.8.1
General Description ................................................................................................................60
6.8.2
Creation of a new Monitoring View .........................................................................................60
6.8.3
Opening of existing Monitoring Views.....................................................................................63
6.8.4
Starting and Stopping of Monitoring Views.............................................................................64
6.9
Storage of online Data via Storage Profiles .................................................................................64
6.9.1
General Description ................................................................................................................64
6.9.2
Creation of a new Storage Profile for online Data ..................................................................64
6.9.3
Opening of existing Storage Profiles ......................................................................................66
6.9.4
Starting and Stopping of Storage Profiles...............................................................................68
6.10
Loading of Data and Loading Profiles..........................................................................................69
6.10.1
General Description ................................................................................................................69
6.10.2
Simple Loading of Offline Data ...............................................................................................69
6.10.3
Creation of a new Loading Profile...........................................................................................71
6.10.4
Opening of existing Loading Profiles ......................................................................................74
6.10.5
Starting and Stopping of Loading Profiles ..............................................................................75
6.10.6
Advanced Loading of Offline Data ..........................................................................................75
6.11
Offline File Locations....................................................................................................................78
6.11.1
General Description ................................................................................................................78
6.11.2
Adding of an Offline File Location ...........................................................................................78
6.11.3
Removing of an Offline File Location......................................................................................79
6.12
Visualization of offline Data..........................................................................................................79
6.12.1
General Description ................................................................................................................79
6.12.2
Visualization of offline Data.....................................................................................................80
6.13
Analyzing of Data via Analyzing Models ......................................................................................81
6.13.1
General Description ................................................................................................................81
6.13.2
Creation of a new Analyzing Model ........................................................................................81
6.13.3
Opening of existing Analyzing Models....................................................................................84
6.13.4
Starting and Stopping of Analyzing Models ............................................................................85
6.14
Analyzing of Data via Analyzing Scripts.......................................................................................87
6.14.1
General Description ................................................................................................................87
6.14.2
Creation of a new Analyzing Script.........................................................................................87
6.14.3
Opening of existing Analyzing Scripts ....................................................................................90
6.14.4
Starting and Stopping of Analyzing Scripts.............................................................................91
6.15
User Functions for the Encapsulation of Analysis Tasks.............................................................92
6.15.1
General Description ................................................................................................................92
6.15.2
Creation of a new User Function ............................................................................................92
English
Release 2012-09
5 / 182
SIPLUS CMS X-Tools - User Manual - 01 - Introduction
SIPLUS CMS
6.15.3
Opening of existing User Functions........................................................................................97
6.15.4
Using of User Functions within Analyzing Models ..................................................................99
6.15.5
Using of User Functions within Analyzing Scripts.................................................................101
6.15.6
Behavior of User Functions...................................................................................................103
6.15.7
Examples of User Functions .................................................................................................104
6.16
Storage of offline Data via Storage Profiles ...............................................................................105
6.16.1
General Description ..............................................................................................................105
6.16.2
Creation of a new Storage Profile for offline Data ................................................................105
6.17
3D Visualization .........................................................................................................................107
6.17.1
General Description ..............................................................................................................107
6.17.2
Visualization of Data in 3D....................................................................................................107
6.18
Safe Mode..................................................................................................................................109
6.18.1
General Description ..............................................................................................................109
6.18.2
Important Facts .....................................................................................................................109
6.18.3
Safe Mode.............................................................................................................................109
6.18.4
X-Tools Service.....................................................................................................................110
6.19
Sequence Control ......................................................................................................................110
6.19.1
General Description ..............................................................................................................110
6.19.2
Important Facts .....................................................................................................................110
6.19.3
Provided Analyzing Functions...............................................................................................111
6.19.4
Example ................................................................................................................................113
6.20
Opening of Monitoring Views via the Command Line................................................................116
6.20.1
General Description ..............................................................................................................116
6.20.2
Command Line Syntax..........................................................................................................116
6.21
Storing of Data Snapshots out of the Monitoring System ..........................................................117
6.21.1
General Description ..............................................................................................................117
6.21.2
Storing of Data Snapshots ....................................................................................................117
6.22
Receiving of Data from standard OPC UA Servers ...................................................................118
6.22.1
General Description ..............................................................................................................118
6.22.2
Connecting to an OPC UA Server ........................................................................................118
6.22.3
Configuring of the Data of interest ........................................................................................119
6.22.4
Using of the Data of interest .................................................................................................119
6.23
Providing of Data to standard OPC UA Clients..........................................................................120
6.23.1
General Description ..............................................................................................................120
6.23.2
Enabling of the built-in OPC UA Server................................................................................120
6.23.3
Using of the built-in OPC UA Server.....................................................................................121
6.24
Creation of Screenshots out of the Monitoring System .............................................................121
6.24.1
General Description ..............................................................................................................121
6.24.2
Printing of Screenshots.........................................................................................................121
6.24.3
Saving of Screenshots ..........................................................................................................122
6.25
6.25.1
English
Release 2012-09
Creation of Automatic Reports out of the Monitoring System....................................................122
General Description ..............................................................................................................122
6 / 182
SIPLUS CMS X-Tools - User Manual - 01 - Introduction
SIPLUS CMS
6.25.2
Important Facts .....................................................................................................................122
6.25.3
Creation of a Monitoring View for automatic Reports ...........................................................123
6.25.4
Trigger Examples..................................................................................................................124
6.25.5
Example Configuration Files .................................................................................................125
6.26
Creation of Reports of Analyzing Models...................................................................................126
6.26.1
General Description ..............................................................................................................126
6.26.2
Important Facts .....................................................................................................................127
6.26.3
Printing of a Report ...............................................................................................................127
6.26.4
Saving of a Report ................................................................................................................127
6.27
Fast Analysis via the MDS Explorer...........................................................................................128
6.27.1
General Description ..............................................................................................................128
6.27.2
Creation of a Location for Fast Analysis Scripts ...................................................................128
6.27.3
Creation of a new Fast Analysis Script .................................................................................128
6.27.4
Opening of existing Fast Analysis Scripts.............................................................................129
6.27.5
Using of Fast Analysis Scripts ..............................................................................................130
6.28
Supported CSV (*.csv) Format for Data.....................................................................................132
6.28.1
General Description ..............................................................................................................132
6.28.2
Exporting of Data to CSV Files .............................................................................................132
6.28.3
Importing of Data from CSV Files .........................................................................................132
6.28.4
CSV File Format for Data......................................................................................................133
6.29
File Associations ........................................................................................................................134
6.29.1
General Description ..............................................................................................................134
6.29.2
Important Facts .....................................................................................................................134
6.29.3
Opening of Files via the Explorer of Windows ......................................................................134
7
Attachment A – Best Practices........................................................................................................136
7.1
Inside Operating Systems ..........................................................................................................136
7.1.1
General .................................................................................................................................136
7.1.2
Microsoft Windows XP ..........................................................................................................136
7.1.3
Microsoft Windows Server 2003 ...........................................................................................136
7.1.4
Microsoft Windows 7.............................................................................................................137
7.2
Time Synchronization.................................................................................................................138
7.2.1
General .................................................................................................................................138
7.2.2
Setup a Windows XP Time Server .......................................................................................138
7.2.3
Setup a Windows XP Time Client.........................................................................................138
7.2.4
Setup of a Computer which is Time Client and Time Server simultaneously.......................139
7.2.5
Microsoft Hotfix 951531 ........................................................................................................140
7.3
Memory Optimizations ...............................................................................................................140
7.3.1
General .................................................................................................................................140
7.3.2
Default Ring Buffer Size........................................................................................................140
7.3.3
Allocation Size.......................................................................................................................142
7.3.4
Offline Data ...........................................................................................................................142
7.3.5
Dealing with very huge Amounts of Data..............................................................................142
English
Release 2012-09
7 / 182
SIPLUS CMS X-Tools - User Manual - 01 - Introduction
7.3.6
7.4
7.4.1
SIPLUS CMS
Memory Management ...........................................................................................................144
Measurement Tasks...................................................................................................................145
Frequency Analysis...............................................................................................................145
7.4.1.1
General ............................................................................................................................145
7.4.1.2
Analyzing Model...............................................................................................................145
7.4.1.3
Example ...........................................................................................................................146
7.4.2
Spectrum Monitoring.............................................................................................................147
7.4.2.1
General ............................................................................................................................147
7.4.2.2
Analyzing Model...............................................................................................................147
7.4.2.3
Example ...........................................................................................................................148
7.4.3
Order Analysis.......................................................................................................................150
7.4.3.1
General ............................................................................................................................150
7.4.3.2
Analyzing Model...............................................................................................................150
7.4.3.3
Example ...........................................................................................................................152
7.4.4
Sequence Control .................................................................................................................154
7.4.4.1
General ............................................................................................................................154
7.4.4.2
Example ...........................................................................................................................154
7.4.5
X/Y Envelopes.......................................................................................................................156
7.4.5.1
General ............................................................................................................................156
7.4.5.2
Creation of X/Y Envelopes...............................................................................................156
7.4.5.3
Visualization of X/Y Envelopes ........................................................................................158
7.4.5.4
Monitoring of X/Y Envelopes ...........................................................................................160
7.4.5.5
Example ...........................................................................................................................161
7.4.5.6
Summary..........................................................................................................................161
7.4.6
Spectrum Envelopes.............................................................................................................162
7.4.6.1
General ............................................................................................................................162
7.4.6.2
Creation of Spectrum Envelopes .....................................................................................162
7.4.6.3
Visualization of Spectrum Envelopes ..............................................................................164
7.4.6.4
Monitoring of Spectrum Envelopes..................................................................................164
7.4.6.5
Example ...........................................................................................................................165
7.4.6.6
Summary..........................................................................................................................166
7.4.7
Automatic loading of Data.....................................................................................................167
7.4.7.1
General ............................................................................................................................167
7.4.7.2
Basic loading of offline Data ............................................................................................167
7.4.7.3
Loading of offline Data Files from a certain Period of Time ............................................167
7.4.7.4
Loading with Loading Profiles and Loading Modes .........................................................168
7.4.7.5
Loading with Loading Profiles and Loading Times ..........................................................168
7.4.7.6
Loading of the last Minutes of the Data from a Storage Profile.......................................169
7.4.7.7
Loading of the last Files from a Storage Profile (once) ...................................................169
7.4.7.8
Loading of the last Files from a Storage Profile (automatically) ......................................170
7.4.7.9
Summary..........................................................................................................................170
7.4.8
English
Release 2012-09
Advanced parallel Storing .....................................................................................................171
8 / 182
SIPLUS CMS X-Tools - User Manual - 01 - Introduction
SIPLUS CMS
7.4.8.1
General ............................................................................................................................171
7.4.8.2
Plant Simulation ...............................................................................................................172
7.4.8.3
Storage Profile .................................................................................................................172
7.4.8.4
Summary..........................................................................................................................173
8
Reference Part - Overview..............................................................................................................174
8.1
X-Tools Client.............................................................................................................................174
8.1.1
Controls.................................................................................................................................174
8.1.1.1
Tables ..............................................................................................................................174
8.1.1.2
Trees................................................................................................................................176
8.1.1.3
Menu Bars........................................................................................................................177
8.2
X-Tools Server ...........................................................................................................................178
8.2.1
Overview ...............................................................................................................................178
8.2.2
Icon of the X-Tools Server ....................................................................................................178
8.2.3
Tool Tip .................................................................................................................................178
8.2.4
Context Menu........................................................................................................................178
8.2.5
X-Tools Server Status Dialog................................................................................................179
8.3
X-Tools Tray...............................................................................................................................179
8.3.1
Overview ...............................................................................................................................179
8.4
X-Tools Service..........................................................................................................................180
8.4.1
Overview ...............................................................................................................................180
8.4.2
Automatic Start of the X-Tools Server during the Startup of Windows.................................180
8.4.3
Monitoring of the X-Tools Server during its Runtime ............................................................180
8.4.4
Stopping of the X-Tools Service ...........................................................................................180
9
List of Abbreviations ........................................................................................................................181
10
Contact Information .........................................................................................................................182
English
Release 2012-09
9 / 182
SIPLUS CMS X-Tools - User Manual - 01 - Introduction
SIPLUS CMS
Table of Figures
Figure 1: Edition of the X-Tools Server within the MMS Explorer...................................................................... 21
Figure 2: Edition of the X-Tools Server within the System Log Viewer............................................................. 21
Figure 3: GUI of the Automation License Manager .............................................................................................. 22
Figure 4: Start-up Dialog of the Setup with the License Agreement .................................................................... 23
Figure 5: Installation Options ................................................................................................................................ 23
Figure 6: Advanced Installation Options............................................................................................................... 24
Figure 7: License Agreement of DirectX............................................................................................................... 24
Figure 8: Installation Progress of DirectX ............................................................................................................. 25
Figure 9: License Agreement of the .Net Framework 2.0..................................................................................... 25
Figure 10: Installation Progress of the .Net Framework 2.0 ................................................................................. 26
Figure 11: Installation Progress of the Automation License Manager.................................................................. 26
Figure 12: Installation progress of the X-Tools Client and X-Tools Server ....................................................... 27
Figure 13: Installation finished .............................................................................................................................. 27
Figure 14: Main Title Bar of the X-Tools Client ................................................................................................... 37
Figure 15: Main Menu Bar of the X-Tools Client................................................................................................. 37
Figure 16: Main Status Bar of the X-Tools Client................................................................................................ 38
Figure 17: Full Screen Button ............................................................................................................................... 38
Figure 18: Restore Button..................................................................................................................................... 38
Figure 19: Maximize Button .................................................................................................................................. 38
Figure 20: Close Button ........................................................................................................................................ 38
Figure 21: MPE Standard T001 with a new Main Profile..................................................................................... 42
Figure 22: MPE Standard T001 with an opened Main Profile ............................................................................. 43
Figure 23: X-Tools Server Connectivity dialog.................................................................................................. 45
Figure 24: IPE Simulation T001 with a new Interface Profile.............................................................................. 51
Figure 25: IPE Simulation T001 with an opened Interface Profile ...................................................................... 53
Figure 26: DPE ION AnalogInput T001 with a new Device Profile ..................................................................... 56
Figure 27: DPE ION AnalogInput T001 with an opened Device Profile.............................................................. 58
Figure 28: MVE Standard T001 with a new Monitoring View .............................................................................. 61
Figure 29: MVE Standard T001 with an opened Monitoring View....................................................................... 63
Figure 30: SPE Binary T001 with a new Storage Profile..................................................................................... 65
Figure 31: SPE Binary T001 with an opened Storage Profile ............................................................................. 67
Figure 32: ODL Standard T001 with some Offline Data Files ............................................................................. 70
Figure 33: Loading Progress Dialog................................................................................................................... 71
Figure 34: LPE Standard T001 with a new Loading Profile ................................................................................ 72
Figure 35: LPE Standard T001 with an opened Loading Profile ......................................................................... 74
Figure 36: ODL Standard T001 with some Offline Data Files ............................................................................. 76
Figure 37: AME Standard T001 with a new Analyzing Model ............................................................................. 82
Figure 38: AME Standard T001 with an opened Analyzing Model...................................................................... 84
Figure 39: ASE Standard T001 with a new Analyzing Script .............................................................................. 88
Figure 40: ASE Standard T001 with an opened Analyzing Script....................................................................... 90
English
Release 2012-09
10 / 182
SIPLUS CMS X-Tools - User Manual - 01 - Introduction
SIPLUS CMS
Figure 41: UFE Standard T001 with a new User Function.................................................................................. 94
Figure 42: UFE Standard T001 with the HelloW() Example ................................................................................ 96
Figure 43: UFE Standard T001 with the HelloW2() Example.............................................................................. 97
Figure 44: UFE Standard T001 with an opened User Function .......................................................................... 98
Figure 45: AME Standard T001 with the HelloW() User Function....................................................................... 99
Figure 46: AME Standard T001 with the HelloW2() User Function................................................................... 100
Figure 47: ASE Standard T001 with the HelloW() User Function ..................................................................... 101
Figure 48: ASE Standard T001 with the HelloW2() User Function ................................................................... 102
Figure 49: SPE Binary T001 with a new Storage Profile................................................................................... 106
Figure 50: MVE Standard T001 with a 3D Visualization ................................................................................... 108
Figure 51: Example Use Case for the Sequence Control .................................................................................. 110
Figure 52: Example for an Automatic Report ..................................................................................................... 126
Figure 53: ASE Standard T001 with an opened Fast Analysis Script ............................................................... 130
Figure 54: Example of an Analyzing Model for a Frequency Analysis ............................................................... 145
Figure 55: Example of the Input Signal for the Frequency Analysis................................................................... 146
Figure 56: Example of a Frequency Spectrum which has been calculated by the Frequency Analysis ............ 146
Figure 57: Example of an Analyzing Model which monitors a Frequency Spectrum ......................................... 147
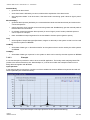
Figure 58: Example of the Input Spectrum for the Spectrum Monitoring ........................................................... 148
Figure 59: Example of the Input Spectrum with Alarm Spectra.......................................................................... 149
Figure 60: Example of an Alarm Log Entry......................................................................................................... 149
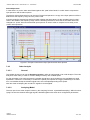
Figure 61: Example of the derived Input Spectrum with Alarm Spectra............................................................. 150
Figure 62: Example of an Analyzing Model for the Order Analysis .................................................................... 151
Figure 63: Example of the Input Signals for the Order Analysis......................................................................... 152
Figure 64: Example of a Frequency Spectrum and of an Order Spectrum ........................................................ 153
Figure 65: Example of the Input Data for an X/Y Envelope................................................................................ 156
Figure 66: Example of the Input Data for an X/Y Envelope together with the calculated Envelopes................. 159
Figure 67: Example of an Analyzing Model for the monitoring of the current x and y online Data .................... 160
Figure 68: Example of an Analyzing Script for the monitoring of the current x and y online Data ..................... 160
Figure 69: Example of the Output of MonitorXYEnvelope() ............................................................................... 161
Figure 70: Example of the Input Data for a Spectrum Envelope ........................................................................ 162
Figure 71: Example of an Analyzing Model for the Creation of Spectrum Envelopes........................................ 163
Figure 72: Example of the Input Data for a Spectrum Envelope together with the calculated Envelopes ......... 164
Figure 73: Example of an Analyzing Model for the monitoring of the current online Spectrum ......................... 164
Figure 74: Example of an Analyzing Script for the monitoring of the current online Spectrum .......................... 165
Figure 75: Example of the Output of MonitorSpectrumEnvelope()..................................................................... 165
Figure 76: Example of the Plant Simulation for the advanced parallel storing................................................... 172
Figure 77: Example of a Tool Tip of the X-Tools Server ................................................................................... 178
Figure 78: X-Tools Server Status Dialog.......................................................................................................... 179
English
Release 2012-09
11 / 182
SIPLUS CMS X-Tools - User Manual - 01 - Introduction
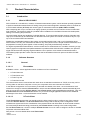
1
SIPLUS CMS
Preface
1.1
Purpose of this Document
This document provides an introduction about the functionalities and usage of the software
• SIPLUS CMS X-Tools
of the SIPLUS CMS product line.
In addition to the introduction which is found within this document and which provides an overview about the
available functionality, the following documentation is available:
• SIPLUS CMS X-Tools - User Manual - 02 - Master Data System
o provides detailed information about the functionality which is provided by the Master Data System
• SIPLUS CMS X-Tools - User Manual - 03 - Main Management System
o provides detailed information about the functionality which is provided by the Main Management System
• SIPLUS CMS X-Tools - User Manual - 04 - Device Management System
o provides detailed information about the functionality which is provided by the Device Management
System
• SIPLUS CMS X-Tools - User Manual - 05 - Monitoring System
o provides detailed information about the functionality which is provided by the Monitoring System
• SIPLUS CMS X-Tools - User Manual - 06 - Analyzing System
o provides detailed information about the functionality which is provided by the Analyzing System
• SIPLUS CMS X-Tools - User Manual - 07 - Storage System
o provides detailed information about the functionality which is provided by the Storage System
• SIPLUS CMS X-Tools - Release Notes
o provides additional information about the released version of SIPLUS CMS X-Tools
• SIPLUS CMS X-Tools - Change Log
o provides an overview about the changes which have been introduced with the current version of
SIPLUS CMS X-Tools
1.2
Validity of this Document
This document is valid for the following software:
• SIPLUS CMS X-Tools Demo V 03.05
• SIPLUS CMS X-Tools Standard V 03.05
• SIPLUS CMS X-Tools Professional V 03.05
During the following pages, these software packages will be referred to by the term X-Tools.
1.3
Audience
This document is intended for personnel involved in the commissioning and using of the software:
• X-Tools
English
Release 2012-09
12 / 182
SIPLUS CMS X-Tools - User Manual - 01 - Introduction
1.4
SIPLUS CMS
Notations
The following notations are used within this document:
• bold, italic text is being used for the main executables of X-Tools
o examples: X-Tools Client, X-Tools Server
• bold text is being used for the software modules of X-Tools
o examples: Main Management System, Device Profile Editor, IPE Socket T001
• green text is being used for controls like tables and trees
o examples: Main Profile Settings table, Device Profile Data table
• orange text is being used for simple controls like a menu button, a single row/column/cell of a table or a
branch of a tree
o examples: Open… menu button, IP Address column, Target Device Name cell, Interfaces Branch
• dark yellow text is being used for the entries of context menus
o examples: Advanced Append…, Edit
• Camel Notation is being used for major terms of X-Tools
o examples: Main Profile, Interface Profile, User Accounts File, Analyzing Function
• < and > brackets are being used for keyboard keys
o examples: <Ctrl>, <Alt>, <Shift>, <Del>
• [ and ] brackets are being used for mouse operations
o examples: [left mouse button down], [mouse move]
English
Release 2012-09
13 / 182
SIPLUS CMS X-Tools - User Manual - 01 - Introduction
2
SIPLUS CMS
Scope of Delivery
2.1
Scope of Delivery
What is shipped?
• CD
Setup
SIPLUS CMS X-Tools - Software & Documentation
• Certificate of License
• USB Stick which contains the license information
2.2
Unpacking and Checking
After unpacking, please check
• the packet for completeness and
• all parts for transport damage.
Notice
Do not use any parts that show evidence of damage!
English
Release 2012-09
14 / 182
SIPLUS CMS X-Tools - User Manual - 01 - Introduction
3
SIPLUS CMS
Product Characteristics
3.1
3.1.1
Introduction
What is SIPLUS CMS?
SIPLUS CMS is a cost-effective, modular, PC-based measurement system, which has been specially optimized
to perform reactionless measurement of analog, binary and numerical signals in industrial plants. It consists out
of a PC-based software (X-Tools) and various types of measurement devices (IONs, IFNs and CTNs)
With a sampling rate of up to 192 kHz, even highly dynamic processes and occurrences can be recorded with
high resolution. The system is used as a portable and/or installed unit in the fields of research & development,
testing, error tracking and production.
Input and output signals are handled by individual devices. To accommodate a higher number of signals, basically up to 62 devices can be networked over the IEEE1394 bus system and can be connected to any PC, laptop or server with an IEEE1394 interface.
Despite the considerable features of the system, an experienced technician, with no prior knowledge about
SIPLUS CMS, can carry out measurements within a very short period of time. Simple measurement tasks, such
as paperless recording of plant signals or fault recording, are quickly and effectively carried out.
For higher sophisticated measurements, such as remote service & maintenance or condition monitoring, a high
level of graphical configuration and parameterization is possible within SIPLUS CMS. In addition, the powerful
trigger machine and the analyzing engine enable the user to perform more extensive measurement tasks.
The following topics provide a short overview about the functionalities of the main parts of the SIPLUS CMS
software.
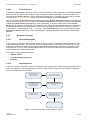
3.1.2
3.1.2.1
Software Structure
General
3.1.2.1.1
Executables
X-Tools is a client - server application which consists out of four executables:
• X-Tools Client.exe
• X-Tools Server.exe
• X-Tools Tray.exe
• X-Tools Service.exe
The client and the server communicate with each other via standard mechanisms of TCP/IP, thus they can be
running either on the same computer or on any two computers which are connected via TCP/IP.
In the default configuration it is not necessary to deal with the details of the client - server architecture at all.
Instead it is enough to start the X-Tools Client, in which case the X-Tools Server is started automatically and
also the connection from the X-Tools Client to the X-Tools Server is being established automatically. Thus, the
X-Tools Client and the X-Tools Server behave very much like a single application whenever the additional
advantages of the client - server architecture are not needed.
3.1.2.1.2
X-Tools Client
The X-Tools Client provides the user interface which is being used in order to configure any of the currently
connected X-Tools Servers. The X-Tools Client itself is being used exclusively for the configuration of the
measurement system and for the visualization of the present online and offline data. All of the actual measurement and analysis tasks are being processed by the X-Tools Server according to the made configuration.
Each X-Tools Client can connect to multiple X-Tools Servers at once in order to configure it and/or to visualize
its present online and offline data.
See point 8.1 for more details about the X-Tools Client.
English
Release 2012-09
15 / 182
SIPLUS CMS X-Tools - User Manual - 01 - Introduction
3.1.2.1.3
SIPLUS CMS
X-Tools Server
The X-Tools Server does not provide any user interface and is fully configured via one or more of the currently
connected X-Tools Clients. In case there is not any X-Tools Client attached to the X-Tools Server at the moment, it still continues to perform all of its measurement, analysis and storage tasks.
Depending to the edition of the X-Tools Server (Demo, Standard or Professional), up to 16 clients can be connected simultaneously and access the Configuration Files of the X-Tools Server as well as its available online
and offline data. See point 3.3 for a detailed overview about the different capabilities of the available editions of
the X-Tools Server.
See point 8.2 for more details about the X-Tools Server.
3.1.2.1.4
X-Tools Tray
The X-Tools Tray provides the tray icon which shows basic information about the X-Tools Server. It allows to
acces this basic information from multiple Windows sessions simultaneously.
See point 8.3 for more details about the X-Tools Tray.
3.1.2.1.5
X-Tools Service
The X-Tools Service is not being accessed directly. Its task is to monitor the X-Tools Server during its operation in order to provide the mechanisms of the Safe Mode (see point 6.18) and to start the X-Tools Server in
case it is configured to be started before a user logs in to Windows.
See point 8.4 for more details about the X-Tools Service.
3.1.2.2
MDS Explorer - Master Data System Explorer
• Provides information about all of the currently available data:
o Online Data
o Offline Data
• The MDS Explorer (short name MDX) is the source of all data based operations. In case any data shall
be used within another module of X-Tools (DMS, MTS, ANS, STS or any of their sub modules), the desired data can be dragged into this module from the MDX.
3.1.2.3
MMS - Main Management System
• Management of the connections to X-Tools Servers via Main Profiles
• Configuration of the Global Options of the X-Tools Client via the Global Options Editor
• Viewing of the System Log of the X-Tools Client via the System Log Viewer
• Configuration of the Global Options of any connected X-Tools Server via the Global Options Editor
• Viewing of the System Log of any connected X-Tools Server via the System Log Viewer
• Configuration of the User Accounts of any connected X-Tools Server via the User Accounts Editor
• Viewing of the currently available items via the Main Management System Explorer:
o available Main Profile Editors
o available Main Profile Files
o connected X-Tools Servers
English
Release 2012-09
16 / 182
SIPLUS CMS X-Tools - User Manual - 01 - Introduction
3.1.2.4
SIPLUS CMS
DMS - Device Management System
• Management of the connections to devices (IONs, IFNs and CTNs) via Interface Profiles
• Configuration of the measurement tasks of each device via Device Profiles
• Viewing of the currently available items via the Device Management System Explorer:
o available Interface Profile Editors
o available Device Profile Editors
o connected X-Tools Servers
for each connected X-Tools Server, the following information is available:
available Interface Profile Files
available Device Profile Files
available Device Setup Files
available interfaces
connected devices
available device specific plug-ins (Device Process Modules)
3.1.2.5
MTS - Monitoring System
• Visualization of online and offline data via Monitoring Views and Monitoring Charts
• Viewing of the currently available items via the Monitoring System Explorer:
o available Monitoring Charts
o available Monitoring Views
o connected X-Tools Servers
for each connected X-Tools Server, the following information is available:
available Monitoring View Files
available visualization specific plug-ins (Monitoring Process Modules)
3.1.2.6
ANS - Analyzing System
• Graphical configuration of analysis tasks for online and offline data calculations via Analyzing Models
• Textual configuration of analysis tasks for online and offline data calculations via Analyzing Scripts
• Encapsulation of analysis tasks for online and offline data calculations via User Functions
• Viewing of the currently available items via the Analyzing System Explorer:
o available Analyzing Model Editors
o available Analyzing Script Editors
o available User Function Editors
o connected X-Tools Servers
for each connected X-Tools Server, the following information is available:
available Analyzing Model Files
available Analyzing Script Files
available User Function Files
available Analyzing Functions
available User Functions
English
Release 2012-09
17 / 182
SIPLUS CMS X-Tools - User Manual - 01 - Introduction
3.1.2.7
SIPLUS CMS
STS - Storage System
• Configuration of storage tasks via Storage Profiles
• Configuration of loading tasks via Loading Profiles
• Loading of offline data via Offline Data Loaders
• Viewing of the currently available items via the Storage System Explorer:
o available Storage Profile Editors
o available Loading Profile Editors
o available Offline Data Loaders
o connected X-Tools Servers
for each connected X-Tools Server, the following information is available:
available Storage Profile Files
available Loading Profile Files
available storage format specific plug-ins (Storage Process Modules)
English
Release 2012-09
18 / 182
SIPLUS CMS X-Tools - User Manual - 01 - Introduction
3.2
SIPLUS CMS
Hard- and Software Requirements
3.2.1
Hardware
• PC with Windows XP Professional 32-Bit Service Pack 3 or
• PC with Windows XP Embedded 32-Bit Service Pack 2 or higher or
• PC with Windows Server 2003 R2 Enterprise Edition 32-Bit Service Pack 2 or
• PC with Windows 7 Professional 32-Bit Service Pack 1
o Microsoft Hotfix 958347 installed (Windows XP only - see release notes for details)
o Microsoft Hotfix 951531 installed (Windows XP and Windows Server 2003 - only in case the Windows
time service is being used - see point 0 for details)
o CPU with ≥ 1,2 GHz or multi core CPU
o working memory ≥ 512 MByte (2 GByte recommended)
o OpenGL and/or DirectX enabled graphic controller (from 1024x768 Pixels, 1280x1024 Pixels or more
recommended)
o IEEE1394, Ethernet and USB interfaces
• power supply units and connecting cables (depending on the used SIPLUS CMS components)
3.2.2
Software
• SIPLUS CMS X-Tools (arbitrary edition)
Note
The usage of resource-intensive applications (e.g. remote-, backup- and/or anti-virus-software, compiler, …)
simultaneously to X-Tools can cause that there are not enough system resources (working memory, CPU time,
graphics power, disk throughput, network throughput, …) available for the execution of X-Tools. As tasks like
the acquiring of measurement values can be noticeable affected by low available system resources, the available system resources must not be claimed entirely by other applications during the execution of X-Tools.
The exact amount of resources (working memory, CPU time, graphics power, disk throughput, network throughput, …), which are being needed by X-Tools is dependent to the amount of attached devices and to the amount
and size of the configured tasks. The more data is to be acquired by X-Tools simultaneously and the more
other tasks (analysis, storing, visualization, …) are to be performed in parallel, the more resources must be provided by the computer which is running X-Tools. In case of system overload, proper system behavior can not
be ensured.
Note
In case the X-Tools Client and the X-Tools Server are running at different computers, it is recommended to
synchronize the system clocks of the used computers. As X-Tools does not use an internal mechanism for the
time synchronization between X-Tools Client and X-Tools Server, the visualization of data at the X-Tools Client may be shifted to the past or to the future in case its system time is not synchronized to the X-Tools Server
that provides the visualized data.
The used method for the time synchronization must ensure that the system time of the synchronized computers
does not produce noticeable jumps into the past or into the future. See point 7.2 for general information about
how to time synchronization mechanisms which are built-in to Windows.
English
Release 2012-09
19 / 182
SIPLUS CMS X-Tools - User Manual - 01 - Introduction
SIPLUS CMS
Note
In case the X-Tools Client and the X-Tools Server are running at different computers, the used connection
must provide a throughput of at least 64 kBit/s and a latency of less than two seconds.
Weaker connections can cause errors during the connecting process and during operations like opening of Configuration Files, closing of Configuration Files and visualization of data.
For fluent handling of big files and lots of visualizations, a throughput of above 512 kBit/s and a latency of less
than one second are recommended.
Note
Various system configurations have been tested on SIMATIC RACK PCs and SIMATIC MICROBOX PCs. Other
standard PC configurations also have been tested successfully, but proper system behavior only can be ensured on SIMATIC platforms.
At the moment of the release of V 03.05 of X-Tools, only the C-series of SIMATIC PCs was released for Microsoft Windows 7. Therefore, proper system behavior of all other series of SIMATIC PCs together with Microsoft
Windows 7 can not be ensured.
Note
The Configuration Files and historical data of X-Tools versions before V 03.00 can not be used by X-Tools V
03.05 directly. Detailed information about how to migrate from earlier versions is obtained from your local Siemens office and from the homepage http://www.siemens.com/siplus-cms.
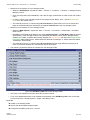
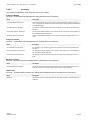
3.3
License Management
There are three editions of the X-Tools Server available: Demo, Standard and Professional. The main functionalities of these editions are:
Edition
Maximal Clients Remarks
SIPLUS CMS X-Tools Professional
16
basic and advanced Analyzing Functions
SIPLUS CMS X-Tools Standard
1
only basic Analyzing Functions
SIPLUS CMS X-Tools Demo
1
only basic Analyzing Functions
the demo edition can not connect to real
(IEEE1394, serial port or socket) devices, thus
it is not possible to acquire real measurement
data
The reference of Analyzing Functions describes the functionality of each Analyzing Function in detail and points
out whether it is a basic or an advanced Analyzing Function.
During its startup, the X-Tools Server checks the present license keys and starts up accordingly as Demo,
Standard or Professional edition.
The following table shows which license keys are required for the different editions of the X-Tools Server:
X-Tools Edition
Needed license Keys
SIPLUS CMS X-Tools Demo
(no license needed)
SIPLUS CMS X-Tools Standard
X-Tools Standard
SIPLUS CMS X-Tools Professional
X-Tools Standard
X-Tools Multi Client
X-Tools Advanced Analysis
English
Release 2012-09
20 / 182
SIPLUS CMS X-Tools - User Manual - 01 - Introduction
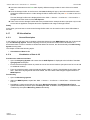
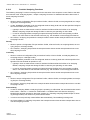
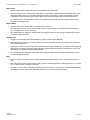
SIPLUS CMS
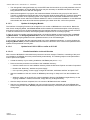
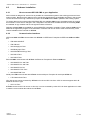
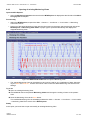
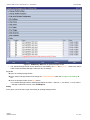
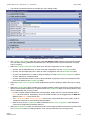
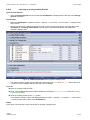
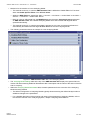
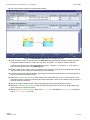
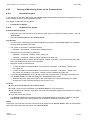
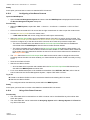
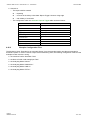
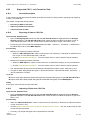
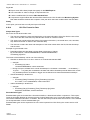
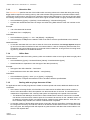
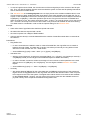
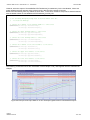
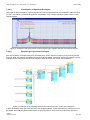
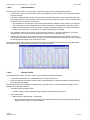
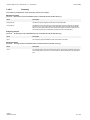
The current edition of the X-Tools Server can be seen within the MMS Explorer below “MMS Explorer -> Servers -> YourServer -> Info” and within the System Log Viewer.
Figure 1: Edition of the X-Tools Server within the MMS Explorer
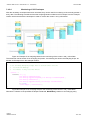
Figure 2: Edition of the X-Tools Server within the System Log Viewer
An additional license is needed for using of software I/O-Nodes which are able to access various SIMATIC or
SIMOTION devices. Whenever the Device Profile of a software I/O-Node is to be started by the X-Tools
Server, another according license must be available. The license for software I/O-Nodes is leased at the start of
the Device Profile and released at its stop again. In case the necessary license is not available, the according
Device Profile can not start and suspends.
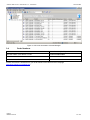
The following table shows which license keys are required for the different software I/O-Nodes:
Software I/O-node
Needed license Keys
SIPLUS CMS4000 ION SIMATIC S7 PN
ION SIMATIC S7 PN
SIPLUS CMS4000 ION SIMATIC S7-300 T001
ION SIMATIC S7-300
SIPLUS CMS4000 ION SIMATIC S7-400 T001
ION SIMATIC S7-400
SIPLUS CMS4000 ION SIMOTION T001
ION SIMOTION
SIPLUS CMS4000 ION SIMATIC TDC T001
ION SIMATIC TDC
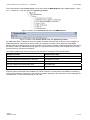
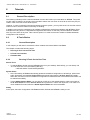
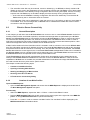
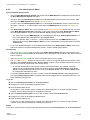
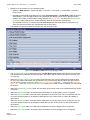
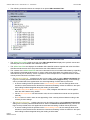
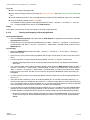
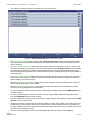
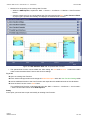
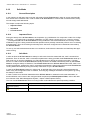
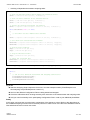
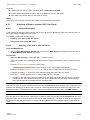
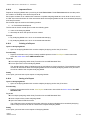
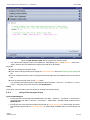
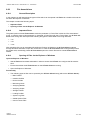
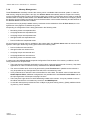
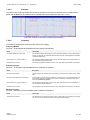
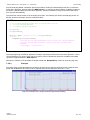
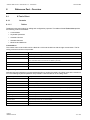
The whole license key management is handled by the software “Automation License Manager”. It is a standard
Siemens product and needs to be installed on the local computer. It contains the functionalities of transferring,
saving and checking the license keys. For further information regarding to the Automation License Manager the
included HTML or context-sensitive help can be used.
English
Release 2012-09
21 / 182
SIPLUS CMS X-Tools - User Manual - 01 - Introduction
SIPLUS CMS
Figure 3: GUI of the Automation License Manager
3.4
Order Numbers
Article
Order Number (MLFB)
SIPLUS CMS X-Tools Demo V 03.05
6AT8000-0AB00-0BA0
SIPLUS CMS X-Tools Standard V 03.05
6AT8000-0AB00-1BA0
SIPLUS CMS X-Tools Professional V 03.05
6AT8000-0AB00-2BA0
Further information is obtained from your local Siemens office and from the homepage
http://www.siemens.com/siplus-cms.
English
Release 2012-09
22 / 182
SIPLUS CMS X-Tools - User Manual - 01 - Introduction
4
SIPLUS CMS
Installation
4.1
4.1.1
Software Installation
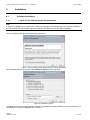
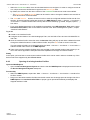
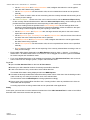
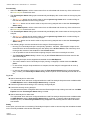
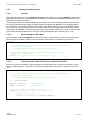
Install X-Tools and the System Documentation
Note
In order to run Setup and to install all of the necessary packages, administrator rights are required. Therefore it
must be ensured that administrator rights are granted to the Windows user who starts the Setup.
Start the Setup from the installation media: “Setup.exe”
First it is needed to read and accept the license agreement.
Figure 4: Start-up Dialog of the Setup with the License Agreement
After accepting the license agreement the Installation Options will be displayed.
Figure 5: Installation Options
The Setup checks if the required software modules for X-Tools are already installed on the local computer. If a
requirement is missing the Setup will offer to install it.
English
Release 2012-09
23 / 182
SIPLUS CMS X-Tools - User Manual - 01 - Introduction
SIPLUS CMS
Missing requirements could be:
• Siemens Automation License Manager
• Microsoft Visual C++ Redistributables
• Microsoft DirectX
• Microsoft .NET Framework 2.0
Choosing X-Tools Client and/or X-Tools Server will copy the selected X-Tools components to the specified
Target Path.
With enabling the Advanced Installation Options it is possible to specify which plug-ins shall be installed.
Figure 6: Advanced Installation Options
After leaving the Installation Options the process of installation starts.
While installing the missing requirements follow the instructions of the specific installation routine in order to
ensure that every requirement is installed correctly.
Figure 7: License Agreement of DirectX
English
Release 2012-09
24 / 182
SIPLUS CMS X-Tools - User Manual - 01 - Introduction
SIPLUS CMS
Figure 8: Installation Progress of DirectX
Figure 9: License Agreement of the .Net Framework 2.0
English
Release 2012-09
25 / 182
SIPLUS CMS X-Tools - User Manual - 01 - Introduction
SIPLUS CMS
Figure 10: Installation Progress of the .Net Framework 2.0
Figure 11: Installation Progress of the Automation License Manager
English
Release 2012-09
26 / 182
SIPLUS CMS X-Tools - User Manual - 01 - Introduction
SIPLUS CMS
Figure 12: Installation progress of the X-Tools Client and X-Tools Server
After all components have been installed successfully the following message box appears.
Figure 13: Installation finished
The installation of X-Tools also can be performed without the Setup by a manual copy of the “Client” and/or
“Server” directories from the installation media to the target directory. In this case, the other software components like redistributable files or license manager must be installed manually.
4.1.2
Create Shortcuts on the Desktop
The Setup creates a shortcut to the X-Tools Client at the desktop automatically. The following paths can be
used in order to create additional shortcuts manually:
• Open the Windows Explorer.
• Drag the following file from your installation directory with the left mouse button to the desktop while keeping the <Alt> button pressed:
..\SIPLUS CMS\X-Tools\Client\System\Bin\X-Tools Client.exe
• Drag the following file from your installation directory with the left mouse button to the desktop while keeping the <Alt> button pressed:
..\SIPLUS CMS\Documents\SIPLUS CMS X-Tools - User Manual - 01 - Introduction.EN.pdf
English
Release 2012-09
27 / 182
SIPLUS CMS X-Tools - User Manual - 01 - Introduction
4.1.3
SIPLUS CMS
Migration from earlier Versions of X-Tools
4.1.3.1
Overview
In general, multiple versions of X-Tools can be installed simultaneously at the same computer when each version is put into another directory. However, it is not possible to have two instances of the X-Tools Server running at the same time.
Via the concept of locations for Configuration Files, multiple versions of X-Tools can use the same Configuration Files so that all changes within one version also become available to the other installed versions. See point
6.5 for further information about locations for Configuration Files.
It must be considered that file compatibility is provided only from earlier to newer versions of X-Tools. Therefore, newer versions of X-Tools are able to read the files which have been saved by earlier versions, but earlier
versions of X-Tools may not be able to read the files which were saved by newer version.
Before the installation of a newer version of X-Tools is being started it must be decided whether the previous
installation shall be kept or not. The following chapters provide the steps for both kinds of installation, with and
without keeping of the previous version.
Independently to this decision, it is recommended to create a backup copy of all relevant files (X-Tools installation folder plus eventually present locations outside the installation directory) before the installation of the new
version.
In order to restore the backup of the previous version, empty the installation directory first and copy your backup
files into it afterwards. In case there were locations outside the installation directory, empty their directories also
and copy the files from your backup afterwards. Emptying of the target directories is important in order to be
sure that no files from temporary installations or from any other operations are left and to be sure that the original state of the installation is restored.
4.1.3.2
New IEEE1394 Driver in V 03.03
Together with X-Tools V 03.03, a new version of the IEEE1394 driver is being delivered. X-Tools V 03.03 is not
compatible with the IEEE1394 driver of previous versions, therefore the new IEEE1394 driver must be installed
for all IEEE1394 devices which shall be used together with V 03.03 of X-Tools. The following steps must be
performed in order to upgrad the driver of all SIPLUS CMS IEEE1394 devices:
• Close X-Tools.
• Execute “Driver Config (Upgrade).bat” from your “..\Drivers\IEEE1394” directory and wait until the upcoming command window outputs that the upgrade has been completed.
• After the upgrade has finished with success, all SIPLUS CMS IEEE1394 devices will appear below the
“PionsysDev” group within the Device Manager of windows.
• The upgrade is being performed only for the IEEE1394 devices which are currently attached to the PC. A
manual installation of the new IEEE1394 driver may be necessary for all IEEE1394 devices which are being attached to the PC after the upgrade.
• While the upgrade is in progress, the hardware assistant of Windows may pop up for each device. Typically, it disappears automatically after a few moments while the upgrade is in progress. Depending to the
configuration of the operating system it can happen that the automatic installation of the device driver
must be chosen within the hardware assistant in order to continue the installation.
Once the new IEEE1394 driver has been installed for a device, the device can not be used with versions of XTools before V 03.03 any more. In order to use the device with versions of X-Tools before V 03.03 again, the
device driver must be set back to the old driver. The following steps must be performed in order to downgrade
the IEEE1394 driver of all SIPLUS CMS IEEE1394 devices:
• Close X-Tools.
• Execute “Driver Config (Downgrade).bat” from your “..\Drivers\IEEE1394” directory and wait until the upcoming command window outputs that the downgrade has been completed.
• After the downgrade has finished with success, all SIPLUS CMS IEEE1394 devices will appear below the
“SIPLUS CMS” group within the Device Manager of windows.
English
Release 2012-09
28 / 182
SIPLUS CMS X-Tools - User Manual - 01 - Introduction
SIPLUS CMS
• The downgrade is being performed only for the IEEE1394 devices which are currently attached to the PC.
A manual installation of the old IEEE1394 driver may be necessary for all IEEE1394 devices which are
being attached to the PC after the downgrade.
• While the downgrade is in progress, the hardware assistant of Windows may pop up for each device.
Typically, it disappears automatically after a few moments while the downgrade is in progress. Depending
to the configuration of the operating system it can happen that the automatic installation of the device
driver must be chosen within the hardware assistant in order to continue the installation. In case Windows
asks whether the newer driver file shall be replaced by the older driver file, confirm this operation.
4.1.3.3
Update of Analyzing Models
The interface of Analyzing Functions can change from one version of X-Tools to the next version. Before the
start of each Analyzing Model, the X-Tools Server verifies whether the interface description of the (Analyzing
and User) functions from the Analyzing Model match the interface definitions of the currently present functions.
In case the interfaces do not match, the Analyzing Model suspends with an according log entry.
In order to receive a runnable Analyzing Model again, the Analyzing Model must be opened within an Analyzing Model Editor. The Analyzing Model Editor is able to automatically update the Analyzing Model in most
cases. After the Analyzing Model has been updated and saved, it can be started again.
In rare cases it can happen that the Analyzing Model can not be updated automatically. In such a situation the
Analyzing Model Editor provides detailed information about the functions which could not be updated and the
update can be performed manually then.
4.1.3.4
4.1.3.4.1
Update from V 03.01 SP1 or earlier to V 03.05
Parallel Installation to the old Version
With V 03.02 of X-Tools, the internal directory structure has been changed. Therefore, overwriting of the previous installation of X-Tools can not be performed fully automatically. The following steps must be performed in
order to perform the update:
• Create the backup of your existing installation of X-Tools (see point 4.1.3.1).
• Remove the write protection from all files of the installation directory:
o Call the context menu for the installation directory within the Windows Explorer and select “Properties”.
o Deselect the “Read-only” attribute and press “Apply”.
o In the upcoming dialog, choose “Apply changes to this folder, subfolders and files” and press “OK”.
• Start the installation of the new version of X-Tools by launching of “Setup.exe” from the installation media.
o Within the setup, do not specify the current installation directory of X-Tools as target directory for the
ongoing installation. Instead, use another, empty directory as target directory.
• After the setup has been completed, the new version of X-Tools has been installed.
• Start the new installation of X-Tools, wait until everything has been initialized and close X-Tools afterwards. During this first start, X-Tools prepares the basic directory structures which are needed for the following steps.
English
Release 2012-09
29 / 182
SIPLUS CMS X-Tools - User Manual - 01 - Introduction
SIPLUS CMS
• Copy the following files from the earlier installation of X-Tools to the corresponding directories of the new
installation (overwrite all files which exist in the target directory already):
o ..\Client\User\Basic Settings\Global Options.gof.xtc
o ..\Client\User\Basic Settings\Global Settings.gsf.xtc
o ..\Client\User\Basic Settings\Layout.lyt.xtc
o ..\Client\User\Default Location\*.*
o ..\Server\User\Basic Settings\Data Categories.dcf.xts
o ..\Server\User\Basic Settings\Global Options.gof.xts
o ..\Server\User\Basic Settings\User Accounts.uaf.xts
o ..\Server\User\Default Location\*.*
o ..\Server\User\Offline Files\*.*
• Be sure that the following files are not being copied - they contain absolute path information and therefore
they won’t work within the changed (new) directory:
o ..\Client\User\Basic Settings\File Locations.flf.xtc
o ..\Server\User\Basic Settings\File Locations.flf.xts
• In case additional locations for Configuration Files or Offline Data where specified within the earlier installation of X-Tools, the same locations also must be added manually to the new installation. See point 6.5
for further information about locations for Configuration Files.
• The new version can be started now and uses all of the Configuration Files and settings from the previous
installation.
• In case the previous version is not needed any more, its installation folder can be deleted. Do not delete
any of the directories outside the installation directory (namely the locations of Configuration Files and offline data), as they may be used by the new installation.
4.1.3.5
4.1.3.5.1
Update from V 03.02 or later to V 03.05
Overwriting of the old Version
In order to overwrite a V 03.02 or later with the new V 03.05, the following steps must be performed:
• Create the backup of your existing installation of X-Tools (see point 4.1.3.1).
• Remove the write protection from all files of the installation directory:
o Call the context menu for the installation directory within the Windows Explorer and select “Properties”.
o Deselect the “Read-only” attribute and press “Apply”.
o In the upcoming dialog, choose “Apply changes to this folder, subfolders and files” and press “OK”.
• Start the installation of the new version of X-Tools by launching of “Setup.exe” from the installation media.
o Within the setup, specify the current installation directory of X-Tools as target directory for the ongoing
installation.
• After the setup has been completed, the new version of X-Tools has been installed over the old installation. The new version can be started now and automatically uses all of the Configuration Files and settings from the previous installation.
4.1.3.5.2
Parallel Installation to the old Version
The installation of V 03.05 in parallel to V 03.02 or later can be performed like it is described by point 4.1.3.4.1
for V 03.01 SP1 and earlier.
Although multiple versions of X-Tools can be installed in parallel, the IEEE1394 driver for the to-be-used
SIPLUS CMS IEEE1394 drivers must be upgraded (when V 03.03 or later shall be used) or downgraded (when
V 03.02 SP1 or earlier shall be used), as described by point 4.1.3.2.
English
Release 2012-09
30 / 182
SIPLUS CMS X-Tools - User Manual - 01 - Introduction
4.2
4.2.1
SIPLUS CMS
Hardware Installation
How to connect SIPLUS CMS to your Application
SIPLUS CMS is designed to work as far as possible as a reactionless system to the existing process and automation system. Because of this attempt, binary and analog signals which are available anywhere in the process
can be connected to the high resistance input ports of the IONs and/or IFNs in parallel to the existing system.
To extract data from bus systems like PROFIBUS DP, the available IONs have to be added simply as physical
bus members. There are no changes in the configuration of these buses needed because the according IONs
are realized as spy modules and are not logical members of the bus.
Different software IONs are available for several SIMATIC automation controllers. These software IONs can be
added to the application program of the automation controller and can be used in order to transmit any of the
internal variables of the controller to X-Tools.
4.2.2
Communication Interfaces
IEEE1394 IONs and IFNs communicate with X-Tools via IEEE1394. Examples for IEEE1394 IONs and IFNs
are:
• IFN ANALOGINPUT
• IFN VIB-ACC
• ION AnalogInput T001
• ION BinaryInput T001
• ION PROFIBUS DP Spy T001
• ION VIB-A T001
• ION VIB-D T001
Ethernet IONs communicate with X-Tools via Ethernet. Examples for Ethernet IONs are:
• ION SIMATIC S7-300 T001
• ION SIMATIC S7-400 T001
• ION SIMATIC S7 PN
• ION SIMATIC TDC T001
• ION SIMOTION T001
Serial port CTNs communicate with X-Tools via the serial port. Examples for serial port CTNs are:
• CTN WatchGuard T001
OPC UA servers can be accessed by X-Tools in its role as OPC UA client. OPC UA servers appear within XTools as devices of type
• OPC UA T001
X-Tools can act as OPC UA server. In this role, it can be accessed by other OPC UA client applications in order
to read the current online data values from X-Tools.
English
Release 2012-09
31 / 182
SIPLUS CMS X-Tools - User Manual - 01 - Introduction
4.2.3
SIPLUS CMS
How to connect IEEE1394 Devices to the PC
IEEE1394 Cable
In order to connect an IEEE1394 ION or IFN to X-Tools, an IEEE1394 cable must be plugged between the
used PC and the ION or IFN. To connect further IONs or IFNs, connect them via an IEEE1394 cable to any
other, already connected ION or IFN or to another free IEEE1394 port at the PC.
Note
IEEE1394 allows any topology (e.g. chain, tree) except a loop. Up to 16 IEEE1394 devices can be connected in
a chain. In case more than 16 IEEE1394 devices have to be connected together, a tree topology has to be created.
Note
Do not use multiple IEEE1394 host adapters simultaneously for connecting of IEEE1394 devices to a single PC.
Configurations with multiple used IEEE1394 host adapters are not supported by the system.
Note
Microsoft Windows 7 is delivered with two versions of the basic IEEE1394 driver. The so-called “new” driver
does not work together with all kinds of IEEE1394 host adapters because it does not support IEEE1394-1995
PHYs. In case the IEEE1394 devices are not recognized properly by Microsoft Windows 7, consider to switch to
the so-called “legacy” driver. See also point 7.1.4.
Power Supply
To use an ION or IFN you have to provide it with a 24 V DC power supply.
Driver Installation
After connecting an IEEE1394 ION or IFN to its power supply and to the PC via IEEE1394 for the first time, the
Windows operating system automatically will detect a new hardware device. To use it, the corresponding
SIPLUS CMS driver must be installed for it.
Whenever an IEEE1394 device is being attached to the PC for the first time, the hardware wizard of Windows
starts automatically and wants to install a driver for the new device. For the installation, the following sub-path of
your installation directory has to be provided to the hardware wizard of Windows:
..\SIPLUS CMS\Drivers\IEEE1394\
IEEE1394 IONs and IFNs are detected by X-Tools automatically after the driver installation and can be used by
X-Tools immediately.
4.2.4
How to connect Ethernet IONs to the PC
Ethernet Cable
In order to connect an Ethernet ION to X-Tools, an Ethernet cable must be plugged between the used PC and
the ION. Ethernet standard networking devices like switches and/or hubs can be used between the PC and the
ION as well.
Power Supply
The SIPLUS CMS part of current Ethernet IONs is limited to a piece of software which is installed on a corresponding hardware. Therefore, the hardware of Ethernet IONs is non-SIPLUS CMS and has its own power supply instructions.
Driver Installation
There is no driver installation needed for Ethernet IONs. Instead, Ethernet IONs have to be announced manually to X-Tools after they have been attached and before they can be used. The Interface Profile Editor for the
socket interface (see IPE Socket T001) must be used for the configuration of connections to Ethernet IONs.
English
Release 2012-09
32 / 182
SIPLUS CMS X-Tools - User Manual - 01 - Introduction
4.2.5
SIPLUS CMS
How to connect USB CTNs to the PC
USB Cable
In order to connect a USB CTN to the used PC, a USB cable must be plugged between the used PC and the
CTN.
Power Supply
USB CTNs do not need any external power supply because they are powered via the USB cable from the used
PC.
Driver Installation
After connecting a USB CTN to the PC via USB for the first time, the Windows operating system automatically
will detect a new hardware device. To use it, the corresponding driver must be installed for it.
The used driver installs a virtual COM port, so that the CTN becomes visible below the “Ports (COM and LPT)”
item of the Windows Device Manager with its COM number. As a result, USB CTNs are accessed like serial
devices by X-Tools.
Whenever a USB CTN is being attached to the PC for the first time, the hardware wizard of Windows starts
automatically and wants to install a driver for the new device. For the installation, the following path has to be
provided to the hardware wizard of Windows:
..\SIPLUS CMS\Drivers\USB\
USB CTNs have to be announced manually to X-Tools after they have been attached and before they can be
used. They have to be announced as serial devices because the installed USB driver emulates a virtual COM
port which must be used by X-Tools in order to be able to access the device. The Interface Profile Editor for
the serial port interface (see IPE Serial Port T001) must be used for the configuration of connections to USB
CTNs.
4.2.6
How to connect OPC UA Servers to the PC
Ethernet Cable
In order to connect an OPC UA server to X-Tools, an Ethernet cable must be plugged between the PC which is
running X-Tools and the device which is running the OPC UA server. In case the OPC UA server is running at
the same PC as X-Tools, no additional Ethernet cable is needed.
Power Supply
The device which is providing the OPC UA server must be powered on as specified by the manufacturer of the
device. In case the OPC UA server is running at the same PC as X-Tools, no additional power supply is
needed.
Driver Installation
There is no driver installation needed for OPC UA servers. Instead, OPC UA servers have to be announced
manually to X-Tools after they have been attached and before they can be used. The Interface Profile Editor
for the OPC UA interface (see IPE OPC UA T001) must be used for the configuration of connections to OPC UA
servers.
4.2.7
How to connect OPC UA Clients to the PC
Ethernet Cable
In order to connect an OPC UA client to X-Tools, an Ethernet cable must be plugged between the PC which is
running X-Tools and the device which is running the OPC UA client. In case the OPC UA client is running at the
same PC as X-Tools, no additional Ethernet cable is needed.
Power Supply
The device which is acting as OPC UA client must be powered on as specified by the manufacturer of the device. In case the OPC UA client is running at the same PC as X-Tools, no additional power supply is needed.
Driver Installation
There is no driver installation needed for OPC UA client. From the point of view of X-Tools, the only needed
configuration for the communication with OPC UA clients is to enable the OPC UA server functionality of XTools.
English
Release 2012-09
33 / 182
SIPLUS CMS X-Tools - User Manual - 01 - Introduction
4.2.8
SIPLUS CMS
Video Card Driver
It is highly recommended to ensure that the used video card driver is up to date in order to achieve the best
possible performance for the visualization of data within the Monitoring System. As the Monitoring System
allows choosing between DirectX and OpenGL renderers for the visualization, a good support of the chosen
renderer (DirectX or OpenGL) is highly recommended for fluent visualization results.
4.2.9
Minimal Firmware Versions
The following minimal firmware versions must be provided by each device:
Device
Minimal CMM/Main Version
Minimal IOM/IFM Version
IFN ANALOGINPUT
V 01.12.EN.0000
V 01.02.EN.0004
IFN VIB-ACC
V 01.12.EN.0000
V 01.03.EN.0018
ION SIMATIC S7 PN
V 01.01.EN.0000
n/a
ION SIMATIC S7-300 T001
V 03.01.EN.0000
n/a
ION SIMATIC S7-400 T001
V 03.06.EN.0000
n/a
ION SIMATIC TDC T001
V 03.02.EN.0002
n/a
ION SIMOTION T001
V 01.02.EN.0000
n/a
ION AnalogInput T001
V 03.00.EN.0010
V 08.00.EN.0000
ION BinaryInput T001
V 03.00.EN.0010
V 02.00.EN.0001
ION PROFIBUS DP Spy T001
V 03.00.EN.0010
n/a
ION VIB-A T001
V 03.00.EN.0010
V 04.00.EN.0000
ION VIB-D T001
V 03.00.EN.0010
V 04.00.EN.0000
CTN WatchGuard T001
V 02.05.EN.0006
n/a
In case your device reports an older firmware version it must be updated to the latest available version. Detailed
information about how to update the firmware of devices is obtained from your local Siemens office and from the
homepage http://www.siemens.com/siplus-cms.
Note
Devices with an older firmware version than above may also work properly. However, older firmware versions
are not tested any more together with the latest version of X-Tools, thus it is always suggested to use the latest
available version of all device firmware together with the current version of X-Tools.
English
Release 2012-09
34 / 182
SIPLUS CMS X-Tools - User Manual - 01 - Introduction
5
SIPLUS CMS
Quick Reference
Start the X-Tools Client
The X-Tools Server
is being started
automatically
Configure to which devices the X-Tools
Server shall connect via its interfaces
Configure the currently connected
devices in order to receive their
measurement data
Visualize the currently availabe online
data
Store the currently
availabe online data
Load the currently
available offline data
Visualize the currently availabe offline
data
Analyzing of data via
Analyzing Models
(equal for Analyzing Scripts)
English
Release 2012-09
- IEEE1394 devices are detected automatically after the driver installation
- socket (TCP or UDP) devices are configured via the IPE Socket T 001
- open the DMS (Device Management System)
- within the DMS Explorer, expand
- Main
- Servers
- YourServerName
- Interfaces
- right-click with the mouse onto „Socket T001"
- choose „New Interface Profile“
- configure your desired connections
- press „Save“ within the Interface Profile Editor
- within the DMS Explorer, expand
- Main
- Servers
- YourServerName
- Files
- Default Location
- Interface Profile Files
- right-click with the mouse onto your saved Interface Profile
- choose „Start“
After the Interface Profile has been started , the X-Tools Server attempts to
connect to the configured devices . Each successfully connected socket
device appears with the DMS Explorer below
- Main
- Servers
- YourServerName
- Interfaces
- Socket T001
- open the DMS (Device Management System)
- within the DMS Explorer, expand
- Main
- Servers
- YourServerName
- Interfaces
- e.g. IEEE1394 T001 or Socket T001
- right-click with the mouse onto a connected device
- choose „New Device Profile“
- configure your desired settings for the data streaming
- press „Save“ within the Device Profile Editor
- within the DMS Explorer, expand
- Main
- Servers
- YourServerName
- Files
- Default Location
- Device Profile Files
- right-click with the mouse onto your saved Device Profile
- choose „Start“
After the Device Profile has been started , the X-Tools Server initializes the
data streaming of the configured device . The incoming data appears within
the MDS Explorer below
- Main
- Servers
- YourServerName
- Online Data
- All Online Data
From there, the online data can be used within all other systems of X -Tools.
- open the MTS (Monitoring System)
- drag any online data from the MDS Explorer into the free space of the
opened window
A new Monitoring View is being opened automatically and the dropped data
is being visualized. Additional data can be dropped into the same and /or into
additional Monitoring Views.
- open the STS (Storage System)
- drag any data from the MDS Explorer into the free space of the opened
window
- a new Storage Profile is being opened automatically and the dropped data
is being added to its „Data“ table
- additional data can be dropped into the „Data“ table via Drag &Drop
- configure the desired settings for the storing of the data
- press „Save“ within the Storage Profile Editor
- within the STS Explorer, expand
- Main
- Servers
- YourServerName
- Files
- Default Location
- Storage Profile Files
- right-click with the mouse onto your saved Storage Profile
- choose „Start“
After the Storage Profile has been started , the X-Tools Server initializes the
storing according to the configured settings . The stored data can loaded
again later as offline data.
- open the MDS (Master Data System)
- within the MDS Explorer, expand
- Main
- Servers
- YourServerName
- right-click with the mouse onto „Offline Data“
- choose „Load Offline Data“ in order to open the Offline Data Loader
- within the Offline Data Loader, browse the to desired offline data files and
choose the „Append“ or „Overwrite“ context menu items in order to load
offline data from the disk
After an offline data has been loaded it appears within the MDS Explorer
below
- Main
- Servers
- YourServerName
- Offline Data
- All Offline Data
From there, the offline data can be used within all other systems of X -Tools.
- open the MTS (Monitoring System)
- drag any offline data from the MDS Explorer into the free space of the
opened window
A new Monitoring View is being opened automatically and the dropped data
is being visualized. Additional data can be dropped into the same and /or into
additional Monitoring Views.
- open the ANS (Analyzing System)
- within the ANS Explorer, expand
- Main
- Servers
- YourServerName
- Files
- Default Location
- right-click with the mouse onto „Analyzing Model Files“
- choose „New Analyzing Model“ in order to open the Analyzing Model Editor
- configure the desired calculations
- press „Save“ within the Analyzing Model Editor
- within the ANS Explorer, expand
- Main
- Servers
- YourServerName
- Files
- Default Location
- Analyzing Model Files
- right-click with the mouse onto your saved Analyzing Model
- choose „Start“
After the Analyzing Model has been started , the X-Tools Server initializes the
configured calculations. The calculated data appears within the MDS
Explorer below
- Main
- Servers
- YourServerName
- Online Data or Offline Data
- All Online Data or All Offline Data
From there, the online or offline data can be used within all other systems of
X-Tools.
Each successfully connected IEEE1394 device appears with the DMS
Explorer below
- Main
- Servers
- YourServerName
- Interfaces
- IEEE1394 T001
35 / 182
SIPLUS CMS X-Tools - User Manual - 01 - Introduction
6
SIPLUS CMS
Tutorials
6.1
General Description
The following tutorials provide a fast and detailed overview about the key functionalities of X-Tools. They build
on each other, therefore it is strongly recommended to take a look onto them in the order in which they are provided in case of the first contact to the system.
However, in case you already have some experience with the system, you may find the one or the other tutorial
useful in order to recall a certain functionality or handling.
In addition to this tutorial, examples for all available configurations are delivered together with X-Tools. These
examples are being found in a separated Configuration File location so that they can be enabled or disabled
with only a few clicks at any time. Take a look at point 6.5 in order to see how to enable or disable additional
Configuration File locations.
6.2
6.2.1
X-Tools Basics
General Description
In this chapter you will learn more about the basic modules and functionalities of X-Tools.
This chapter contains the following topics:
• Running X-Tools for the first Time
• X-Tools User Interface
• Available Data
6.2.2
Running X-Tools for the first Time
Start X-Tools
• To start X-Tools, double click the X-Tools shortcut on your desktop. Alternatively, you can directly call
“X-Tools Client.exe” from the following directory:
“..\SIPLUS CMS\X-Tools\Client\System\Bin”
System Paths
• At the first startup, X-Tools automatically generates the default configuration of all settings, options and
paths. By default, the started X-Tools Client automatically also starts the X-Tools Server and establishes the connection so that no additional configuration is needed and the actual measurement tasks can
be started immediately.
• Via the Global Options Editor, you are able to modify any of the default settings, options and paths of
the X-Tools Client and of the X-Tools Server at any later time. Take a look at point 6.4.2 in order to receive detailed information about the Global Options Editor and its functionalities.
Ready
At this point, the basic configuration of X-Tools has been finished and X-Tools is ready to use!
English
Release 2012-09
36 / 182
SIPLUS CMS X-Tools - User Manual - 01 - Introduction
6.2.3
SIPLUS CMS
X-Tools User Interface
Sub Systems
The user interface of the X-Tools Client is divided into the following six sub systems:
• MDX - Master Data System Explorer
• MMS - Main Management System
• DMS - Device Management System
• MTS - Monitoring System
• ANS - Analyzing System
• STS - Storage System
Main Title Bar
The main title bar of the X-Tools Client contains the following functionalities (left to right):
• Caption
• Show/Hide Master Data System Explorer button - shows/hides the Master Data System Explorer
• Full Screen button - puts the X-Tools Client into full screen mode
• Minimize button - minimizes the X-Tools Client
• Maximize or Restore button - maximizes or restores the X-Tools Client
• Exit button - closes the X-Tools Client
Figure 14: Main Title Bar of the X-Tools Client
Main Menu Bar
The main menu bar of the X-Tools Client contains the following functionalities (left to right):
• MDS Explorer button - shows/hides the Master Data System Explorer
• MMS button - brings the Main Management System to the front in case it is opened already and opens it
in case it is not opened yet
• DMS button - brings the Device Management System to the front in case it is opened already and opens
it in case it is not opened yet
• MTS button - brings the Monitoring System to the front in case it is opened already and opens it in case
it is not opened yet
• ANS button - brings the Analyzing System to the front in case it is opened already and opens it in case it
is not opened yet
• STS button - brings the Storage System to the front in case it is opened already and opens it in case it is
not opened yet
Figure 15: Main Menu Bar of the X-Tools Client
Main Status Bar
The main status bar of the X-Tools Client contains the following functionalities (left to right):
• visualization of the current status message, in case there is any
• combo box for the selection of the X-Tools Server in case one or more are available, otherwise the current status message is displayed
English
Release 2012-09
37 / 182
SIPLUS CMS X-Tools - User Manual - 01 - Introduction
SIPLUS CMS
• icons which represent the current status of the Configuration Files of the currently chosen X-Tools
Server via the icon itself (e.g. through colors) and via the tool tip of each icon:
o status of Interface Profiles
o status of Device Profiles
o status of Analyzing Models
o status of Analyzing Scripts
o status of Storage Profiles
• current date and time of the X-Tools Client
Figure 16: Main Status Bar of the X-Tools Client
Window Size and Position
The following window size and position functionalities are provided by the X-Tools Client:
• The Full Screen button from the title bar each window can be used in order to put it into full screen mode.
Figure 17: Full Screen Button
• In full screen mode, the Restore button can be used in order to bring the window back to its original size.
Alternatively, a double-click onto the title bar of a window which is in full screen mode also brings the window back to its original size.
Figure 18: Restore Button
• The Maximize button can be used in order to maximize a window within its workspace. Alternatively, a
double-click onto the title bar of a window which is not maximized also maximizes the window within its
workspace.
Figure 19: Maximize Button
• In case a window is maximized within its workspace, the Restore button can be used in order to bring the
window back to its original size. Alternatively, a double-click onto the title bar of a window which is maximized within its workspace also brings the window back to its original size.
• The size of each window can be changed via Drag&Drop. In order to change the size of a window, click
onto the border or an edge of the window with the left mouse button and keep the mouse button pressed
while moving the mouse cursor. During the mouse move, a light frame shows the new size which the
window would get when the mouse button is released.
• The position of each window can be moved via Drag&Drop. In order to move a window to another place
within its workspace, click onto the title bar of the window with the left mouse button and keep the mouse
button pressed while moving the mouse cursor. During the mouse move, a light frame shows where the
dragged window would be dropped when the mouse button is released.
• The detailed behavior of each window can be configured via the context menu which is being called via a
click onto the title bar of the window with the right mouse button. The provided context menu allows
switching the window mode between tabbed, automatic and manual and also provides some further possibilities of configuration.
• The Close button from the title bar of each window can be used in order to close the window.
Figure 20: Close Button
Tool Tips of Menu Buttons
Each button from the menu bar of a dialog provides a tool tip which describes its functionality in short words. In
order to display the tool tip of a menu button, simply move the mouse cursor above the menu button and wait
some moments until the tool tip is being displayed.
English
Release 2012-09
38 / 182
SIPLUS CMS X-Tools - User Manual - 01 - Introduction
SIPLUS CMS
Try it out
After opening of the X-Tools Client, press the DMS and MTS buttons in order to open the Device Management System and the Monitoring System.
You can see that the DMS and MTS buttons are highlighted. In addition, at the top of the screen, you can
see the Device Management System in the background and the Monitoring System in the foreground.
Within the MTS Explorer, expand the “Main -> Editors -> Monitoring Charts” branch and drag the MTC yt
T001 with the left mouse into the empty space at the right side of the MTS Explorer.
A new Monitoring View Editor which contains the dropped MTC yt T001 is being opened automatically.
Drag another MTC yt T001 from the MTS Explorer into the already opened Monitoring View Editor.
The second MTC yt T001 is added to the Monitoring View Editor, which contains two MTC yt T001
now.
Use the Full Screen button of one MTC yt T001 in order to put it into full screen mode. Double-click onto
the title bar of the MTC yt T001 in full screen mode afterwards in order to put it back to its previous size.
Click into the title bar of one MTC yt T001 and keep the left mouse button pressed while moving the
mouse. Place the dragged MTC yt T001 right to the second MTC yt T001 within the Monitoring View
Editor.
Use the Maximize button of one MTC yt T001 in order to maximize the MTC yt T001 within the Monitoring View Editor.
Move the mouse cursor onto some menu buttons in order to get the tool tips of the menu buttons being
displayed.
Ready
At this point, you know the basics of the user interface of the X-Tools Client and you know how to arrange the
opened windows to your needs.
6.2.4
Available Data
Master Data System Explorer
The Master Data System Explorer displays all of the data which is currently available at the X-Tools Server.
From there, the currently available data can be moved to the other systems of X-Tools via simple Drag&Drop
operations.
Online Data
Online data is defined as the data which is currently received from the attached devices and which is configured
via Device Profiles (see point 6.7).
In addition, Analyzing Models and Analyzing Scripts also can be configured to produce output data of class
“online” (see point 6.13 and point 6.14).
Online data is maintained by the X-Tools Server within ring buffers that are overwritten from the beginning
whenever the end of the buffer is being reached. The size of the ring buffer of each data can be configured individually, thus the amount of time which is available for each online data in memory can be determined by the
user. In order to save some online data permanently, Storage Profiles (see point 6.9) must be used.
Each ring buffer of online data should be configured to a size which can hold at least a few seconds of data. For
example, in case a data acquisition is running with 40 kHz, a ring buffer size of 400.000 values would be able to
keep 10 seconds of the data. In case of a ring buffer which is too small to hold the values of its data for a few
seconds, an according warning is written into the System Log of the X-Tools Server.
Offline Data
Offline data is defined as the data which has been stored to disk previously and which has been loaded via an
Offline Data Loader (see point 6.10).
In addition, Analyzing Models and Analyzing Scripts also can be configured to produce output data of class “offline” (see point 6.13 and point 6.14).
Offline data is maintained by the X-Tools Server within static buffers which are modified only in case an according operation is started by the user, e.g. in case additional offline data is appended, in case the offline data is
overwritten with other values or in case an Analyzing Model or Analyzing Script is executed again.
English
Release 2012-09
39 / 182
SIPLUS CMS X-Tools - User Manual - 01 - Introduction
6.2.5
SIPLUS CMS
Configuration Files
Types
Configuration Files are being used in order to configure all of the tasks of X-Tools. The following types of Configuration Files are being provided by X-Tools:
Configuration File Type
Description
Main Profiles
Main Profiles are the only type of Configuration Files which are being configured for the X-Tools Client and are being used in order to connect from the XTools Client to one or multiple X-Tools Servers. See point 6.3.
Interface Profiles
Interface Profiles are being used in order to connect the X-Tools Server to
devices, e.g. via socket (UDP, TCP) or serial port interfaces. After devices
have been connected, their measurement data can be acquired via Device
Profiles. See point 6.6.
Device Profiles
Device Profiles are being used in order to configure the measurement data
which shall be delivered by a certain device. See point 6.7
Device Setups
Device Setups are being used in order to store temporary data which is
needed for the configuration or execution of Device Profiles, like the address
books of ION SIMATIC TDC T001 devices. They are not editable by the user
and are written and read automatically by X-Tools.
Monitoring Views
Monitoring Views are being used in order to visualize any of the currently present (online and/or offline) data. In addition, Monitoring Views can be configured to wait for trigger events and to create automatic reports. See point 6.8,
6.11 and 6.25.
Analyzing Models
Analyzing Models are being edited graphically and are being used in order to
perform calculations which base on online and/or offline data. See point 6.13.
Analyzing Scripts
Analyzing Scripts are being edited textually and are being used in order to
perform calculations which base on online and/or offline data. See point 6.14.
User Functions
User Functions are being edited graphically and are being used in order to
encapsulate analysis tasks, in order to make analysis tasks re-usable and in
order to protect the know-how onto which the analysis task bases. See point
6.15.
Storage Profiles
Storage Profiles are being used in order to store any of the currently present
(online or offline) data. See point 6.9 and 6.16.
Loading Profiles
Loading Profiles are being used in order to pre-configure which offline data
shall be loaded out of the possibly massive amount of present offline data.
See point 6.10.
Handling
Most Configuration Files can be started, paused, continued and stopped by the user. After a Configuration File
has been started, X-Tools does not care about the actual file at the disk any more because it already has
loaded the relevant contents. Therefore, the following conditions apply for all Configuration Files of X-Tools:
• In case a Configuration File is being updated through the user (e.g. via X-Tools or directly via overwriting
of the file outside of X-Tools), the modified contents are not being taken over by X-Tools automatically.
The changes are being taken over in the following cases:
o when the Configuration File is being stopped and restarted (e.g. also after a restart of X-Tools)
o in case a Configuration File has been suspended and “Automatic Takeover of changed Configuration
Files” is set to “Perform automatic Takeover only in case the Configuration File is suspended” within
the global options
o in case “Automatic Takeover of changed Configuration Files” is set to “Perform automatic Takeover
whenever the Source File at the Disk has been changed” within the global options
English
Release 2012-09
40 / 182
SIPLUS CMS X-Tools - User Manual - 01 - Introduction
SIPLUS CMS
• The actual file at the disk may be renamed, moved or deleted (e.g. via X-Tools or directly outside of XTools), in which case it also disappears from the according explorer tree of X-Tools. In all of these cases
the actual execution of the already running Configuration File is not being interrupted, thus the according
explorer tree of X-Tools may not be able to display all of the currently running Configuration Files.
o At the next start of X-Tools the missing Configuration File will not be started any more because XTools obviously has no information about its contents.
• All Configuration Files can be edited also in case their source (e.g. an interface, a device or some data) is
not available. Thus, the full configuration of X-Tools can be created and/or edited also without a direct
connection to the final application.
6.3
6.3.1
Client to Server Connectivity
General Description
In this chapter you will learn how the X-Tools Client can connect to one or more X-Tools Servers via the functionality of Main Profiles. As all data acquisition, calculation and storage tasks are performed by the X-Tools
Server, the X-Tools Client must be connected to at least one X-Tools Server in order to configure and examine measurement and analysis tasks. The client server architecture of X-Tools has been chosen in order to
fulfill various requests like full remote configuration possibility or execution of the actual data acquisition, calculation and storage tasks without a user interface and as Windows service.
A Main Profile contains all of the information which is needed in order to connect to one or more X-Tools Servers. This information includes the IP address and ports of the target X-Tools Servers as well as the username
and password which shall be used when connecting. From the provided username and password, the X-Tools
Server determines the access rights for the connected X-Tools Client. Multiple Main Profiles can be created for
the X-Tools Client, but only one Main Profile can be started at a time. The X-Tools Client connects to all of the
X-Tools Servers which are specified via the currently started Main Profile.
The X-Tools Client is delivered with a default Main Profile which automatically is being started during the
startup of the X-Tools Client and establishes a connection to the local X-Tools Server. In case the remote
capabilities of X-Tools are not needed, the provided default Main Profile allows the usage of X-Tools without
the need to bother about any client server specific issues.
This chapter contains the following topics:
• Creation of new Main Profiles
• Opening of existing Main Profiles
• Starting and Stopping of Main Profiles
• Securing of the X-Tools Server
• X-Tools Server Connectivity Dialog
6.3.2
Creation of new Main Profiles
Open the MMS Explorer
• Open the Main Management System and ensure that the MMS Explorer is displayed at the left side of
the Main Management System workspace.
Functionality
• Within the MMS Explorer, expand the “Main -> Editors -> Main Profile Editors” branch.
• Drag the MPE Standard T001 with the left mouse into the empty space at the right side of the MMS Explorer. An empty MPE Standard T001 is opened automatically.
• Press the New button in order to create a new Main Profile. The new Main Profile is displayed by the
MPE Standard T001 with default values.
English
Release 2012-09
41 / 182
SIPLUS CMS X-Tools - User Manual - 01 - Introduction
SIPLUS CMS
Figure 21: MPE Standard T001 with a new Main Profile
• The Main Profile Settings table at the top of the MPE Standard T001 displays the general file information
and allows entering additional file attributes like a description and the name of the author of the file and
his company.
• Within the Connections table, the actual connections to X-Tools Servers are configured. In order to configure a new connection, simple insert the IP address to the target X-Tools Server into the IP Address
field. When a connection to the X-Tools Server at the local computer shall be established, “127.0.0.1”
can be entered as IP address.
• By default, the values from the other columns of the Connections table do not need to be modified.
o In case the X-Tools Server has been configured to use different command and data ports, these
other command and data ports must be entered instead of the default ones.
• In case the anonymous access has been disabled at the X-Tools Server, the proper values for the User
Name, Password and Password (confirm) must be provided via the according columns. By default, the XTools Server provides an account with user name “Administrator” and password “administrator”. However, the password for the user “Administrator” also can be changed, in which case the proper other
password must be provided.
• The User Name is case-insensitive.
• The Password and Password (confirm) entries are case-sensitive.
• The Save and Save As… buttons are used in order to save the configured Main Profile with all of its settings. All saved Main Profiles are shown by the MMS Explorer (“Main -> Files -> YourLocation -> Main
Profile Files” branch) and can be accessed (e.g. started, stopped, opened, …) from there.
• For a more detailed description of all available functionalities of the MPE Standard T001, refer to the reference manual of the “Main Management System”, chapter “MPE Standard T001”.
Try it out
Create a new Main Profile.
Enter a target IP address of “127.0.0.1” and do not change the default values of the other columns.
Save the Main Profile. At the first save, the Save As dialog will pop up and offers a default file name.
Change the default file name to “Hello Main Profile” and press OK in order to save it to the disk.
The new Main Profile now is displayed below the “Main -> Files -> Default Location -> Main Profile Files”
branch of the MMS Explorer.
English
Release 2012-09
42 / 182
SIPLUS CMS X-Tools - User Manual - 01 - Introduction
SIPLUS CMS
Ready
At this point you know how to create a new Main Profile which can be used in order to establish the connections
to one or more X-Tools Servers.
6.3.3
Opening of existing Main Profiles
Open the MMS Explorer
• Open the Main Management System and ensure that the MMS Explorer is displayed at the left side of
the Main Management System workspace.
Functionality
• Within the MMS Explorer, expand the “Main -> Files -> Default Location -> Main Profile Files” branch.
• Drag one of the below Main Profiles with the left mouse into the empty space at the right side of the MMS
Explorer. A MPE Standard T001 is opened automatically and displays the dropped Main Profile.
Figure 22: MPE Standard T001 with an opened Main Profile
• The opened Main Profile can be edited now. After editing, the Save and Save As… buttons are used in
order to save the edited Main Profile with all of its settings.
Try it out
Open an existing Main Profile.
Enter another target IP address and change the Profile Description within the Main Profile Settings table.
Save the Main Profile via the Save button.
The modified Main Profile is still displayed below the “Main -> Files -> Default Location -> Main Profile
Files” branch of the MMS Explorer.
Ready
At this point you know how to open and modify an existing Main Profile.
English
Release 2012-09
43 / 182
SIPLUS CMS X-Tools - User Manual - 01 - Introduction
6.3.4
SIPLUS CMS
Starting and Stopping of Main Profiles
Open the MMS Explorer
• Open the Main Management System and ensure that the MMS Explorer is displayed at the left side of
the Main Management System workspace.
Functionality
• Within the MMS Explorer, expand the “Main -> Files -> Default Location -> Main Profile Files” branch.
• Click onto any of the present Main Profiles with the right mouse button in order to open the context menu.
• In order to start the currently selected Main Profile, choose Start from the context menu.
o Up to one Main Profile can be started at any time. In case a Main Profile is started already and the
user starts another one, the currently running Main Profile is stopped automatically and the other Main
Profile is being started afterwards.
o In case there is no Main Profile being started at the moment, the X-Tools Client does not connect to
any X-Tools Server. When there is no X-Tools Server connected at the moment, all X-Tools Server
related operations (e.g. configuring of measurement, analysis and storage tasks or visualization of
data, …) are not available.
• In order to stop the currently running Main Profile, call the context menu of this Main Profile and choose
Stop.
o In case the currently running Main Profile is being stopped, all of the connections to X-Tools Servers
are terminated.
Try it out
Start an existing Main Profile.
The connections to the X-Tools Servers which are configured within the Main Profile are being established in case the specified X-Tools Servers are available. The connected X-Tools Servers appear
within all explorer dialogs of the X-Tools Client.
Stop the currently running Main Profile.
All connections to X-Tools Servers are being terminated and all X-Tools Servers disappear within all
explorer dialogs of the X-Tools Client.
Ready
At this point you know how to start and stop existing Main Profiles in order to establish and terminate the connections to X-Tools Servers.
6.3.5
Securing of the X-Tools Server
The X-Tools Server provides a user accounts management which can be used in order to maintain multiple
users which have different rights at the X-Tools Server. For example, one user may be allowed to edit and
start/stop Configuration Files, another one may be allowed to only start/stop existing Configuration Files and a
third one may be allowed only to visualize the data which is being provided by the X-Tools Server. Of course
there are much more possibilities available – refer to the reference manual of the “Main Management System”,
chapter “User Accounts Editor” in order to receive detailed information about the available access rights.
The X-Tools Server does not protect the current configuration of access rights in any special way and stores all
settings into a simple Configuration File (..\Server\User\Basic Settings\User Accounts.uaf.xts). In case the access rights shall be used for security-relevant applications where a user without the according rights must not
have any way to assign additional rights to himself, the access to this Configuration File must be limited. This
can be done through standard mechanisms of Windows (e.g. by not allowing the Windows user to access the
file, which implies that the X-Tools Server and the X-Tools Client are running from different Windows user
accounts and/or on different computers) and has not been re-implemented by the X-Tools Server.
In case the X-Tools Server is being configured to be started automatically before a user logs in to Windows, an
according service (the X-Tools Service) is being used. This service appears like all other services within the
“Services” application of Windows (see “Start” -> “Control Panel” -> “Administrative Tools” -> “Services”). In
order to change the Windows user which is being used to start this service (and, therefore, to start the X-Tools
Server), open the properties of X-Tools Service, go to the “Log On” tab, select “Log on as this account” and
English
Release 2012-09
44 / 182
SIPLUS CMS X-Tools - User Manual - 01 - Introduction
SIPLUS CMS
specify the Windows user and password which shall be used to run the service. The chosen user must have
write access within the directories of the X-Tools Server.
6.3.6
X-Tools Server Connectivity Dialog
The X-Tools Server Connectivity dialog can be called from the context menu of the X-Tools Server, which is
available from the task bar of Windows. This dialog can be used in order to check and to edit the communication
ports which are being used by the X-Tools Server. In some environments it may happen that the communication ports, which are requested by the X-Tools Server, are being occupied by another application already. In
this case, the X-Tools Server Connectivity dialog can be used in order to change the communication ports of
the X-Tools Server.
After the communication ports of the X-Tools Server have been changed via the X-Tools Server Connectivity
dialog, the X-Tools Server must be re-initialized or re-started.
In case the communication ports of the X-Tools Server are being changed, also the Main Profiles of all X-Tools
Clients which need to connect to the X-Tools Server must be updated so that they point to the new communication ports.
Figure 23: X-Tools Server Connectivity dialog
6.4
6.4.1
Global Configurations
General Description
In this chapter you will learn how to configure the global options of X-Tools, how to configure the user accounts
of X-Tools Servers and how to visualize the system log files of X-Tools.
This chapter contains the following topics:
• The Global Options Editor
• The User Accounts Editor
• The System Log Viewer
English
Release 2012-09
45 / 182
SIPLUS CMS X-Tools - User Manual - 01 - Introduction
6.4.2
SIPLUS CMS
The Global Options Editor
Open the Global Options Editor
• Open the Main Management System and ensure that the MMS Explorer is displayed at the left side of
the Main Management System workspace.
• In order to open the Global Options Editor for the X-Tools Client, call the context menu for the “Main“
item within the MMS Explorer and choose Edit Global Options.
• In order to open the Global Options Editor for a connected X-Tools Server, call the context menu for
the “Main -> Servers -> YourServerName“ item within the MMS Explorer and choose Edit Global Options.
• The Global Options Editor also can be opened via the Global Options Editor button from the menu bar
of the Main Management System workspace. In this case, the last time called Global Options Editor
for the X-Tools Client or for the connected X-Tools Server is being opened automatically.
o The “Main” item from the MMS Explorer can be dragged into the empty Global Options Editor in order to start editing of the global options of the X-Tools Client.
o Any of the present “Main -> Servers -> YourServerName” items from the MMS Explorer can be
dragged into the empty Global Options Editor in order to start editing of the global options of the XTools Server.
• For a more detailed description of all available functionalities of the Global Options Editor, refer to the
reference manual of the “Main Management System”, chapter “Global Options Editor”.
Functionality
• The Global Option Settings table at the top of the Global Options Editor displays the general file information and allows entering additional file attributes like a description and the name of the author of the file
and his company.
• Within the Global Options table, the values of all global options can be edited.
• The Save and Save As… buttons are used in order to save the configured global options with all of their
settings. Each X-Tools Client and each X-Tools Server supports only one Global Options File, thus the
user does not need to provide a file name during saving.
o In case the Global Options File is being stored to the local file system, any possible performed
changes of the contained global options are not being used by the X-Tools Client or the X-Tools
Server. The Global Options File must be stored to an X-Tools Client or to an X-Tools Server when
its configuration shall take into effect.
• In case the X-Tools Client or any of the currently connected X-Tools Servers is being dragged into a
non-empty Global Options Editor, the global options of the dragged item are opened instead of the currently displayed global options.
Try it out
Open the Global Options Editor for the X-Tools Client.
Change one or more of the displayed global options.
Save the Global Options File.
In case one or more changes require a restart of the whole application or a restart of single software
modules, an according message box is displayed to the user.
Open the Global Options Editor for any of the currently connected X-Tools Servers.
Change one or more of the displayed global options.
Save the Global Options File.
In case one or more changes require a restart of the whole application or a restart of single software
modules, an according message box is displayed to the user.
Ready
At this point you know how to open and edit the global options of the X-Tools Client and of the X-Tools Server.
English
Release 2012-09
46 / 182
SIPLUS CMS X-Tools - User Manual - 01 - Introduction
6.4.3
SIPLUS CMS
The User Accounts Editor
Open the User Accounts Editor
• Open the Main Management System and ensure that the MMS Explorer is displayed at the left side of
the Main Management System workspace.
• In order to open the User Accounts Editor for a connected X-Tools Server, call the context menu for
the “Main -> Servers -> YourServerName“ item within the MMS Explorer and choose Edit User Accounts.
• The User Accounts Editor also can be opened via the User Accounts Editor button from the menu bar of
the Main Management System workspace. In this case, an empty User Accounts Editor is being
opened.
o Any of the present “Main -> Servers -> YourServerName” items from the MMS Explorer can be
dragged into the empty User Accounts Editor in order to start editing of the user accounts of the XTools Server.
• For a more detailed description of all available functionalities of the User Accounts Editor, refer to the
reference manual of the “Main Management System”, chapter “User Accounts Editor”.
Functionality
• The User Accounts Settings table at the top of the User Accounts Editor displays the general file information and allows entering additional file attributes like a description and the name of the author of the file
and his company.
• Within the User Accounts table, the currently defined user accounts are displayed. In order to configure a
new user account, simply insert the user name into the User Name field. In addition to the user name,
also a password can be assigned to each user account.
o In case a user account from the User Accounts table is being selected, the Access Rights, Location
Rights and Advanced Rights tables of the User Accounts Editor are updated automatically and display the current settings for the currently selected user account.
o The access rights within the Access Rights, Location Rights and Advanced Rights tables can be configured independently for each defined user account.
• The Save and Save As… buttons are used in order to save the configured user accounts with all of their
settings. Each X-Tools Server supports only one User Accounts File, thus the user does not need to provide a file name during saving.
o In case the User Accounts File is being stored to the local file system, any possible performed
changes of the contained user accounts are not being used by the X-Tools Server. The User Accounts File must be stored to an X-Tools Server when its configuration shall take into effect.
• In case any of the currently connected X-Tools Servers is being dragged into a non-empty User Accounts Editor, the user accounts of the dragged item are opened instead of the currently displayed user
accounts.
Try it out
Open the User Accounts Editor for any of the currently connected X-Tools Servers.
Add a user account with user name “Tutorial” and choose any password.
Save the User Accounts File.
Change the current Main Profile so that the X-Tools Client connects to the chosen X-Tools Server with
the username “Tutorial” and the assigned password. Stop the Main Profile and restart it so that the made
changes within the Main Profile are taken over.
The X-Tools Client connects to the X-Tools Server with the username “Tutorial”. In case the provided
combination of user name and password would be wrong, the connection attempt fails and according information is output to the system log of the X-Tools Client.
Ready
At this point you know how to open and edit the user accounts of the X-Tools Server.
English
Release 2012-09
47 / 182
SIPLUS CMS X-Tools - User Manual - 01 - Introduction
6.4.4
SIPLUS CMS
The System Log Viewer
Open the System Log Viewer
• Open the Main Management System and ensure that the MMS Explorer is displayed at the left side of
the Main Management System workspace.
• In order to open the System Log Viewer for the X-Tools Client, call the context menu for the “Main“ item
within the MMS Explorer and choose View System Log.
• In order to open the System Log Viewer for a connected X-Tools Server, call the context menu for the
“Main -> Servers -> YourServer“ item within the MMS Explorer and choose View System Log.
• The System Log Viewer also can be opened via the System Log Viewer button from the menu bar of the
Main Management System workspace. In this case, the last time displayed System Log Viewer for the
X-Tools Client or for the connected X-Tools Server is being opened automatically.
o The “Main” item from the MMS Explorer can be dragged into the empty System Log Viewer in order
to start viewing of the system log of the X-Tools Client.
o Any of the present “Main -> Servers -> YourServer” items from the MMS Explorer can be dragged into
the empty System Log Viewer in order to start viewing of the system log of the X-Tools Server.
• For a more detailed description of all available functionalities of the System Log Viewer, refer to the reference manual of the “Main Management System”, chapter “System Log Viewer”.
Functionality
• The System Log Settings table at the top of the System Log Viewer displays some general information
about the currently displayed log entries and allows to define filters in order to configure which system log
entries shall be displayed and which ones not.
• Within the System Log Entries table, all of the log entries from the currently chosen sources and which
match the currently configured filters are being displayed.
• The Apply button is used in order to take over the changes which have been made within the System Log
Settings table.
• In case the X-Tools Client or any of the currently connected X-Tools Servers is being dragged into a
non-empty System Log Viewer, the system log entries of the dragged item are added to the currently
displayed system log entries.
o <Shift> can be used when releasing the mouse button in order to replace the currently displayed system log entries with the system log entries of the dragged item and to determine the currently dragged
item as the one and only source for to-be-displayed system log entries.
Try it out
Open the System Log Viewer for the X-Tools Client.
The log entries of the X-Tools Client are displayed.
Change one or more of the available visualization filters.
Only the log entries which apply to the chosen filters are displayed.
Drag one of the currently connected X-Tools Servers so that its log entries are being displayed in addition to the already displayed log entries of the X-Tools Client.
The log entries of the X-Tools Client and of the chosen X-Tools Server are being displayed together.
Drag the X-Tools Client so that its log entries replace all of the currently displayed log entries.
Only the log entries of the X-Tools Client are displayed again.
Ready
At this point you know how to open system log of the X-Tools Client and of the X-Tools Server.
English
Release 2012-09
48 / 182
SIPLUS CMS X-Tools - User Manual - 01 - Introduction
6.5
SIPLUS CMS
Configuration File Locations
6.5.1
General Description
In this chapter you will learn how Configuration File locations can be used in order to switch the complete configuration of an X-Tools Server with only a few clicks from one configuration to another configuration.
Each Configuration File location contains a complete set of Interface Profiles, Device Profiles, Device Setups,
Monitoring Views, Analyzing Models, Analyzing Scripts, Storage Profiles and Loading Profiles. When a Configuration File location is added to the X-Tools Server, all of the contained configurations take into effect - according to the latest configuration, any of the contained Configuration Files can be started.
Configuration File locations can be used for various applications, e.g. in case of mobile systems which have to
be configured differently at each measurement point, in case specialized configurations are wanted for error
tracking or in case the authors of the tutorial want to provide a large range of example configurations which can
show the capabilities of X-Tools in addition to the descriptions within the tutorial.
This chapter contains the following topics:
• Adding of a Configuration File Location
• Removing of a Configuration File Location
6.5.2
Adding of a Configuration File Location
Open the DMS Explorer
• Open the Device Management System and ensure that the DMS Explorer is displayed at the left side of
the Device Management System workspace.
Functionality
• Expand the “Main -> Servers -> YourServer” branch of the DMS Explorer.
• In order to add another Configuration File location, call the context menu for the “Files“ item within the
DMS Explorer and choose Add Location….
• Within the upcoming Add Location dialog, choose any symbolic name for your new Configuration File location and specify the path to this location at the disk.
o In case the path to the location at the disk is chosen first, a default symbolic name is provided automatically.
• Press OK in order to add the specified location to the X-Tools Server.
• After another Configuration File location has been added successfully, the X-Tools Server automatically
creates all of the necessary sub-directories. In case the added Configuration File location contains some
Configuration Files already, the Configuration Files which are marked as to-be-started are being started
automatically.
• The Add Location… context menu item is available not only within the DMS Explorer but also within the
MTS Explorer, ANS Explorer and STS Explorer. As Configuration File locations are valid system-wide,
they can be added via any of the above explorer trees and they become available within all explorer trees
in case they are added via one of them.
Try it out
Add the “..\SIPLUS CMS\X-Tools\Server\User\Example Location” directory as additional Configuration
File location.
All of the Configuration Files from the example location become visible within the explorer trees of the XTools Server.
Start the Interface Profile Simulation T001 from the example location.
The according simulated devices are being added to the DMS Explorer and are visible under the Main ->
Servers -> YourServer -> Interfaces -> Simulation T001.
Start a Device Profile from the example location for one of the devices which are being simulated.
The according data are being added to the MDS Explorer.
English
Release 2012-09
49 / 182
SIPLUS CMS X-Tools - User Manual - 01 - Introduction
SIPLUS CMS
Ready
At this point you know how to add Configuration File locations to the X-Tools Server.
6.5.3
Removing of a Configuration File Location
Open the DMS Explorer
• Open the Device Management System and ensure that the DMS Explorer is displayed at the left side of
the Device Management System workspace.
Functionality
• Expand the “Main -> Servers -> YourServer -> Files” branch of the DMS Explorer.
• In order to remove an existing Configuration File location, call the context menu for any of the present
Configuration File locations within the DMS Explorer and choose Remove Location.
• After confirming of the upcoming dialog, the chosen Configuration File location is being removed from all
explorer trees of the X-Tools Server. The Configuration Files below the removed Configuration File location are being stopped by this operation.
• In addition to the Remove Location context menu item, also Delete Location is available. Where Remove
Location only removes the specified Configuration File location from the knowledge of the X-Tools
Server, Delete Location actually deletes all of the files of the location from the disk.
Try it out
Remove any of the present Configuration File locations.
All of the Configuration Files from the specified location are being removed from the explorer trees of the
X-Tools Server. All of the Configuration Files from the removed Configuration File location are being
stopped.
Ready
At this point you know how to remove and delete Configuration File locations from the X-Tools Server and from
the disk.
6.6
6.6.1
Simulated Devices and Interface Profiles
General Description
In this chapter you will learn how to attach simulated devices to the X-Tools Server via Interface Profiles for the
Simulation interface. Simulated devices are used in order to show how to use the system. For X-Tools, there is
no difference in the configuration or usage of data between simulated and real devices. Thus, all operations
which are performed on simulated devices (e.g. creation of Device Profiles, recording of measurement data,
performing of analysis, storage of data, …) are done in exactly the same way with real devices, and all functionalities of X-Tools can be tried out without any real hardware attached.
Examples of Interface Profiles are found within the example Configuration File location which is being delivered
together with X-Tools.
This chapter contains the following topics:
• Creation of a new Interface Profile for the Simulation Interface
• Opening of existing Interface Profiles
• Starting and Stopping of Interface Profiles
English
Release 2012-09
50 / 182
SIPLUS CMS X-Tools - User Manual - 01 - Introduction
6.6.2
SIPLUS CMS
Creation of a new Interface Profile for the Simulation Interface
Open the DMS Explorer
• Open the Device Management System and ensure that the DMS Explorer is displayed at the left side of
the Device Management System workspace.
Functionality
• Method 1 for the creation of a new Interface Profile:
o Within the DMS Explorer, expand the “Main -> Editors -> Interface Profile Editors” branch.
o Drag the IPE Simulation T001 with the left mouse into the empty space at the right side of the DMS
Explorer. An empty IPE Simulation T001 is opened automatically.
o Press the New button in order to create a new Interface Profile. The new Interface Profile is displayed
by the IPE Simulation T001 with default values.
o This method works in all cases, even in case there is no X-Tools Server connected at the moment. It
can be used for the creation and configuration of Interface Profiles for cases where the target X-Tools
Server is not present at the moment.
• Method 2 for the creation of a new Interface Profile:
o Within the DMS Explorer, expand the “Main -> Servers -> YourServer -> Interfaces” branch.
o Click onto the present “Simulation T001” item with the right mouse button in order to open the context
menu.
o In order to create a new Interface Profile for the currently selected interface, choose New Interface
Profile from the context menu.
o This method works only in case the target X-Tools Server is present but it is more convenient and
faster as it automatically also determines the target X-Tools Server of the new Interface Profile.
• The following screenshot shows an example of a new Interface Profile.
Figure 24: IPE Simulation T001 with a new Interface Profile
• The Interface Profile Settings table at the top of the IPE Simulation T001 displays the general file information and allows entering additional file attributes like a description and the name of the author of the file
and his company.
English
Release 2012-09
51 / 182
SIPLUS CMS X-Tools - User Manual - 01 - Introduction
SIPLUS CMS
• Within the Connections table, the to-be-simulated devices are configured. In order to configure a new device, simple choose the desired device type from the Device Type field.
• By default, the values from the other columns of the Connections table do not need to be modified.
o The Device Name and Device UIK fields can be used in order to change the default name and UIK of
each device which will be simulated.
• The Save and Save As… buttons are used in order to save the configured Interface Profile with all of its
settings. All saved Interface Profiles are shown by the DMS Explorer (“Main -> Servers -> YourServer ->
YourLocation -> Interface Profile Files” branch) and can be accessed (e.g. started, stopped, opened, …)
from there.
• For a more detailed description of all available functionalities of the IPE Simulation T001 and the other
Interface Profile Editors, refer to the reference manual of the “Device Management System”, chapter
“Interface Profile Editors”.
Try it out
Create a new Interface Profile.
Configure the simulation of one ION AnalogInput T001, two ION VIB-A T001 and one ION SIMATIC S7300 T001.
Save the Interface Profile. At the first save, the Save As dialog will pop up and offers a default file name.
Change the default file name to “Hello Interface Profile” and press OK in order to save it to the disk.
The new Interface Profile now is displayed below the “Main -> Servers -> YourServer -> YourLocation ->
Interface Profile Files” branch of the DMS Explorer.
Take a look onto the Interface Profiles which are provided via the example location (see point 6.5) in order to see various application examples about the capabilities and usage of Interface Profiles.
Ready
At this point you know how to create a new Interface Profile which can be used in order to simulate any of the
devices which are supported by the X-Tools Server.
6.6.3
Opening of existing Interface Profiles
Open the DMS Explorer
• Open the Device Management System and ensure that the DMS Explorer is displayed at the left side of
the Device Management System workspace.
Functionality
• Within the DMS Explorer, expand the “Main -> Servers -> YourServer -> YourLocation -> Interface Profile Files” branch.
• Drag one of the below Interface Profiles with the left mouse into the empty space at the right side of the
DMS Explorer. An Interface Profile Editor of proper type is opened automatically and displays the
dropped Interface Profile.
English
Release 2012-09
52 / 182
SIPLUS CMS X-Tools - User Manual - 01 - Introduction
SIPLUS CMS
Figure 25: IPE Simulation T001 with an opened Interface Profile
• The opened Interface Profile can be edited now. After editing, the Save and Save As… buttons are used
in order to save the edited Interface Profile with all of its settings.
Try it out
Open an existing Interface Profile.
Enter another device type and change the Profile Description within the Interface Profile Settings table.
Save the Interface Profile via the Save button.
The modified Interface Profile is still displayed below the “Main -> Servers -> YourServer -> YourLocation
-> Interface Profile Files” branch of the DMS Explorer.
Ready
At this point you know how to open and modify an existing Interface Profile.
English
Release 2012-09
53 / 182
SIPLUS CMS X-Tools - User Manual - 01 - Introduction
6.6.4
SIPLUS CMS
Starting and Stopping of Interface Profiles
Open the DMS Explorer
• Open the Device Management System and ensure that the DMS Explorer is displayed at the left side of
the Device Management System workspace.
Functionality
• Within the DMS Explorer, expand the “Main -> Servers -> YourServer -> YourLocation -> Interface Profile Files” branch.
• Click onto any of the present Interface Profiles with the right mouse button in order to open the context
menu.
• In order to start the currently selected Interface Profile, choose Start from the context menu.
o Up to one Interface Profile can be started at any time for each of the present interfaces of an X-Tools
Server. In case an Interface Profile is started already for an interface and the user starts another one
for the same interface, the currently running Interface Profile is stopped automatically and the other Interface Profile is being started afterwards.
o In case there is no Interface Profile being started at the moment for a certain interface, no devices
from this interface are available to the X-Tools Server. The only exception to this rule is the IEEE1394
interface, which detects the currently attached devices via Plug&Play and does not need any according Interface Profile.
• In order to stop a currently running Interface Profile, call the context menu of this Interface Profile and
choose Stop.
o In case the currently running Interface Profile is being stopped, all of its currently present devices are
disconnected and not available to the X-Tools Server any more.
• There are several conditions in which an Interface Profile can not run after it has been started, e.g. in
case the target interface is not available at the moment. When an Interface Profile can not run after it has
been started, it is being suspended and automatically resumed as soon as the error condition has disappeared.
• In case at least one Interface Profile has been started by the user, the status bar of the X-Tools Client
displays the current status of Interface Profiles via the according colored icon. The tool tip of this icon
provides detailed information about the number of currently started and suspended Interface Profiles.
o Note that the status bar always displays the status of exactly one X-Tools Server, thus also the icon
for the current status of Interface Profiles displays the status of only the currently chosen X-Tools
Server.
Try it out
Start an existing Interface Profile for the Simulation interface.
The devices which are configured within the Interface Profile are being simulated and appear below the
“Main -> Servers -> YourServer -> Interfaces -> Simulation T001” branch immediately.
Stop the currently running Interface Profile for the Simulation interface.
The simulation of devices is being stopped and all simulated devices disappear within the DMS Explorer
of the X-Tools Server.
Ready
At this point you know how to start and stop existing Interface Profiles for the Simulation interface in order to
start and stop the simulation of devices.
English
Release 2012-09
54 / 182
SIPLUS CMS X-Tools - User Manual - 01 - Introduction
6.7
SIPLUS CMS
Device Configuration and Device Profiles
6.7.1
General Description
In this chapter you will learn how to configure devices via Device Profiles. A Device Profile contains all of the
information which is needed in order to perform the measurement with a device. This information includes instructions for the target device as well as data names, normalization factors, buffer sizes, …. Multiple Device
Profiles can be created for each device, but only one Device Profile per device can be started at a time. The
started Device Profile of each device is the one whose configuration is sent to the device in order to configure it.
In addition, the data which are defined within the started Device Profile are available to all other modules of XTools via the MDS Explorer.
For each device type a specialized Device Profile Editor is provided by the X-Tools Client. The specialized
Device Profile Editor of each device type provides all of the functionality which is needed in order to edit Device Profiles as convenient as possible.
The following explanations refer to simulated devices. However, the handling of Device Profiles is identical between simulated and real devices and therefore the following operations can be applied to real devices as well.
Examples of Device Profiles are found within the example Configuration File location which is being delivered
together with X-Tools.
This chapter contains the following topics:
• Creation of a new Device Profile for an ION AnalogInput T001
• Opening of existing Device Profiles
• Starting and Stopping of Device Profiles
6.7.2
Creation of a new Device Profile for an ION AnalogInput T001
Open the DMS Explorer
• Open the Device Management System and ensure that the DMS Explorer is displayed at the left side of
the Device Management System workspace.
• Ensure that you have at least one ION AnalogInput T001 simulated below the “Main -> Servers ->
YourServer -> Interfaces -> Simulation T001” branch of the DMS Explorer.
Functionality
• Method 1 for the creation of a new Device Profile:
o Within the DMS Explorer, expand the “Main -> Editors -> Device Profile Editors” branch.
o Drag the DPE ION AnalogInput T001 with the left mouse into the empty space at the right side of the
DMS Explorer. An empty DPE ION AnalogInput T001 is opened automatically.
o Press the New button in order to create a new Device Profile. The new Device Profile is displayed by
the DPE ION AnalogInput T001 with default values.
o The new Device Profile must be told for which target device is shall be used. In order to specify a target device, either enter the name of the target device into the Target Device Name cell of the Device
Profile Settings table or Drag&Drop the desired target device from the DMS Explorer onto the Target
Device Name cell.
o This method works in all cases, even in case there is no X-Tools Server connected at the moment
and/or in case the desired target device is not available at the moment. It can be used for the creation
and configuration of Device Profiles for cases where the target X-Tools Server and/or the target device are not present at the moment.
English
Release 2012-09
55 / 182
SIPLUS CMS X-Tools - User Manual - 01 - Introduction
SIPLUS CMS
• Method 2 for the creation of a new Device Profile:
o Within the DMS Explorer, expand the “Main -> Servers -> YourServer -> Interfaces -> Simulation
T001” branch.
o Click onto a present ION AnalogInput T001 with the right mouse button in order to open the context
menu.
o In order to create a new Device Profile for the currently selected device, choose New Device Profile
from the context menu.
o This method works only in case the target X-Tools Server and the target device are present but it is
more convenient and faster as it automatically also determines the target X-Tools Server and the target device of the new Device Profile.
• The following screenshot shows an example of a new Device Profile.
Figure 26: DPE ION AnalogInput T001 with a new Device Profile
• The Device Profile Settings table at the top of the DPE ION AnalogInput T001 displays the general file
information and allows entering additional file attributes like a description and the name of the author of
the file and his company. In addition, Device Profile related settings like the target device name, the data
name prefix or the data supervision time are configured via the Device Profile Settings table.
• Within the Device Profile Data table, the 8 input channels of the ION AnalogInput T001 can be configured.
There, all of the information about each channel is being defined, like the data name, the data description,
the normalization, the buffer size or the record mode.
• Within the Device Profile Filters table, the filter coefficients of all 8 input channels can be configured.
• Within the Device Profile Parameters table, the sample rates of all 8 input channels can be configured.
• The default values and settings which are provided for a new Device Profile can be used for real measurement already and without any modifications. Depending to each measurement task, a modification of
the default values and settings may be necessary or not.
English
Release 2012-09
56 / 182
SIPLUS CMS X-Tools - User Manual - 01 - Introduction
SIPLUS CMS
• The Save and Save As… buttons are used in order to save the configured Device Profile with all of its
settings. All saved Device Profiles are shown by the DMS Explorer (“Main -> Servers -> YourServer ->
YourLocation -> Device Profile Files” branch) and can be accessed (e.g. started, stopped, opened, …)
from there.
• For a more detailed description of all available functionalities of the DPE ION AnalogInput T001 and the
other Device Profile Editors, refer to the reference manual of the “Device Management System”, chapter
“Device Profile Editors”.
Try it out
Create a new Device Profile.
Change some names and descriptions within the Device Profile Data table.
Save the Device Profile. At the first save, the Save As dialog will pop up and offers a default file name.
Change the default file name to “Hello Device Profile” and press OK in order to save it to the disk.
The new Device Profile now is displayed below the “Main -> Servers -> YourServer -> YourLocation ->
Device Profile Files” branch of the DMS Explorer.
Take a look onto the Device Profiles which are provided via the example location (see point 6.5) in order
to see various application examples about the capabilities and usage of Device Profiles.
Ready
At this point you know how to create a new Device Profile which can be used in order to configure an ION
AnalogInput T001.
English
Release 2012-09
57 / 182
SIPLUS CMS X-Tools - User Manual - 01 - Introduction
6.7.3
SIPLUS CMS
Opening of existing Device Profiles
Open the DMS Explorer
• Open the Device Management System and ensure that the DMS Explorer is displayed at the left side of
the Device Management System workspace.
Functionality
• Within the DMS Explorer, expand the “Main -> Servers -> YourServer -> YourLocation -> Device Profile
Files” branch.
• Drag one of the below Device Profiles with the left mouse into the empty space at the right side of the
DMS Explorer. A Device Profile Editor of proper type is opened automatically and displays the dropped
Device Profile.
Figure 27: DPE ION AnalogInput T001 with an opened Device Profile
• The opened Device Profile can be edited now. After editing, the Save and Save As… buttons are used in
order to save the edited Device Profile with all of its settings.
Try it out
Open an existing Device Profile.
Enter another Target Device Name and change the Profile Description within the Device Profile Settings
table.
Save the Device Profile via the Save button.
The modified Device Profile is still displayed below the “Main -> Servers -> YourServer -> YourLocation > Device Profile Files” branch of the DMS Explorer.
Ready
At this point you know how to open and modify an existing Device Profile.
English
Release 2012-09
58 / 182
SIPLUS CMS X-Tools - User Manual - 01 - Introduction
6.7.4
SIPLUS CMS
Starting and Stopping of Device Profiles
Open the DMS Explorer
• Open the Device Management System and ensure that the DMS Explorer is displayed at the left side of
the Device Management System workspace.
• Ensure that you have at least one ION AnalogInput T001 simulated below the “Main -> Servers ->
YourServer -> Interfaces -> Simulation T001” branch of the DMS Explorer.
Functionality
• Within the DMS Explorer, expand the “Main -> Servers -> YourServer -> YourLocation -> Device Profile
Files” branch.
• Click onto any of the present Device Profiles with the right mouse button in order to open the context
menu.
• In order to start the currently selected Device Profile, choose Start from the context menu.
o Up to one Device Profile can be started at any time for each of the present devices of an X-Tools
Server. In case a Device Profile is started already for a device and the user starts another one for the
same device, the currently running Device Profile is stopped automatically and the other Device Profile
is being started afterwards.
o In case there is no Device Profile being started at the moment for a certain device, the device is not
configured and does not deliver any measurement data to the X-Tools Server.
• The configured data of each started Device Profile is found within the MDS Explorer below its “Main ->
Servers -> YourServer -> Online Data -> All Online Data” branch. From there, the data can be moved to
all systems of X-Tools for further processing via Drag&Drop.
• In order to stop a currently running Device Profile, call the context menu of this Device Profile and choose
Stop.
o In case the currently running Device Profile is being stopped, the device stops to deliver further measurement data to the X-Tools Server.
• There are several conditions in which a Device Profile can not run after it has been started, e.g. in case
the target device is not available at the moment or in case the configured data names are already in use.
When a Device Profile can not run after it has been started, it is being suspended and automatically resumed as soon as the error condition has disappeared.
• In case at least one Device Profile has been started by the user, the status bar of the X-Tools Client displays the current status of Device Profiles via the according colored icon. The tool tip of this icon provides
detailed information about the number of currently started and suspended Device Profiles.
o Note that the status bar always displays the status of exactly one X-Tools Server, thus also the icon
for the current status of Device Profiles displays the status of only the currently chosen X-Tools
Server.
Try it out
Start the Interface Profile Simulation T001 for the Simulation interface.
Start an existing Device Profile for the simulated ION AnalogInput T001.
The data which has been configured within the started Device Profile becomes available within the MDS
Explorer.
Stop the currently running Device Profile for the simulated ION AnalogInput T001.
The data which has been configured within the started Device Profile is being removed from the MDS
Explorer.
Ready
At this point you know how to start and stop existing Device Profiles in order to start and stop the measurement
of data via a device.
English
Release 2012-09
59 / 182
SIPLUS CMS X-Tools - User Manual - 01 - Introduction
6.8
SIPLUS CMS
Visualization of Online Data and Monitoring Views
6.8.1
General Description
In this chapter you will learn how to visualize online data from the MDS Explorer with the Monitoring System
using the most basic functionalities and how to create and maintain Monitoring Views. A Monitoring View contains the exact configuration of the visualized curves, including all settings. It is used in order to save all relevant
settings and to restore them with a single Drag&Drop operation.
Examples of Monitoring Views are found within the example Configuration File location which is being delivered
together with X-Tools.
This chapter contains the following topics:
• Creation of a new Monitoring View
• Opening of existing Monitoring Views
• Starting and Stopping of Monitoring Views
6.8.2
Creation of a new Monitoring View
Open the MTS Explorer
• Open the Monitoring System and ensure that the MTS Explorer is displayed at the left side of the Monitoring System workspace.
• Ensure that you have several data available below the “Main -> Servers -> YourServer -> Online Data ->
All Online Data” branch of the MDS Explorer.
Functionality
• Method 1 for the creation of a new Monitoring View:
o Within the MTS Explorer, expand the “Main -> Editors -> Monitoring View Editors” branch.
o Drag the MVE Standard T001 with the left mouse into the empty space at the right side of the MTS
Explorer. An empty MVE Standard T001 is opened automatically.
o Press the New button in order to create a new Monitoring View. The new Monitoring View is displayed
by the MVE Standard T001 with default values. It does not contain any charts yet.
o Within the MTS Explorer, expand the “Main -> Editors -> Monitoring Charts” branch.
o Drag the MTC yt T001 with the left mouse into the opened Monitoring View. An empty MTC yt T001 is
opened automatically.
In case the MTC yt T001 is dragged from the MTS Explorer into the empty Monitoring System,
the MVE Standard T001 is opened automatically and also opens an empty MTC yt T001.
o This method works in all cases, even in case there is no X-Tools Server connected at the moment
and/or in case the desired target data is not available at the moment. It can be used for the creation
and pre-configuration of Monitoring Views for cases where the target X-Tools Server and/or the target
data are not present at the moment.
• Method 2 for the creation of a new Monitoring View:
o Within the MDS Explorer, expand the “Main -> Servers -> YourServer -> Online Data -> All Online
Data” branch.
o Drag&Drop the desired target data into the empty Monitoring System. The MVE Standard T001 is
opened automatically and also opens the proper Monitoring Chart. In addition, the dropped data is
added to and visualized by the opened Monitoring Chart automatically.
o This method works only in case the target X-Tools Server and the target data are present but it is
more convenient and faster as it automatically opens all windows.
English
Release 2012-09
60 / 182
SIPLUS CMS X-Tools - User Manual - 01 - Introduction
SIPLUS CMS
• The following screenshot shows an example of a new Monitoring View.
Figure 28: MVE Standard T001 with a new Monitoring View
• The Monitoring View Settings table at the top of the MVE Standard T001 displays the general file information and allows entering additional file attributes like a description and the name of the author of the file
and his company.
• Within the Monitoring View Parameters table, additional parameters like the Time Domain can be configured.
• In order to visualize any of the currently available online data, drag the desired data from the “Main ->
Servers -> YourServer -> Online Data” branch of the MDS Explorer into an empty MVE Standard T001
or into an opened Monitoring Chart. Up to 32 data can be put into one Monitoring Chart.
• Several mechanisms are available for the changing of the visualization of the displayed data:
o When the left mouse button is being pressed, zooming can be performed.
Press the left mouse button at an axis (e.g. y-axis, t-axis or x-axis) and move the mouse cursor in
order to shrink or stretch the scaling.
Press the left mouse button within the curve area and move the mouse cursor in order to define the
area into which it shall be zoomed. <Shift> or <x> can be pressed in order to zoom only into xdirection, <Ctrl> or <y> can be pressed in order to zoom only into y-direction.
o When the right mouse button is being pressed, shifting can be performed.
Press the right mouse button at an axis (e.g. y-axis, t-axis or x-axis) and move the mouse cursor in
order to move the scaling into the direction of the mouse move. t-axes of running online data visualizations can not be shifted because they always display the current time at their right border. In
order to shift the scaling of a t-axis which contains running online data, the visualization must be
paused via the toolbar first.
Press the right mouse button within the curve area and move the mouse cursor in order to move
the scaling of all present axes into the direction of the mouse move. <Shift> or <x> can be pressed
in order to move only into x-direction, <Ctrl> or <y> can be pressed in order to move only into ydirection. t-axes of running online data visualizations can not be moved because they always display the current time at their right border.
English
Release 2012-09
61 / 182
SIPLUS CMS X-Tools - User Manual - 01 - Introduction
SIPLUS CMS
• Via the tool bar in the right corner of each Monitoring Chart, basic functionalities are available:
o the cursors can be turned on/off
o the last zooming, shifting and scrolling operations can be undone/redone
o the visualization can be paused/continued
• Additional Monitoring Charts can be dragged from the MTS Explorer and can be placed into the
opened Monitoring View. Data from the MDS Explorer can be put into the additional Monitoring Charts
like they can be put into the first opened Monitoring Chart and the present Monitoring Charts can be
arranged within their Monitoring View like the other windows can be arranged within X-Tools.
• The Save and Save As… buttons are used in order to save the configured Monitoring View with all of its
settings. All saved Monitoring Views are shown by the MTS Explorer (“Main -> Servers -> YourServer ->
YourLocation -> Monitoring View Files” branch) and can be accessed (e.g. opened, …) from there.
• For a more detailed description of all available functionalities of Monitoring View Editors and Monitoring Charts, refer to the reference manual of the “Monitoring System”, chapter “Monitoring View Editors”
and chapter “Monitoring Charts”.
Try it out
Create a new Monitoring View.
Drag some online data from the MDS Explorer into the Monitoring View in order to visualize the data
curves.
Pause the visualization, turn the cursors on and take a look onto the displayed measurement values.
Continue the visualization, zoom into the visualization, shrink and stretch the axes scaling and use the
undo/redo buttons. Repeat these operations in random order in order to adjust the visualization to the
needs of the current application.
Open two additional Monitoring Charts within the Monitoring View and start to visualize data also with
the two additional Monitoring Charts.
Save the Monitoring View. At the first save, the Save As dialog will pop up and offers a default file name.
Change the default file name to “Hello Monitoring View” and press OK in order to save it to the disk.
The new Monitoring View now is displayed below the “Main -> Servers -> YourServer -> YourLocation ->
Monitoring View Files” branch of the MTS Explorer.
Take a look onto the Monitoring Views which are provided via the example location (see point 6.5) in order to see various application examples about the capabilities and usage of Monitoring Views.
Ready
At this point you know how to create a new Monitoring View which can be used in order to visualize any of the
data which is available from the MDS Explorer.
English
Release 2012-09
62 / 182
SIPLUS CMS X-Tools - User Manual - 01 - Introduction
6.8.3
SIPLUS CMS
Opening of existing Monitoring Views
Open the MTS Explorer
• Open the Monitoring System and ensure that the MTS Explorer is displayed at the left side of the Monitoring System workspace.
Functionality
• Within the MTS Explorer, expand the “Main -> Servers -> YourServer -> YourLocation -> Monitoring
View Files” branch.
• Drag one of the below Monitoring Views with the left mouse into the empty space at the right side of the
MTS Explorer. A Monitoring View Editor of proper type is opened automatically and displays the
dropped Monitoring View.
Figure 29: MVE Standard T001 with an opened Monitoring View
• The opened Monitoring View can be edited now and can be used for any visualization of data. After editing, the Save and Save As… buttons are used in order to save the edited Monitoring View with all of its
settings.
Try it out
Open an existing Monitoring View.
Add additional data to the present Monitoring Charts and change the scaling of some of the present
axes.
Save the Monitoring View via the Save button.
The modified Monitoring View is still displayed below the “Main -> Servers -> YourServer -> YourLocation
-> Monitoring View Files” branch of the MTS Explorer.
Ready
At this point you know how to open and modify an existing Monitoring View.
English
Release 2012-09
63 / 182
SIPLUS CMS X-Tools - User Manual - 01 - Introduction
6.8.4
SIPLUS CMS
Starting and Stopping of Monitoring Views
Monitoring Views can not be started or stopped. Instead, each Monitoring View starts to visualize the configured
data according to the configured settings immediately when it is being opened and stops the visualization immediately when it is being closed.
6.9
Storage of online Data via Storage Profiles
6.9.1
General Description
In this chapter you will learn how to store online data from the MDS Explorer with the Storage System via
Storage Profiles. A Storage Profile for online data contains all of the information which is needed in order to
perform the storage of online data to a storage location. This information includes, among others, the names of
the to-be-stored data, paths, trigger settings and clean-up settings. Multiple Storage Profiles can be started and
running simultaneously at any time.
The online data which is being stored by a running Storage Profile can be loaded as offline data afterwards via
an Offline Data Loader.
Examples of Storage Profiles are found within the example Configuration File location which is being delivered
together with X-Tools. See also point 6.15 for information about how to store offline data via Storage Profiles.
This chapter contains the following topics:
• Creation of a new Storage Profile for online Data
• Opening of existing Storage Profiles
• Starting and Stopping of Storage Profiles
6.9.2
Creation of a new Storage Profile for online Data
Open the STS Explorer
• Open the Storage System and ensure that the STS Explorer is displayed at the left side of the Storage
System workspace.
• Ensure that you have several data available below the “Main -> Servers -> YourServer -> Online Data ->
All Online Data” branch of the MDS Explorer.
Functionality
• Method 1 for the creation of a new Storage Profile:
o Within the STS Explorer, expand the “Main -> Editors -> Storage Profile Editors” branch.
o Drag the SPE Binary T001 with the left mouse into the empty space at the right side of the STS Explorer. An empty SPE Binary T001 is opened automatically.
o Press the New button in order to create a new Storage Profile. The new Storage Profile is displayed
by the SPE Binary T001 with default values.
o This method works in all cases, even in case there is no X-Tools Server connected at the moment. It
can be used for the creation and configuration of Storage Profiles for cases where the target X-Tools
Server is not present at the moment.
• Method 2 for the creation of a new Storage Profile:
o Within the STS Explorer, expand the “Main -> Servers -> YourServer -> Libraries -> Storage Process
Modules” branch.
o Click onto the present STE SPM Binary T001 with the right mouse button in order to open the context
menu.
o In order to create a new Storage Profile for the storage format “Binary T001”, choose New Storage
Profile from the context menu.
o This method works only in case the target X-Tools Server is present but it is more convenient and
faster as it automatically also determines the target X-Tools Server of the new Storage Profile.
English
Release 2012-09
64 / 182
SIPLUS CMS X-Tools - User Manual - 01 - Introduction
SIPLUS CMS
• Method 3 for the creation of a new Storage Profile:
o Within the MDS Explorer, expand the “Main -> Servers -> YourServer -> Online Data -> All Online
Data” branch.
o Drag&Drop the desired target data into the empty Storage System. The SPE Binary T001 is opened
automatically, a new Storage Profile is being initialized with default values and the dropped data is
added to Data table. As online data is being dropped, the Time Domain cell within the Storage Profile
Parameters table is being set to “Online Data with absolute Timestamps” automatically.
o This method works only in case the target X-Tools Server and the target data are present but it is
more convenient and faster as it automatically opens all windows.
• The following screenshot shows an example of a new Storage Profile.
Figure 30: SPE Binary T001 with a new Storage Profile
• The Storage Profile Settings table at the top of the SPE Binary T001 displays the general file information
and allows entering additional file attributes like a description and the name of the author of the file and
his company.
• Within the Storage Profile Parameters table, the time domain of the source data and the target location
for the to-be-created offline data files are specified. Any of the already defined offline data file locations
can be chosen from the combo box of the Data Storage Location cell. The “…” entry from the Data Storage Location cell of the Storage Profile Parameters table can be used in order to define a new offline data
file location.
• Within the Subdirectory Creation table, the granularity of the levels of the to-be-created directories can be
configured.
• Within the File Splitting table, the mode and the parameters of the file splitting can be configured.
• Within the Start Event table, the mode and the parameters of the start event can be configured. The storing of the configured data can be started in dependence to the current value of a data, date based or
timer based.
• Within the Stop Event table, the mode and the parameters of the stop event can be configured. The storing of the configured data can be stopped in dependence to the current value of a data, date based or
timer based.
• Within the Pre Trigger table, the mode and the parameters of the pre trigger can be configured.
• Within the Post Trigger table, the mode and the parameters of the post trigger can be configured.
English
Release 2012-09
65 / 182
SIPLUS CMS X-Tools - User Manual - 01 - Introduction
SIPLUS CMS
• Within the Disk Clean-Up table, the mode and the parameters of the disk clean-up can be configured. The
clean-up of files can be based on the age of files, it can limit the used memory or it can assure some remaining memory.
• Within the Disk Limitation table, the mode and the parameters of the disk limitation can be configured. In
case the disk limitation is enabled, the Storage Profile will leave the specified absolute or relative amount
of memory free at the hard disk.
• Within the Data table, the to-be-stored data are listed. In order to add an additional data which shall be
stored, simple enter the name of the data into the Name cell of the last line. Alternatively, the to-be-stored
data also can be dragged from the MDS Explorer into the Name cell of the last line.
• The Storage Mode and Storage Parameters cells of each to-be-stored data can be used in order to configure the intervals in which the data shall be stored.
• The Save and Save As… buttons are used in order to save the configured Storage Profile with all of its
settings. All saved Storage Profiles are shown by the STS Explorer (“Main -> Servers -> YourServer ->
YourLocation -> Storage Profile Files” branch) and can be accessed (e.g. started, stopped, opened, …)
from there.
• For a more detailed description of all available functionalities of the SPE Binary T001, refer to the reference manual of the “Storage System”, chapter “SPE Binary T001”.
Try it out
Create a new Storage Profile.
Specify the desired data storage location.
Change the file splitting interval to 1 minute.
Add some data names to the Data table. Specify different storage modes for each of the to-be-stored
data.
Save the Storage Profile. At the first save, the Save As dialog will pop up and offers a default file name.
Change the default file name to “Hello Storage Profile for online Data” and press OK in order to save it to
the disk.
The new Storage Profile now is displayed below the “Main -> Servers -> YourServer -> YourLocation ->
Storage Profile Files” branch of the STS Explorer.
Take a look onto the Storage Profiles which are provided via the example location (see point 6.5) in order
to see various application examples about the capabilities and usage of Storage Profiles.
Ready
At this point you know how to create a new Storage Profile which can be used in order to store online data to
the disk.
6.9.3
Opening of existing Storage Profiles
Open the STS Explorer
• Open the Storage System and ensure that the STS Explorer is displayed at the left side of the Storage
System workspace.
Functionality
• Within the STS Explorer, expand the “Main -> Servers -> YourServer -> YourLocation -> Storage Profile
Files” branch.
• Drag one of the below Storage Profiles with the left mouse into the empty space at the right side of the
STS Explorer. A Storage Profile Editor of proper type is opened automatically and displays the dropped
Storage Profile.
English
Release 2012-09
66 / 182
SIPLUS CMS X-Tools - User Manual - 01 - Introduction
SIPLUS CMS
Figure 31: SPE Binary T001 with an opened Storage Profile
• The opened Storage Profile can be edited now. After editing, the Save and Save As… buttons are used in
order to save the edited Storage Profile with all of its settings.
Try it out
Open an existing Storage Profile.
Enter another storage location and change the Profile Description within the Storage Profile Settings table.
Save the Storage Profile via the Save button.
The modified Storage Profile is still displayed below the “Main -> Servers -> YourServer -> YourLocation > Storage Profile Files” branch of the STS Explorer.
Ready
At this point you know how to open and modify an existing Storage Profile.
English
Release 2012-09
67 / 182
SIPLUS CMS X-Tools - User Manual - 01 - Introduction
6.9.4
SIPLUS CMS
Starting and Stopping of Storage Profiles
Open the STS Explorer
• Open the Storage System and ensure that the STS Explorer is displayed at the left side of the Storage
System workspace.
• Ensure that you have several data available below the “Main -> Servers -> YourServer -> Online Data ->
All Online Data” branch of the MDS Explorer.
Functionality
• Within the STS Explorer, expand the “Main -> Servers -> YourServer -> YourLocation -> Storage Profile
Files” branch.
• Click onto any of the present Storage Profiles with the right mouse button in order to open the context
menu.
• In order to start the currently selected Storage Profile, choose Start from the context menu.
o Multiple Storage Profiles can be running simultaneously and without any dependencies between each
other.
• The stored data of each started Storage Profile is found at the specified data storage location. From
there, the offline data can be loaded at any later point in time via the according Offline Data Loader.
• In order to stop a currently running Storage Profile, call the context menu of this Storage Profile and
choose Stop.
• There are several conditions in which a Storage Profile can not run after it has been started, e.g. in case
the source data is not available at the moment or in case the configured data storage location can not be
accessed. When a Storage Profile can not run after it has been started, it is being suspended and automatically resumed as soon as the error condition has disappeared.
• In case at least one Storage Profile has been started by the user, the status bar of the X-Tools Client
displays the current status of Storage Profiles via the according, colored icon. The tool tip of this icon provides detailed information about the number of currently started and suspended Storage Profiles.
o Note that the status bar always displays the status of exactly one X-Tools Server, thus also the icon
for the current status of Storage Profiles displays the status of only the currently chosen X-Tools
Server.
Try it out
Start an existing Storage Profile. Ensure that the configured, to-be-stored data is available within the MDS
Explorer.
The data which has been configured within the started Storage Profile is being stored to the specified
data storage location.
Stop the currently running Storage Profile.
All of the currently opened offline data files are being closed.
Ready
At this point you know how to start and stop existing Storage Profiles in order to start and stop the storing of
online data into offline data files.
English
Release 2012-09
68 / 182
SIPLUS CMS X-Tools - User Manual - 01 - Introduction
6.10
SIPLUS CMS
Loading of Data and Loading Profiles
6.10.1
General Description
In this chapter you will learn how to load offline data from the disk with the Storage System with a simple
method and via Loading Profiles. A Loading Profile contains all of the information which is needed in order to
load data from a storage location. This information includes, among others, the names of the to-be-loaded data,
the desired loading intervals and the desired period of time.
Examples of Loading Profiles are found within the example Configuration File location which is being delivered
together with X-Tools.
This chapter contains the following topics:
• Simple Loading of Offline Data
• Creation of a new Loading Profile
• Opening of existing Loading Profiles
• Starting and Stopping of Loading Profiles
• Advanced Loading of Offline Data
6.10.2
Simple Loading of Offline Data
Open the STS Explorer
• Open the Storage System and ensure that the STS Explorer is displayed at the left side of the Storage
System workspace.
Functionality
• Method 1 for starting of the simple loading of offline data:
o Within the MDS Explorer, expand the “Main -> Servers -> YourServer” branch.
o Click onto the present Offline Data branch with the right mouse button in order to open the context
menu.
o In order to open the ODL Standard T001, choose Load Offline Data from the context menu. The ODL
Standard T001 is opened and its Offline Data Files tree automatically displays the available offline
data file locations of the X-Tools Server from which the context menu has been called.
• Method 2 for starting of the simple loading of offline data:
o Within the STS Explorer, expand the “Main -> Editors -> Offline Data Loaders” branch.
o Drag the ODL Standard T001 with the left mouse into the empty space at the right side of the STS
Explorer. An empty ODL Standard T001 is opened automatically.
o Drag the X-Tools Server whose data shall be loaded into the empty ODL Standard T001. The Offline
Data Files tree automatically displays the available offline data file locations of the dropped X-Tools
Server.
• Method 3 for starting of the simple loading of offline data:
o Within the STS Explorer, expand the “Main -> Servers -> YourServer -> Libraries -> Storage Process
Modules” branch.
o Click onto any of the present Storage Process Modules with the right mouse button in order to open
the context menu.
o In order to open the ODL Standard T001, choose Load Offline Data from the context menu. The ODL
Standard T001 is opened and its Offline Data Files tree automatically displays the available offline
data file locations of the X-Tools Server from which the context menu has been called.
English
Release 2012-09
69 / 182
SIPLUS CMS X-Tools - User Manual - 01 - Introduction
SIPLUS CMS
• The following screenshot shows an example of an opened ODL Standard T001.
Figure 32: ODL Standard T001 with some Offline Data Files
• The Offline File Locations table at the top of the ODL Standard T001 displays the symbolic names and
absolute paths of the available offline data file locations.
• The CM2000 Date Structure table allows to specify the depth of the date structure which shall be shown
for CMS2000 files.
• The Offline Data Files tree displays the available offline data file locations together with all of the offline
data files and directories which are present below the offline data file location.
• The contents of the Offline Data Files tree can be browsed for the to-be-loaded offline data by expanding
and collapsing the displayed directories. In order to load some offline data, the context menu can be
called above any file or directory. It also is possible to select multiple files or multiple directories simultaneously and to load their information at once.
o The Append context menu item can be used in order to append the currently selected files/directories
to the already loaded parts of offline data.
o The Overwrite context menu item can be used in order to overwrite the already loaded parts of offline
data with the currently selected files/directories.
o The Export context menu item can be used in order to export the currently selected files/directories.
The exported files are found in the default offline data file location.
o Additional information about the Advanced Append…, Advanced Overwrite… and Advanced Export…
context menu items is found later in this document (see point 6.10.6).
• The ODL Standard T001 supports to add and to use offline file locations of different type. In addition to
X-Tools-generated offline data files (*.sdf.xts) also the database files from the CMS2000 system
(*.cmsdb), WAVE files (*.wav) and CSV files (*.csv) can be loaded.
• While the appending, overwriting or exporting of the offline data is going on, the Loading Progress or
Export Progress dialog is being displayed. The Cancel button can be used in order to cancel any ongoing loading or export operation.
English
Release 2012-09
70 / 182
SIPLUS CMS X-Tools - User Manual - 01 - Introduction
SIPLUS CMS
Figure 33: Loading Progress Dialog
• Each loaded offline data is displayed by the MDS Explorer below its “Main -> Servers -> YourServer ->
Offline Data -> All Offline Data” branch. From there, it can be dragged into the other systems of X-Tools
for further analysis and visualization tasks.
• For a more detailed description of all available functionalities of the ODL Standard T001, refer to the reference manual of the “Storage System”, chapter “ODL Standard T001”.
Try it out
Open the ODL Standard T001 for the local X-Tools Server.
Browse your offline data file locations for already stored offline data files.
Load some offline data files and append additional periods of time to the first loaded data afterwards.
The loaded offline data is being displayed within the MDS Explorer.
Overwrite the already loaded offline data with another period of time of the data.
The information within the MDS Explorer is being updated accordingly.
Export some of the present offline data files.
According export files are being created and can be opened with other applications.
Ready
At this point you know how to use the simple mechanisms of the ODL Standard T001 in order to load offline
data files which have been stored to disk previously.
6.10.3
Creation of a new Loading Profile
Open the STS Explorer
• Open the Storage System and ensure that the STS Explorer is displayed at the left side of the Storage
System workspace.
• Ensure that you have several data available below the “Main -> Servers -> YourServer -> Online Data ->
All Online Data” branch of the MDS Explorer.
Functionality
• Method 1 for the creation of a new Loading Profile:
o Within the STS Explorer, expand the “Main -> Editors -> Loading Profile Editors” branch.
o Drag the LPE Standard T001 with the left mouse into the empty space at the right side of the STS
Explorer. An empty LPE Standard T001 is opened automatically.
o Press the New button in order to create a new Loading Profile. The new Loading Profile is displayed
by the LPE Standard T001 with default values.
o This method works in all cases, even in case there is no X-Tools Server connected at the moment. It
can be used for the creation and configuration of Loading Profiles for cases where the target X-Tools
Server is not present at the moment.
English
Release 2012-09
71 / 182
SIPLUS CMS X-Tools - User Manual - 01 - Introduction
SIPLUS CMS
• The following screenshot shows an example of a new Loading Profile.
Figure 34: LPE Standard T001 with a new Loading Profile
• The Loading Profile Settings table at the top of the LPE Standard T001 displays the general file information and allows entering additional file attributes like a description and the name of the author of the file
and his company.
• Within the Loading Profile Parameters table, the to-be-used configuration can be configured.
o Choose “Use included Data List” in order to use the configuration from the Included Data table.
o Choose “Use excluded Data List” in order to use the configuration from the Excluded Data table.
o Choose “Use default Time” in order to apply the settings from the Default Time Configuration table to
all of the data which are being loaded.
o Choose “Use individual Times” in order to allow individual configuration of the to-be-loaded time interval for each data from the Included Data table.
• Within the Default Time Configuration table, default time interval for loading of offline data can be configured.
• Within the Included Data table, the data which shall be loaded are listed. Data which is present within the
directory that is being loaded but is not present within the Included Data table is not being loaded in case
“Use included Data List” is being chosen.
o In order to add an additional data which shall be loaded, simple enter the name of the data into the
Name cell of the last line. Alternatively, the to-be-loaded data also can be dragged from the MDS Explorer into the Name cell of the last line.
o The Loading Mode and Loading Parameters cells of each to-be-loaded data can be used in order to
configure the intervals in which the data shall be loaded.
o When an entry of the Included Data table is selected, the Data Time Configuration table displays its
current time configuration and allows editing it.
• Within the Excluded Data table, the data which shall not be loaded are listed. Data which is present within
the Excluded Data table is not being loaded in case “Use excluded Data List” is being chosen.
English
Release 2012-09
72 / 182
SIPLUS CMS X-Tools - User Manual - 01 - Introduction
SIPLUS CMS
• The Save and Save As… buttons are used in order to save the configured Loading Profile with all of its
settings. All saved Loading Profiles are shown by the STS Explorer (“Main -> Servers -> YourServer ->
YourLocation -> Loading Profile Files” branch) and can be accessed (e.g. opened, …) from there.
• For a more detailed description of all available functionalities of the LPE Standard T001, refer to the reference manual of the “Storage System”, chapter “LPE Standard T001”.
Try it out
Create a new Loading Profile.
Specify the data which shall be included during the loading.
Change the loading mode of some data so that only 1 value per second is being loaded.
Change the time configuration of some data so that only 10 seconds of the data are being loaded.
Save the Loading Profile. At the first save, the Save As dialog will pop up and offers a default file name.
Change the default file name to “Hello Loading Profile” and press OK in order to save it to the disk.
The new Loading Profile now is displayed below the “Main -> Servers -> YourServer -> YourLocation ->
Loading Profile Files” branch of the STS Explorer.
Take a look onto the Loading Profiles which are provided via the example location (see point 6.5) in order
to see various application examples about the capabilities and usage of Loading Profiles.
Ready
At this point you know how to create a new Loading Profile which can be used in order to load offline data from
the disk.
English
Release 2012-09
73 / 182
SIPLUS CMS X-Tools - User Manual - 01 - Introduction
6.10.4
SIPLUS CMS
Opening of existing Loading Profiles
Open the STS Explorer
• Open the Storage System and ensure that the STS Explorer is displayed at the left side of the Storage
System workspace.
Functionality
• Within the STS Explorer, expand the “Main -> Servers -> YourServer -> YourLocation -> Loading Profile
Files” branch.
• Drag one of the below Loading Profiles with the left mouse into the empty space at the right side of the
STS Explorer. A Loading Profile Editor of proper type is opened automatically and displays the
dropped Loading Profile.
Figure 35: LPE Standard T001 with an opened Loading Profile
• The opened Loading Profile can be edited now. After editing, the Save and Save As… buttons are used
in order to save the edited Loading Profile with all of its settings.
Try it out
Open an existing Loading Profile.
Enter some additional data which shall be loaded and change the Profile Description within the Loading
Profile Settings table.
Save the Loading Profile via the Save button.
The modified Loading Profile is still displayed below the “Main -> Servers -> YourServer -> YourLocation > Loading Profile Files” branch of the STS Explorer.
Ready
At this point you know how to open and modify an existing Loading Profile.
English
Release 2012-09
74 / 182
SIPLUS CMS X-Tools - User Manual - 01 - Introduction
6.10.5
SIPLUS CMS
Starting and Stopping of Loading Profiles
Loading Profiles can not be started or stopped. Instead, Loading Profiles are being used by Offline Data Loaders for their advanced append, overwrite and export operations.
6.10.6
Advanced Loading of Offline Data
Open the STS Explorer
• Open the Storage System and ensure that the STS Explorer is displayed at the left side of the Storage
System workspace.
Functionality
• Like the simple loading of offline data, also the advanced loading of offline data uses the ODL Standard
T001 for the actual loading. Opening of the ODL Standard T001 is identical no matter whether the simple
or the advanced mechanisms for loading of offline data are going to be used.
• Method 1 for starting of the advanced loading of offline data:
o Within the MDS Explorer, expand the “Main -> Servers -> YourServer” branch.
o Click onto the present Offline Data branch with the right mouse button in order to open the context
menu.
o In order to open the ODL Standard T001, choose Load Offline Data from the context menu. The ODL
Standard T001 is opened and its Offline Data Files tree automatically displays the available offline
data file locations of the X-Tools Server from which the context menu has been called.
• Method 2 for starting of the advanced loading of offline data:
o Within the STS Explorer, expand the “Main -> Editors -> Offline Data Loaders” branch.
o Drag the ODL Standard T001 with the left mouse into the empty space at the right side of the STS
Explorer. An empty ODL Standard T001 is opened automatically.
o Drag the X-Tools Server whose data shall be loaded into the empty ODL Standard T001. The Offline
Data Files tree automatically displays the available offline data file locations of the dropped X-Tools
Server.
• Method 3 for starting of the advanced loading of offline data:
o Within the STS Explorer, expand the “Main -> Servers -> YourServer -> Libraries -> Storage Process
Modules” branch.
o Click onto the present STE SPM Binary T001 with the right mouse button in order to open the context
menu.
o In order to open the SPE Binary T001, choose Load Offline Data from the context menu. The ODL
Standard T001 is opened and its Offline Data Files tree automatically displays the available offline
data file locations of the X-Tools Server from which the context menu has been called.
English
Release 2012-09
75 / 182
SIPLUS CMS X-Tools - User Manual - 01 - Introduction
SIPLUS CMS
• The following screenshot shows an example of an opened ODL Standard T001.
Figure 36: ODL Standard T001 with some Offline Data Files
• The Offline File Locations table at the top of the ODL Standard T001 displays the symbolic names and
absolute paths of the available offline data file locations.
• The Offline Data Files tree displays the available offline data file locations together with all of the offline
data files and directories which are present below the offline data file location.
• The contents of the Offline Data Files tree can be browsed for the to-be-loaded offline data by expanding
and collapsing the displayed directories. In order to load some offline data, the context menu can be
called above any file or directory. It also is possible to select multiple files or multiple directories simultaneously and to load their information at once.
o The Advanced Append… context menu item can be used in order to call the Advanced Append dialog for the currently selected files/directories. Within the Advanced Append dialog, various settings
can be provided which are applied when the actual appending of offline data is performed.
In case a Loading Profile is specified via the Used Loading Profile cell, the settings about to-beincluded, to-be-excluded and/or desired time intervals and loading modes are read from the specified Loading Profile and applied during the loading of offline data.
Via the Loading Mode and Loading Parameters cells, intelligent data reduction can be applied
when the offline data is being loaded.
Via the Time Input Mode cell and its below cells, the to-be-loaded time interval can be specified
manually.
The OK button is used in order to start appending of the currently selected data according to the
currently chosen settings.
o The Advanced Overwrite… context menu item can be used in order to call the Advanced Overwrite
dialog for the currently selected files/directories. Within the Advanced Overwrite dialog, various settings can be provided which are applied when the actual overwriting of offline data is performed.
In case a Loading Profile is specified via the Used Loading Profile cell, the settings about to-beincluded, to-be-excluded and/or desired time intervals and loading modes are read from the specified Loading Profile and applied during the loading of offline data.
English
Release 2012-09
76 / 182
SIPLUS CMS X-Tools - User Manual - 01 - Introduction
SIPLUS CMS
Via the Loading Mode and Loading Parameters cells, intelligent data reduction can be applied
when the offline data is being loaded.
Via the Time Input Mode cell and its below cells, the to-be-loaded time interval can be specified
manually.
The OK button is used in order to start overwriting with the currently selected data according to the
currently chosen settings.
o The Advanced Export… context menu item can be used in order to call the Advanced Export dialog
for the currently selected files/directories. Within the Advanced Export dialog, various settings can be
provided which are applied when the actual exporting of offline data is performed.
In case a Loading Profile is specified via the Used Loading Profile cell, the settings about to-beincluded, to-be-excluded and/or desired time intervals and loading modes are read from the specified Loading Profile and applied during the exporting of offline data.
Via the Export Location and Export Path cells, the target location and path for the to-be-created
export files can be specified.
Via the Export File Type, Timestamp Format and Decimal Precision cells, the format of the information within the to-be-created export files can be specified.
Via the Export Mode and Export Parameters cells, intelligent data reduction can be applied when
the offline data is being exported.
Via the Time Input Mode cell and its below cells, the to-be-exported time interval can be specified
manually.
The OK button is used in order to start exporting of the currently selected data according to the currently chosen settings.
• Each loaded offline data is displayed by the MDS Explorer below its “Main -> Servers -> YourServer ->
Offline Data -> All Offline Data” branch. From there, it can be dragged into the other systems of X-Tools
for further analysis and visualization tasks.
• For a more detailed description of all available functionalities of the ODL Standard T001, refer to the reference manual of the “Storage System”, chapter “ODL Standard T001”.
Try it out
Open the ODL Standard T001 for the local X-Tools Server.
Browse your offline data file locations for already stored offline data files.
Load a time interval of only 10 seconds of some offline data files.
The loaded offline data is being displayed within the MDS Explorer.
Overwrite the already loaded offline data with another period of time of the data. Use the loading mode in
order to load only one value per second for each of the selected data.
The information within the MDS Explorer is being updated accordingly.
Export some of the present offline data files. Use a Loading Profile in order to predefine which of the selected data shall be exported.
According export files are being created and can be opened with other applications.
Ready
At this point you know how to use the advanced mechanisms of the ODL Standard T001 in order to load offline
data files which have been stored to disk previously.
English
Release 2012-09
77 / 182
SIPLUS CMS X-Tools - User Manual - 01 - Introduction
6.11
SIPLUS CMS
Offline File Locations
6.11.1
General Description
In this chapter you will learn how offline file locations can be used in order to maintain different directories which
contain the to-be-loaded data files of interest.
This chapter contains the following topics:
• Adding of an Offline File Location
• Removing of an Offline File Location
6.11.2
Adding of an Offline File Location
Open the STS Explorer
• Open the Storage System and ensure that the STS Explorer is displayed at the left side of the Storage
System workspace.
Functionality
• Method 1 for adding of an offline file location:
o Open a Storage Profile within the SPE Binary T001.
o Within the Storage Profile Parameters table, open the Data Storage Location combo box.
o Choose the “…” entry in order to open the Add Location dialog.
o This method can be used in order to create offline file locations of type “X-Tools Offline Data Files
(*.sdf.xts)”.
• Method 2 for adding of an offline file location:
o Open an ODL Standard T001.
o Within the Offline Data Files tree, open the context menu of the root item.
o Choose Add Location… in order to open the Add Location dialog.
o This method can be used in order to create offline file locations of any supported type.
• All of the currently present offline file locations are listed within the Offline File Locations table of the ODL
Standard T001.
• Each offline file location shows only the files which match its configured location type.
• The new location can not be created within the sub-directory of an existing location or within the parentdirectory of an existing location.
• One example directory for each supported type of offline file is delivered together with X-Tools. These directories are found below “..\X-Tools\Server\User\Example Offline Files” and can be used in order to add
and use each of the supported types of offline file locations.
Try it out
Add a new directory as additional offline file location.
All of the offline data files of matching type from the added location become visible within the Offline Data
Files tree of the ODL Standard T001.
Ready
At this point you know how to add offline file locations to the X-Tools Server.
English
Release 2012-09
78 / 182
SIPLUS CMS X-Tools - User Manual - 01 - Introduction
6.11.3
SIPLUS CMS
Removing of an Offline File Location
Open the ODL Standard T001
• Open the Storage System and ensure that the ODL Standard T001 is displayed within the Storage
System workspace.
Functionality
• Expand the main branch of the Offline Data Files tree within the ODL Standard T001.
• In order to remove an existing offline file location, call the context menu for any of the present offline file
locations within the Offline Data Files tree and choose Remove Location.
• After confirming of the upcoming dialog, the chosen offline file location is being removed from the Offline
Data Files tree.
Try it out
Remove any of the present offline file locations.
All of the directories and files from the specified location are being removed from the Offline Data Files
tree of the ODL Standard T001.
Ready
At this point you know how to remove offline file locations from the X-Tools Server.
6.12
6.12.1
Visualization of offline Data
General Description
In this chapter you will learn how to visualize offline data from the MDS Explorer with the Monitoring System
using the most basic functionalities.
This chapter contains the following topics:
• Visualization of offline Data
English
Release 2012-09
79 / 182
SIPLUS CMS X-Tools - User Manual - 01 - Introduction
6.12.2
SIPLUS CMS
Visualization of offline Data
Open the Monitoring System
• Open the Monitoring System.
• Ensure that you have several data available below the “Main -> Servers -> YourServer -> Online Data ->
All Online Data” and “Main -> Servers -> YourServer -> Offline Data -> All Offline Data” branches of the
MDS Explorer. At least some data names shall be available below both branches.
Functionality
• There are nearly no differences between the visualization of online and offline data. The major difference
is that offline data can not be running, thus the Pause Visualization and Continue Visualization buttons do
not have any effects on offline data.
• The creation and handling of Monitoring Views is identical for online data and offline data (see 6.8).
• Within each Monitoring View, online data and offline data can be visualized simultaneously.
• In order to visualize any of the currently available offline data, drag the desired data from the “Main ->
Servers -> YourServer -> Offline Data” branch of the MDS Explorer into an empty MVE Standard T001
or into an opened Monitoring Chart. Up to 32 data can be put into one Monitoring Chart.
• Each Monitoring View can be switched between visualization of online data and visualization of offline
data. In order to switch a the visualization between online data and offline data, the following possibilities
are available:
o The time domain (online or offline) of each Monitoring Chart can be changed via its Chart Options
dialog (call the context menu of the Monitoring Chart and choose Chart Options… in order to open
the Chart Options dialog). Within this dialog, the Time Domain cell of the Chart Options table allows
to choose any of the available time domains. After the time domain has been changed, the Monitoring Chart starts to display the data with the known names from the specified time domains. In case
there is no data available from the newly chosen time domain and with the known name, an according
icon is displayed by the legend of the Monitoring Chart.
o The time domain for the whole Monitoring View can be changed via the Time Domain cell of the Monitoring View Parameters table of the MVE Standard T001. The chosen time domain from the Monitoring View Parameters table is applied to all of the opened Monitoring Charts of the MVE Standard
T001 immediately.
Try it out
Create a new Monitoring View.
Drag some offline data from the MDS Explorer into the Monitoring View in order to visualize the data
curves.
Turn the cursors on and take a look onto the displayed measurement values. Zoom into the visualization,
shrink and stretch the axes scaling and use the undo/redo buttons. Repeat these operations in random
order in order to adjust the visualization to the needs of the current application.
Open two additional Monitoring Charts within the Monitoring View and start to visualize data also with
the two additional Monitoring Charts.
Add online data and offline data to one Monitoring Chart in order to visualize them in parallel.
Use the Time Domain cells of the Chart Options dialog and of the MVE Standard T001 in order to
switch the time domains of a single Monitoring Chart or of all Monitoring Charts simultaneously.
Ready
At this point you know how to visualize offline data, how to switch the visualization between online data and
offline data and how to visualize and use online and offline data in parallel.
English
Release 2012-09
80 / 182
SIPLUS CMS X-Tools - User Manual - 01 - Introduction
6.13
SIPLUS CMS
Analyzing of Data via Analyzing Models
6.13.1
General Description
In this chapter you will learn how to analyze data from the MDS Explorer with the Analyzing System via Analyzing Models. An Analyzing Model contains all of the information which is needed in order to perform calculations based on the specified input data. This information includes the order of execution and the parameters of
all to-be-called (Analyzing and User) functions. Multiple Analyzing Models can be started and running simultaneously at any time. In addition, the data which are defined as output data within a started Analyzing Model are
available to all other modules of X-Tools via the MDS Explorer.
Examples of Analyzing Models are found within the example Configuration File location which is being delivered
together with X-Tools.
This chapter contains the following topics:
• Creation of a new Analyzing Model
• Opening of existing Analyzing Models
• Starting and Stopping of Analyzing Models
6.13.2
Creation of a new Analyzing Model
Open the ANS Explorer
• Open the Analyzing System and ensure that the ANS Explorer is displayed at the left side of the Analyzing System workspace.
• Ensure that you have several data available below the “Main -> Servers -> YourServer -> Online Data ->
All Online Data” and “Main -> Servers -> YourServer -> Offline Data -> All Offline Data” branches of the
MDS Explorer.
Functionality
• Method 1 for the creation of a new Analyzing Model:
o Within the ANS Explorer, expand the “Main -> Editors -> Analyzing Model Editors” branch.
o Drag the AME Standard T001 with the left mouse into the empty space at the right side of the ANS
Explorer. An empty AME Standard T001 is opened automatically.
o Press the New button in order to create a new Analyzing Model. The new Analyzing Model is displayed by the AME Standard T001 with default values.
o This method works in all cases, even in case there is no X-Tools Server connected at the moment. It
can be used for the creation and configuration of Analyzing Models for cases where the target XTools Server is not present at the moment.
• Method 2 for the creation of a new Analyzing Model:
o This method works only in case the AME Standard T001 is defined as “Default Editor for Functions”
within the Global Options Editor of the X-Tools Client.
o Within the ANS Explorer, expand the “Main -> Servers -> YourServer -> Libraries -> Analyzing Functions” branch.
o Expand also the “Arithmetic” branch and drag a below Analyzing Function (e.g. the “Abs()” Analyzing
Function) into the empty Analyzing System workspace. An AME Standard T001 with a default Analyzing Model which also contains the dropped Analyzing Function is opened automatically.
o Instead of an Analyzing Function from the “Main -> Servers -> YourServer -> Libraries -> Analyzing
Functions” branch, also a User Function from the Main -> Servers -> YourServer -> Libraries -> User
Functions” branch can be dragged into the empty Analyzing System.
o This method works only in case the target X-Tools Server is present but it is more convenient and
faster as it automatically also determines the target X-Tools Server of the new Analyzing Model.
English
Release 2012-09
81 / 182
SIPLUS CMS X-Tools - User Manual - 01 - Introduction
SIPLUS CMS
• Method 3 for the creation of a new Analyzing Model:
o This method works only in case the AME Standard T001 is defined as “Default Editor for Functions”
within the Global Options Editor of the X-Tools Client.
o Within the MDS Explorer, expand the “Main -> Servers -> YourServer -> Online Data” or the “Main ->
Servers -> YourServer -> Offline Data” branch.
o Drag an online or offline data from the MDS Explorer into the empty Analyzing System workspace.
An AME Standard T001 with a default Analyzing Model which also contains the dropped data is
opened automatically.
o This method works only in case the target data is present but it is more convenient and faster as it
automatically also determines the target X-Tools Server of the new Analyzing Model.
• The following screenshot shows an example of a new Analyzing Model.
Figure 37: AME Standard T001 with a new Analyzing Model
• The Analyzing Model Settings table at the top of the AME Standard T001 displays the general file information and allows entering additional file attributes like a description and the name of the author of the file
and his company.
• Within the Analyzing Model Parameters table, the basic parameters for the execution of the Analyzing
Model are being defined.
o The default configuration of Analyzing Models typically allows executing the defined analysis without
additional changes to the parameters.
o For a detailed description of the meaning and usage of the parameters of Analyzing Models, refer to
the reference manual of the “Analyzing System”, chapter “Analyzing Model Editors”.
English
Release 2012-09
82 / 182
SIPLUS CMS X-Tools - User Manual - 01 - Introduction
SIPLUS CMS
• Within the Offline Time Configuration table, the time interval onto which the calculation shall be applied is
being defined. The contents of this table can be configured only in case the output data class is specified
as offline data.
o The default configuration of Analyzing Models typically allows executing the defined analysis without
additional changes to the offline time configuration.
o For a detailed description of the meaning and usage of the offline time configuration of Analyzing
Models, refer to the reference manual of the “Analyzing System”, chapter “Analyzing Model Editors”.
• Within the Treatment of Status Codes table, the handling of occurring status codes is being defined.
o The default configuration of Analyzing Models typically allows executing the defined analysis without
additional changes to the treatment of status codes.
o For a detailed description of the meaning and usage of the treatment of status codes of Analyzing
Models, refer to the reference manual of the “Analyzing System”, chapter “Analyzing Model Editors”.
• In order to add input data to the Analyzing Model, simply drag the desired data from the MDS Explorer
into the Analyzing Model.
• In order to add Analyzing Functions to the Analyzing Model, simply drag the desired Analyzing Function
from the ANS Explorer into the Analyzing Model.
• In order to add User Functions to the Analyzing Model, simply drag the desired User Function from the
ANS Explorer into the Analyzing Model.
• (Analyzing and User) functions can be connected together via links. Each output of a function can be connected to one or more inputs of functions by clicking onto the output argument first and by clicking onto
the input argument next. Each created link transports the output value from its source function to the input
argument of its destination function.
• All of the currently present functions can be arranged within the Analyzing Model via Drag&Drop.
• A double-click onto a function opens the Analyzing Function Properties dialog which can be used in order to specify the values of the input arguments of the function.
• Via the context menu, functions can be cut/copied/pasted/removed and their visualization can be modified.
• An Analyzing Model can work either only on online data, only on offline data or on online and offline data
simultaneously. The class of the resulting data (online or offline) can be configured via the Analyzing
Model Parameters table.
• Analyzing Functions from the category “Input” are being used in order to get (online or offline) data from
the system into the Analyzing Model. Analyzing Functions from the category “Output” are being used in
order to put (online or offline) data from the Analyzing Model back to the system.
• The Save and Save As… buttons are used in order to save the configured Analyzing Model with all of its
settings. All saved Analyzing Models are shown by the ANS Explorer (“Main -> Servers -> YourServer ->
YourLocation -> Analyzing Model Files” branch) and can be accessed (e.g. started, stopped, opened, …)
from there.
• For a more detailed description of all available functionalities of the AME Standard T001 and of the
available Analyzing Functions, refer to the reference manual of the “Analyzing System”, chapter “AME
Standard T001” and chapter “Analyzing Functions”.
Try it out
Create a new Analyzing Model.
Build an easy Analyzing Model which takes two online data from the MDS Explorer, adds them together
and outputs the result.
Move the functions around within the Analyzing Model.
Change the visualization of some functions, e.g. turn on/off the values of the input arguments or expand
and collapse the function.
Save the Analyzing Model. At the first save, the Save As dialog will pop up and offers a default file name.
Change the default file name to “Hello Analyzing Model” and press OK in order to save it to the disk.
The new Analyzing Model now is displayed below the “Main -> Servers -> YourServer -> YourLocation ->
Analyzing Model Files” branch of the ANS Explorer.
English
Release 2012-09
83 / 182
SIPLUS CMS X-Tools - User Manual - 01 - Introduction
SIPLUS CMS
Take a look onto the Analyzing Models which are provided via the example location (see point 6.5) in order to see various application examples about the capabilities and usage of Analyzing Models.
Ready
At this point you know how to create a new Analyzing Model which can be used in order to perform calculations
based on online and/or offline data.
6.13.3
Opening of existing Analyzing Models
Open the ANS Explorer
• Open the Analyzing System and ensure that the ANS Explorer is displayed at the left side of the Analyzing System workspace.
Functionality
• Within the ANS Explorer, expand the “Main -> Servers -> YourServer -> YourLocation -> Analyzing
Model Files” branch.
• Drag one of the below Analyzing Models with the left mouse into the empty space at the right side of the
ANS Explorer. An Analyzing Model Editor of proper type is opened automatically and displays the
dropped Analyzing Model.
Figure 38: AME Standard T001 with an opened Analyzing Model
• The opened Analyzing Model can be edited now. After editing, the Save and Save As… buttons are used
in order to save the edited Analyzing Model with all of its settings.
English
Release 2012-09
84 / 182
SIPLUS CMS X-Tools - User Manual - 01 - Introduction
SIPLUS CMS
Try it out
Open an existing Analyzing Model.
Enter another storage location and change the Model Description within the Analyzing Model Settings table.
Add an additional function to the Analyzing Model and output also this additional result of the calculation.
Save the Analyzing Model via the Save button.
The modified Analyzing Model is still displayed below the “Main -> Servers -> YourServer -> YourLocation -> Analyzing Model Files” branch of the ANS Explorer.
Ready
At this point you know how to open and modify an existing Analyzing Model.
6.13.4
Starting and Stopping of Analyzing Models
Open the ANS Explorer
• Open the Analyzing System and ensure that the ANS Explorer is displayed at the left side of the Analyzing System workspace.
• Ensure that you have several data available below the “Main -> Servers -> YourServer -> Online Data ->
All Online Data” and “Main -> Servers -> YourServer -> Offline Data -> All Offline Data” branches of the
MDS Explorer.
Functionality
• Within the ANS Explorer, expand the “Main -> Servers -> YourServer -> YourLocation -> Analyzing
Model Files” branch.
• Click onto any of the present Analyzing Models with the right mouse button in order to open the context
menu.
• In order to start the currently selected Analyzing Model, choose Start from the context menu.
o Multiple Analyzing Models can be running simultaneously and without any dependencies between
each other.
• The configured data of each started Analyzing Model is found within the MDS Explorer below its “Main ->
Servers -> YourServer -> Online Data -> All Online Data” (in case of output data class “Online Data”) or
“Main -> Servers -> YourServer -> Offline Data -> All Offline Data” (in case of output data class “Offline
Data”) branch. From there, the data can be moved to all systems of X-Tools for further processing via
Drag&Drop.
• In order to stop a currently running Analyzing Model, call the context menu of this Analyzing Model and
choose Stop.
• There are several conditions in which an Analyzing Model can not run after it has been started, e.g. in
case the input data is not available at the moment or in case the output data can not be created because
it is in use already. When an Analyzing Model can not run after it has been started, it is being suspended
and automatically resumed as soon as the error condition has disappeared.
• In case at least one Analyzing Model has been started by the user, the status bar of the X-Tools Client
displays the current status of Analyzing Models via the according, colored icon. The tool tip of this icon
provides detailed information about the number of currently started and suspended Analyzing Models.
o Note that the status bar always displays the status of exactly one X-Tools Server, thus also the icon
for the current status of Analyzing Models displays the status of only the currently chosen X-Tools
Server.
English
Release 2012-09
85 / 182
SIPLUS CMS X-Tools - User Manual - 01 - Introduction
SIPLUS CMS
Try it out
Start an existing Analyzing Model. Ensure that the configured input data is available within the MDS Explorer and that the configured output data does not exist within the MDS Explorer yet.
The output data which has been configured within the started Analyzing Model becomes available within
the MDS Explorer.
Stop the currently running Analyzing Model.
The data which has been configured within the started Analyzing Model is being removed from the MDS
Explorer.
Ready
At this point you know how to start and stop existing Analyzing Models in order to start and stop the calculations
based on the currently available online and/or offline data.
English
Release 2012-09
86 / 182
SIPLUS CMS X-Tools - User Manual - 01 - Introduction
6.14
SIPLUS CMS
Analyzing of Data via Analyzing Scripts
6.14.1
General Description
In this chapter you will learn how to analyze data from the MDS Explorer with the Analyzing System via Analyzing Scripts. An Analyzing Script contains all of the information which is needed in order to perform calculations based on the specified input data. This information includes the order of execution and the parameters of
all to-be-called (Analyzing and User) functions. Multiple Analyzing Scripts can be started and running simultaneously at any time. In addition, the data which are defined as output data within a started Analyzing Script are
available to all other modules of X-Tools via the MDS Explorer.
Examples of Analyzing Scripts are found within the example Configuration File location which is being delivered
together with X-Tools.
This chapter contains the following topics:
• Creation of a new Analyzing Script
• Opening of existing Analyzing Scripts
• Starting and Stopping of Analyzing Scripts
6.14.2
Creation of a new Analyzing Script
Open the ANS Explorer
• Open the Analyzing System and ensure that the ANS Explorer is displayed at the left side of the Storage System workspace.
• Ensure that you have several data available below the “Main -> Servers -> YourServer -> Online Data ->
All Online Data” and “Main -> Servers -> YourServer -> Offline Data -> All Offline Data” branches of the
MDS Explorer.
Functionality
• Method 1 for the creation of a new Analyzing Script:
o Within the ANS Explorer, expand the “Main -> Editors -> Analyzing Script Editors” branch.
o Drag the ASE Standard T001 with the left mouse into the empty space at the right side of the ANS
Explorer. An empty ASE Standard T001 is opened automatically.
o Press the New button in order to create a new Analyzing Script. The new Analyzing Script is displayed
by the ASE Standard T001 with default values.
o This method works in all cases, even in case there is no X-Tools Server connected at the moment. It
can be used for the creation and configuration of Analyzing Scripts for cases where the target X-Tools
Server is not present at the moment.
• Method 2 for the creation of a new Analyzing Script:
o This method works only in case the ASE Standard T001 is defined as “Default Editor for Functions”
within the Global Options Editor of the X-Tools Client.
o Within the ANS Explorer, expand the “Main -> Servers -> YourServer -> Libraries -> Analyzing Functions” branch.
o Expand also the “Arithmetic” branch and drag a below Analyzing Function (e.g. the “Abs” Analyzing
Function) into the empty Analyzing System workspace. An ASE Standard T001 with a default Analyzing Script which also contains the dropped Analyzing Function is opened automatically.
o Instead of an Analyzing Function from the “Main -> Servers -> YourServer -> Libraries -> Analyzing
Functions” branch, also a User Function from the Main -> Servers -> YourServer -> Libraries -> User
Functions” branch can be dragged into the empty Analyzing System.
o This method works only in case the target X-Tools Server is present but it is more convenient and
faster as it automatically also determines the target X-Tools Server of the new Analyzing Script.
English
Release 2012-09
87 / 182
SIPLUS CMS X-Tools - User Manual - 01 - Introduction
SIPLUS CMS
• Method 3 for the creation of a new Analyzing Script:
o This method works only in case the ASE Standard T001 is defined as “Default Editor for Functions”
within the Global Options Editor.
o Within the MDS Explorer, expand the “Main -> Servers -> YourServer -> Online Data” or the “Main ->
Servers -> YourServer -> Offline Data” branch.
o Drag an online or offline data from the MDS Explorer into the empty Analyzing System workspace.
An ASE Standard T001 with a default Analyzing Script which also contains the dropped data is
opened automatically.
o This method works only in case the target data is present but it is more convenient and faster as it
automatically also determines the target X-Tools Server of the new Analyzing Script.
• The following screenshot shows an example of a new Analyzing Script.
Figure 39: ASE Standard T001 with a new Analyzing Script
• The Analyzing Script Settings table at the top of the ASE Standard T001 displays the general file information and allows entering additional file attributes like a description and the name of the author of the file
and his company.
• Within the Analyzing Script Parameters table, the basic parameters for the execution of the Analyzing
Script are being defined.
o The default configuration of Analyzing Scripts typically allows executing the defined analysis without
additional changes to the parameters.
o For a detailed description of the meaning and usage of the parameters of Analyzing Scripts, refer to
the reference manual of the “Analyzing System”, chapter “Analyzing Script Editors”.
English
Release 2012-09
88 / 182
SIPLUS CMS X-Tools - User Manual - 01 - Introduction
SIPLUS CMS
• Within the Offline Time Configuration table, the time interval onto which the calculation shall be applied is
being defined. The contents of this table can be configured only in case the output data class is specified
as offline data.
o The default configuration of Analyzing Scripts typically allows executing the defined analysis without
additional changes to the offline time configuration.
o For a detailed description of the meaning and usage of the offline time configuration of Analyzing
Scripts, refer to the reference manual of the “Analyzing System”, chapter “Analyzing Script Editors”.
• Within the Treatment of Status Codes table, the handling of occurring status codes is being defined.
o The default configuration of Analyzing Scripts typically allows executing the defined analysis without
additional changes to the treatment of status codes.
o For a detailed description of the meaning and usage of the treatment of status codes of Analyzing
Scripts, refer to the reference manual of the “Analyzing System”, chapter “Analyzing Script Editors”.
• In order to add input data to the Analyzing Script, simply drag the desired data from the MDS Explorer
into the Analyzing Script.
• In order to add Analyzing Functions to the Analyzing Script, simply drag the desired Analyzing Function
from the ANS Explorer into the Analyzing Script.
• In order to add User Functions to the Analyzing Script, simply drag the desired User Function from the
ANS Explorer into the Analyzing Script.
• Functions are being called in the order in which they are found in the Analyzing Script. Via variables
and/or via nested calls the output values of each function can be provided as input values to other functions.
• An Analyzing Script can work either only on online data, only on offline data or on online and offline data
simultaneously. The class of the resulting data (online or offline) can be configured via the Analyzing
Script Parameters table.
• Analyzing Functions from the category “Input” are being used in order to get (online or offline) data from
the system into the Analyzing Script. Analyzing Functions from the category “Output” are being used in
order to put (online or offline) data from the Analyzing Script back to the system.
• The Save and Save As… buttons are used in order to save the configured Analyzing Script with all of its
settings. All saved Analyzing Scripts are shown by the ANS Explorer (“Main -> Servers -> YourServer ->
YourLocation -> Analyzing Script Files” branch) and can be accessed (e.g. started, stopped, opened, …)
from there.
• In addition to the time slice based operating mode, Analyzing Scripts also can be executed in sequential
processing. The sequential processing allows further operations like manipulating of time intervals and
conditional statements within the Analyzing Script. For a more detailed description of all available functionalities of the ASE Standard T001 and of the available Analyzing Functions, refer to the reference
manual of the “Analyzing System”, chapter “ASE Standard T001” and chapter “Analyzing Functions”.
Try it out
Create a new Analyzing Script.
Build an easy Analyzing Script which takes two online data from the MDS Explorer, adds them together
and outputs the result.
Save the Analyzing Script. At the first save, the Save As dialog will pop up and offers a default file name.
Change the default file name to “Hello Analyzing Script” and press OK in order to save it to the disk.
The new Analyzing Script now is displayed below the “Main -> Servers -> YourServer -> YourLocation ->
Analyzing Script Files” branch of the ANS Explorer.
Take a look onto the Analyzing Scripts which are provided via the example location (see point 6.5) in order to see various application examples about the capabilities and usage of Analyzing Scripts.
Ready
At this point you know how to create a new Analyzing Script which can be used in order to perform calculations
based on online and/or offline data.
English
Release 2012-09
89 / 182
SIPLUS CMS X-Tools - User Manual - 01 - Introduction
6.14.3
SIPLUS CMS
Opening of existing Analyzing Scripts
Open the ANS Explorer
• Open the Analyzing System and ensure that the ANS Explorer is displayed at the left side of the Analyzing System workspace.
Functionality
• Within the ANS Explorer, expand the “Main -> Servers -> YourServer -> YourLocation -> Analyzing
Script Files” branch.
• Drag one of the below Analyzing Scripts with the left mouse into the empty space at the right side of the
ANS Explorer. An Analyzing Script Editor of proper type is opened automatically and displays the
dropped Analyzing Script.
Figure 40: ASE Standard T001 with an opened Analyzing Script
• The opened Analyzing Script can be edited now. After editing, the Save and Save As… buttons are used
in order to save the edited Analyzing Script with all of its settings.
Try it out
Open an existing Analyzing Script.
Enter another storage location and change the Script Description within the Analyzing Script Settings table.
Add an additional function to the Analyzing Script and output also this additional result of the calculation.
Save the Analyzing Script via the Save button.
The modified Analyzing Script is still displayed below the “Main -> Servers -> YourServer -> YourLocation
-> Analyzing Script Files” branch of the ANS Explorer.
Ready
At this point you know how to open and modify an existing Analyzing Script.
English
Release 2012-09
90 / 182
SIPLUS CMS X-Tools - User Manual - 01 - Introduction
6.14.4
SIPLUS CMS
Starting and Stopping of Analyzing Scripts
Open the ANS Explorer
• Open the Analyzing System and ensure that the ANS Explorer is displayed at the left side of the Analyzing System workspace.
• Ensure that you have several data available below the “Main -> Servers -> YourServer -> Online Data ->
All Online Data” and “Main -> Servers -> YourServer -> Offline Data -> All Offline Data” branches of the
MDS Explorer.
Functionality
• Within the ANS Explorer, expand the “Main -> Servers -> YourServer -> YourLocation -> Analyzing
Script Files” branch.
• Click onto any of the present Analyzing Scripts with the right mouse button in order to open the context
menu.
• In order to start the currently selected Analyzing Script, choose Start from the context menu.
o Multiple Analyzing Scripts can be running simultaneously and without any dependencies between
each other.
• The configured data of each started Analyzing Script is found within the MDS Explorer below its “Main ->
Servers -> YourServer -> Online Data -> All Online Data” (in case of output data class “Online Data”) or
“Main -> Servers -> YourServer -> Offline Data -> All Offline Data” (in case of output data class “Offline
Data”) branch. From there, the data can be moved to all systems of X-Tools for further processing via
Drag&Drop.
• In order to stop a currently running Analyzing Script, call the context menu of this Analyzing Script and
choose Stop.
• There are several conditions in which an Analyzing Script can not run after it has been started, e.g. in
case the input data is not available at the moment or in case the output data can not be created because
it is in use already. When an Analyzing Script can not run after it has been started, it is being suspended
and automatically resumed as soon as the error condition has disappeared.
• In case at least one Analyzing Script has been started by the user, the status bar of the X-Tools Client
displays the current status of Analyzing Scripts via the according, colored icon. The tool tip of this icon
provides detailed information about the number of currently started and suspended Analyzing Scripts.
o Note that the status bar always displays the status of exactly one X-Tools Server, thus also the icon
for the current status of Analyzing Scripts displays the status of only the currently chosen X-Tools
Server.
Try it out
Start an existing Analyzing Script. Ensure that the configured input data is available within the MDS Explorer and that the configured output data does not exist within the MDS Explorer yet.
The output data which has been configured within the started Analyzing Script becomes available within
the MDS Explorer.
Stop the currently running Analyzing Script.
The data which has been configured within the started Analyzing Script is being removed from the MDS
Explorer.
Ready
At this point you know how to start and stop existing Analyzing Scripts in order to start and stop the calculations
based on the currently available online and/or offline data.
English
Release 2012-09
91 / 182
SIPLUS CMS X-Tools - User Manual - 01 - Introduction
6.15
SIPLUS CMS
User Functions for the Encapsulation of Analysis Tasks
6.15.1
General Description
In this chapter you will learn how to create User Functions. User Functions can be used in order to combine
multiple (Analyzing and User) functions to a new entity. Uses cases for User Functions are:
• The same or similar analysis tasks are being used by different Analyzing Models or Analyzing Scripts.
• Complex analysis tasks can be represented by a single User Function, which improves the readability of
Analyzing Models and Analyzing Scripts.
• User Functions can improve the maintainability. All Analyzing Models and Analyzing Scripts which contain
a User Function use the latest version of this User Function whenever the Analyzing Model or Analyzing
Script is being used. Thus, changing of one User Function can be used in order to update all of the Analyzing Models and Analyzing Scripts which use this User Function.
• The internal calculations shall be hidden from other users. User Functions can be protected agains reading in order to secure the contained know-how.
Like Analyzing Functions, User Functions can not be executed stand-alone. They perform their configured tasks
only during the processing of their parent Analyzing Model or Analyzing Script. In addition to the full name and
to the short name, also a category can be assigned to each User Function. The category is used by the ANS
Explorer in order to group together User Functions of the same category.
Within the UFE Standard T001, a User Function contains (Analyzing and User) functions and links like an Analyzing Model. Outside the UFE Standard T001, a User Function can be used by Analyzing Models and Analyzing Scripts like any of the standard Analyzing Functions. Multiple User Functions can be maintained and/or executed within Analyzing Models and Analyzing Scripts simultaneously.
Examples of User Functions are found within the example Configuration File location which is being delivered
together with X-Tools.
This chapter contains the following topics:
• Creation of a new User Function
• Opening of existing User Functions
• Using of User Functions within Analyzing Models
• Using of User Functions within Analyzing Scripts
• Behavior of User Functions
• Examples of User Functions
6.15.2
Creation of a new User Function
Open the ANS Explorer
• Open the Analyzing System and ensure that the ANS Explorer is displayed at the left side of the Analyzing System workspace.
• Ensure that you have several data available below the “Main -> Servers -> YourServer -> Online Data ->
All Online Data” and “Main -> Servers -> YourServer -> Offline Data -> All Offline Data” branches of the
MDS Explorer.
Functionality
• Method 1 for the creation of a new User Function:
o Within the ANS Explorer, expand the “Main -> Editors -> User Function Editors” branch.
o Drag the UFE Standard T001 with the left mouse into the empty space at the right side of the ANS
Explorer. An empty UFE Standard T001 is opened automatically.
o Press the New button in order to create a new User Function. The new User Function is displayed by
the UFE Standard T001 with default values.
English
Release 2012-09
92 / 182
SIPLUS CMS X-Tools - User Manual - 01 - Introduction
SIPLUS CMS
o This method works in all cases, even in case there is no X-Tools Server connected at the moment. It
can be used for the creation and configuration of User Functions for cases where the target X-Tools
Server is not present at the moment.
• Method 2 for the creation of a new User Function:
o This method works only in case the UFE Standard T001 is defined as “Default Editor for Functions”
within the Global Options Editor of the X-Tools Client.
o Within the ANS Explorer, expand the “Main -> Servers -> YourServer -> Libraries -> Analyzing Functions” branch.
o Expand also the “Arithmetic” branch and drag a below Analyzing Function (e.g. the “Abs” Analyzing
Function) into the empty Analyzing System workspace. A UFE Standard T001 with a default User
Function which also contains the dropped Analyzing Function is opened automatically.
o Instead of an Analyzing Function from the “Main -> Servers -> YourServer -> Libraries -> Analyzing
Functions” branch, also a User Function from the Main -> Servers -> YourServer -> Libraries -> User
Functions” branch can be dragged into the empty Analyzing System.
o This method works only in case the target X-Tools Server is present but it is more convenient and
faster as it automatically also determines the target X-Tools Server of the new User Function.
• Method 3 for the creation of a new User Function:
o This method works only in case the UFE Standard T001 is defined as “Default Editor for Functions”
within the Global Options Editor of the X-Tools Client.
o Within the MDS Explorer, expand the “Main -> Servers -> YourServer -> Online Data” or the “Main ->
Servers -> YourServer -> Offline Data” branch.
o Drag an online or offline data from the MDS Explorer into the empty Analyzing System workspace. A
UFE Standard T001 with a default User Function which also contains the dropped data is opened
automatically.
o This method works only in case the target data is present but it is more convenient and faster as it
automatically also determines the target X-Tools Server of the new User Function.
• Method 4 for the creation of a new User Function:
o Open an existing Analyzing Model or create a new Analyzing Model.
o Within the AME Standard T001, press the Convert button.
o The Analyzing Model is converted into an identical User Function automatically. The new User Function is opened within a UFE Standard T001. In order to become able to use the new User Function,
valid information must be provided for the full name and short name of the User Function and the input
and output interfaces must be defined.
English
Release 2012-09
93 / 182
SIPLUS CMS X-Tools - User Manual - 01 - Introduction
SIPLUS CMS
• The following screenshot shows an example of a new User Function.
Figure 41: UFE Standard T001 with a new User Function
• The User Function Settings table at the top of the UFE Standard T001 displays the general file information and allows entering additional file attributes like a description and the name of the author of the file
and his company.
• The User Function Parameters table allows specifying a password for the User Function. In case a User
Function is protected by a password, it can not be opened within the UFE Standard T001 without specifying of the correct password. In addition to the password it also can be specified whether the User Function shall forward the log entries of its contained functions when it is being used by an Analyzing Model or
Analyzing Script.
• The User Function Properties table displays basic information about the User Function like the operating
modes which will it support. In addition, it allows entering the names and the description as well as the
parent category of the User Function.
• Within the Provided Input Interfaces table, all of the input interfaces which are defined for the User Function are being displayed and can be edited.
• Within the Provided Output Interfaces table, all of the output interfaces which are defined for the User
Function are being displayed and can be edited.
• In order to add input data to the User Function, simply drag the desired data from the MDS Explorer into
the User Function.
• In order to add Analyzing Functions to the User Function, simply drag the desired Analyzing Function
from the ANS Explorer into the User Function.
• In order to add User Functions to the User Function, simply drag the desired User Function from the ANS
Explorer into the User Function.
• (Analyzing and User) functions can be connected together via links. Each output of a function can be connected to one or more inputs of functions by clicking onto the output argument first and by clicking onto
the input argument next. Each created link transports the output value from its source function to the input
argument of its destination function.
• All of the currently present functions can be arranged within the User Function via Drag&Drop.
English
Release 2012-09
94 / 182
SIPLUS CMS X-Tools - User Manual - 01 - Introduction
SIPLUS CMS
• A double-click onto a function opens the Analyzing Function Properties dialog which can be used in order to specify the values of the input arguments of the function.
• Via the context menu, functions can be cut/copied/pasted/removed and their visualization can be modified.
• Analyzing Functions from the category “Input” are being used in order to get (online or offline) data from
the system into the User Function. Analyzing Functions from the category “Output” are being used in order to put (online or offline) data from the User Function back to the system.
• Each User Function must provide inputs and outputs which can be used later by the Analyzing Model or
Analyzing Script which embeds the User Function. In order to add an input which is visible from outside,
call the context menu above the input argument which shall be visible outside and choose “Add Input Interface”. In order to add an output which is visible from outside, call the context menu above the output
argument and choose “Add Output Interface”.
• After an input or output interface has been created, the name, unit, description and default value can be
edited within the Provided Input Interfaces and Provided Output Interfaces table.
• A User Function is not limited to a certain operating mode, calculation mode, cycle time or output data
class. All of these parameters are configured only within the parent Analyzing Model or Analyzing Script
in the later step. Depending to the contained functions, a User Function may not be able to operate in all
operating modes and calculation modes or it may not be able to work together with all output data
classes.
• Before a User Function can be saved, the Full Name and Short Name of the User Function must be
specified within the User Function Properties table.
• The Save and Save As… buttons are used in order to save the configured User Function with all of its
settings. All saved User Functions are shown by the ANS Explorer (“Main -> Servers -> YourServer ->
YourLocation -> User Function Files” branch) and can be accessed from there. In addition, each User
Function also creates one entry below the “Main -> Servers -> YourServer -> Libraries -> User Functions”
branch of the ANS Explorer.
• For a more detailed description of all available functionalities of the UFE Standard T001 and of the available Analyzing Functions, refer to the reference manual of the “Analyzing System”, chapter “UFE Standard T001” and chapter “Analyzing Functions”.
Try it out
Create a new User Function.
Build an easy User Function which adds two data together and subtracts a value of 10 from the result.
This User Function needs only two Analyzing Functions, Add() and Sub(). In order to provide the external
interface, the two inputs of Add() are configured as input interfaces (call the context menu for each input
and choose Add Input Interface) and the output of Sub() is configured as output interface (call the context
menu for the output and choose Add Output Interface).
Move the functions around within the User Function.
Change the visualization of some functions, e.g. turn on/off the values of the input arguments or expand
and collapse the function.
Within the User Function Properties table, set a Full Name of “HelloWorld”, a Short Name of “HelloW” and
a Parent Category of “Tutorial”.
English
Release 2012-09
95 / 182
SIPLUS CMS X-Tools - User Manual - 01 - Introduction
SIPLUS CMS
The User Function looks like in the following example:
Figure 42: UFE Standard T001 with the HelloW() Example
Save the User Function. At the first save, the Save As dialog will pop up and offers a default file name.
Change the default file name to “Hello User Function” and press OK in order to save it to the disk.
The new User Function now is displayed below the “Main -> Servers -> YourServer -> YourLocation ->
User Function Files” branch of the ANS Explorer.
Create another User Function. This time, add the two Analyzing Functions for the input and the one Analyzing Function for the output data directly into the User Function.
In order to provide the external interface, specify input interfaces for all three “Name” input arguments of
the In() and Out() Analyzing Functions.
Within the Provided Input Interfaces table, assign short names like “In0” and “In1” for the “Name” input
arguments of the In() Analyzing Functions and a short name like “Out0” for the “Name” input argument of
the Out() Analyzing Function.
Specify an output interface for the “Out0” output argument of the Out() Analyzing Function.
Within the Provided Output Interfaces table, assign a short name like “Out1” for the “Out0” output argument of the Out() Analyzing Function.
Within the User Function Properties table, set a Full Name of “HelloWorld2”, a Short Name of “HelloW2”
and a Parent Category of “Tutorial”.
English
Release 2012-09
96 / 182
SIPLUS CMS X-Tools - User Manual - 01 - Introduction
SIPLUS CMS
The User Function looks like in the following example:
Figure 43: UFE Standard T001 with the HelloW2() Example
Compared to the User Function “HelloW”, “HelloW2” provides less possibilities to the parent Analyzing
Model or Analyzing Script to influence the processing of the input and output data, because “HelloW2” internally contains the In() and Out() Analyzing Functions which decide about the to-be-used interpolation
and record modes. Depending to the target application, both methods for the embedding of input and
output data can have their advantages and disadvantages and it must be decided for each application,
which approach is more suitable.
Ready
At this point you know how to create a new User Function which can be used by Analyzing Models and Analyzing Scripts in order to perform calculations based on online and/or offline data.
6.15.3
Opening of existing User Functions
Open the ANS Explorer
• Open the Analyzing System and ensure that the ANS Explorer is displayed at the left side of the Analyzing System workspace.
Functionality
• Method 1 for the opening of an existing User Function:
o Within the ANS Explorer, expand the “Main -> Servers -> YourServer -> YourLocation -> User Function Files” branch.
o Drag one of the below User Functions with the left mouse into the empty space at the right side of the
ANS Explorer. A User Function Editor of proper type is opened automatically and displays the
dropped User Function.
English
Release 2012-09
97 / 182
SIPLUS CMS X-Tools - User Manual - 01 - Introduction
SIPLUS CMS
• Method 2 for the opening of an existing User Function:
o Within the ANS Explorer, expand the “Main -> Servers -> YourServer -> Libraries -> User Functions”
branch.
o Call the context menu for one of the below User Functions and choose Edit. A User Function Editor
of proper type is opened automatically and displays the selected User Function.
Figure 44: UFE Standard T001 with an opened User Function
• The opened User Function can be edited now. After editing, the Save and Save As… buttons are used in
order to save the edited User Function with all of its settings.
Try it out
Open an existing User Function.
Enter another storage location and change the Model Description within the User Function Settings table.
Add an additional function to the User Function and output also this additional result of the calculation.
Save the User Function via the Save button.
The modified User Function is still displayed below the “Main -> Servers -> YourServer -> YourLocation > User Function Files” branch of the ANS Explorer.
Ready
At this point you know how to open and modify an existing User Function.
English
Release 2012-09
98 / 182
SIPLUS CMS X-Tools - User Manual - 01 - Introduction
6.15.4
SIPLUS CMS
Using of User Functions within Analyzing Models
Provide some online Data
• Ensure that there is some online data available within the MDS Explorer.
Functionality
• Within the ANS Explorer, expand the “Main -> Servers -> YourServer -> Libraries -> User Functions”
branch.
• The present User Functions can be dropped into the AME Standard T001.
• The input and output arguments of the User Function can be connected to any other (Analyzing and
User) functions within the Analyzing Model.
• After the Analyzing Model has been completed, it can be saved and started.
Try it out
Create a new, empty Analyzing Model.
Drag&Drop two online data from the MDS Explorer into the AME Standard T001.
Drag&Drop the User Function “HelloW”, which has been created during the previous tutorial, from the
ANS Explorer into the AME Standard T001.
Drag&Drop the Analyzing Function Out() from the ANS Explorer into the AME Standard T001.
Connect the outputs of the two inputs to the inputs of HelloW() and the output of HelloW() to the input of
Out(). Specify a name for the output data and save the Analyzing Model.
The Analyzing Model looks like in the following example:
Figure 45: AME Standard T001 with the HelloW() User Function
Start the Analyzing Model.
The output data which has been configured within the started Analyzing Model becomes available within
the MDS Explorer.
Create another new, empty Analyzing Model.
English
Release 2012-09
99 / 182
SIPLUS CMS X-Tools - User Manual - 01 - Introduction
SIPLUS CMS
Drag&Drop the User Function “HelloW2”, which has been created during the previous tutorial, from the
ANS Explorer into the AME Standard T001.
Enter the name of an online data from the MDS Explorer for the “In0” argument of HelloW2() and the
name of another online data for the “In1” argument.
Enter a name for the “Out0” argument of HelloW2().
The Analyzing Model looks like in the following example:
Figure 46: AME Standard T001 with the HelloW2() User Function
Start the Analyzing Model.
The output data which has been configured within the started Analyzing Model becomes available within
the MDS Explorer.
Compare the output of both Analyzing Models within the Monitoring System.
Both Analyzing Models produce identical output data.
Stop both Analyzing Models.
The data which have been configured within the started Analyzing Models are being removed from the
MDS Explorer.
Ready
At this point you know how to use a User Function within an Analyzing Model.
English
Release 2012-09
100 / 182
SIPLUS CMS X-Tools - User Manual - 01 - Introduction
6.15.5
SIPLUS CMS
Using of User Functions within Analyzing Scripts
Provide some online Data
• Ensure that there is some online data available within the MDS Explorer.
Functionality
• Within the ANS Explorer, expand the “Main -> Servers -> YourServer -> Libraries -> User Functions”
branch.
• The present User Functions can be dropped into the ASE Standard T001.
• The syntax for using of User Functions is identical to the syntax of Analyzing Functions.
• After the Analyzing Script has been completed, it can be saved and started.
Try it out
Create a new, empty Analyzing Script.
Drag&Drop the User Function “HelloW”, which has been created during the previous tutorial, from the
ANS Explorer into the ASE Standard T001.
Provide two online data from the MDS Explorer as parameters for HelloW().
Specify a data name for the return value of HelloW().
The Analyzing Script looks like in the following example:
Figure 47: ASE Standard T001 with the HelloW() User Function
Start the Analyzing Script.
The output data which has been configured within the started Analyzing Script becomes available within
the MDS Explorer.
Create another new, empty Analyzing Script.
Drag&Drop the User Function “HelloW2”, which has been created during the previous tutorial, from the
ANS Explorer into the ASE Standard T001.
English
Release 2012-09
101 / 182
SIPLUS CMS X-Tools - User Manual - 01 - Introduction
SIPLUS CMS
Provide two online data from the MDS Explorer as first two parameters for HelloW() and specify a data
name for the to be returned data as third parameter.
The Analyzing Script looks like in the following example:
Figure 48: ASE Standard T001 with the HelloW2() User Function
Start the Analyzing Script.
The output data which has been configured within the started Analyzing Script becomes available within
the MDS Explorer.
Compare the output of both Analyzing Scripts within the Monitoring System.
Both Analyzing Script produce identical output data.
Stop both Analyzing Scripts.
The data which have been configured within the started Analyzing Scripts are being removed from the
MDS Explorer.
Ready
At this point you know how to use a User Function within an Analyzing Script.
English
Release 2012-09
102 / 182
SIPLUS CMS X-Tools - User Manual - 01 - Introduction
6.15.6
SIPLUS CMS
Behavior of User Functions
The following list provides information about the special requirements and functionalities of User Functions:
• User Functions can be protected against reading.
o In case a password has been specified for a User Function, the User Function can not be opened
within the UFE Standard T001 without entering of the proper password.
o The password functionality of User Functions is independent to the user account which has been used
for the login to the X-Tools Server.
o Protected User Functions are stored to disk with encryption, thus the contents of protected User Functions also can not be read outside of X-Tools.
• Analyzing Models can be converted into User Functions and vice versa.
o Within the AME Standard T001, the Convert button can be pressed in order to convert the currently
opened Analyzing Model into a User Function. The default values for new User Functions are being
used for all parameters and settings of the new User Function.
o Within the UFE Standard T001, the Convert button can be pressed in order to convert the currently
opened User Function into an Analyzing Model. The default values for new Analyzing Models are being used for all parameters and settings of the new Analyzing Model.
• User Function Libraries
o Each User Function which is present within any of the currently present Configuration File locations
also is shown below the “Main -> Servers -> YourServer -> Libraries -> User Functions” branch. From
there, the User Functions can be edited and they can be dropped into Analyzing Models and Analyzing Scripts.
o Each User Function is displayed below the category which has been specified within the User Function Properties table of the UFE Standard T001.
• The short and full names of each User Function must be unique.
o In case there is an Analyzing Function with the same name as a User Function, the Analyzing Function is being used for the calculation and the User Function is being ignored.
o In case there are two User Functions of identical name, none of them is being used for the calculation
and the parent Analyzing Model or Analyzing Script suspends.
o User Functions which have a naming conflict (either with an Analyzing Function or with another User
Function) show this status via an additional icon below the “Main -> Servers -> YourServer -> Libraries
-> User Functions” branch.
o In order to resolve the naming conflict of a User Function, the according User Function must be
opened, the short and/or full names must be changed and the User Function must be saved afterwards.
English
Release 2012-09
103 / 182
SIPLUS CMS X-Tools - User Manual - 01 - Introduction
6.15.7
SIPLUS CMS
Examples of User Functions
The example location which is delivered together with X-Tools contains a few examples of User Functions. For
each User Function there are also examples of Analyzing Models and Analyzing Scripts available:
• ConvI16ToB
o Description
Shows how to convert a single 16-bit Integer into 16 single bits.
o Example Analyzing Models
Conversion\ConvI16ToB 01 (online data)
Conversion\ConvI16ToB 02 (offline data)
o Example Analyzing Scripts
Conversion\ConvI16ToB 01 (online data)
Conversion\ConvI16ToB 02 (offline data)
o Example Monitoring Views
Example for ConvI16ToB()
This Monitoring View shows the online and offline output of the Analyzing Models and Analyzing
Scripts.
• MyFFT
o Description
o Shows how to create a User Function which embeds all functionality for calculating of standardized
FFTs.
o Example Analyzing Models
Spectral\MyFFT 01 (online data)
o Example Analyzing Scripts
Spectral\MyFFT 01 (online data)
• MyRMS
o Description
o Example Analyzing Models
Statistic\MyRMS 01 (online data)
o Example Analyzing Scripts
Statistic\MyRMS 01 (online data)
English
Release 2012-09
104 / 182
SIPLUS CMS X-Tools - User Manual - 01 - Introduction
6.16
SIPLUS CMS
Storage of offline Data via Storage Profiles
6.16.1
General Description
In this chapter you will learn how to store offline data from the MDS Explorer with the Storage System via
Storage Profiles for offline data. A Storage Profile for offline data contains all of the information which is needed
in order to perform the storage of offline data to a storage location. This information includes, among others, the
names of the to-be-stored data, paths, trigger settings and clean-up settings. Multiple Storage Profiles can be
started and running simultaneously at any time.
The offline data which is being stored by a running Storage Profile can be loaded as offline data afterwards via
an Offline Data Loader.
Examples of Storage Profiles are found within the example Configuration File location which is being delivered
together with X-Tools. See also point 6.9 for information about how to store online data via Storage Profiles. In
addition, point 6.9 also shows how to open existing Storage Profiles and how to start and stop Storage Profiles as these operations are equal for all Storage Profiles, these operations are not being explained within this chapter again.
Whenever a Storage Profile with offline data as input runs into an error, it stops automatically. This is different to
Storage Profiles with online data as input, which suspend in such a situation and attempt to resume after the
error condition is gone. The main reasons for this different kind of handling are:
• for Storage Profiles with offline data as input it is much less likely that the error condition will disappear
ever
• a main use cases for Storage Profiles with offline data as input are sequential Analyzing Scripts (see
point 6.19), which could be blocked by a suspended Storage Profile without any benefit
This chapter contains the following topics:
• Creation of a new Storage Profile for offline Data
6.16.2
Creation of a new Storage Profile for offline Data
Open the STS Explorer
• Open the Storage System and ensure that the STS Explorer is displayed at the left side of the Storage
System workspace.
• Ensure that you have several data available below the “Main -> Servers -> YourServer -> Offline Data ->
All Offline Data” branch of the MDS Explorer.
Functionality
• Method 1 for the creation of a new Storage Profile:
o Within the STS Explorer, expand the “Main -> Editors -> Storage Profile Editors” branch.
o Drag the SPE Binary T001 with the left mouse into the empty space at the right side of the STS Explorer. An empty SPE Binary T001 is opened automatically.
o Press the New button in order to create a new Storage Profile. The new Storage Profile is displayed
by the SPE Binary T001 with default values.
o This method works in all cases, even in case there is no X-Tools Server connected at the moment. It
can be used for the creation and configuration of Storage Profiles for cases where the target X-Tools
Server is not present at the moment.
English
Release 2012-09
105 / 182
SIPLUS CMS X-Tools - User Manual - 01 - Introduction
SIPLUS CMS
• Method 2 for the creation of a new Storage Profile:
o Within the STS Explorer, expand the “Main -> Servers -> YourServer -> Libraries -> Storage Process
Modules” branch.
o Click onto the present STE SPM Binary T001 with the right mouse button in order to open the context
menu.
o In order to create a new Storage Profile for the storage format “Binary T001”, choose New Storage
Profile from the context menu.
o This method works only in case the target X-Tools Server is present but it is more convenient and
faster as it automatically also determines the target X-Tools Server of the new Storage Profile.
• Method 3 for the creation of a new Storage Profile:
o Within the MDS Explorer, expand the “Main -> Servers -> YourServer -> Offline Data -> All Offline
Data” branch.
o Drag&Drop the desired target data into the empty Storage System. The SPE Binary T001 is opened
automatically, a new Storage Profile is being initialized with default values and the dropped data is
added to Data table. As offline data is being dropped, the Time Domain cell within the Storage Profile
Parameters table is being set to “Offline Data with absolute Timestamps” or “Offline data with relative
Timestamps” automatically.
o This method works only in case the target X-Tools Server and the target data are present but it is
more convenient and faster as it automatically opens all windows.
• The following screenshot shows an example of a new Storage Profile.
Figure 49: SPE Binary T001 with a new Storage Profile
• See point 6.9 for detailed information about the provided controls.
• For a more detailed description of all available functionalities of the SPE Binary T001, refer to the reference manual of the “Storage System”, chapter “SPE Binary T001”.
Try it out
Create a new Storage Profile.
Specify the desired data storage location.
Change the file splitting interval to 1 minute.
English
Release 2012-09
106 / 182
SIPLUS CMS X-Tools - User Manual - 01 - Introduction
SIPLUS CMS
Add some data names to the Data table. Specify different storage modes for each of the to-be-stored
data.
Save the Storage Profile. At the first save, the Save As dialog will pop up and offers a default file name.
Change the default file name to “Hello Storage Profile for offline Data” and press OK in order to save it to
the disk.
The new Storage Profile now is displayed below the “Main -> Servers -> YourServer -> YourLocation ->
Storage Profile Files” branch of the STS Explorer.
Take a look onto the Storage Profiles which are provided via the example location (see point 6.5) in order
to see various application examples about the capabilities and usage of Storage Profiles.
Ready
At this point you know how to create a new Storage Profile which can be used in order to store offline data to
the disk.
6.17
6.17.1
3D Visualization
General Description
In this chapter you will learn how to visualize 2-dimensional data from the MDS Explorer with the 3D functionality of the Monitoring System. Several Analyzing Functions provide the results of their calculations as 2dimensional data. In order to visualize 2-dimensional data over the time, the 3D functionality of the Monitoring
System is being used.
This chapter contains the following topics:
• Visualization of Data in 3D
6.17.2
Visualization of Data in 3D
Provide some 2-dimensional Data
• Open the Analyzing System and ensure that the ANS Explorer is displayed at the left side of the Analyzing System workspace.
• Ensure that the example location is present as one of the current locations (see point 6.5.2 for how to add
an additional location).
• From the example location, start the Analyzing Model “H2D 01” which is found below the sub-folder “Statistic”. After this Analyzing Model has been started, the online data “H2DForSignal” appears within the
MDS Explorer.
Functionality
• Open the Monitoring System.
• Within the MDS Explorer, expand the “Main -> Servers -> YourServer -> Online Data -> All Online Data”
branch.
• Drag&Drop a 2-dimensional data into the empty Monitoring System. The MVE Standard T001 is
opened automatically and also opens the MTC ynm T001. In addition, the dropped data is added to and
visualized by the opened Monitoring Chart automatically.
English
Release 2012-09
107 / 182
SIPLUS CMS X-Tools - User Manual - 01 - Introduction
SIPLUS CMS
• The following screenshot shows an example of a 3D visualization:
Figure 50: MVE Standard T001 with a 3D Visualization
• Several mechanisms are available for the changing of the visualization of the displayed data:
o When the left mouse button is being pressed, the displayed cuboid can be rotated.
o When the right mouse button is being pressed, the displayed cuboid can be moved.
• Via the tool bar in the right corner of each Monitoring Chart, basic functionalities are available:
o each axis of the cuboid can be stretched and shrunken independently
o all axes of the cuboid can be stretched and shrunken simultaneously
o the cursors can be turned on/off
o the last zooming, shifting and scrolling operations can be undone/redone
o the visualization can be paused/continued
Try it out
Create a new Monitoring View.
Drag some 2-dimensional online data from the MDS Explorer into the Monitoring View in order to visualize the data curves.
Pause the visualization, turn the cursors on and take a look onto the displayed measurement values.
Continue the visualization, zoom into the visualization, shrink and stretch the axes scaling, rotate and
move the cuboid and use the undo/redo buttons. Repeat these operations in random order in order to adjust the visualization to the needs of the current application.
Ready
At this point you know how to visualize 2-dimensional data with the 3D functionality of the Monitoring System.
English
Release 2012-09
108 / 182
SIPLUS CMS X-Tools - User Manual - 01 - Introduction
6.18
SIPLUS CMS
Safe Mode
6.18.1
General Description
In this chapter you will learn how to use the safe mode of the X-Tools Server in order to recover automatically
from severe error conditions and in order to allow the X-Tools Server to continue with its measurement, analysis and storage tasks afterwards.
This chapter contains the following topics:
• Important Facts
• Safe Mode
• X-Tools Service
6.18.2
Important Facts
During the startup of the X-Tools Server, each operation (e.g. initialization of a component or start of a Configuration File, …) is logged into an according Initialization Log File. When a severe error (e.g. a crash or a hang,
…) is being detected and the X-Tools Server is being restarted in safe mode afterwards, the formerly created
Initialization Log File is being examined and the operation which probably caused the previous error is not being
executed again. Thus, the remaining functionality which has been configured can be started and executed by
the X-Tools Server.
To sum up, the safe mode detects severe error conditions, shall reduce the downtime and shall keep the application running.
6.18.3
Safe Mode
In order to allow the X-Tools Server to startup in safe mode it must be started with the “/safe” command line
parameter. Even in case the “/safe” command line parameter is being provided, the X-Tools Server starts up in
safe mode only in case the Initialization Log File indicates an error during the previous execution. Typically,
there is no need to start the X-Tools Server manually because it is started automatically either by the X-Tools
Client or during the startup of Windows. The X-Tools Client starts the X-Tools Server without the “/safe” command line parameter, whereas the “/safe” command line parameter is being used whenever the X-Tools Server
is being started automatically during the startup of Windows or by the X-Tools Service.
In case the X-Tools Server starts up in safe mode, an artificial delay of 30 seconds is inserted between the
starts of any two Configuration Files. In addition, according log messages are added to the System Log during
the startup in safe mode.
In case a severe error has been detected and the X-Tools Server is restarted in safe mode afterwards, an
email notification can be sent to the configured email recipients (see Global Options Editor, refer to the reference manual of the “Main Management System”, chapter “Global Options Editor”).
The icon of an X-Tools Server which is running in safe mode indicates this special operating condition:
Icon
Description
(normal operation)
The X-Tools Server is running normally.
(safe mode)
The X-Tools Server is running in safe mode.
English
Release 2012-09
109 / 182
SIPLUS CMS X-Tools - User Manual - 01 - Introduction
6.18.4
SIPLUS CMS
X-Tools Service
In case the X-Tools Server crashes or hangs it must be restarted by another application. The X-Tools Service
takes over this task and must be enabled in order to enable the restart functionality. In order to enable the restart through the X-Tools Service, choose “Automatically restart the X-Tools Server in case it stops to operate
normally” for the Automated Restart setting within the Global Options of the X-Tools Server.
When it is enabled, the X-Tools Service constantly monitors the X-Tools Server and restarts it automatically in
case of a detected crash or hung. In addition, the X-Tools Service itself is monitored by Windows and Windows
restarts the X-Tools Service automatically in case it disappears. In case the context menu of the X-Tools
Server (from the task bar of Windows) is not available for any reason and the X-Tools Server must be stopped,
the X-Tools Service must be stopped earlier via the “Services” dialog of Windows which is found in “Start” ->
“Control Panel” -> Administrative Tools” -> “Services”. If the X-Tools Service would not be stopped and the XTools Server would be killed (e.g. via the Task Manager), it would be restarted automatically by the X-Tools
Service.
6.19
6.19.1
Sequence Control
General Description
In this chapter you will learn how to use the sequence control in order to automatically start and stop any measurement and analysis tasks. The sequence control is configured within an Analyzing Script and is being used
especially for applications where the to-be-performed analysis tasks exceed the calculation possibilities of the
used computer. In such a case, multiple analysis tasks can be performed after each other instead of parallel,
which allows more complex analysis tasks.
This chapter contains the following topics:
• Important Facts
• Provided Analyzing Functions
• Example
6.19.2
Important Facts
In order to configure a sequence control of measurement and analysis tasks, a simple Analyzing Script is being
used. The Analyzing Script calls Analyzing Functions in order to start and stop all of the needed Configuration
Files. An example use case could be:
Start an Interface Profile
in order to connect to the
devices of interest
Start the Device Profiles
of interest (e.g. with sample rate 1)
Start the Storage Profiles
in order to store the results
of the calculations
Start the Analyzing Models/Scripts
of interest
Stop the Device Profiles
and Interface Profiles
Perform the next analyis,
e.g. with changed sample rates
or with changed calculations
...
Figure 51: Example Use Case for the Sequence Control
English
Release 2012-09
110 / 182
SIPLUS CMS X-Tools - User Manual - 01 - Introduction
6.19.3
SIPLUS CMS
Provided Analyzing Functions
The following Analyzing Functions are being used for the execution of the sequence control. Refer to the reference manual of the “Analyzing System”, chapter “Analyzing Functions” for detailed information about each of
these Analyzing Functions.
Start()
• allows to start a Configuration File (an Interface Profile, a Device Profile, an Analyzing Model, an Analyzing Script or a Storage Profile)
• via the “WaitMode” parameter it can be configured whether Start() shall wait until the specified Configuration File has finished its operation or not
o typically it does not make sense to wait for Interface Profiles and Device Profiles or for Analyzing
Models, Analyzing Scripts and Storage Profiles in case they are operating on online data
o in case of Analyzing Models, Analyzing Scripts and Storage Profiles which are operating on offline
data, it can make sense to wait until the execution (e.g. the calculation or the storage) has finished
• the “Start 01” Analyzing Script within the example location shows another example about how to use this
Analyzing Function
Pause()
• allows to pause a Configuration File (an Interface Profile, a Device Profile, an Analyzing Model, an Analyzing Script or a Storage Profile)
• the “Pause 01” Analyzing Script within the example location shows another example about how to use
this Analyzing Function
Continue()
• allows to continue a Configuration File (an Interface Profile, a Device Profile, an Analyzing Model, an
Analyzing Script or a Storage Profile)
• via the “WaitMode” parameter it can be configured whether Continue() shall wait until the specified Configuration File has finished its operation or not
o typically it does not make sense to wait for Interface Profiles and Device Profiles or for Analyzing
Models, Analyzing Scripts and Storage Profiles in case they are operating on online data
o in case of Analyzing Models, Analyzing Scripts and Storage Profiles which are operating on offline
data, it can make sense to wait until the execution (e.g. the calculation or the storage) has finished
• the “Pause 01” Analyzing Script within the example location shows another example about how to use
this Analyzing Function
Stop()
• allows to stop a Configuration File (an Interface Profile, a Device Profile, an Analyzing Model, an Analyzing Script or a Storage Profile)
• the “Stop 01” Analyzing Script within the example location shows another example about how to use this
Analyzing Function
RemoveData()
• in case an Analyzing Model or Analyzing Script is operating on offline data, the calculated results remain
below “Main -> Servers -> YourServer >Offline Data -> All Offline Data” also after the Analyzing
Model/Script has been stopped so that other systems (e.g. following Analyzing Models/Scripts or following Storage Profiles) can continue to process these results
• in order to remove previously created offline data automatically, RemoveData() is being used
• the “RemoveData 01” Analyzing Script within the example location shows another example about how to
use this Analyzing Function
English
Release 2012-09
111 / 182
SIPLUS CMS X-Tools - User Manual - 01 - Introduction
SIPLUS CMS
WaitForCF()
• allows to wait until a Configuration File has reached the specified state
• this Analyzing Function is being used especially in cases where multiple Analyzing Models/Scripts and/or
Storage Profiles have to run in parallel, because it allows to use Start() in order to start these multiple
Configuration Files first and to wait until the last of them has reached the state of interest afterwards
• the “WaitForCF 01” Analyzing Script within the example location shows another example about how to
use this Analyzing Function
WaitForEDT()
• allows to wait until a certain date and time has been reached
• this Analyzing Function can be used in order to perform measurement and analysis tasks periodically,
e.g. once each hour or once each day
• the “WaitForEDT 01” Analyzing Script within the example location shows another example about how to
use this Analyzing Function
IsDataPrsnt()
• allows to check whether the specified data is currently present within X-Tools
• this Analyzing Function can be used in order to verify the execution during the processing of a measurement and analyzing task
• it also can be used in order to wait until a certain data becomes available, e.g. in case there are analyzing
tasks which are depend from each other (one Analyzing Model/Script bases on the data which has been
calculated by a previous Analyzing Model/Script)
• the “IsDataPrsnt 01” Analyzing Script within the example location shows another example about how to
use this Analyzing Function
Exit()
• allows to stop the execution of the Analyzing Model or Analyzing Script which calls this Analyzing Function
• this Analyzing Function can be used in order to stop an Analyzing Model or Analyzing Script which calls it,
e.g. in case a certain condition is reached
• the “Exit 01” and “Exit 02” Analyzing Scripts as well as the “Exit 01” and “Exit 02” Analyzing Models within
the example location show other examples about how to use this Analyzing Function
English
Release 2012-09
112 / 182
SIPLUS CMS X-Tools - User Manual - 01 - Introduction
6.19.4
SIPLUS CMS
Example
The “Sequence Control” directory of the Analyzing Scripts within the example location contains the Analyzing
Script “Sequence Control 01”. This Analyzing Script shows different examples for the execution of automated
measurement and analysis tasks:
• sequential processing of analyzing tasks:
var PerformSequentialCalculations()
{
// start the Interface Profile which enables the simulated devices
Start("://Simulation T001.ipf.xts", "DoNotWait");
// start the Device Profiles of the simulated devices
Start("://ION AnalogInput T001.dpf.xts", "DoNotWait");
Start("://ION SIMATIC S7 PN.dpf.xts", "DoNotWait");
// execute the desired calculations (one after the other)
Start("://Sequence Control/Sequence Control 01.amf.xts", "Wait");
Start("://Sequence Control/Sequence Control 02.asf.xts", "Wait");
// store the calculated data
Start("://Sequence Control 01.spf.xts", "Wait");
// stop the Device Profiles
Stop("://ION AnalogInput T001.dpf.xts");
Stop("://ION SIMATIC S7 PN.dpf.xts");
// stop the Interface Profile
Stop("://Simulation T001.ipf.xts");
// remove the calculated data
RemoveData("://Sequence Control/Sequence Control 01.amf.xts");
RemoveData("://Sequence Control/Sequence Control 02.asf.xts");
}
English
Release 2012-09
113 / 182
SIPLUS CMS X-Tools - User Manual - 01 - Introduction
SIPLUS CMS
• parallel processing of analyzing tasks:
var PerformParallelCalculations()
{
// start the Interface Profile which enables the simulated devices
Start("://Simulation T001.ipf.xts", "DoNotWait");
// start the Device Profiles of the simulated devices
Start("://ION VIB-A T001.dpf.xts", "DoNotWait");
Start("://IFN VIB-ACC.dpf.xts", "DoNotWait");
// execute the desired calculations (in parallel)
Start("://Sequence Control/Sequence Control 02.amf.xts", "DoNotWait");
Start("://Sequence Control/Sequence Control 03.asf.xts", "DoNotWait");
// wait until both calculations have finished
WaitForCF("://Sequence Control/Sequence Control 02.amf.xts", "Stopped");
WaitForCF("://Sequence Control/Sequence Control 03.asf.xts", "Stopped");
// store the calculated data
Start("://Sequence Control 02.spf.xts", "Wait");
// stop the Device Profiles
Stop("://ION VIB-A T001.dpf.xts");
Stop("://IFN VIB-ACC.dpf.xts");
// stop the Interface Profile
Stop("://Simulation T001.ipf.xts");
// remove the calculated data
RemoveData("://Sequence Control/Sequence Control 02.amf.xts");
RemoveData("://Sequence Control/Sequence Control 03.asf.xts");
}
English
Release 2012-09
114 / 182
SIPLUS CMS X-Tools - User Manual - 01 - Introduction
SIPLUS CMS
• resolving of dependencies between analyzing tasks:
var PerformDependentCalculations()
{
// start the Interface Profile which enables the simulated devices
Start("://Simulation T001.ipf.xts", "DoNotWait");
// start the Device Profiles of the simulated devices
Start("://ION VIB-A T001.dpf.xts", "DoNotWait");
Start("://IFN VIB-ACC.dpf.xts", "DoNotWait");
// execute the desired calculations (in parallel)
Start("://Sequence Control/Sequence Control 02.amf.xts", "DoNotWait");
while(IsDataPrsnt($'Add') == false)
{
// wait until the data "Add" becomes available
}
Start("://Sequence Control/Sequence Control 04.asf.xts", "DoNotWait");
// wait until both calculations have finished
WaitForCF("://Sequence Control/Sequence Control 02.amf.xts", "Stopped");
WaitForCF("://Sequence Control/Sequence Control 04.asf.xts", "Stopped");
// stop the Device Profiles
Stop("://ION VIB-A T001.dpf.xts");
Stop("://IFN VIB-ACC.dpf.xts");
// stop the Interface Profile
Stop("://Simulation T001.ipf.xts");
// remove the calculated data
RemoveData("://Sequence Control/Sequence Control 02.amf.xts");
RemoveData("://Sequence Control/Sequence Control 04.asf.xts");
}
The following listing contains the main loop of the example Analyzing Script “Sequence Control 01”:
var main()
{
while(1)
{
// run our three different measurement and analyzing tasks forever
PerformSequentialCalculations();
PerformParallelCalculations();
PerformDependentCalculations();
}
}
Try it out
Start the Analyzing Script “Sequence Control 01” from the example location (“Files\Example Location\Analyzing Script Files\Sequence Control 01”).
See how the different Configuration Files are being started and stopped.
Check the offline data which is being stored by each execution of the measurement and analyzing tasks.
Add your own functionality to the participating Configuration Files in order try out additional possibilities.
Ready
At this point you know how to use the basic mechanisms of the sequence control. Refer to the descriptions of
the available Analyzing Functions and to the best practices in order to learn more about the detailed functionalities and about the most common use cases.
English
Release 2012-09
115 / 182
SIPLUS CMS X-Tools - User Manual - 01 - Introduction
6.20
SIPLUS CMS
Opening of Monitoring Views via the Command Line
6.20.1
General Description
In this chapter you will learn how to open the X-Tools Client with an additional command line parameter so that
it automatically opens the specified Monitoring View.
This chapter contains the following topics:
• Command Line Syntax
6.20.2
Command Line Syntax
Prepare a Monitoring View
• Ensure that you have a Monitoring View with the name “Open me” below the “Default Location” of the XTools Server.
• Close the X-Tools Client and the X-Tools Server.
Functionality
• In order to open a Monitoring View automatically after the startup of the X-Tools Client, the “/openMVF”
command line parameter is provided.
• The syntax of “/openMVF” is defined as follows:
o /openMVF “ServerName - LocationName://[Path/]FileName
• Examples for the command line parameters:
o /openMVF “YourServer - Default Location://Open me”
o /openMVF “YourServer - Default Location://SubDirectory/Open me”
• In case multiple Monitoring Views shall be opened, multiple “/openMVF” command line parameters with
to-be-opened Monitoring Views can be specified.
• Examples for the full command line:
o “C:\SIPLUS CMS\X-Tools\Client\Bin\X-Tools Client.exe” /openMVF “YourServer - Default Location://Open me”
o “C:\SIPLUS CMS\X-Tools\Client\Bin\X-Tools Client.exe” /openMVF “YourServer - Default Location://Open me” /openMVF “YourServer - Default Location://SubDirectory/Open me”
• In case the X-Tools Client is running already when such a command line is ran again, the already running X-Tools Client is re-used and displays the specified Monitoring Views.
o All Monitoring Views which are not part of the command line are closed automatically, no matter
whether they contain unsaved changes at the moment or not.
Try it out
Close the X-Tools Client and the X-Tools Server.
Create a shortcut to the executable of the X-Tools Client (“X-Tools Client.exe”).
Edit the shortcut and add the “/openMVF” command line parameters together with the path to an existing
Monitoring View.
Save and execute the shortcut.
The X-Tools Client is being started and starts the X-Tools Server automatically. In addition, the specified Monitoring View File is being opened and visualizes the previously configured data.
Ready
At this point you know how to use the command line parameters of the X-Tools Client in order to automatically
open a Monitoring View after the startup of the X-Tools Client.
English
Release 2012-09
116 / 182
SIPLUS CMS X-Tools - User Manual - 01 - Introduction
6.21
SIPLUS CMS
Storing of Data Snapshots out of the Monitoring System
6.21.1
General Description
In this chapter you will learn how to store a snapshot of the data which is currently being visualized by the Monitoring System.
This chapter contains the following topics:
• Storing of Data Snapshots
6.21.2
Storing of Data Snapshots
Open a Monitoring View
• Open a Monitoring View and display data with at least two different Monitoring Charts, for example one
MTC yt T001 and one MTC yx T001.
Functionality
• Press the Store Data Snapshot button from the Toolbar Area of one Monitoring Chart in order to create
a snapshot of the currently visualized data.
• The functionality of the data snapshot can be configured to either store only the data from the Monitoring
Chart whose Store Data Shapshot button has been pressed or to store all of the data from all Monitoring
Charts of the current Monitoring View.
o The scope of the data snapshot (current Monitoring Chart or current Monitoring View) can be configured via the Data Snapshot Scope menu item of the context menu of the Store Data Snapshot button
and via the Data Snapshot Scope parameter of the Chart Options dialog.
• In case of Monitoring Charts which display a time interval of data (e.g. the MTC yt T001 or the MTC yx
T001), the currently displayed time interval of the currently displayed data is being stored.
• In case of Monitoring Charts which display a point in time (e.g. the MTC yn T001 or the MTC ynm
T001), the currently displayed point in time of the currently displayed data is being stored.
• After the Store Data Snapshot button has been pressed, a copy of the to-be-stored data is being created
automatically. After the storing has been completed, the memory which has been used for the copy is
freed again.
• While the storing is going on, the Storage Progress dialog is being shown and displays information
about the progress of the storing. The Cancel button of the Storage Progress dialog can be used in order to cancel the ongoing storing.
• Multiple data snapshots can be stored in parallel in case the Store Data Snapshot button is pressed multiple times.
• The data snapshot can be created for all types of data, for offline data and for paused or running online
data.
• All offline data files which are created by a data snapshot are stored into one common directory. The
name of the created directory starts with “Data Snapshot” and also contains the date and time of the storing.
• The name of each offline data file consists out of the name of the data and of the date and time of the
moment of the storing in order to receive unique file names also for scenarios where the same data name
is present within the issuing Monitoring Chart multiple times.
• All offline data files are being stored to the offline data location which was used by the last store or advanced store operation.
English
Release 2012-09
117 / 182
SIPLUS CMS X-Tools - User Manual - 01 - Introduction
SIPLUS CMS
Try it out
Display some data within a Monitoring Chart.
Store a snapshot of the displayed data.
After the snapshot has been stored, load the stored offline data.
Display the loaded data within a new Monitoring Chart and verify that the correct values and times of all
data have been stored.
Ready
At this point you know how to use the data snapshot functionality in order to store all of the values of the data
which are currently visualized by a Monitoring Chart.
6.22
Receiving of Data from standard OPC UA Servers
6.22.1
General Description
In this chapter you will learn how to receive data from standard OPC UA servers.
This chapter contains the following topics:
• Connecting to an OPC UA Server
• Configuring of the Data of interest
• Using of the Data of interest
6.22.2
Connecting to an OPC UA Server
Open the DMS Explorer
• Open the Device Management System and ensure that the DMS Explorer is displayed at the left side of
the Device Management System workspace.
Functionality
• Within the DMS Explorer, expand the “Main -> Servers -> YourServer -> Interfaces” branch.
• Click onto the present “OPC UA T001” item with the right mouse button in order to open the context
menu.
• Choose New Interface Profile from the context menu.
o An IPE OPC UA T001 with a new, empty Interface Profile opens automatically.
• Within the Connections table, enter the name or IP of the target OPC UA server into the Target IP or
Name field and its port into the Port field.
• Configure the values for Server Certificate, Security Policy, Message Security, User Name and Password
to the values which are required for the successful acces to your OPC UA server.
• In case there is no OPC UA client certificate present at the X-Tools Server yet, use the OPC UA Client
Certificate table in order to create a new OPC UA client certificate - simply call the context menu from the
title bar of the OPC UA Client Certificate table or click into any of the present Value fields.
• Save the new Interface Profile.
• Start the new Interface Profile.
o The configured OPC UA server appears within the DMS Explorer below the “Main -> Servers ->
YourServer -> Interfaces -> OPC UA T001” branch.
• For a more detailed description of all available functionalities of the IPE OPC UA T001, refer to the reference manual of the “Device Management System”, chapter “IPE OPC UA T001”.
Try it out
Create a new Interface Profile in order to connect to an existing OPC UA server.
Start the new Interface Profile.
The configured OPC UA server becomes present within the DMS Explorer.
English
Release 2012-09
118 / 182
SIPLUS CMS X-Tools - User Manual - 01 - Introduction
SIPLUS CMS
Ready
At this point you know how to connect to standard OPC UA servers.
6.22.3
Configuring of the Data of interest
Open the DMS Explorer
• Open the Device Management System and ensure that the DMS Explorer is displayed at the left side of
the Device Management System workspace.
Functionality
• Within the DMS Explorer, expand the “Main -> Servers -> YourServer -> Interfaces -> OPC UA T001”
branch.
• Click onto the connected OPC UA server with the right mouse button in order to open the context menu.
• Choose New Device Profile from the context menu.
o A DPE OPC UA T001 with a new, empty Device Profile opens automatically.
• Within the Address Space table, the current address space of the OPC UA server can be browsed. The
Add as Device Profile Input Data and Add as Device Profile Output Data context menu items can be used
in order to configure any of the data of the OPC UA server to be used as input and/or output data.
o The values of all data which are added to the Device Profile Input Data table become available as
online data within the MDS Explorer after the Device Profile has been started.
o The values of all data which are added to the Device Profile Output Data table are being written cyclicly to the OPC UA server after the Device Profile has been started. In order to define which values are
to be written, the online data which shall act as source for the to-be-sent values must be entered into
the Assigned Data field.
• The Value field of the Device Profile Output Data table can be used in order to change the value of the
according data of the OPC UA server instantly, no matter whether any Device Profile is currently running
or not.
• Save the new Device Profile.
• Start the new Device Profile.
o All of the data which is present and enabled within the Device Profile Input Data table becomes present within the MDS Explorer as online data.
• For a more detailed description of all available functionalities of the DPE OPC UA T001, refer to the reference manual of the “Device Management System”, chapter “DPE OPC UA T001”.
Try it out
Create a new Device Profile in order to receive the data from the existing OPC UA server.
Start the new Device Profile.
The configured online data becomes present within the MDS Explorer.
Ready
At this point you know how to receive online data from standard OPC UA servers.
6.22.4
Using of the Data of interest
Functionality
• The online data which is received from an OPC UA server can be visualized like any other online data
within the system.
• The online data also can be used within the Analyzing System and the Storage System of X-Tools like
any other online data.
English
Release 2012-09
119 / 182
SIPLUS CMS X-Tools - User Manual - 01 - Introduction
SIPLUS CMS
Try it out
Visualize the data from the OPC UA server within the Monitoring System.
Perform simple calculations on base of the online data from the OPC UA server.
Store some of the online data from the OPC UA server.
Ready
At this point you know how to use the online data from standard OPC UA servers.
6.23
Providing of Data to standard OPC UA Clients
6.23.1
General Description
In this chapter you will learn how to use the built-in OPC UA server of X-Tools in order to provide all of the current online data to standard OPC UA clients.
This chapter contains the following topics:
• Enabling of the built-in OPC UA Server
• Using of the built-in OPC UA Server
6.23.2
Enabling of the built-in OPC UA Server
Open the MMS Explorer
• Open the Main Management System and ensure that the MMS Explorer is displayed at the left side of
the Main Management System workspace.
Functionality
• Within the Main Explorer, expand the “Main -> Servers” branch.
• Click onto the item which represents your server with the right mouse button in order to open the context
menu.
• Choose Edit Global Options from the context menu.
o A Global Options Editor with the current settings of your server opens automatically.
• Configure the setting Enable OPC UA Server to “Yes” in order to enable the built-in OPC UA server.
• Configure the setting Port to the port which shall be used by the built-in OPC UA server.
• Press the Save button from the menu in order to take over your changes.
o Changes of the used OPC UA port are taken over only at the start of the OPC UA server. In order to
change the port of an already running OPC UA server, disable the OPC UA server first and change
the to-be-used port and re-enable the OPC UA server then.
Note
Internally, the OPC UA server connects to the rest of the X-Tools Server like a standard client. Therefore, each
enabling and disabling of the built-in OPC UA server creates log entries about the attach and detach of a client
and also increases or decreases the number of connected clients which is visible within the MMS Explorer.
Note
The OPC UA server uses the user “Anonymous” in order to connect to the rest of the X-Tools Server. The only
required access right is “Read Access” for the “Online Data” functionality. Therefore, all other access rights can
be removed for the user “Anonymous” in case the X-Tools Server must be protected against unauthorized access.
English
Release 2012-09
120 / 182
SIPLUS CMS X-Tools - User Manual - 01 - Introduction
SIPLUS CMS
Try it out
Enable the built-in OPC UA server.
Ready
At this point you know how to enable and to disable the built-in OPC UA server.
6.23.3
Using of the built-in OPC UA Server
Functionality
• After the built-in OPC UA server has been enabled it can be accessed with standard OPC UA clients.
• In order to connect to the built-in OPC UA server with a standard OPC UA client, enter the IP of your PC
and the configured OPC UA port within the according mask of your OPC UA client.
Try it out
Use a standard OPC UA client in order to connect to the built-in OPC UA server.
Read values from different online data of X-Tools via the connected OPC UA client.
Ready
At this point you know how to provide the online data of X-Tools to standard OPC UA clients.
6.24
6.24.1
Creation of Screenshots out of the Monitoring System
General Description
In this chapter you will learn how to print and save a screenshot of the data which is currently being visualized
by the Monitoring System.
This chapter contains the following topics:
• Printing of Screenshots
• Saving of Screenshots
6.24.2
Printing of Screenshots
Open a Monitoring View
• Open a Monitoring View and display data with at least two different Monitoring Charts, for example one
MTC yt T001 and one MTC yx T001.
Functionality
• Call the context menu from the Curve Area of any present Monitoring Chart and choose Print Screenshot.
• The standard Print dialog of Windows opens and allows to choose which printer and which settings shall
be used for the printout.
Try it out
Display some data within a Monitoring Chart.
Print a screenshot of the displayed data.
After the screenshot has been printed, verify that the printout matches the original Monitoring View.
Ready
At this point you know how to use the screenshot functionality in order to print the appearing of the currently
visualized Monitoring View.
English
Release 2012-09
121 / 182
SIPLUS CMS X-Tools - User Manual - 01 - Introduction
6.24.3
SIPLUS CMS
Saving of Screenshots
Open a Monitoring View
• Open a Monitoring View and display data with at least two different Monitoring Charts, for example one
MTC yt T001 and one MTC yx T001.
Functionality
• Call the context menu from the Curve Area of any present Monitoring Chart and choose Save Screenshot.
• The screenshot of the current Monitoring View is being saved to the “..\X-Tools\Client\User\Screenshot”
directory of your X-Tools installation.
Try it out
Display some data within a Monitoring Chart.
Save a screenshot of the displayed data.
After the screenshot has been saved, open the created file and verify that it matches the original Monitoring View.
Ready
At this point you know how to use the screenshot functionality in order to save the appearing of the currently
visualized Monitoring View.
6.25
6.25.1
Creation of Automatic Reports out of the Monitoring System
General Description
In this chapter you will learn how to create images of the current visualizations within Monitoring Views automatically, based on a trigger data and on additional trigger information which is provided to the Monitoring View.
Whenever a Monitoring View with offline data as input runs into an error, it stops automatically. This is different
to Monitoring View with online data as input, which suspend in such a situation and attempt to resume after the
error condition is gone. The main reasons for this different kind of handling are:
• for Monitoring Views with offline data as input it is much less likely that the error condition will disappear
ever
• a main use cases for Monitoring Views with offline data as input are sequential Analyzing Scripts (see
point 6.19), which could be blocked by a suspended Monitoring View without any benefit
This chapter contains the following topics:
• Important Facts
• Creation of a Monitoring View for automatic Reports
• Trigger Examples
• Example Configuration Files
6.25.2
Important Facts
After the functionality of automatic reports has detected another event, it waits the configured capture delay
before the report is being created. Thus, the report is taken from the time “ReportTime” = “TimeOfTheTriggerEvent” + “CaptureDelay”, the visible time interval within the report is from “ReportTime” back into the past.
The report always covers the time interval which is currently configured within the Monitoring View (not “TimeInterval” + “CaptureDelay”). There is no other possibility to predefine the time interval which shall be captured by
the automatic report, thus in theory it also can be configured that the time of the actual event is not present
within the report anymore.
Automatic reports through Monitoring Views are a pure thing of the X-Tools Server. The X-Tools Client does
not take part in the creation or handling of this kind of reports at all.
English
Release 2012-09
122 / 182
SIPLUS CMS X-Tools - User Manual - 01 - Introduction
SIPLUS CMS
Each report is stored to the location which has been configured within the Automatic Reports Parameters table.
The path below the specified location contains the following parts:
● “MTE\Reports\”
● directory structure at which the Monitoring View is stored
The file name of each report contains the following parts:
● name of the Monitoring View
● timestamp at which the report has been created
○ The report is being created at the moment of the trigger event + the capture delay. However, the date
information within the file name points to the moment of the trigger event.
Example:
● Location which is specified within the Automatic Reports Parameters table: “Example Location”
● absolute path of the location “Example Location”: “C:\Example Location”
● storage path of the Monitoring View: “Example Location://Monitoring View Files\My Directory\Subfolder”
● Example file name (full path):
○ C:\Example Location\MTE\Reports\My Directory\Subfolder\My Monitoring View 2011-01-28 12-5300.000.000.000.png
The following rules apply for the created reports:
● The width of the Monitoring View, in number of pixels, matches the value of the Width cell from the Automatic Reports Parameters table.
● The height of the Monitoring View, in number of pixels, matches the value of the Height cell from the
Automatic Reports Parameters table.
● The file format and the file extension of the created file is .png.
6.25.3
Creation of a Monitoring View for automatic Reports
Open a Monitoring View
• Open a Monitoring View and display data with at least two different Monitoring Charts, for example one
MTC yt T001 and one MTC yx T001.
Functionality
• Within the Automatic Reports Parameters table, configure the desired width, height and target location for
the created automatic report files.
• Within the Automatic Reports Trigger table, specify the name of the to-be-used trigger data and the conditions at which the automatic reports shall be created.
• The Monitoring View monitors the configured trigger event and creates reports automatically after it has
been started.
• Whenever the configured trigger condition becomes true, the Monitoring View stores another report file to
the specified target location.
Try it out
Display some data within a Monitoring Chart.
Configure a trigger data and a trigger condition which is fulfilled from time to time.
Save the Monitoring View and start it.
After a report has been created, verify that the saved report matches the status of the system at the moment at which the trigger condition became true.
Ready
At this point you know how to configure Monitoring Views for the creation of automatic reports.
English
Release 2012-09
123 / 182
SIPLUS CMS X-Tools - User Manual - 01 - Introduction
6.25.4
SIPLUS CMS
Trigger Examples
The following examples show how the Automatic Reports Trigger table can be configured in order to cover different scenarios.
● Scenario 1:
○ The report shall be created
■ … only once
■ … as soon as the value of the online data “Report Trigger” is above 100
■ … with a delay of 5 seconds
○ The configuration within the Automatic Reports Trigger table can be as follows:
Parameter
Value
Trigger Mode
Once
Time Domain
Online Data with absolute Timestamps
Trigger Data Name
Report Trigger
Trigger Type
Threshold
Threshold Type
Value > Threshold
Threshold Value
100
Capture Delay Format
s
Capture Delay Value
5
● Scenario 2:
○ The report shall be created
■ … repeating
■ … as soon as the value of the online data “Report Trigger” is between 50 and 100
■ … with a hysteresis of 10
■ … with a delay of 5 seconds
○ The configuration within the Automatic Reports Trigger table can be as follows:
English
Release 2012-09
Parameter
Value
Trigger Mode
Repeating
Time Domain
Online Data with absolute Timestamps
Trigger Data Name
Report Trigger
Trigger Type
Interval
Interval Type
Inside Interval
Lower Limit
50
Upper Limit
100
Capture Delay Format
s
Capture Delay Value
5
124 / 182
SIPLUS CMS X-Tools - User Manual - 01 - Introduction
SIPLUS CMS
● Scenario 3:
○ The report shall be created
■ … repeating
■ … as soon as the binary online data “Report Trigger” shows a rising edge
■ … with a delay of 5 seconds
○ The configuration within the Automatic Reports Trigger table can be as follows:
Parameter
6.25.5
Value
Trigger Mode
Repeating
Time Domain
Online Data with absolute Timestamps
Trigger Data Name
Report Trigger
Trigger Type
Threshold
Threshold Type
Rising Edge with Threshold
Threshold Value
0.5
Hysteresis Value
0.1
Capture Delay Format
s
Capture Delay Value
5
Example Configuration Files
The Monitoring View “Example for an Automatic Report” from the example location provides an example for
automatic reports. In order to receive a report via this Monitoring View, the following Configuration Files from the
example location must be running:
● the Interface Profile “Simulation T001”
● the Device Profile “ION AnalogInput T001”
● the Analyzing Model “Abs 01”
● the Analyzing Model “AddV2D 01”
● the Analyzing Model “H2D 01”
● the Analyzing Model “FFT 01”
English
Release 2012-09
125 / 182
SIPLUS CMS X-Tools - User Manual - 01 - Introduction
SIPLUS CMS
The report which is created through this Monitoring View looks like in the following example:
Figure 52: Example for an Automatic Report
6.26
6.26.1
Creation of Reports of Analyzing Models
General Description
In this chapter you will learn how to print and save reports of Analyzing Models via the AME Standard T001.
This chapter contains the following topics:
• Important Facts
• Printing of a Report
• Saving of a Report
English
Release 2012-09
126 / 182
SIPLUS CMS X-Tools - User Manual - 01 - Introduction
6.26.2
SIPLUS CMS
Important Facts
Reports of Analyzing Models are a pure thing of the X-Tools Client. The X-Tools Server does not take part in
the creation or handling of this kind of reports at all.
Each report consists out of a draft which shows the complete Analyzing Model at a zoom level of 100 % and of
a HTML document which lists all of the information about the Analyzing Model and all of its contained (Analyzing
and User) Functions.
Each saved report is stored to the following location:
● ...\X-Tools\Client\User\Reports
The file names of each saved report contain the following parts:
● name of the Analyzing Model
● timestamp at which the report has been created
Example:
● My Analyzing Model 2011-12-05 10-07-00.000.000.000.png
● My Analyzing Model 2011-12-05 10-07-00.000.000.000.htm
6.26.3
Printing of a Report
Open an Analyzing Model
• Open an Analyzing Model which contains multiple (Analyzing and/or User) Functions.
Functionality
• Reports can be sent to any of the currently available printers via the Print Report context menu item
within the Action Area of the AME Standard T001.
Try it out
Put multiple (Analyzing and/or User) Functions into an AME Standard T001.
Print a report of the current Analyzing Model.
The standard printer dialog of Windows pops up and allows to choose the printer. The printed document
contains all information about the Analyzing Model and its contained (Analyzing and/or User) Functions
as well as a draft of the complete Analyzing Model.
Ready
At this point you know how to print reports of Analyzing Models.
6.26.4
Saving of a Report
Open an Analyzing Model
• Open an Analyzing Model which contains multiple (Analyzing and/or User) Functions.
Functionality
• Reports can be saved to file via the Save Report context menu item within the Action Area of the AME
Standard T001.
Try it out
Put multiple (Analyzing and/or User) Functions into an AME Standard T001.
Save a report of the current Analyzing Model.
Open the created HTML document.
The HTML document contains all information about the Analyzing Model and its contained (Analyzing
and/or User) Functions as well as a draft of the complete Analyzing Model.
Ready
At this point you know how to save reports of Analyzing Models.
English
Release 2012-09
127 / 182
SIPLUS CMS X-Tools - User Manual - 01 - Introduction
6.27
SIPLUS CMS
Fast Analysis via the MDS Explorer
6.27.1
General Description
In this chapter you will learn how to prepare the system in order to become able to start fast analysis tasks for
online and offline data via the MDS Explorer.
This chapter contains the following topics:
• Creation of a Location for Fast Analysis Scripts
• Creation of a new Fast Analysis Script
• Opening of existing Fast Analysis Scripts
• Using of Fast Analysis Scripts
6.27.2
Creation of a Location for Fast Analysis Scripts
Open the ANS Explorer
• Open the Analyzing System and ensure that the ANS Explorer is displayed at the left side of the Analyzing System workspace.
Functionality
• Expand the “Main -> Servers -> YourServer” branch of the ANS Explorer.
• In order to add a Fast Analysis location, call the context menu for the “Files“ item within the ANS Explorer and choose Add Location….
• Within the upcoming Add Location dialog, choose any symbolic name for your new Fast Analysis location and specify the path to this location at the disk. In addition, change the value of Location Type to
“Fast Analysis”.
• Press OK in order to add the specified location to the X-Tools Server.
• After another Fast Analysis location has been added successfully, the X-Tools Server automatically creates all of the necessary sub-directories.
o Locations of type “Fast Analysis” do not support any Configuration Files except Analyzing Scripts.
Therefore, locations of this type are visible only within the ANS Explorer and do not contain any subitems except “Analyzing Script Files”.
o Only one location of type “Fast Analysis” can be added to the X-Tools Server at any time.
Try it out
Add the “..\SIPLUS CMS\X-Tools\Server\User\Fast Analysis Location” directory as Fast Analysis location.
All of the Analyzing Scripts from the location become visible within the ANS Explorer of the X-Tools
Server.
Ready
At this point you know how to add a Fast Analysis location to the X-Tools Server.
6.27.3
Creation of a new Fast Analysis Script
Open the ANS Explorer
• Open the Analyzing System and ensure that the ANS Explorer is displayed at the left side of the Storage System workspace.
• Ensure that you have several data available below the “Main -> Servers -> YourServer -> Online Data ->
All Online Data” and “Main -> Servers -> YourServer -> Offline Data -> All Offline Data” branches of the
MDS Explorer.
English
Release 2012-09
128 / 182
SIPLUS CMS X-Tools - User Manual - 01 - Introduction
SIPLUS CMS
Functionality
• Fast Analysis Scripts are created and maintained in exactly the same way as normal Analyzing Scripts
(see point 6.14). The main difference for the creation and maintaining is that normal Analyzing Scripts are
stored to locations of type “Configuration Files” and Fast Analysis Scripts are stored to locations of type
“Fast Analysis”.
• The following things are special for Fast Analysis Scripts:
o Fast Analysis Scripts do not need pre-defined input data. Instead, variables can be used for input data
- when a Fast Analysis is started via the MDS Explorer, these variables are filled with the currently
chosen (online or offline) data and the calculation is performed on base of this data.
o The syntax for variables which shall represent input data for the Fast Analysis Script is
_’INPUT_DATA_x’, where x = 1 for the first selected data from the MDS Explorer, x = 2 for the second
selected data, x = 3 for the third selected data and so on.
The syntax like _’INPUT_DATA_1’ can be used everwhere where also the direct reference to data
(like ~’Online Data’ or $’Offline Data’) can be used.
o There is no way to define the names of the output data of Fast Analysis Scripts dynamically. Thus, the
names of all output data of a Fast Analysis Script are defined at the moment when the Fast Analysis
Script is created.
o When the context menu of the MDS Explorer is called from above an online data, it provides only
those Fast Analysis Scripts whose Output Data Class is “Online Data”. Accordingly, the context menu
provides only those Fast Analysis Scripts whose Output Data Class is “Offline Data” when it is called
from above an offline data.
Try it out
Create a new Fast Analysis Script.
Build an easy Analyzing Script which takes two variable input data, adds them together and outputs the
result.
Save the Analyzing Script to the “Fast Analysis” location. At the first save, the Save As dialog will pop up
and offers a default file name. Change the default file name to “Hello Fast Analysis” and press OK in order to save it to the disk.
The new Fast Analysis Script now is displayed below the “Main -> Servers -> YourServer -> YourLocation
-> Analyzing Script Files” branch of the ANS Explorer.
Take a look onto the Analyzing Scripts which are provided via the “Fast Analysis Location” in order to see
application examples about the capabilities and usage of Fast Analysis Scripts.
Ready
At this point you know how to create a new Fast Analysis Script which can be used in order to perform calculations based on online and/or offline data.
6.27.4
Opening of existing Fast Analysis Scripts
Open the ANS Explorer
• Open the Analyzing System and ensure that the ANS Explorer is displayed at the left side of the Analyzing System workspace.
Functionality
• Within the ANS Explorer, expand the “Main -> Servers -> YourServer -> YourLocation -> Analyzing
Script Files” branch. YourLocation must be a location of type “Fast Analysis”.
• Drag one of the below Fast Analysis Scripts with the left mouse into the empty space at the right side of
the ANS Explorer. An Analyzing Script Editor of proper type is opened automatically and displays the
dropped Fast Analysis Script.
English
Release 2012-09
129 / 182
SIPLUS CMS X-Tools - User Manual - 01 - Introduction
SIPLUS CMS
Figure 53: ASE Standard T001 with an opened Fast Analysis Script
• The opened Fast Analysis Script can be edited now. After editing, the Save and Save As… buttons are
used in order to save the edited Fast Analysis Script with all of its settings.
Try it out
Open an existing Fast Analysis Script.
Enter another storage location and change the Script Description within the Analyzing Script Settings table.
Add an additional function to the Fast Analysis Script and output also this additional result of the calculation.
Save the Fast Analysis Script via the Save button.
The modified Fast Analysis Script is still displayed below the “Main -> Servers -> YourServer -> YourLocation -> Analyzing Script Files” branch of the ANS Explorer.
Ready
At this point you know how to open and modify an existing Fast Analysis Script.
6.27.5
Using of Fast Analysis Scripts
Open the MDS Explorer
• Ensure that you have several data available below the “Main -> Servers -> YourServer -> Online Data ->
All Online Data” and “Main -> Servers -> YourServer -> Offline Data -> All Offline Data” branches of the
MDS Explorer.
• Ensure that you have some Fast Analysis Scripts with an Output Data Class of “Online Data” and some
Fast Analyzing Scripts with an Output Data Class of “Offline Data” available within a “Fast Analysis” location.
English
Release 2012-09
130 / 182
SIPLUS CMS X-Tools - User Manual - 01 - Introduction
SIPLUS CMS
Functionality
• Within the MDS Explorer, call the context menu from an online data and choose any of the sub-items of
the Fast Analysis context menu item.
• The Fast Analysis Status dialog opens automatically and displays the current status of the ongoing fast
analysis.
o The Show Log button can be used in order to open a System Log Viewer which contains all log entries that are dependent to the running analysis.
o The Cancel button can be used in order to stop the running analysis and to close the Fast Analysis
Status dialog.
• Within the MDS Explorer, call the context menu from an offline data and choose any of the sub-items of
the Fast Analysis context menu item.
• The Fast Analysis Status dialog opens automatically and displays the current status of the ongoing fast
analysis.
o The Show Log button can be used in order to open a System Log Viewer which contains all log entries that are dependent to the running analysis.
o The Cancel button can be used in order to stop the running analysis and to close the Fast Analysis
Status dialog.
• The following things must be considered for the usage of Fast Analysis Scripts:
o Running of a Fast Analysis Script is a temporary operation - therefore, Fast Analysis Scripts are not
remembered for to-be-restarted during the next startup of the X-Tools Server, even when they were
running at the moment of the shutdown of the X-Tools Server.
o It is not possible to use the same Fast Analysing Script for more than one analysis at a time.
o The Fast Analysis Status dialog is shown only by the X-Tools Client which has been used for the
start of the analysis.
o Fast Analysis Script can be stopped and restarted via the ANS Explorer.
o The current status of each Fast Analysis Script (running or stopped) is visible within the ANS Explorer.
o In case a Fast Analysis Script would have to suspend, the fast analysis is stopped with an error (it
won’t resume).
o In case any fast analysis finishes with success, the Fast Analysis Status dialog is closed automatically. Contrary, the Fast Analysis Status dialog remains open in case a fast analysis ends with an error.
Try it out
Start a fast analysis for online data.
The output data which has been configured within the used Fast Analysis Script becomes available within
the MDS Explorer and the Fast Analysis Status dialog is opened.
View the log entries which belong to the currently running analysis.
Cancel the currently running analysis.
The data which has been configured within the used Fast Analysis Script is being removed from the MDS
Explorer and the Fast Analysis Status dialog is closed.
Start a fast analysis for offline data.
The output data which has been configured within the used Fast Analysis Script becomes available within
the MDS Explorer and the Fast Analysis Status dialog is opened. In case the offline calculation is perfomed only once, the Fast Analysis Status dialog disappears automatically after the offline calculation
has finished.
Ready
At this point you know how to use existing Fast Analysis Scripts in order to start and stop the calculations based
on the currently available online and/or offline data.
English
Release 2012-09
131 / 182
SIPLUS CMS X-Tools - User Manual - 01 - Introduction
6.28
SIPLUS CMS
Supported CSV (*.csv) Format for Data
6.28.1
General Description
In this chapter you will learn about the details of the file format which is being used for exporting and importing
of CSV (*.csv) data files.
This chapter contains the following topics:
• Exporting of Data to CSV Files
• Importing of Data from CSV Files
• CSV File Format for Data
6.28.2
Exporting of Data to CSV Files
Open the ODL Standard T001
• Open the Storage System and ensure that the ODL Standard T001 is displayed within the Storage
System workspace. The ODL Standard T001 must contain at least one offline file location of type “XTools Offline Data Files (*.sdf.xts)” and at least one offline file location of type “CSV Files (*.csv)”.
• Ensure that you have several data available below the “Main -> Servers -> YourServer -> Offline Data ->
All Offline Data” branch of the MDS Explorer.
Functionality
• Method 1 for exporting of data to CSV files:
o Within the ODL Standard T001, call the context menu from a directory or file below an offline file location of type “X-Tools Offline Data Files (*.sdf.xts)”.
o Choose Export or Advanced Export… from the context menu in order to start the export operation.
• Method 2 for exporting of data to CSV files:
o Within the MDS Explorer, call the context menu from an offline data category or from an offlne data.
o Choose Export or Advanced Export… from the context menu in order to start the export operation.
• The exported CSV file is put into the chosen/last used offline file location of type “CSV Files (*.csv)”.
• All types of offline data (simple data types, 1-dimensional buffers, 2-dimensional buffers, spectrums, …)
can be exported to CSV files.
Try it out
Export some offline data files (simple data types and extended data types) via the ODL Standard T001.
Export some offline data (simple data types and extended data types) via the MDS Explorer.
Ready
At this point you know how to export CSV data.
6.28.3
Importing of Data from CSV Files
Open the ODL Standard T001
• Open the Storage System and ensure that the ODL Standard T001 is displayed within the Storage
System workspace. The ODL Standard T001 must contain at least one offline file location of type “CSV
Files (*.csv)”.
Functionality
• Within the ODL Standard T001, call the context menu from a directory or file below an offline file location
of type “CSV Files (*.csv)”.
• Choose Append, Overwrite, Advanced Append.. or Advanced Overwrite… from the context menu in order
to start the import operation.
• Currently, only simple data types can be imported from CSV files.
English
Release 2012-09
132 / 182
SIPLUS CMS X-Tools - User Manual - 01 - Introduction
SIPLUS CMS
Try it out
Export some offline data (simple data types) via the MDS Explorer.
Use a text editor in order to change an exported CSV file.
Load the modified CSV file via the ODL Standard T001.
Compare the original offline data and the offline data from the CSV file within the Monitoring System.
Both data should be identical with exception of the part which has been modified within the text editor.
Ready
At this point you know how to modify and import CSV data.
6.28.4
CSV File Format for Data
Simple Data Types
Each CSV file has three header rows:
• The first row contains the name and description of the meta information of the file, like the name of the
data, unit of the data, start date, stop date and the number of contained values.
• The second row contains the actual values of this meta information (= the actual name, unit, start date,
stop date and number of values of the contained data).
• The third row contains the name and description of the actual values within the file, like the timestamp
and the value.
Example of typical header rows:
• Data Name;Data Unit;Start Date [ns];Stop Date [ns];Number of Values
My secret Data;GV;1194453433688958640;1194453433688959640;2
Timestamp [ns];Value
The format of the timestamp can be one of the following:
• absolute or relative time in ns since 1970-01-01 00:00:00.000.000.000 GMT
o example:
Timestamp [ns];Value
1194453433688958640;-2.36511230e-003
o During the import, all data which contain timestamps in ns between -315576000 … +315576000 (~ 10 years … + 10 years) are considered to be data with relative timestamps and all data which contain
only timestamps which are smaller or bigger are considered to be data with absolute timestamps.
• absulte timestamp in textual form
o example:
Timestamp [Date];Timestamp [Time];Timestamp [ns];Value
07.11.2007;17:37:13;688958640;-2.36511230e-003
• relative timestamp in textual form
o example:
Timestamp [Days];Timestamp [Time];Timestamp [ns];Value
0;00:00:00;123000000;-2.36511230e-003
Extended Data Types
Extended data types are formats like 1-dimensional buffers, 2-dimensional buffers or spectrums. Their export
format is principially identical to the export format of simple data types, but of course the header rows contain
other and/or additional information. In addition, also the data rows provide another format which is more suitable
for the representation of each extended data type.
Extended data types can be exported to but can not be imported from CSV files by the current version of XTools.
English
Release 2012-09
133 / 182
SIPLUS CMS X-Tools - User Manual - 01 - Introduction
6.29
SIPLUS CMS
File Associations
6.29.1
General Description
In this chapter you will learn about the types of files which can be opened in X-Tools via a double-click onto the
file within the Explorer of Windows.
This chapter contains the following topics:
• Important Facts
• Opening of Files via the Explorer of Windows
6.29.2
Important Facts
The global options of the X-Tools Client contain the parameter “X-Tools Files” within the “File Associations”
group. In case the value of this parameter is “Associate X-Tools Files with the X-Tools Client”, the X-Tools Client ensures during each startup that the following file types are associated to it through Windows:
• *.xtc
• *.xts
• *.wav
After a double-click onto an associated file within the Explorer of Windows, the X-Tools Client is started
through Windows and starts to open the chosen files. In case the X-Tools Client was running already before
the double-click, the already present X-Tools Client opens the chosen files and no new X-Tools Client is
started.
6.29.3
Opening of Files via the Explorer of Windows
Open the Explorer of Windows
• Start X-Tools and terminate afterwards in order to ensure that X-Tools can configure the file associations.
• Ensure that neither the X-Tools Server nor the X-Tools Client are running.
• Open the Explorer of Windows.
Functionality
• The following types of files can be opened by the X-Tools Client directly (without the X-Tools Server):
o Main Profiles
o Interface Profiles
o Device Profiles
o Monitoring Views
o Analyzing Models
o Analyzing Scripts
o Storage Profiles
o Loading Profiles
o System Log Files
o Global Options Files
o User Accounts Files
English
Release 2012-09
134 / 182
SIPLUS CMS X-Tools - User Manual - 01 - Introduction
SIPLUS CMS
• The following types of files can be opened by the X-Tools Client only when the local X-Tools Server is
connected to the X-Tools Client:
o offline data files (*.sdf.xts)
o WAVE files (*.wav)
o User Function Files
o current log file of the X-Tools Server
• All other types of files can not be opened within a dialog of X-Tools.
• Whenever a file of the X-Tools Server (*.xts) shall be opened, the X-Tools Client automatically attempts
to connect to the X-Tools Server.
o In case the connection succeeds and the selected files are available to the X-Tools Server (= they are
present within a known location of the X-Tools Server) they are opened via the X-Tools Server.
o In case the connection can not be established or the selected files are not available to the X-Tools
Server, the opening is either canceled (in case of files which can not be opened without the X-Tools
Server) or the user can choose whether the files shall be opened from the local file system of the XTools Client.
Try it out
Double-click onto an offline data file (*.sdf.xts) which is present within an offline file location of the XTools Server.
The offline data is loaded through X-Tools and is displayed within the Monitoring System.
Double-click onto a WAVE file (*.wav) which is present within an offline file location of the X-Tools
Server.
The offline data is loaded through X-Tools and is displayed within the Monitoring System.
Double-click onto an Interface Profile (*.ipf.xts), Analyzing Model (*.amf.xts) or onto another Configuration
File which is present within a Configuration File location of the X-Tools Server.
The Configuration File is opened through X-Tools and is displayed within its according editor.
Double-click onto a system log file (*.slf.xtc or *.slf.xts).
The system log file is opened through X-Tools and is displayed within the System Log Viewer.
Ready
At this point you know how to open offline data files and Configuration Files of X-Tools via a double-click onto
the files within the Explorer of Windows.
English
Release 2012-09
135 / 182
SIPLUS CMS X-Tools - User Manual - 01 - Introduction
7
SIPLUS CMS
Attachment A – Best Practices
7.1
Inside Operating Systems
7.1.1
General
Each of the supported operating systems shows slightly different behavior in different situations. At different
places, this behavior must be considered when using of X-Tools. The following topics describe the key places
of each operating system:
• Microsoft Windows XP
• Microsoft Windows Server 2003
• Microsoft Windows 7
In addition, the following remarks are valid for all operating systems:
• All components of X-Tools must run with administrator privileges in order to provide all of the required
functionality.
o The behavior of X-Tools is undefined in case the necessary administrator privileges are not available.
• In case the X-Tools Server has been started through the X-Tools Service (either because of the configured automated startup or because of the configured automated restart), the X-Tools Server runs in session 0.
• Multiple instances of the X-Tools Tray application can be running under each operating system, but there
can be not more than one instance of the X-Tools Tray per Windows session.
• The current Windows session of each running process can be seen within the “Session ID” column of the
“Processes” tab of the Task Manager of Windows.
7.1.2
Microsoft Windows XP
Only one user can be logged in at Microsoft Windows XP at any time. In case the option “Use Fast User Switching” is turned on within the user accounts setting of Windows, multiple Windows sessions can be present simultaneously, but still there can be only one user working with the system at any time.
In case the X-Tools Server has been started by the X-Tools Service it is running in session 0. When the XTools Server has been started through the X-Tools Service it keeps running even in case the user logs off
from session 0, because session 0 is never closed.
Session 0 is the local console of Windows XP. It can be reached by logging in to the machine via its local keyboard or by using of the “/admin” or “/console” command line parameter of Remote Desktop.
7.1.3
Microsoft Windows Server 2003
Multiple users can be logged in at and work within one Microsoft Windows Server 2003 machine simultaneously, where each logged in user has his own Windows session.
In case the X-Tools Server has been started by the X-Tools Service it is running in session 0. When the XTools Server has been started through the X-Tools Service it keeps running even in case the user logs off
from session 0, because session 0 is never closed.
Session 0 is the local console of Windows Server 2003. It can be reached by logging in to the machine via its
local keyboard or by using of the “/admin” or “/console” command line parameter of Remote Desktop.
English
Release 2012-09
136 / 182
SIPLUS CMS X-Tools - User Manual - 01 - Introduction
SIPLUS CMS
Note
By default, hardware acceleration for the visualization of graphics is disabled for Windows Server 2003. In order
to enable this hardware acceleration, open the “Display Properties” dialog of Windows, switch to the “Settings”
tab and click onto the “Advanced” button. Switch to the “Troubleshoot” tab and move the slider to “Full” before
you apply your changes via pressing of the “OK” button.
After DirectX has been installed through the setup, “dxdiag.exe” must be started from the DirectX installation
directory. Switch to the “Display” tab and configure “DirectDraw Acceleration”, “Direct3D Acceleration” and “AGP
Texture Acceleration” all to “Enabled”.
7.1.4
Microsoft Windows 7
Only one user can be logged in at Microsoft Windows 7 at any time. Multiple Windows sessions can be present
simultaneously, but there can be only one user working with the system at any time.
In case the X-Tools Server has been started by the X-Tools Service it is running in session 0. In case of Windows 7, session 0 is reserved for the system and no user can log in to this session.
In order to allow the system to start the X-Tools Server automatically, the UAC (User Accounts Control) prompt
must be disabled. The following steps can be performed in order to disable the UAC prompt:
• Open “Control Panel” -> “User Accounts”.
• Choose “Change User Account Control settings”.
• Configure the setting to “Never notify” and press “OK”.
In case the UAC prompt is not disabled it will pop up whenever the X-Tools Server should be started automatically. In this case the X-Tools Server won’t be started until a user logs in to the computer and acknowledges
the UAC prompt manually.
Note
By default, all notification icons of applications are hidden in Windows 7 when they are inactive. This applies
also to the task tray icon which is provided through the X-Tools Tray application.
In case the task tray icon of the X-Tools Tray application shall be visible permanently, press the “Show hidden
Icons” button from the task bar of Windows and press “Customize…”. Within the upcoming dialog, the behavior
of the task tray icon of the X-Tools Tray can be configured to any of the available settings and press “OK” afterwards.
Microsoft Windows 7 is delivered with two versions of the basic IEEE1394 bus driver: The so-called “new” driver
with advanced support for IEEE1394b devices and the so-called “legacy” driver. In case the new driver is installed and the IEEE1394 devices are not detected or operating properly, the legacy driver must be installed.
The legacy driver also must be installed in case the used IEEE1394 host adapter uses an IEEE1394-1995 PHY.
In order to install the legacy driver, the following steps must be performed:
• Open the Device Manager of Windows.
• Expand the “IEEE 1394 Bus host controllers” item.
• Call the context menu of your IEEE1394 host adapter and choose “Update Driver Software…”.
• Select “Browse my computer for driver software”.
• Select “Let me pick from a list of device driver on my computer” and check the box before “Show compatible hardware”.
• Select “1394 OHCI Compliant Host Controller (Legacy)” and click “Next” in order to install the legacy
driver.
English
Release 2012-09
137 / 182
SIPLUS CMS X-Tools - User Manual - 01 - Introduction
7.2
SIPLUS CMS
Time Synchronization
7.2.1
General
In case X-Tools Server and X-Tools Client are running on different computers, it is strongly recommended to
use time synchronization for the system times of these computers. Without time synchronization, the system
times of the used computers may be different and as a result the visualization within the Monitoring System
also would be shifted into the past or into the future.
The easiest way to set up time synchronization on a Windows system is to use the built-in w32time service. In
the following there is an example, how to set up a Windows time server on a Windows XP machine and how to
configure the client computers. Prinzipially the same configurations are valid also for other operating systems
like Windows Server 2003 and Windows 7.
7.2.2
Setup a Windows XP Time Server
In order to enable the time server functionality on a Windows XP machine, it is only necessary to change and
create some registry entries and to restart the Windows time service afterwards.
The following table contains the registry keys which must be updated in order to setup up the time server. The
registry keys are found below “HKEY_LOCAL_MACHINE\SYSTEM\CurrentControlSet\Services\W32Time\...”:
Registry Key
New Value
…\Config\AnnounceFlags
5
…\TimeProviders\NtpServer\Enabled
1
…\TimeProviders\NtpServer\InputProvider
1
The above values are examples which may be acceptable for a large range of applications. In case more specific settings are needed, detailed information about the exact meaning of each registry key is found within the
documentation about the windows time service which is available directly from Microsoft.
7.2.3
Setup a Windows XP Time Client
In order to enable the time synchronization on a Windows XP machine as time client, it is only necessary to
change some registry entries and to restart the Windows time service afterwards.
The following table contains the registry keys which must be updated in order to setup up the time client. The
registry keys are found below “HKEY_LOCAL_MACHINE\SYSTEM\CurrentControlSet\Services\W32Time\...”:
Registry Key
…\Config\FrequencyCorrectRate
…\Config\LargePhaseOffset
…\Config\HoldPeriod
…\Config\MaxAllowedPhaseOffset
New Value
4
1280000
5
300
…\Config\PhaseCorrectRate
7
…\Config\SpikeWatchPeriod
90
…\Config\UpdateInterval
30000
…\Parameters\NtpServer
YourNTPServerName,0x1
…\Parameters\Type
NTP
…\TimeProviders\NtpClient\Enabled
1
…\TimeProviders\NtpClient\InputProvider
1
…\TimeProviders\NtpClient\SpecialPollInterval
60
English
Release 2012-09
138 / 182
SIPLUS CMS X-Tools - User Manual - 01 - Introduction
SIPLUS CMS
The above values are examples which may be acceptable for a large range of applications. In case more specific settings are needed, detailed information about the exact meaning of each registry key is found within the
documentation about the windows time service which is available directly from Microsoft.
After the values of the Windows time service have been changed within the registry, the Windows time service
can be restarted via the following command line:
• net stop w32time && net start w32time
It is suggested to manually synchronize the system time to the time of the time server once after the time service has been configured. The manual synchronization avoids long-lasting synchronization of the system time in
case the difference between the system time and the time of the time server is big. The following command line
can be executed in order to change the current system time immediately to the time of the time server which is
configured for the Windows time service:
• net time /set /yes
The current time difference between the system time and the time of the time server can be visualized and
tracked via the following command line:
• w32tm /stripchart /computer:YourNTPServerName
7.2.4
Setup of a Computer which is Time Client and Time Server simultaneously
In case the configured time server shall synchronize its time to a global time server (like “time.windows.com”)
also, the setup of a time client also must be applied at the computer which runs the time server. In this case, this
computer acts as time server for the local time clients and in addition it is a time client which receives its time
from e.g. “time.windows.com”.
The following table contains the registry keys which must be updated in order to setup up a computer to act as
time server (for other local computers) and as time client (e.g. to “time.microsoft.com”) simultaneously. The registry keys are found below “HKEY_LOCAL_MACHINE\SYSTEM\CurrentControlSet\Services\W32Time\...”:
Registry Key
New Value
…\Config\AnnounceFlags
5
…\Config\FrequencyCorrectRate
4
…\Config\LargePhaseOffset
…\Config\HoldPeriod
…\Config\MaxAllowedPhaseOffset
1280000
5
300
…\Config\PhaseCorrectRate
7
…\Config\SpikeWatchPeriod
90
…\Config\UpdateInterval
30000
…\Parameters\NtpServer
YourNTPServerName,0x1
…\Parameters\Type
NTP
…\TimeProviders\NtpClient\Enabled
1
…\TimeProviders\NtpClient\InputProvider
1
…\TimeProviders\NtpClient\SpecialPollInterval
60
…\TimeProviders\NtpServer\Enabled
1
…\TimeProviders\NtpServer\InputProvider
1
Depending to the location of the computer, other time servers may be more suitable than “time.windows.com”. A
list of available time servers can be found at http://support.ntp.org/bin/view/Servers/StratumTwoTimeServers
and at other locations in the Internet.
English
Release 2012-09
139 / 182
SIPLUS CMS X-Tools - User Manual - 01 - Introduction
7.2.5
SIPLUS CMS
Microsoft Hotfix 951531
When you start a Windows XP based computer, the Windows time service (W32Time) obtains the current time
from the CMOS clock and sets this time to the system time. This system time is synchronized with the time
server by the W32Time service. Meanwhile, the CMOS time runs independently of the time at the time server.
When the W32Time service stops, either because the system shuts down or the service is stopped, the system
time is an accurate reflection of the time at the time server.
However, the W32Time service does not guarantee that the CMOS clock is updated. Therefore, the CMOS time
may differ from the time of the time server and may become out of synchronization.
This behavior may cause a time synchronization problem for the system clock after you restart the computer or
after the system shuts down unexpectedly.
After you apply this hotfix, the W32Time service synchronizes the current system clock to the CMOS clock when
the W32Time service shuts down. This guarantees that the time remains synchronized after the restart.
Please download the hotfix from Microsoft directly:
• http://support.microsoft.com/kb/951531
7.3
Memory Optimizations
7.3.1
General
There are two main parameters which can be used in order to configure the amount of working memory (RAM)
which is being required by X-Tools. Both are found within the Global Options Editor for the X-Tools Server:
• Default Ring Buffer Size
• Allocation Size
In addition, also loading of offline data can require a significant amount of working memory.
7.3.2
Default Ring Buffer Size
The Default Ring Buffer Sizes specifies the amount of values which are being kept in the working memory for
each online data. The amount of bytes within the working memory which are needed in order to acquire a given
number of data with a given ring buffer size is roughly calculated as follows:
• AmountOfMemory [bytes] = NumberOfData [1] * RingBufferSize [Values] * SizeOfOneValue [bytes]
• SizeOfOneValue is dependent to the data type of the data and is calculated as follows:
o SizeOfOneValue [bytes] = 8 [bytes] + n [bytes]
o 8 bytes are needed for each timestamp
o n specifies the number of bytes dependent to the data type of the data
Boolean and Integer8 values need 1 byte
Integer16 values need 2 bytes
Integer32 values need 4 bytes
Integer64 values need 8 bytes
Decimal32 values need 4 bytes
Decimal64 values need 8 bytes
English
Release 2012-09
140 / 182
SIPLUS CMS X-Tools - User Manual - 01 - Introduction
SIPLUS CMS
Example:
• 100 online data of data type “Decimal32” are acquired
• Ring Buffer Size = 100000 [Values]
Calculation:
• AmountOfMemory [bytes] = 100 * 100000 * (8 + 4) [bytes] = 114 [MBytes]
• In this example, 114 MBytes are needed in order to be able to acquire the specified data with the specified ring buffer size.
Additional Notes:
• The ring buffer size of each data must be chosen so that at least 10 seconds of data can be hold. For example, in case a data is being acquired with 40 kHz, the ring buffer must contain at least 40000 * 10 =
400000 values.
o In addition to the Default Ring Buffer Size from the Global Options Editor of the X-Tools Server,
also a more granular configuration possibility is available for applications which have to deal with data
of very different speeds. Within the Device Profile Data table of each Device Profile Editor, the Buffer
Mode and Buffer Parameters columns can be shown. With these settings the ring buffer size can be
configured for each data individually (see the reference manual for more detailed information about
these parameters). In addition, all output Analyzing Functions within Analyzing Models and Analyzing
Scripts also allow to configure individual ring buffer sizes.
• On 32 bit operationg systems, the X-Tools Server can not allocate more than 2 or 3 GBytes of working
memory. So even in case more GBytes are installed in the used machine, only 2 or 3 GBytes can be
used by the X-Tools Server. However, in case more GBytes of working memory are installed, other applications can use this additional memory and the full 2 or 3 GBytes may be available to the X-Tools
Server.
o By default, 32 bit operating systems provide a maximum of 2 GBytes of working memory to each application. In order to increase the available working memory to 3 GBytes, follow the steps from the below links:
Windows XP and Server 2003:
see http://msdn.microsoft.com/en-us/library/windows/hardware/ff556232(v=vs.85).aspx
Windows 7:
open a command prompt with admistrator rights
enter “bcdedit /set IncreaseUserVa 3072” and run this command
restart the computer
see also http://technet.microsoft.com/en-us/query/ff542202
The X-Tools Server can benefit from the increased working memory size only in case this amount
of memory is also present as physically installed RAM and it is not consumed by other applications.
• In addition to the acquiring of online data, also storing of online data via the Storage System and loading
of offline data can need a significant amount of working memory. In case of very memory-intensive applications, these three components may have to be adjusted to each other in order to achieve best results.
• The X-Tools Server refuses to allocate additional working memory in case there is not enough physical
RAM (not page file) left because the page file can cause extensive access to the hard disk and a high
page file usage would slow down all other operations significantly. Thus, increasing of the page file does
not make more working memory available for the X-Tools Server.
English
Release 2012-09
141 / 182
SIPLUS CMS X-Tools - User Manual - 01 - Introduction
7.3.3
SIPLUS CMS
Allocation Size
The Allocation Size specifies the size of the buffers which are being written to the hard disk during the storing.
Bigger buffers require more working memory and achieve better writing performance whereas smaller buffers
require less working memory but also have a significant worse writing performance. The amount of bytes within
the working memory which are needed in order to store a given number of data is roughly calculated as follows:
• AmountOfMemory [bytes] = 2 [buffers] * NumberOfData [1] * AllocationSize [bytes]
• 2 buffers are needed because there is always one buffer being filled while the other one is written to the
disk
Example:
• 100 online data shall be stored
• Allocation Size = 128 [kBytes]
Calculation:
• AmountOfMemory [bytes] = 2 * 100 * 128 [kBytes] = 25 [MBytes]
• In this example, 25 MBytes are needed in order to be able to store the specified data to the hard disk.
Additional Notes:
• In case the used hard disk is too slow to store all of the to-be-stored data, the Storage System temporarily can use more than two buffers for each to-be-stored data. In case of a temporary slow hard disk, this
mechanism can ensure that the storing is continued without a data loss, as long as there is enough working memory available for the additional buffers.
7.3.4
Offline Data
The amount of bytes within the working memory which are needed in order to load a given data is roughly calculated as follows:
• AmountOfMemory [bytes] = NumberOfValues [Values] * SizeOfOneValue [bytes]
• SizeOfOneValue is dependent to the data type of the data (see above)
Example:
• data type of the offline data file = “Decimal16”
• NumberOfValues within the offline data file = 1500 [Values]
Calculation:
• AmountOfMemory [bytes] = 1500 * (8 + 2) [bytes] = 15 [kBytes]
• In this example, 15 kBytes are needed in order to be able to load the specified data.
7.3.5
Dealing with very huge Amounts of Data
For applications where a really huge amount of data must be acquired and stored, additional details must be
considered:
• At the start of a Storage Profile, all of the files which shall receive the offline data must be created. In
case of a few thousands of files, this operation can take several tens of seconds. The actual amount of
needed time is dependent to the currently used system and especially to the speed of the hard disk.
o The Windows Task Manager can be used in order to determine the amount of time which is needed
until all files could have been created: Open the “Processes” tab and turn on the “Handles” column. After starting of a Storage Profile, one handle is being created for each offline data file - when the number of handles stays constant, the creation of files has been completed.
• In case the creation of all files takes several tens of seconds, also the ring buffers of all online data must
be configured so that they can hold their values for at least the double amount of time. In case this condition is not given, the Storage Profile will suspend very fast because it will detect that it was unable to collect all of the required data.
English
Release 2012-09
142 / 182
SIPLUS CMS X-Tools - User Manual - 01 - Introduction
SIPLUS CMS
• In case of huge amounts of data, the critical moment of the storing always is the moment of the file splitting. Thus, too little file splitting intervals would overload the system for sure and file splitting intervals below 10 minutes do not make sense.
• The Allocation Size of the Storage System can not simply be set to the smallest available value in case
of huge amounts of data. Smaller allocation sizes lead to more write operations at the hard disk. For example, in case 20 MBytes would have to be stored per second, an allocation size of 8 kByte would lead to
20 [MBytes] / 16 [kBytes] = 1280 write operations per second. As typical access time of standard hard
disks are at about 10 ms, the system would loose 1280 * 10 [ms] = 12 seconds of time only for the access
time - and this is obviously too much time when there is only one second available for the whole storing.
This detail must be considered in order to find the optimal setting for the Allocation Size.
Example:
• 2500 online data of type Decimal32 shall be acquired and stored
• all 2500 online data are acquired with 100 Hz
• the used computer has 4 GByte of RAM installed
• during a test (see above) it could be detected that the creation of 2500 files needs about 15 seconds at
the used PC
Calculations:
• Ring Buffer Size
o In case 15 seconds are needed in order to create all needed files, the ring buffer has to contain at
least 30 seconds of data. At a data rate of 100 Hz (100 values per second), the ring buffer of each
data must contain at least 100 * 30 = 3000 values.
o AmountOfMemory [bytes] = 2500 * 3000 * (8 + 4) [bytes] = 85 [MBytes]
• Allocation Size
o With the given framework, we expect to store 2500 [data] * (8 + 4) [bytes] * 100 (values per second) =
2,9 [MBytes] of data per second (plus some additional bytes for header information).
o In order to be safe, we want to achieve an average of not more than 50 write operations to the hard
disk per second. 2,9 [MBytes) / 50 = 59 [kBytes] - the next higher available Allocation Size is 64
kBytes.
o AmountOfMemory [bytes] = 2 * 2500 * 64 [kBytes] = 313 [MBytes]
• Summary
o We need at least 85 [MBytes] for the online data and 313 [MBytes] for the storing of this framework.
Higher values are suggested both for the ring buffer size and for the allocation size in case it is possible in respect to the rest of the system. The higher these values are the more reserves are available
for the X-Tools Server - however, too high values will consume more than the available amount of
physical memory which suspends the affected Configuration Files.
English
Release 2012-09
143 / 182
SIPLUS CMS X-Tools - User Manual - 01 - Introduction
7.3.6
SIPLUS CMS
Memory Management
The X-Tools Server constantly monitors the memory which is available within the whole system. In case the
total memory usage of the system is too high, the X-Tools Server automatically starts to suspend its currently
running Configuration Files in order to give memory back to the system. This is being done in order to avoid that
Windows starts to swap the data buffers of the X-Tools Server to the hard disk, because if this swapping would
be done the access (reading and writing) times to the data buffers could increase drastically and the behavior of
the X-Tools Server could become unstable.
Only the amount of physically installed memory is relevant for the calculations of the X-Tools Server, the configured size of the page file of Windows is ignored.
Suspending of Configuration Files is being performed in the following order:
• Monitoring Views are suspended first.
• Analyzing Models are suspended next.
• Analyzing Scripts are suspended next.
• Storage Profiles are suspended next.
• Device Profiles are suspended at last.
As soon as there is enough memory available in the system again, the X-Tools Server starts to resume its Configuration Files again. Resuming is being performed in the following order:
• Device Profiles are resumed first.
• Storage Profiles are resumed next.
• Analyzing Scripts are resumed next.
• Analyzing Models are resumed next.
• Monitoring Views are resumed at last.
In cases where the X-Tools Server suspends Configuration Files because of low memory conditions, the following measures can be performed:
• There may be other Windows applications running which consume large amounts of memory. Stop these
applications in order to make the memory available for the X-Tools Server.
• The amount of tasks which have to be performed by the X-Tools Server in parallel can be reduced. It
may be possible to stop Configuration Files which are not needed any more.
• It may make sense to reduce the size of the buffers for online data. The default value is found within the
Global Options Editor, additional configurations are possible within each Device Profile Editor and via
the input arguments of all output Analyzing Functions.
• There may be a huge amount of offline data being loaded at the moment. It may be possible to remove
the offline data which is not needed any more from the MDS Explorer.
• In case the used system provides less than 4 GByte of physical working memory (RAM), additional working memory can be installed.
English
Release 2012-09
144 / 182
SIPLUS CMS X-Tools - User Manual - 01 - Introduction
7.4
7.4.1
7.4.1.1
SIPLUS CMS
Measurement Tasks
Frequency Analysis
General
This chapter shows how to use the Analyzing System in order to analyze data via a frequency analysis.
For the calculation of a frequency spectrum the Fast Fourier Transform can be used, which is an algorithm to
transform a signal from the time domain into the frequency domain.
7.4.1.2
Analyzing Model
The following screenshot shows an example of an Analyzing Model for the calculation of a frequency spectrum:
Figure 54: Example of an Analyzing Model for a Frequency Analysis
In()
• reads the signal from the system and provides it to the following Analyzing Functions
Bffr()
• creates an 1-dimensional buffer with defined size (NoP (Number of Points) must be 128, 256, 512, 1024,
2048, 4096, 8192, 16384, 32768 or 65536)
FFT()
• transforms the 1-dimensional buffer from the time domain into the frequency domain
OutSpm()
• writes the calculated spectrum data to the system
English
Release 2012-09
145 / 182
SIPLUS CMS X-Tools - User Manual - 01 - Introduction
7.4.1.3
SIPLUS CMS
Example
A concrete example is provided in order to show a real-life application. The hereby used Analyzing Model File
(similar to the above screenshot, see “FFT 01”) can be found within the example location which is being delivered together with X-Tools.
Input Signal
The input signal in this example is a simple sine wave with a frequency of 5 Hz and an amplitude of 10:
Figure 55: Example of the Input Signal for the Frequency Analysis
Spectrum
The following screenshot shows the calculated frequency spectrum of the input signal. The spectrum displays
the expected peak at the frequency of 5 Hz with the amplitude of 10:
Figure 56: Example of a Frequency Spectrum which has been calculated by the Frequency Analysis
English
Release 2012-09
146 / 182
SIPLUS CMS X-Tools - User Manual - 01 - Introduction
7.4.2
SIPLUS CMS
Spectrum Monitoring
7.4.2.1
General
This chapter shows how to automate the monitoring of a frequency spectrum with a defined alarm-spectrum.
In case certain frequencies have to be monitored (e.g. gear tooth frequencies) it is possible to set alarm levels
at defined frequencies.
7.4.2.2
Analyzing Model
The following screenshot shows an example of an Analyzing Model which monitors a frequency spectrum:
Figure 57: Example of an Analyzing Model which monitors a Frequency Spectrum
In()
•
reads the signal from the system and provides it to the following Analyzing Functions
Bffr()
•
creates an 1-dimensional buffer with defined size (NoP must be 128, 256, 512, 1024, 2048, 4096, 8192,
16384, 32768 or 65536)
FFT()
•
transforms the 1-dimensional buffer from the time domain into the frequency domain
English
Release 2012-09
147 / 182
SIPLUS CMS X-Tools - User Manual - 01 - Introduction
SIPLUS CMS
GenAlrmBnd()
•
generates an alarm band
•
each alarm band is defined by its centre, width and the amplitudes of the alarm levels
•
at the argument “Mode” it can be chosen, if the alarm band is monitoring “peak” values or signal “power”
values
MonAlrmSpm()
•
generates alarm spectra (defined by the connected alarm bands and the base levels) and monitors the
connected spectrum
•
output argument “Cntrl” gets the current monitoring status and “MaxBndAmp” gets the maximal peaks of
the base band and each band
•
for a better comparison between alarm spectra (in case of signal “power” bands) a derived spectrum
can be output via “OutSpm”
•
there are additional output arguments for the visualization of alarm spectra (peak or power)
Out()
•
writes signals of simple data types (Booleans, Integers or decimals) to the system so that it can be used
by the other systems of X-Tools
OutB1D()
•
writes data of data type “1-dimensional buffer” to the system so that it can be used by the other systems
of X-Tools
OutSpm()
•
writes data of data type “spectrum” to the system so that it can be used by the other systems of X-Tools
7.4.2.3
Example
A concrete example is provided in order to show a real-life application. The hereby used Analyzing Model File
(similar to the above screenshot, see “MonAlrmSpm 01”) can be found within the example location which is
being delivered together with X-Tools.
Input Spectrum
In this example the input spectrum consists out of three added sine waves at different frequencies and with different amplitudes (see screenshot below):
Figure 58: Example of the Input Spectrum for the Spectrum Monitoring
English
Release 2012-09
148 / 182
SIPLUS CMS X-Tools - User Manual - 01 - Introduction
SIPLUS CMS
Alarm Spectrum
The following screenshot shows the input spectrum together with the alarm spectra. Within the given example
the second peak exceeds the first alarm level of the second band:
Figure 59: Example of the Input Spectrum with Alarm Spectra
Alarm Detection
There are two ways the monitored alarm can be detected.
The first way is an entry within the System Log:
Figure 60: Example of an Alarm Log Entry
The second way is to detect it via the control signal from the output argument “Cntrl”. This signal is an integer
value between 0 and 3, where
•
0 means “no alarm”
•
1 means “alarm level 0 exceeded”
•
2 means “alarm level 1 exceeded”
•
3 means “alarm level 2 exceeded”
Band Maxima
As mentioned before, there is also a way to get the maxima of each band, e.g. for trend analysis. Every time a
spectrum is being monitored the according maxima (base band and each alarm band) are written to the 1dimensional buffer “MaxBndAmp”.
It can be chosen either to use this 1-dimensional buffer or to use single values via the Analyzing Function
“GetBffrM”. Refer to the reference manual of the “Analyzing System”, chapter “GetBffrM() - GetBufferMember()”
for detailed information about this Analyzing Function.
English
Release 2012-09
149 / 182
SIPLUS CMS X-Tools - User Manual - 01 - Introduction
SIPLUS CMS
Derived Spectrum
In case there is a “power” alarm band used together with “peak” alarm bands, it is often hard to compare the
input spectrum and the alarm spectra.
Therefore a derived input spectrum can be used. The derived spectrum is a copy of the input spectrum with the
difference at the frequency range of each “power” band.
At these ranges the derived input spectrum doesn’t display the peak values, but the calculated signal “power”
value in the middle of the frequency range. See the following screenshot, where the second alarm band was
changed to a “power” band and the derived input spectrum is used in order to compare it more easily to the
“power” alarm spectrum:
Figure 61: Example of the derived Input Spectrum with Alarm Spectra
7.4.3
7.4.3.1
Order Analysis
General
This chapter shows how to use the Analyzing System in order to analyze data via an order analysis. The order
analysis is used mainly in order to monitor rotating machinery with variable speed.
For the calculation of an order spectrum the vibration signal has to be changed from time equidistant to angle
equidistant. Therefore it is necessary to measure the speed (via impulses of a trigger) additionally to the vibration. In an additional step the vibration signal has to be re-sampled depending to the speed.
After this order re-sampling the normal FFT algorithm can be applied.
7.4.3.2
Analyzing Model
The main part for the order analysis is done by the Analyzing Function “InputOrderResampling”. Within this Analyzing Function the vibration and trigger signal is defined together with some other configuration parameters.
English
Release 2012-09
150 / 182
SIPLUS CMS X-Tools - User Manual - 01 - Introduction
SIPLUS CMS
The following screenshot shows an example of an Analyzing Model for the calculation of an order spectrum:
Figure 62: Example of an Analyzing Model for the Order Analysis
In()
•
reads the signal from the system and provides it to the following Analyzing Functions
InOrdRsmpl()
•
this Analyzing Function performs the main part of the order analysis
•
the vibration signal is defined by the name which is written at argument “Signal”
•
the trigger signal is connected to the “Trigger” argument
•
the argument “NoI” defines how many impulses the trigger signal generates per revolution
•
the argument “MaxOrder” defines the maximum order, which is displayed in the order spectrum
FFT()
•
transforms the order re-sampled 1-dimensional buffer from the time domain into the order domain
OutSpm()
•
writes the calculated spectrum data to the system
English
Release 2012-09
151 / 182
SIPLUS CMS X-Tools - User Manual - 01 - Introduction
7.4.3.3
SIPLUS CMS
Example
A concrete example is provided in order to show a real-life application. The hereby used Analyzing Model File
(similar to the above screenshot, see “Files\Example Location\Analyzing Model Files\Input\InOrdRsmpl 02”) can
be found within the example location which is being delivered together with X-Tools. In addition, also the used
offline data (“Trigger” and “Vibration”) must be loaded from the offline data location which is being delivered
together with X-Tools.
Input Signals
There are two needed input signals, the vibration signal and the according trigger signal.
In the hereby given example the vibration signal consists out of two added sine waves. The first sine has a frequency of 10 Hz and an amplitude of 5. The second sine wave has a frequency of 100 Hz and an amplitude of
10. The according trigger signal (which represents the speed) is an impulse signal with a frequency of 10 Hz.
The following screenshot shows both signals:
Figure 63: Example of the Input Signals for the Order Analysis
Spectrum Calculation
In order to get a better understanding of the order analysis, additionally to the order spectrum there is also a
frequency spectrum calculated. The order spectrum is calculated by the Analyzing Model from above and the
frequency spectrum is calculated by an Analyzing Model, which can be found within the example Configuration
File location.
English
Release 2012-09
152 / 182
SIPLUS CMS X-Tools - User Manual - 01 - Introduction
SIPLUS CMS
The following screenshot shows the two calculated spectra:
Figure 64: Example of a Frequency Spectrum and of an Order Spectrum
The frequency spectrum is displayed at the top of the figure above. The two sine waves can be seen at the according frequencies with their amplitudes. The smearing of the peaks is caused by the leakage effect.
The calculated order spectrum is shown at the lower part of the figure. The unit of the x-axis is not anymore
Hertz [Hz], but orders [1]. Since the “trigger” signal was defined as an impulse signal with a constant frequency
of 10 Hz, each order represents 10 Hz. According to this the order spectrum consists out of two peaks. The first
peak is at order 1 with amplitude around 5 and the second peak at order 10 with amplitude around 10.
English
Release 2012-09
153 / 182
SIPLUS CMS X-Tools - User Manual - 01 - Introduction
7.4.4
SIPLUS CMS
Sequence Control
7.4.4.1
General
This chapter shows different methods which can be used together with the sequence control.
First, it shows how to use the Analyzing Functions Start() and Stop() in order to safely start a Configuration File.
“Safely” means that in case a Configuration File suspends, it will be stopped before moving on in the sequential
calculation.
Second, it will be shown how to define an alarm-dependent storing in parallel to a time-dependent storing. The
provided Analyzing Script stores the configured data each defined time interval and every time when an alarm
has been detected.
7.4.4.2
Example
The “Sequence Control” directory of the Analyzing Scripts within the example location contains the Analyzing
Script “Sequence Control 05”. This Analyzing Script shows an example for the safe start of Configuration Files
and for the alarm- and time- dependent storing. Because the used input signals have a random noise, the alarm
will occur not always but only sometimes. The alarm level can be changed within the Analyzing Model “Sequence Control 03” in order to receive the alarm event more or less often.
• safe start of a Configuration File:
var SafeStart(var ProfileName, var TimeOut)
{
// start the Configuration File "ProfileName" // if it suspends we wait only for the amount of seconds which are defined through "TimeOut"
Start(ProfileName,'Wait',TimeOut);
// in case the Configuration File was suspended, it will be stopped here
Stop(ProfileName);
}
• main function, which defines the time interval and calls the measurement and analyzing tasks:
var main()
{
// get the current time and define a flag to force storing
var NextStore = GetTime();
var StoreNow = false;
// define storing interval in seconds, here every 120s will be stored
var StoringInterval = 120;
// run forever
while (1)
{
// check if time
if (GetTime() >=
{
StoreNow =
NextStore +=
}
for the next store has passed
NextStore)
true;
StoringInterval;
// run measurement task
PerformCalculations(StoreNow);
// reset the storing flag
StoreNow = false;
}
}
English
Release 2012-09
154 / 182
SIPLUS CMS X-Tools - User Manual - 01 - Introduction
SIPLUS CMS
• measurement and analyzing tasks, which start and stop the different Configuration Files:
var PerformCalculations(var StoreNow)
{
// start the Interface Profile which enables the simulated devices
Start("://Simulation T001.ipf.xts","DoNotWait");
// start the Device Profiles of the simulated devices
Start("://ION AnalogInput T001.dpf.xts","DoNotWait");
// execute the desired calculations (one after the other) using SafeStart()
SafeStart("://Sequence Control/Sequence Control 01.amf.xts",100);
SafeStart("://Sequence Control/Sequence Control 03.amf.xts",100);
// $'AlarmSignal' is generated by "Sequence Control 03.amf.xts" in case of an Alarm
var Alarm = IsDataPrsnt($'AlarmSignal');
// store only if an alarm happened or the time interval has passed
if (Alarm || StoreNow)
{
// store the calculated data
SafeStart("://Sequence Control 03.spf.xts",100);
}
// stop the Device Profiles
Stop("://ION AnalogInput T001.dpf.xts");
Stop("://ION SIMATIC S7 PN.dpf.xts");
// stop the Interface Profile
Stop("://Simulation T001.ipf.xts");
// remove the calculated data
RemoveData("://Sequence Control/Sequence Control 01.amf.xts");
RemoveData("://Sequence Control/Sequence Control 03.amf.xts");
}
English
Release 2012-09
155 / 182
SIPLUS CMS X-Tools - User Manual - 01 - Introduction
7.4.5
7.4.5.1
SIPLUS CMS
X/Y Envelopes
General
This chapter shows how to use the Analyzing System in order to create x/y envelopes, how to visualize the
calculated envelopes and how to use them for monitoring of current online data against violation of these envelopes.
The visualizations, Analyzing Models and Analyzing Scripts from this chapter can be tried out because the input
data and the Analyzing Models/Analyzing Scripts are delivered together with X-Tools. The input data is found
within the “..\Server\User\Example Offline Files\X-Tools Offline Data Files\Measurement Tasks\XY Envelopes”
path of the X-Tools installation and must be loaded from there, whereas the used Analyzing Models, Analyzing
Scripts and Monitoring Views are part of the example location which is delivered together with X-Tools. The
“Measurement Tasks\XY Envelopes” subdirectory of each Configuration File type contains the Configuration
Files to which the following descriptions refer (see also point 7.4.5.6).
The provided input data has been created by storing of the output of the “10 Create Reference x and y Data”
Analyzing Model from the example location. For the generation of online x and y data which also shows violations of the calculated envelopes, the “40 Simulate x and y Data with Errors” Analyzing Model/Analyzing Script
from the example location must be started.
7.4.5.2
Creation of X/Y Envelopes
In order to create an x/y envelope, the x and y input data must be available. The following screenshots shows
the visualization of an example x and y data. This example data is delivered together with X-Tools and can be
loaded from the example offline files - in addition, the Monitoring View “Example for XY Envelopes” from the
example location can be opened in order to receive the following visualization:
Figure 65: Example of the Input Data for an X/Y Envelope
The Analyzing Function CalculateXYEnvelope() is being used for the actual calculation. This Analyzing Function
always calculates one upper and one lower band for the provided input data. In case multiple upper and lower
bands shall be monitored (e.g. in case warning and an error bands are needed), CalculateXYEnvelope() must
be called multiple times with different thresholds in order to calculate all needed envelopes.
English
Release 2012-09
156 / 182
SIPLUS CMS X-Tools - User Manual - 01 - Introduction
SIPLUS CMS
CalculateXYEnvelope() must be used within a sequential Analyzing Script in order to perform the calculation.
The following box shows the Analyzing Script “20 Create XY Envelope” from the example location, which shows
how CalculateXYEnvelope() can be used:
var main()
{
// the following offline data must be loaded:
// - x
// - y
// calculate the warning band first
$'XY Envelope StatusWarning' =
ClcXYEnv($'x',$'y',1024,0.2,0.2,0.2,0.2,
"XY Envelope XBufferWarning",
"XY Envelope UpperWarningBand",
"XY Envelope LowerWarningBand");
// calculate the error band next
$'XY Envelope StatusError' =
ClcXYEnv($'x',$'y',1024,0.4,0.4,0.4,0.4,
"XY Envelope XBufferError",
"XY Envelope UpperErrorBand",
"XY Envelope LowerErrorBand");
}
The created envelopes can be stored. Afterwards they can be loaded at any time in order to use them together
with the Analyzing Function MonitorXYEnvelope() for the monitoring of the current x and y data against the calculated envelopes.
English
Release 2012-09
157 / 182
SIPLUS CMS X-Tools - User Manual - 01 - Introduction
7.4.5.3
SIPLUS CMS
Visualization of X/Y Envelopes
The output of each call to CalculateXYEnvelope() are three 1-dimensional buffers which are ideal for the following monitoring through the Analyzing Function MonitorXYEnvelope(). However, in case the envelopes shall be
visualized together with the original input data within a MTC yx T001, the Analyzing Function ConvertBuffer1DToTimeSeries() must be used in order to convert each 1-dimensional buffer into a time series. The
following box shows the Analyzing Script “30 Prepare Visualization of XY Envelope” from the example location,
which shows how ConvertBuffer1DToTimeSeries() can be used:
var main()
{
// the following Analyzing Script must be started before this one:
// - 20 Create XY Envelope
// convert the x-buffer of the warning bands to a time series
ConvB1DToTS("XY Envelope XBufferWarning",
"XY Envelope XBufferWarningTS",
"End with Input Data Time",0.029296875);
// convert the upper warning band to a time series
ConvB1DToTS("XY Envelope UpperWarningBand",
"XY Envelope UpperWarningBandTS",
"End with Input Data Time",0.029296875);
// convert the lower warning band to a time series
ConvB1DToTS("XY Envelope LowerWarningBand",
"XY Envelope LowerWarningBandTS",
"End with Input Data Time",0.029296875);
// convert the x-buffer of the error bands to a time series
ConvB1DToTS("XY Envelope XBufferError",
"XY Envelope XBufferErrorTS",
"End with Input Data Time",0.029296875);
// convert the upper error band to a time series
ConvB1DToTS("XY Envelope UpperErrorBand",
"XY Envelope UpperErrorBandTS",
"End with Input Data Time",0.029296875);
// convert the lower error band to a time series
ConvB1DToTS("XY Envelope LowerErrorBand",
"XY Envelope LowerErrorBandTS",
"End with Input Data Time",0.029296875);
}
For the x and y input data which is delivered together with X-Tools we know that their time interval is 30 seconds (this information can be read from the MDS Explorer when the data is loaded). When the time series
which is output by ConvertBuffer1DToTimeSeries() shall cover exactly the same time interval (from the same
start time until the same stop time) as the original x and y input data, the “TimeStampMode” parameter must be
set to “End with Input Data Time” and the “TimeInterval” must be calculated with the following formula:
• TimeIntervalForConvB1DToTS = TimeIntervalOfXandY / DimensionOfClcXYEnv
For our input data and Analyzing Script this calculation delivers the following result:
• TimeIntervalForConvB1DToTS = 30 [s] / 1024 = 0.029296875
English
Release 2012-09
158 / 182
SIPLUS CMS X-Tools - User Manual - 01 - Introduction
SIPLUS CMS
However, when the output of ConvertBuffer1DToTimeSeries() is needed only for the visualization, it does not
matter whether the time intervals of the original x and y data and of the output of ConvertBuffer1DToTimeSeries() have any relation to each other - in this case, the above script can be shorter because
also the default values of ConvertBuffer1DToTimeSeries() are fully OK:
var main()
{
// the following Analyzing Script must be started before this one:
// - 20 Create XY Envelope
// convert the x-buffer of the warning bands to a time series
ConvB1DToTS("XY Envelope XBufferWarning",
"XY Envelope XBufferWarningTS");
// convert the upper warning band to a time series
ConvB1DToTS("XY Envelope UpperWarningBand",
"XY Envelope UpperWarningBandTS");
// convert the lower warning band to a time series
ConvB1DToTS("XY Envelope LowerWarningBand",
"XY Envelope LowerWarningBandTS");
// convert the x-buffer of the error bands to a time series
ConvB1DToTS("XY Envelope XBufferError",
"XY Envelope XBufferErrorTS");
// convert the upper error band to a time series
ConvB1DToTS("XY Envelope UpperErrorBand",
"XY Envelope UpperErrorBandTS");
// convert the lower error band to a time series
ConvB1DToTS("XY Envelope LowerErrorBand",
"XY Envelope LowerErrorBandTS");
}
The following screenshots shows the visualization of the example x and y data together with the calculated envelopes:
Figure 66: Example of the Input Data for an X/Y Envelope together with the calculated Envelopes
English
Release 2012-09
159 / 182
SIPLUS CMS X-Tools - User Manual - 01 - Introduction
7.4.5.4
SIPLUS CMS
Monitoring of X/Y Envelopes
After the necessary envelopes have been calculated, they can be used for monitoring of the currently present x
and y data. The following screenshot shows the Analyzing Model “50 Monitor XY Envelope” from the example
location which uses the above envelopes in order to monitor the current x and y online data:
Figure 67: Example of an Analyzing Model for the monitoring of the current x and y online Data
The same task can be solved via an Analyzing Script also - the following box shows the Analyzing Script “50
Monitor XY Envelope” from the example location:
var main()
{
// the following Analyzing Scripts must be started before this one:
// - 20 Create XY Envelope
// - 40 Simulate x and y Data with Errors
~'Control' =
MonXYEnv(~'x',~'y',
$'XY Envelope XBufferWarning',
$'XY Envelope UpperWarningBand',$'XY Envelope LowerWarningBand',
$'XY Envelope XBufferError',
$'XY Envelope UpperErrorBand',$'XY Envelope LowerErrorBand',
0,0,0,true,
~'ControlUpper',~'ControlLower');
}
Figure 68: Example of an Analyzing Script for the monitoring of the current x and y online Data
Whenever a violation of the specified envelopes is detected, MonXYEnv() creates an according log entry.
English
Release 2012-09
160 / 182
SIPLUS CMS X-Tools - User Manual - 01 - Introduction
7.4.5.5
SIPLUS CMS
Example
The offline data, Analyzing Models and Analyzing Scripts from the example locations which are delivered together with X-Tools can be used in order to reproduce the above steps (see also point 7.4.5.1).
Figure 69: Example of the Output of MonitorXYEnvelope()
7.4.5.6
Summary
The following Configuration Files are being used by this chapter:
Analyzing Models
(found in “..\Analyzing Model Files\Measurement Tasks\XY Envelopes”)
Name
Description
10 Create Reference x and y Data
This Analyzing Model can be used in order to create the reference x and y data (without
errors). It is typically not needed because the data from this Analyzing Model is available
as example offline data.
40 Simulate x and y Data with Errors
This Analyzing Model simulates online x and y data with small errors so that violations of
the calculated envelopes take place.
50 Monitor XY Envelope
This Analyzing Model monitors the online x and y data against the created x/y envelopes.
Analyzing Scripts
(found in “..\Analyzing Script Files\Measurement Tasks\XY Envelopes”)
Name
Description
20 Create XY Envelope
This Analyzing Script creates all x/y envelopes out of the previously loaded x and y offline
data.
30 Prepare Visualization of XY Envelope
This Analyzing Script converts the created x/y envelopes from a 1-dimensional buffer into
a time series. This step is needed only in case the created x/y envelopes shall be monitored via the Monitoring System.
40 Simulate x and y Data with Errors
This Analyzing Script simulates online x and y data with small errors so that violations of
the calculated envelopes take place.
50 Monitor XY Envelope
This Analyzing Script monitors the online x and y data against the created x/y envelopes.
Monitoring Views
(found in “..\Monitoring View Files\Measurement Tasks\XY Envelopes”)
Name
Description
Visualize XY Envelopes
This Monitoring View shows the original x and y offline data, the calculated x/y envelopes,
the current x and y online data and the three outputs of MonXYEnv().
English
Release 2012-09
161 / 182
SIPLUS CMS X-Tools - User Manual - 01 - Introduction
SIPLUS CMS
Offline Data
(found in “..\Example Offline Files\X-Tools Offline Data Files\Measurement Tasks\XY Envelopes”)
Name
Description
x
The x data which has been generated via the Analyzing Model “10 Create Reference x
and y Data”.
y
The y data which has been generated via the Analyzing Model “10 Create Reference x
and y Data”.
7.4.6
7.4.6.1
Spectrum Envelopes
General
This chapter shows how to use the Analyzing System in order to create spectrum envelopes, how to visualize
the calculated envelopes and how to use them for monitoring of current online data against violation of these
envelopes.
The visualizations, Analyzing Models and Analyzing Scripts from this chapter can be tried out because the input
data and the Analyzing Models/Analyzing Scripts are delivered together with X-Tools. The input data is found
within the “..\Server\User\Example Offline Files\X-Tools Offline Data Files\Measurement Tasks\Spectrum Envelopes” path of the X-Tools installation and must be loaded from there, whereas the used Analyzing Models,
Analyzing Scripts and Monitoring Views are part of the example location which is delivered together with XTools. The “Measurement Tasks\Spectrum Envelopes” subdirectory of each Configuration File type contains
the Configuration Files to which the following descriptions refer (see also point 7.4.6.6).
The provided input data has been created by storing of the output of the “10 Create Reference Spectrum” Analyzing Model from the example location. For the generation of an online spectrum which also shows violations of
the calculated envelopes, the “30 Simulate Spectrum with Errors” Analyzing Model/Analyzing Script from the
example location must be started.
7.4.6.2
Creation of Spectrum Envelopes
In order to create a spectrum envelope, the input spectrum must be available. The following screenshots shows
the visualization of an example spectrum. This example data is delivered together with X-Tools and can be
loaded from the example offline files - in addition, the Monitoring View “Example for Spectrum Envelopes” from
the example location can be opened in order to receive the following visualization:
Figure 70: Example of the Input Data for a Spectrum Envelope
The Analyzing Function SpectrumAddition() can be used in order to add an absolute or a relative value to each
amplitude of the spectrum. In case multiple envelopes shall be monitored (e.g. warning and error bands above
and below the reference spectrum), SpectrumAddition() must be called multiple times with different thresholds in
order to calculate all needed envelopes.
English
Release 2012-09
162 / 182
SIPLUS CMS X-Tools - User Manual - 01 - Introduction
SIPLUS CMS
The following screenshot shows the Analyzing Model “20 Create Spectrum Envelope” from the example location
which creates four envelopes out of the reference spectrum:
Figure 71: Example of an Analyzing Model for the Creation of Spectrum Envelopes
The same task can be solved via an Analyzing Script also - the following box shows the Analyzing Script “20
Create Spectrum Envelope” from the example location:
var main()
{
// the following offline data must be loaded:
// - Spectrum
var Spectrum;
var SpectrumReady;
Spectrum = InSpm($'Spectrum',"Default",true,SpectrumReady);
$'UpperWarningBand' = SpmAdd(Spectrum,SpectrumReady,"Absolute Value",1);
$'LowerWarningBand' = SpmAdd(Spectrum,SpectrumReady,"Absolute Value",-1);
$'UpperErrorBand'
= SpmAdd(Spectrum,SpectrumReady,"Absolute Value",2);
$'LowerErrorBand'
= SpmAdd(Spectrum,SpectrumReady,"Absolute Value",-2);
}
The created envelopes can be stored. Afterwards they can be loaded at any time in order to use them together
with the Analyzing Function MonitorSpectrumEnvelope() for the monitoring of the current spectrum against the
calculated envelopes.
English
Release 2012-09
163 / 182
SIPLUS CMS X-Tools - User Manual - 01 - Introduction
7.4.6.3
SIPLUS CMS
Visualization of Spectrum Envelopes
The output of SpectrumAdd() is a spectrum again and can be used directly for the visualization within the MTC
yn T001. The following screenshots shows the visualization of the example spectrum together with the calculated envelopes:
Figure 72: Example of the Input Data for a Spectrum Envelope together with the calculated Envelopes
7.4.6.4
Monitoring of Spectrum Envelopes
After the necessary envelopes have been calculated, they can be used for monitoring of the currently present
spectrum data. The following screenshot shows the Analyzing Model “40 Monitor Spectrum Envelope” from the
example location which uses the above envelopes in order to monitor the current online spectrum:
Figure 73: Example of an Analyzing Model for the monitoring of the current online Spectrum
In order to simulate some spectrum with errors, the Analyzing Model “30 Simulate Spectrum with Errors” must
be started. This Analyzing Model needs about 15 seconds before it can provide the output data “Spectrum”,
English
Release 2012-09
164 / 182
SIPLUS CMS X-Tools - User Manual - 01 - Introduction
SIPLUS CMS
thus the Analyzing Model “40 Monitor Spectrum Envelope” shall not be started before this time (= before the
online data “Spectrum” appears within the MDS Explorer). In case the Analyzing Model “40 Monitor Spectrum
Envelope” is started before the online data “Spectrum” becomes available, it may use the offline data “Spectrum” as input automatically.
The same task can be solved via an Analyzing Script also - the following box shows the Analyzing Script “40
Monitor Spectrum Envelope” from the example location:
var main()
{
// the following Analyzing Scripts must be started before this one:
// - 20 Create Spectrum Envelope
// - 30 Simulate Spectrum with Errors
var Spectrum;
var SpectrumReady;
Spectrum = InSpm(~'Spectrum',"Default",true,SpectrumReady);
~'Control' =
MonSpmEnv(Spectrum,SpectrumReady,
$'Spectrum Envelope UpperWarningBand',$'Spectrum Envelope LowerWarningBand',
$'Spectrum Envelope UpperErrorBand',$'Spectrum Envelope LowerErrorBand',
0,0,true,
~'ControlUpper',~'ControlLower');
}
Figure 74: Example of an Analyzing Script for the monitoring of the current online Spectrum
The Analyzing Script “40 Monitor Spectrum Envelope” explicitelly accesses the online data “Spectrum”, thus it
can be started any any point in time and won’t start to perform calculations unless the simulated online data
“Spectrum” appears within the MDS Explorer.
Whenever a violation of the specified envelopes is detected, MonSpmEnv() creates an according log entry.
7.4.6.5
Example
The offline data, Analyzing Models and Analyzing Scripts from the example locations which are delivered together with X-Tools can be used in order to reproduce the above steps (see also point 7.4.6.1).
Figure 75: Example of the Output of MonitorSpectrumEnvelope()
English
Release 2012-09
165 / 182
SIPLUS CMS X-Tools - User Manual - 01 - Introduction
7.4.6.6
SIPLUS CMS
Summary
The following Configuration Files are being used by this chapter:
Analyzing Models
(found in “..\Analyzing Model Files\Measurement Tasks\Spectrum Envelopes”)
Name
Description
10 Create Reference Spectrum
This Analyzing Model can be used in order to create the reference spectrum (without errors). It is typically not needed because the data from this Analyzing Model is available as
example offline data.
20 Create Spectrum Envelope
This Analyzing Model creates all spectrum envelopes ouf of the previously loaded spectrum data.
30 Simulate Spectrum with Errors
This Analyzing Model simulates an online spectrum with small errors so that violations of
the calculated envelopes take place.
40 Monitor Spectrum Envelope
This Analyzing Model monitors the online spectrum against the created spectrum envelopes.
Analyzing Scripts
(found in “..\Analyzing Script Files\Measurement Tasks\Spectrum Envelopes”)
Name
Description
20 Create Spectrum Envelope
This Analyzing Script creates all spectrum envelopes ouf of the previously loaded spectrum data.
30 Simulate Spectrum with Errors
This Analyzing Script simulates an online spectrum with small errors so that violations of
the calculated envelopes take place.
40 Monitor Spectrum Envelope
This Analyzing Script monitors the online spectrum against the created spectrum envelopes.
Monitoring Views
(found in “..\Monitoring View Files\Measurement Tasks\Spectrum Envelopes”)
Name
Description
Visualize Spectrum Envelopes
This Monitoring View shows the original offline spectrum, the calculated spectrum envelopes, the current online spectrum and the three outputs of MonSpmEnv().
Offline Data
(found in “..\Example Offline Files\X-Tools Offline Data Files\Measurement Tasks\Spectrum Envelopes”)
Name
Description
Spectrum
The spectrum which has been generated via the Analyzing Model “10 Create Reference
Spectrum”.
English
Release 2012-09
166 / 182
SIPLUS CMS X-Tools - User Manual - 01 - Introduction
7.4.7
SIPLUS CMS
Automatic loading of Data
7.4.7.1
General
This chapter shows how to use the Analyzing System and the Analyzing Function LoadData() in order to load
offline data automatically from offline data files. The different use cases for the loading of offline data files are
handled by the following chapters.
The Analyzing Scripts and Loading Profiles from this chapter can be tried out because the to-be-loaded data,
the Analyzing Scripts and the Loading Profiles are delivered together with X-Tools. The to-be-loaded data is
found within the “..\Server\User\Example Offline Files\X-Tools Offline Data Files” path of the X-Tools installation, whereas the used Analyzing Scripts and Loading Profiles are part of the example location which is delivered together with X-Tools. The “Measurement Tasks\Loading of Data” subdirectory of each Configuration File
type contains the Configuration Files to which the following descriptions refer (see also point 7.4.7.5).
7.4.7.2
Basic loading of offline Data
The most simple usage of LoadData() is to load all files from a certain directory and all of its sub-directories.
The Analyzing Script “Basic Loading” from the example location shows an example for this use case:
var main()
{
// the location "X-Tools Offline Data Files" must point to the following directory
// of the X-Tools installation:
// ..\Server\User\Example Offline Files\X-Tools Offline Data Files
// the following command loads all offline data from the specified directory
// and all of its sub-directories
LoadData("X-Tools Offline Data Files://ION AnalogInput T001");
}
7.4.7.3
Loading of offline Data Files from a certain Period of Time
Another use case for the loading of offline data files is to automatically load a certain period of time of some
data. The Analyzing Script “Load Period of Time” from the example location shows an example for this use
case:
var main()
{
// the location "X-Tools Offline Data Files" must point to the following directory
// of the X-Tools installation:
// ..\Server\User\Example Offline Files\X-Tools Offline Data Files
var
StartTime,EndTime;
StartTime = 1244110988;
// 2009-06-04 12:23:09
EndTime
// 2009-06-04 12:23:15
= 1244110994;
// we load 6 seconds from the middle of this data
LoadData("X-Tools Offline Data Files://ION AnalogInput T001",
"ION AnalogInput T001 CH01",
"Append","","Each Value","",
"Minimum Time and Maximum Time",StartTime,0,EndTime);
}
English
Release 2012-09
167 / 182
SIPLUS CMS X-Tools - User Manual - 01 - Introduction
7.4.7.4
SIPLUS CMS
Loading with Loading Profiles and Loading Modes
Loading Profiles and all of their contained filter functionality can be used in order to apply filters during the loading of data. The Analyzing Script “Load with Loading Profile, Loading Modes” from the example location shows
the result of loading with a Loading Profile which has loading modes configured:
var main()
{
// the location "X-Tools Offline Data Files" must point to the following directory
// of the X-Tools installation:
// ..\Server\User\Example Offline Files\X-Tools Offline Data Files
// the following command loads data from the specified directory and applies
// the loading modes which are configured within the specified Loading Profile
LoadData("X-Tools Offline Data Files://ION AnalogInput T001",
"","Append",
"://Measurement Tasks\\Loading of Data\\Loading Modes.lpf.xts");
}
7.4.7.5
Loading with Loading Profiles and Loading Times
Loading Profiles and all of their contained filter functionality can be used in order to apply filters during the loading of data. The Analyzing Script “Load with Loading Profile, Loading Times” from the example location shows
the result of loading with a Loading Profile which has loading times configured:
var main()
{
// the location "X-Tools Offline Data Files" must point to the following directory
// of the X-Tools installation:
// ..\Server\User\Example Offline Files\X-Tools Offline Data Files
// the following commands load data from the specified directory and applies
// the loading times which are configured within the specified Loading Profile
LoadData("X-Tools Offline Data Files://ION AnalogInput T001",
"","Append",
"://Measurement Tasks\\Loading of Data\\Loading Times.lpf.xts");
}
English
Release 2012-09
168 / 182
SIPLUS CMS X-Tools - User Manual - 01 - Introduction
7.4.7.6
SIPLUS CMS
Loading of the last Minutes of the Data from a Storage Profile
The Analyzing Script “Load with Storage Profile, Period of Time” from the example location shows an example
of how the last few minutes of the data from a certain Storage Profile can be loaded:
var main()
{
// the location "Offline Files" also must be used by the following Storage Profile:
// - Measurement Tasks\Loading of Data\IFN AI
// the following Configuration Files must be running:
// - Interface Profile Files\Measurement Tasks\Loading of Data\Simulation T001
// - Device Profile Files\Measurement Tasks\Loading of Data\IFN AI
// - Storage Profile Files\Measurement Tasks\Loading of Data\IFN AI
var StartTime;
var EndTime;
// the current data may be written still, so let's load until "a little bit before now"
EndTime = GetTime() - 100;
// we want to load a total of 5 minutes
StartTime = EndTime - 300;
// load the data from the specified time interval
LoadData("://Measurement Tasks\\Loading of Data\\IFN AI.spf.xts",
"","Append","","Each Value","",
"Minimum Time and Maximum Time",StartTime,0,EndTime);
}
7.4.7.7
Loading of the last Files from a Storage Profile (once)
The Analyzing Script “Load with Storage Profile, Latest Files, once” from the example location shows an example of how the last stored files from a certain Storage Profile can be loaded:
var main()
{
// the location "Offline Files" also must be used by the following Storage Profile:
// - Measurement Tasks\Loading of Data\IFN AI
// the following Configuration Files must be running:
// - Interface Profile Files\Measurement Tasks\Loading of Data\Simulation T001
// - Device Profile Files\Measurement Tasks\Loading of Data\IFN AI
// - Storage Profile Files\Measurement Tasks\Loading of Data\IFN AI
// load the data from the specified time interval
LoadData("://Measurement Tasks\\Loading of Data\\IFN AI.spf.xts",
"","Overwrite","","Each Value","",
"Load Latest Files");
}
English
Release 2012-09
169 / 182
SIPLUS CMS X-Tools - User Manual - 01 - Introduction
7.4.7.8
SIPLUS CMS
Loading of the last Files from a Storage Profile (automatically)
The Analyzing Script “Load with Storage Profile, Latest Files, automatic” from the example location shows an
example of how to load the last stored files from a certain Storage Profile automatically, all the time while the
Storage Profile is running (and producing additional offline data):
var main()
{
// the location "Offline Files" also must be used by the following Storage Profile:
// - Measurement Tasks\Loading of Data\IFN AI
// the following Configuration Files must be running:
// - Interface Profile Files\Measurement Tasks\Loading of Data\Simulation T001
// - Device Profile Files\Measurement Tasks\Loading of Data\IFN AI
// - Storage Profile Files\Measurement Tasks\Loading of Data\IFN AI
while(1)
{
// with the following settings, WaitForEDT() comes back each 10 seconds,
// thus LoadData() also is being called once each 10 seconds
WaitForEDT("2000-01-01","00:00:00",10);
// load the data from the specified time interval
LoadData("://Measurement Tasks\\Loading of Data\\IFN AI.spf.xts",
"","Overwrite","","Each Value","",
"Load Latest Files");
}
}
The Monitoring View “Automatic Update of the t-Axes” from the example location can be used in order to see
how the loaded offline data is taken over automatically by a Monitoring View. In order to enable the automatic
update of the Monitoring View, the option “Rescale t-Axes after Action” must be configured to “Yes” (either
within the Chart Options dialog or via the context menu of each t-axis).
7.4.7.9
Summary
The following Configuration Files are being used by this chapter:
Interface Profiles
(found in “..\Interface Profile Files\Measurement Tasks\Loading of Data”)
Name
Description
Simulation T001
This Interface Profile enables the simulated devices which are being used for the generation of the to-be-stored data.
Device Profiles
(found in “..\Device Profile Files\Measurement Tasks\Loading of Data”)
Name
Description
IFN AI
This Device Profile provides the online data from a simulated IFN AI.
Monitoring Views
(found in “..\Monitoring View Files\Measurement Tasks\Loading of Data”)
Name
Description
Automatic Update of the t-Axes
This Monitoring View is configured to automatically update its Monitoring Charts whenever LoadData() has loaded the latest files of the currently running Storage Profile again.
English
Release 2012-09
170 / 182
SIPLUS CMS X-Tools - User Manual - 01 - Introduction
SIPLUS CMS
Analyzing Scripts
(found in “..\Analyzing Script Files\Measurement Tasks\Loading of Data”)
Name
Description
Basic Loading
This Analyzing Script shows a very easy method for the loading of offline data from a certain directory.
Load Period of Time
This Analyzing Script shows how to load a certain amount of time of the offline data from a
certain directory.
Load with Loading Profile, Loading Modes
This Analyzing Scripts shows how to use Loading Profiles in order to load data with the
available loading modes.
Load with Loading Profile, Loading Times
This Analyzing Script shows how to use Loading Profiles in order to load data with configuring of the to-be-loaded time intervals.
Load with Storage Profile, Latest Files, automatic
This Analyzing Script shows how to use LoadData() in order to automatically load the
latest offline data files of the specified Storage Profile.
Load with Storage Profile, Latest Files, once
This Analyzing Script shows how to use LoadData() in order to load the latest offline data
files of the specified Storage Profile once.
Load with Storage Profile, Period of Time
This Analyzing Script shows how to load a certain amount of time of the offline data from a
certain Storage Profile.
Storage Profiles
(found in “..\Storage Profile Files\Measurement Tasks\Loading of Data”)
Name
Description
IFN AI
This Storage Profile stores the oline data from the simulated IFN AI.
Loading Profiles
(found in “..\Loading Profile Files\Measurement Tasks\Loading of Data”)
Name
Description
Loading Modes
This Loading Profile configures the available loading modes for the loading of offline data.
Loading Times
This Loading Profile configures different time intervals for the loading of offline data.
7.4.8
7.4.8.1
Advanced parallel Storing
General
This chapter shows how to configure a Storage Profile for applications where it is necessary to store the same
data in parallel multiple times, where each storage shall maintain its own, data-based start and stop triggers. An
example use case could be:
• There is a plant (e.g. a steel mill) with different sections.
• At any time, multiple parts (e.g. coils) could be processed by the different sections of the plant.
• The Storage System shall produce one directory with offline data for each processed part. This directory
is started at the moment when the part enters the first section (an according start trigger is caused at this
moment) and stopped at the moment when the part leaves the last section (an according stop trigger is
caused at this moment).
• When the start trigger occurs, an ID which uniquely identifies the currently processed part (the so-called
“Storage ID”) shall be added as part of the directory name.
• At the moment when the plant is started, there are no parts within the different sections. Afterwards, multiple parts may enter the plant (= multiple start events occur) before the first part leaves the last section
again (= the first stop event occurs).
• In such a configuration, there is no direct relation between the start and stop trigger any more and the
Storage Profile must be configured accordingly in order to be able to produce the desired offline data
files.
English
Release 2012-09
171 / 182
SIPLUS CMS X-Tools - User Manual - 01 - Introduction
7.4.8.2
SIPLUS CMS
Plant Simulation
The Analyzing Script “Plant” is used in order to simulate a plant with all of the described behavior:
• A start event occurs each 30 seconds. Thus, the simulation acts as if another part would enter the plant
each 30 seconds.
• The plant is separated into 5 sections. Each section processes the part for about 15 seconds. After the
processing, the part moves for about 5 seconds until it arrives at the next section. Thus, the total processing time of each part is about 100 seconds.
o The simulation is decreasing a counter with a speed which is different in each section. In a real plant
like a rolling mill, a similar measurement could be received from a temperature or thickness sensor.
o Within the simulated plant, there are always 3-4 parts processed in parallel. As a result, the Storage
Profile is also storing the current data to 3-4 offline data directories in parallel.
• The simulation uses the current time, in seconds since 2012-01-01, as unique storage ID. This value
changes with each start event and is added to the name of each created directory.
• A stop event occurs each 30 seconds. After the start of the Analyzing Script, the first stop event occurs
100 seconds after the first start event - this is due to the fact that the first processed part must go through
the whole plant first before it can cause a stop event.
The Monitoring View “Plant (Online)” can be used in order to visualize all of the data from the simulated plant.
The following screenshot shows an example from this Monitoring View:
Figure 76: Example of the Plant Simulation for the advanced parallel storing
7.4.8.3
Storage Profile
The Storage Profile “Plant” is used in order to store all data from the simulated plant:
• A new offline data directory is created whenever the start event occurs.
• About 100 seconds of data are written to each offline data directory before the storing is ended through
the (matching) stop trigger.
The Storage Profile can be started and stopped at any moment in time. The most important settings for this
behavior of the Storage Profile are:
• “Storage Profile Parameters” table
o Parallel Storage = Start a parallel Storage whenever another Start Event occurs
• “Stop Event” table
o Minimal Start to Stop Interval = 95 seconds
the chosen interval should be short below the expected amount of time between the start and stop
triggers which belong to one processed part
English
Release 2012-09
172 / 182
SIPLUS CMS X-Tools - User Manual - 01 - Introduction
7.4.8.4
SIPLUS CMS
Summary
The following Configuration Files are being used by this chapter:
Monitoring Views
(found in “..\Monitoring View Files\Measurement Tasks\Advanced parallel Storing”)
Name
Description
Plant (Online)
This Monitoring View displays all data from the simulated plant.
Plant (Offline)
This Monitoring View can display the offline data which has been stored by the Storage
Profile “Plant”. In case there is always one offline data directory loaded, the visualized
data curves are identical because each offline data category contains the data from one
processed part (and the simulated data is identical for each simulated part).
Analyzing Scripts
(found in “..\Analyzing Script Files\Measurement Tasks\Advanced parallel Storing”)
Name
Description
Plant
This Analyzing Script simulates the basic komponents of the plant.
Storage Profiles
(found in “..\Storage Profile Files\Measurement Tasks\Advanced parallel Storing”)
Name
Description
Plant
This Storage Profile uses the parallel storage mode “Start another parallel Storage whenever another Start Event occurs” in order create one offline data directory per processed
part.
English
Release 2012-09
173 / 182
SIPLUS CMS X-Tools - User Manual - 01 - Introduction
8
SIPLUS CMS
Reference Part - Overview
8.1
X-Tools Client
8.1.1
Controls
8.1.1.1
Tables
Tables are being used mainly for editing and configuration purposes. The tables of the X-Tools Client provide
the following main functionalities:
• Context Menu
• Keyboard Operations
• Sizeable Columns
• Shiftable Columns
• Minimize and Maximize
Context Menu
The context menu of each table can be called via a click onto the title bar with the right mouse button. The following context menu items are provided:
Context Menu Item
Description
Restore Column Defaults
restores the default configuration of all columns as it is after the installation of X-Tools
AutoFit Column Widths
automatically fits the width of all columns so that all contained texts are visible
Show/Hide > …
allows to show or hide the columns of the table; the provided sub-menu contains all of the columns of the table which can be shown or hidden by the user
Autosize Table
optimizes the width of all visible columns
Minimize
minimizes the table
Maximize
maximizes the table
Keyboard Operations
Different keyboard operations are supported depending to whether the table is in editing mode at the moment or
not. The following keyboard operations are provided in case the table is not in editing mode:
Keyboard Operation
Description
<Del>
performs a remove/delete operation
<Ctrl> + <C>
performs a copy operation
<Ctrl> + <X>
performs a cut operation
<Ctrl> + <V>
performs a paste operation
<Enter>
puts the cell which owns the input focus currently into editing mode and highlights its current value
<Backspace>
puts the cell which owns the input focus currently into editing mode and clears its current value
<Cursor left>
moves the input focus one column to the left
<Cursor right>
moves the input focus one column to the right
<Cursor up>
moves the input focus one row to the top
<Cursor down>
moves the input focus one row to the bottom
<Tab>
jumps from the current table to the next table/tree/menu bar
<Shift> + <Tab>
jumps from the current table to the previous table/tree/menu bar
English
Release 2012-09
174 / 182
SIPLUS CMS X-Tools - User Manual - 01 - Introduction
SIPLUS CMS
The following keyboard operations are provided in case the table is in editing mode:
Keyboard Operation
Description
<Del>
performs a remove operation
<Ctrl> + <C>
performs a copy operation
<Ctrl> + <X>
performs a cut operation
<Ctrl> + <V>
performs a paste operation
<Esc>
discards the changed value and puts the cell which owns the input focus currently into not-editing
mode
<Enter>
takes over the changed value and puts the cell which owns the input focus currently into notediting mode
<Backspace>
puts the cell which owns the input focus currently into editing mode and clears its current value
<Cursor left>
moves the input focus left to the next editable cell of the same row
<Cursor right>
moves the input focus right to the next editable cell of the same row
<Cursor up>
moves the input focus up to the next editable cell of the same column
<Cursor down>
moves the input focus down to the next editable cell of the same column
<Tab>
jumps from the current cell to the next editable cell at the right side
<Shift> + <Tab>
jumps from the current cell to the next editable cell at the left side
Sizeable Columns
The user is able to change the width of each column through a left mouse click in between the title cells of two
columns. Through moving of the mouse, the width of the left column can be changed as long as the left mouse
button is kept pressed.
Shiftable Columns
The user is able to change the position of columns among each other through a left mouse click into the title cell
of a column. Trough moving the mouse into between the title cells of two other columns, the dragged column
can be put to its new position. In case the dragged column is released outside of its parent table, the dragged
column is hidden.
Minimize and Maximize
In order to minimize or maximize a table, a double-click with the left mouse button onto its title bar can be performed. Additionally, the icon at the right border of the title bar of each table also can be used in order to minimize and maximize the table.
English
Release 2012-09
175 / 182
SIPLUS CMS X-Tools - User Manual - 01 - Introduction
8.1.1.2
SIPLUS CMS
Trees
Trees are being used mainly for visualization and selection purposes. The trees of the X-Tools Client provide
the following main functionalities:
• Keyboard Operations
Keyboard Operations
Different keyboard operations are supported depending to whether the tree is in editing mode at the moment or
not. The following keyboard operations are provided in case the tree is not in editing mode:
Keyboard Operation
Description
<Del>
performs a remove/delete operation
<Ctrl> + <C>
performs a copy operation
<Ctrl> + <X>
performs a cut operation
<Ctrl> + <V>
performs a paste operation
<Esc>
cancels the current selection
<F2>
puts the item which owns the input focus currently into editing mode
<Tab>
jumps from the current tree to the next tree/table/menu bar
<Shift> + <Tab>
jumps from the current tree to the previous tree/table/menu bar
<Cursor left>
onto an expanded tree item
collapses the tree item
<Cursor left>
onto a collapsed tree item
moves to the parent item of the tree item
<Cursor right>
onto a collapsed tree item
expands the tree item
<Cursor right>
onto an expanded tree item
moves the input focus to the first item below the expanded tree item
<Cursor up>
moves the input focus to the next upper tree item without performing of any collapsing or expanding
<Cursor down>
moves the input focus to the next lower tree item without performing of any collapsing or expanding
<Backspace>
moves the input focus to the parent item of the current tree item without performing of any collapsing or expanding
<Home>
moves the input focus to the topmost tree item
<End>
moves the input focus to the bottommost tree item
The following keyboard operations are provided in case the tree is in editing mode:
Keyboard Operation
Description
<Del>
performs a remove operation
<Ctrl> + <C>
performs a copy operation
<Ctrl> + <X>
performs a cut operation
<Ctrl> + <V>
performs a paste operation
<Esc>
discards the changed value and puts the cell which owns the input focus currently into not-editing
mode
<Enter>
takes over the changed value and puts the cell which owns the input focus currently into notediting mode
<Tab>
behaves like <Enter>
English
Release 2012-09
176 / 182
SIPLUS CMS X-Tools - User Manual - 01 - Introduction
8.1.1.3
SIPLUS CMS
Menu Bars
Menu bars are found at the bottom of most dialogs and provide the following main functionalities:
• Keyboard Operations
Keyboard Operations
The following keyboard operations are provided by each menu bar:
Keyboard Operation
Description
<Esc>
behaves like if the “Yes” or “OK” button would have been clicked
<Enter>
behaves like if the “No” or “Cancel” button would have been clicked
<Cursor left>
moves the input focus from the current button to the next button at the left
<Cursor right>
moves the input focus from the current button to the next button at the right
<Cursor up>
moves the input focus from the current button to the next button at the left
<Cursor down>
moves the input focus from the current button to the next button at the right
<Tab>
moves the input focus from the current button to the next button at the right; in case the rightmost
button had the input focus already, the input focus is being moved to the topmost control of the
dialog
<Shift> + <Tab>
moves the input focus from the current button to the next button at the left; in case the leftmost
button had the input focus already, the input focus is being moved to the bottommost control of the
dialog
English
Release 2012-09
177 / 182
SIPLUS CMS X-Tools - User Manual - 01 - Introduction
8.2
SIPLUS CMS
X-Tools Server
8.2.1
Overview
The X-Tools Server does not provide its own user interface. Instead, only an icon is displayed within the task
bar of Windows. This icon provides a tool tip and a context menu, which can be called in order to receive the
most basic information about the X-Tools Server and to configure the most basic settings.
All further configurations are being performed via the X-Tools Client. See point 6.3 for detailed information
about how to connect one or multiple X-Tools Clients to the X-Tools Server.
8.2.2
Icon of the X-Tools Server
The icon of the X-Tools Server provides basic information about the current status of the X-Tools Server. The
following status information can be provided via this icon:
Icon
Description
The X-Tools Server is starting up.
(startup)
(normal operation)
The X-Tools Server is running normally or shutting down.
(safe mode)
The X-Tools Server is running in safe mode.
The X-Tools Server has detected a severe error during its startup.
(error)
Safe Mode
Detailed information about the safe mode of the X-Tools Server is found within the tutorial (see point 6.18).
Error
In case a severe error has been detected during the startup, more detailed information is provided via the tool
tip of the icon and via the X-Tools Server Status dialog (see point 8.2.5).
8.2.3
Tool Tip
In order to show the tool tip of the X-Tools Server, simply place the mouse cursor above the icon of the XTools Server. After a few moments, the tool tip is being displayed automatically.
The tool tip provides basic information like the version of the X-Tools Server and its current status.
Figure 77: Example of a Tool Tip of the X-Tools Server
8.2.4
Context Menu
In order to call the context menu of the X-Tools Server, click onto the icon of the X-Tools Server with the right
mouse button. The following context menu items are provided:
Context Menu Item
Description
Show X-Tools Server Status…
opens the X-Tools Server Status dialog (see point 8.2.5)
Configure X-Tools Server Connectivity…
opens the X-Tools Server Connectivity dialog (see point 6.3.6)
Re-initialize the X-Tools Server
re-initializes the X-Tools Server, which terminates all modules and restarts them afterwards
Exit
terminates the X-Tools Server
English
Release 2012-09
178 / 182
SIPLUS CMS X-Tools - User Manual - 01 - Introduction
8.2.5
SIPLUS CMS
X-Tools Server Status Dialog
The X-Tools Server Status dialog can be called from the context menu of the X-Tools Server, which is available from the task bar of Windows. This dialog displays the current status of the X-Tools Server as well as detailed information about the version and about the used license.
In case warnings or errors have been detected during the startup of the X-Tools Server, this information also is
being displayed by the X-Tools Server Status dialog. As the X-Tools Server does not provide any other user
interface, the X-Tools Server Status dialog can be used in order to receive a short overview about the ongoing
operations without the need to connect an X-Tools Client.
Figure 78: X-Tools Server Status Dialog
8.3
8.3.1
X-Tools Tray
Overview
The X-Tools Tray application manages the tray icon of the X-Tools Server. In addition, it provides the context
menu of the tray icon and the X-Tools Server Status and X-Tools Server Connectivity dialogs.
The X-Tools Tray is started automatically by different mechanisms and keeps running also in case the rest of
X-Tools does not run at the moment. In case the X-Tools Server is not present, the task tray icon of the XTools Tray is hidden.
At operating systems which allow multiple Windows session to be present simultaneously (e.g. Microsoft Windows Server 2003, but with restrictions also Microsoft Windows XP and Microsoft Windows 7), one instance of
the X-Tools Tray can be started in each Windows session. This approach allows to monitor and control the
one-and-only X-Tools Server from any of the present Windows sessions.
The X-Tools Tray application also can be started manually. However, typically this is not needed and it is not
possible to run multiple instances of the X-Tools Tray within one Windows session simultaneously.
English
Release 2012-09
179 / 182
SIPLUS CMS X-Tools - User Manual - 01 - Introduction
8.4
8.4.1
SIPLUS CMS
X-Tools Service
Overview
The X-Tools Service can be used for the following tasks:
• automatic start of the X-Tools Server during the startup of Windows
• monitoring of the X-Tools Server during its runtime
8.4.2
Automatic Start of the X-Tools Server during the Startup of Windows
The X-Tools Service can start the X-Tools Server during the startup of Windows. In order to enable this functionality, the Automated Startup option from the global options of the X-Tools Server must be configured to
“Start the X-Tools Server before a user logs in to Windows”.
Enabling of this option installs the X-Tools Service, which becomes visible within the Services dialog of Windows then.
8.4.3
Monitoring of the X-Tools Server during its Runtime
The X-Tools Service can monitor whether the X-Tools Server is running properly. In order to enable this functionality, the Automated Restart option from the global options of the X-Tools Server must be configured to
“Automatically restart the X-Tools Server in case it stops to operate normally”.
Enabling of this option installs the X-Tools Service, which becomes visible within the Services dialog of Windows then.
While the monitoring is active, the X-Tools Service constantly checks whether the X-Tools Server is still responsive. In case the X-Tools Server does not respond for a too long time, the X-Tools Service kills the process of the X-Tools Server and starts a new instance of the X-Tools Server. After such an event, the X-Tools
Server will start up in safe mode.
8.4.4
Stopping of the X-Tools Service
The X-Tools Service is being stopped by the X-Tools Service in case none of the above functionalities is
needed. The X-Tools Service also is being stopped in case the X-Tools Service is being shut down manually
by the user.
While the X-Tools Server is running and in case the X-Tools Service is enabled via the global options, the XTools Server also monitors the X-Tools Service and attempts to start it whenever it does not run - therefore,
the X-Tools Service always must be stopped via the global options of the X-Tools Server, a manual attempt to
stop the X-Tools Service will not work in most cases.
English
Release 2012-09
180 / 182
SIPLUS CMS X-Tools - User Manual - 01 - Introduction
9
SIPLUS CMS
List of Abbreviations
Abbreviation
Description
AME
Analyzing Model Editor
ANF
Analyzing Function
ANS
Analyzing System
ANX
Analyzing System Explorer
ASE
Analyzing Script Editor
CMM
Communication Module
CTN
Control Node
DMS
Device Management System
DMX
Device Management System Explorer
DPE
Device Profile Editor
GOE
Global Options Editor
IFM
Interface Module
IFN
Interface Node
IOM
I/O-Module, Input/Output-Module
ION
I/O-Node, Input/Output-Node
IPE
Interface Profile Editor
LPE
Loading Profile Editor
MDS
Master Data System
MDX
Master Data System Explorer
MMS
Main Management System
MMX
Main Management System Explorer
MPE
Main Profile Editor
MTC
Monitoring Chart
MTS
Monitoring System
MTX
Monitoring System Explorer
MVE
Monitoring View Editor
ODL
Offline Data Loader
UAE
User Accounts Editor
SLV
System Log Viewer
SPE
Storage Profile Editor
STS
Storage System
STX
Storage System Explorer
UFE
User Function Editor
UPS
Uninterruptible Power Supply
USF
User Function
XTC
X-Tools Client
XTS
X-Tools Server
XTT
X-Tools Tray
XTV
X-Tools Service
English
Release 2012-09
181 / 182
SIPLUS CMS X-Tools - User Manual - 01 - Introduction
10
SIPLUS CMS
Contact Information
Address
Siemens AG
I IA CE SE
Wuerzburger Strasse 121
90766 Fuerth
Germany
Internet
http://www.siemens.com/siplus-cms
English
Release 2012-09
182 / 182