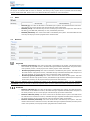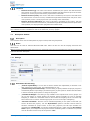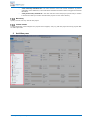
1
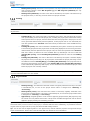
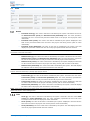
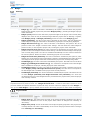
Table of Contents 1 Project information 1.1 Project history 1.2 General 4 5 6 1.3 1.4 Duration Work 7 7 1.5 Costs 9 1.6 Budget 1.7 1.8 Sales Revenue 11 11 1.9 Description & Notes 12 External information Internal information Actual vs. Projected Pending Original Values Details Total Planning Original Values Projected Achieved Invoiced Description Notes 6 6 7 8 8 9 9 10 10 10 11 11 12 12 12 1.10 Settings 12 2 Activities pane 2.1 Activities 2.2 Closed activities 2.3 Documents (if Share Point has been integrated beforehand) 2.4 Travel 2.5 Receipts 2.6 Cases 13 14 14 14 14 14 14 3 Planning pane 3.1 Work Breakdown Structure (WBS) 15 15 3.2 3.3 Gantt View 17 18 3.4 Functions 19 3.5 3.6 3.7 3.8 Planning table Resource Usage Team Members Connections 20 22 22 23 4 Settlement pane 4.1 Orders 4.2 Billing 4.3 Timesheets 23 23 23 23 5 Controlling pane 5.1 Goals 5.2 Audit History 24 24 24 Automation & Controlling Monetarily Further entities „Complete“ button Filter Activities Hide completed Automatic Mode View Columns of the Work Breakdown Structure Functions of the Work Breakdown Structure Symbols Colors Filter Activities Hide completed Automatic Mode View Drag & drop CRM-Project Rollup 16 and higher 12 13 13 15 15 15 16 16 16 16 16 18 18 19 19 19 19 19 20 2 / 24 The names of companies and products contained in this documentation may be covered by trademarks or similar intellectual property rights. This notice does not grant any licenses under those rights. The example companies, organizations, products, domain names, e-mail addresses, logos, people, places, and events depicted in this documentation are fictitious. No association with any real company, organization, product, domain name, email address, logo, person, place, or event is intended or should be inferred. All rights reserved. No part of the contents of this book may be reproduced or transmitted in any form or by any means without the written permission of the publisher. All other rights are reserved, and this notice does not grant any rights other than specifically described above, whether by implication, estoppel, or otherwise. © xRM1 Business Solutions, a brand of itara GmbH, Beethovenstrasse 5, 97080 Würzburg, Germany, all rights reserved. DIN A4, v337 Tel: +49 (931) 66084-111; E-Mail: [email protected] CRM-Project Rollup 16 and higher 3 / 24 All about the project The 4th module enables the same information to be entered and managed on every level within a project. Thus, projects can be nested. The "Level" allows each project node type to be specified (subproject, phase, work package, etc.) The benefit: Projects of any size, depth or width can be structured. The diagram below illustrates how individual project nodes can be arranged in relation to each other. Project Node Project Project Node Project Node Phase Subproject Project Node Project Node Work Package Project Node Project Node Project Node Subproject Milestone Subproject Work Package Project Node Project Node Work Package Work Package Individual levels within a project are labeled consecutively as project nodes. A lot of information within the project structure is automatically passed from the top (main node) to the project nodes beneath (e.g. ‘assigned account’). Other information, such as man-days entered or costs accrued, is automatically passed on by lower project nodes to nodes above, and tallied in the process where appropriate. 1 Project information Below is an overview of project information which is stored in the system. They depend on the roles selected. A project manager can see more information than an employee who simply reports back time. Information in a project’s data fields and selected project nodes are subdivided into the following areas: General: General information on the project. Duration: Time-related information in the project. Work: All information pertaining to man-days in the project. Costs: All information pertaining to monetary costs in the project Budget: The calculated budget for the project. Sales: Information pertaining to man-days described to the customer. Revenue: Automatically calculated information regarding the project revenue. Description & Notes: Information on project content, task, goal and more detailed notes. Settings: Settings and values pertaining to the project. Note: Some fields cannot be filled in as they are automatically filled in by the system. These fields are filled gray and the user cannot edit them. Note: Please be aware, that – when using the template functionality – creating project nodes with field level security fields is only possible if the user has write permissions. CRM-Project Rollup 16 and higher 4 / 24 1.1 Project history The charts in the upper area of the project form show the project's historical development of the “Budget”, “Cost”, “Revenue” and “Work” values. The standard values are set to “Budget” and “Costs”. However, you can easily switch to other values (“Revenue” or “Work”) by clicking on the drop down arrow, beside the header. The values can be also modified or added with Dynamics CRM customizable standard chart technology. The values used for these charts are saved in the “Project Journal” entity and are recorded through the “Create Journal Entry” workflow. Find more on “Project Journal” configurations in section “Additional configurations and customizations”. CRM-Project Rollup 16 and higher 5 / 24 1.2 General External information Title (Customer): The title of the project node, also used for external parties and customer. Customer: The company or customer representing the sponsor of the project. The customer is also used to determine whether it is an internal or external project. Please refer to section “Additional configurations and customizations” for more details. Progress (auto): The progress or degree of project completion in %. The field can be filled in manually or automatically. The choice between automatic calculation and manual entry is made under the project’s settings. For automatic calculation, the value is calculated by dividing the project node’s entered man-days by the projected ones. Internal information Title (Internal): The title of the project node used mainly for internal communication within the project or subproject. This can correspond with the Title (Customer), but can also contain only the project’s cost center number, for example. Note: This title is used for all lookup fields and views within the project’s structure. Make this title as unique as possible (e.g. containing customer + project). Ident Number: Unique consecutive numbering of all project nodes. Status Reason: The status reason "Planning", "Processing" and "Template in Progress" are available for an active project status. The status reasons "Completed", "Cancelled", "Interrupted", "Template Draft", and "Template Approved" are available for an inactive project status. Information on creating and completing projects can be found in Sections “Project creation” and “Project completion”. Owner: User within the organization who is responsible for this project node. This person is usually the project manager. Level: The type of project node is defined with the level. Please refer to Section “Project creation” for more information on using levels. Billing: Define here if the project node can be billed and whether billing is then by fixed price, time & material or both (when there are other project nodes below this one that are billed partly by fixed price and partly by time and material, for e.g.) Parent Project Part: Specifies if there is another project part above the project node selected, and if so, how it is called. Priority: Here, you can select if the project node should have prioritized handling and if yes, whether the priority is low, medium or high. Risk: Select if it is a risk project and whether the risk must be assessed as high, medium or low. Division: This lookup enables you to assign the project part to a company division or department. The company division and departments correspond with the structure of your organization, as stored in Microsoft CRM. Classification: The classification is used for additional, individual project classifications within your organization. In the provided configuration, this pick list is only filled in with a default value. You are able to fill in this pick list with any additional values, or change the default value, by customizing Microsoft CRM. You can use your individual classifications in many places within the project organization. Code: Assign an optional, self-defined, flag for every project node. For example, this can e.g. contain parts of project numbers, customer numbers, priority (etc.) CRM-Project Rollup 16 and higher 6 / 24 Tip: For the internal title of a project, use a title which your project members can also clearly identify. This simplifies time entry for your project team. 1.3 Duration Real Start: This date field is automatically filled in by CRM-Project, as soon as the first activity (chronologically) of the project is completed. The due date of the completed activity is used as the value. Last Activity: This date field is always updated automatically by CRM-Project, as soon as a project activity is completed. The due date of the completed activity is used as a value. So you always know when was the last time worked on the project. Fixed Date: This setting enables planned date values to be fixed; meaning they can no longer be changed. For example, fixed date events (such as exhibitions) can be marked, simplifying planning in functions where drag-and-drop is used. Start projected: This field is used to specify the projected duration of a project. It defines the start time of the project or the selected project node. End projected: This date field is used to specify the projected duration of a project. It defines the end time of the project or the selected project node. 1.4 Work Actual vs. Projected Actual MD (∑): The value in this field is calculated by the system. This field shows all work (in man-days) for the relevant project part, including the project parts underneath. Looking at the topmost part of a project: this field displays the total work performed, so far, in the project. As soon as a team member completes an activity within this project node, or an underneath one, the work time specified in the activity is added to the value existing there by CRM-Project. Actual MD (Level): The value in this field is calculated by the system. Summed up in this field is work which is directly entered for the project node currently being displayed. As soon as a team member completes an activity within this project node, the work time specified in the activity is added to the value existing there by CRM-Project. The sum of this field (Actual MD (Level)) and field Actual MD (inherited) gives the value for field Actual MD (∑). Actual MD (inherited): The value in this field is calculated by the system. This field displays all work (in man-days) for all project parts underneath the current project part. The difference of the values in Actual MD (∑) and Actual MD (inherited) is the work entered for the project element being viewed; this is shown in the Actual MD (Level) field. Actual MD (inherited) is also automatically updated by CRM-Project, as soon as activities are entered for project nodes below the project node currently selected. MD Projected (∑): The value in this field is calculated by the system. This field is the sum of fields MD Projected (Level) and MD Projected (inherited). The value (therefore) represents the sum of projected number of man-days for this and all project nodes underneath. CRM-Project Rollup 16 and higher 7 / 24 MD Projected (Level): This field is used to plan the man-days expected as work for the project node currently selected. Values MD Projected (∑) and MD Projected (inherited) are only controlled by this field. MD Projected (inherited): The value in this field is calculated by the system. This field sums up the projected work, in man-days, from the lower-level project elements. Pending Note: Values in the “Pending” fields are only calculated if the “Forecast Calculation” field option under “Settings” is “By Activities”. Pending MD (∑): The value in this field is calculated by the system. This field shows all projected work (in man-days) for the relevant project part, including the project parts underneath. Looking at the topmost area of a project, this field shows the total work projected in the project. As soon as any personnel-related activity has been planned, for this project node or one underneath, the work time specified in the “Duration” field of the activity is added to the value available there by CRM-Project. Pending MD (Level): The value in this field is calculated by the system. Summed up in this field is work directly projected for the project node currently being displayed. As soon as any personnelrelated activity has been planned for this project node, the work time specified in the “Duration” field of the activity is added to the value available there by CRM-Project. The sum of this field (Pending MD (Level)) and field Pending MD (Inherited) provides the value for field Pending MD (∑). Pending MD (Inherited): The value in this field is calculated by the system. This field displays all projected work (in man-days) for all project parts underneath the project part being viewed. The difference between Pending MD (∑) and Pending MD (Inherited) is the projected work for the project element being viewed, and is in field Pending MD (Level). Pending MD (Inherited) is also automatically updated by CRM-Project, as soon as activities are scheduled for project nodes below the project node currently selected. Note: Recalculating a field’s value from hours to man days is based on the setting ‚Hours per Man Day‘; See section “Licenses and authorization” for more details. Original Values MD Projected (∑): This field stores the total number of originally scheduled man-days. The value is automatically set, as soon as the project status reason is changed from "Planning" to "Processing". MD Projected (Level): This field stores the number of man-days originally scheduled in the project node currently selected. The value is automatically set, as soon as the project state reason is changed from "Planning" to "Processing". Approved by: A digital signature can be used for approving projected work (MD projected). Only the current user can perform this function. This prevents unauthorized approvals and can also be applied to project planning and controlling processes. Tip: The MD Projected and MD Projected-Inherited original values are there to provide a comparison of projected and actual values, over the course of the project, in standard CRM list views. Additionally, it’s possible to track the original values of project values by using the Microsoft CRM auditing function. Tip: You can also use the digital signature in the “Approved by” field for different purposes and approvals through simple customizations. Please refer to the Microsoft CRM User Manual for more information. CRM-Project Rollup 16 and higher 8 / 24 1.5 Costs Details Personnel Costs (∑): The value in this field is calculated by the system. This field is the sum of the Personnel Costs (Level) and Personnel Costs (Inherited) fields. The value (therefore) represents the sum of all accrued personnel-related costs in the project and all project nodes underneath. Personnel Costs (Level): The value in this field is calculated by the system. Displayed in this field are the personnel-related costs accrued in the project node being viewed (with no nodes underneath). Personnel Costs (Inherited): The value in this field is calculated by the system. This field displays the personnel-related costs accrued in all project parts beneath the node selected. Note: Personnel Costs contain personnel-related costs occurring from time entries in the project. For more details see section “Time and work entry”. Material Costs (∑): The value in this field is calculated by the system. This field is the sum of the Material Costs (Level) and Material Costs (Inherited) fields. The value (therefore) represents the sum of all material costs currently accrued for this and all project nodes underneath. Material Costs (Level): The value in this field is calculated by the system. Displayed in this field are the material costs accrued for the project node being viewed (with no nodes underneath). Material Costs (Inherited): The value in this field is calculated by the system. This field displays the material costs of all the project parts beneath the node selected. Note: Material Costs contain material-related costs occurring from “Material Usage” and “Resource Usage” (see section “Time and work entry”) activity type project entries. Travel Costs (∑): The value in this field is calculated by the system. This field is the sum of the Travel Costs (Level) and Travel Costs (Inherited) fields. The value (therefore) represents the sum of all travel costs currently accrued for this and all project nodes underneath. Travel Costs (Level): The value in this field is calculated by the system. Displayed in this field are travel costs accrued for the project node being viewed (with no nodes underneath). Actual Costs (Inherited): The value in this field is calculated by the system. This field displays the travel costs of all project parts beneath the node selected. Note: Travel Costs contain travel-related costs, occurring from time entries in travel activities and receipts. For more details see section “Travel management”. Total Costs (∑): The value in this field is calculated by the system. This field is the sum of the Costs (Level) and Costs (Inherited) fields. The value (therefore) represents the sum of all costs currently accrued for this and all project nodes underneath. Costs (Level): The value in this field is calculated by the system. Displayed in this field are the total costs accrued for the project node viewed (with no nodes underneath). Costs (Inherited): The value in this field is calculated by the system. This field displays the total costs of all project parts beneath the node selected. CRM-Project Rollup 16 and higher 9 / 24 1.6 Budget Planning Budget (∑): The value in this field is calculated by the system. This field shows the projected budget for the relevant project node (from field "Budget (Level)"), including the budget of project nodes underneath. Budget (Level): Entered in this field is the projected budget for the project node currently being displayed. The value can only be entered/changed while the project state is "Planning". Together, fields Budget (Level) and Budget (Inherited) provide the value for the Budget (∑) field. Budget (Inherited): The value in this field is calculated by the system. This field displays the entire budget for all project nodes that are beneath the project part currently being displayed. Budget Personnel Cost (∑): The value in this field is calculated by the system if the use of personnel costs in the budget is selected under settings. This field shows the entire budget for personnel costs, for the respective project node, including the project nodes underneath. Budget Personnel Cost (Level): The value in this field is calculated by the system if the use of personnel costs in the budget is selected under settings. This field shows the budget of the project node currently being shown. The value is calculated automatically from the resources entered in the resource planner. Please see section “Structuring projects” for more details. Budget Personnel Cost (Inherited): The value in this field is calculated by the system if, under Settings, the use of personnel costs in the budget is selected. This field displays the entire personnel cost budget for those project nodes that are beneath the project node currently being shown. Total Budget (∑): The value in this field is calculated by the system. This field is the sum of values Budget (∑) and Budget Personnel Cost (∑). The value hence corresponds to the entire budget that is available for the project, including all project nodes underneath. Total Budget (Level): The value in this field is calculated by the system. This field is the sum of values Budget (Level) and Budget Personnel Cost (Level). The value hence corresponds to the total budget that is available for the project node currently selected. Total Budget (Inherited): The value in this field is calculated by the system. This field is the sum of values Budget (Inherited) and Budget Personnel Cost (Inherited). The value thus corresponds to the sum of the budgets that are provided from the project nodes, below the project node currently selected. Tip: Within the budget, i.e. the projected costs of the project, you have the choice whether or not to work with the separate disclosure of personnel costs. The "Budget Personnel Cost …" fields are then either required or not. If you work without the separate disclosure of personnel costs, the same values are displayed in fields "Budget …" (line 1) and "Total Budget…" (line 3). Please refer to section “Structuring projects” for more details on budgeting. Original Values Budget Sum (∑): This field stores the total of the budget originally scheduled. The value is automatically calculated as soon as the project status reason is changed from "Planning" to "Processing". Budget Sum (Level): Stored in this field is the budget originally projected in the project node currently selected. The value is automatically set as soon as the project status reason is changed from "Planning" to "Processing". CRM-Project Rollup 16 and higher 10 / 24 Tip: These two original values are there to provide a comparison of projected and actual values over the course of the project in standard CRM list views. In addition, the storing of any project values is possible with the Auditing function of Microsoft CRM. Please refer to the Microsoft CRM User Manual for more information. 1.7 Sales MD sold (∑): The value in this field is calculated by the system. This field shows the total mandays sold for the current project node and the project nodes underneath. MD Sold (Level): The sold man-days for the current project node can be kept in this field. Values MD Sold (∑) and MD Sold (Inherited) are only controlled by this field. MD Sold (Inherited): The value in this field is calculated by the system. This field totals the sold man-days of all project nodes lying below the selected node. 1.8 Revenue Projected Revenue projected (∑): The value in this field is calculated by the system. This field shows the total amount of projected revenue, calculated through scheduled activities/work and prices of the order products, for the current project node and the project nodes underneath. Revenue projected (Level): The value in this field is calculated by the system. This field shows the total amount of projected revenue, calculated through scheduled activities/work and prices of the order products, for current project node (not including nodes underneath) Revenue projected (Inherited): The value in this field is calculated by the system. This field contains the amount of projected revenue, calculated through scheduled activities/work and prices of the order products, for all project nodes lying below the selected node. Note: There are different ways to calculate the values in the “Revenue Projected” fields. Use the “Forecast Calculation” setting to activate or define the required mode. For more details see section “All about the project”. Achieved Revenue achieved (∑): The value in this field is calculated by the system. This field shows the total amount of the achieved revenue, calculated through completed activities/work and prices of the order products, for the current project node and the project nodes underneath. Revenue achieved (Level): The value in this field is calculated by the system. This field shows the total amount of achieved revenue, calculated through completed activities/work and prices of the order products, for the current project node (not including nodes underneath). Revenue achieved (Inherited): The value in this field is calculated by the system. This field contains the amount of achieved revenue, calculated through completed activities/work and prices of the order products, for all project nodes lying below the selected node. CRM-Project Rollup 16 and higher 11 / 24 Invoiced Revenue invoiced (∑): The value in this field is calculated by the system. This field shows the total amount of invoiced revenue, calculated through billed activities/work and prices of the order products, for current project node and the project nodes underneath. Revenue invoiced (Level): The value in this field is calculated by the system. This field shows the total amount of invoiced revenue, calculated through billed activities/work and prices of the order products, for the current project node (not including nodes underneath). Revenue invoiced (Inherited): The value in this field is calculated by the system. This field contains the amount of invoiced revenue, calculated through billed activities/work and prices of the order products, for all project nodes lying below the selected node. Note: The value in this field is not updated automatically. This field is only updated when the project is recalculated. The "Calculate" function is available for this on the ribbon bar, for every project. 1.9 Description & Notes Description This text field can be used for descriptions of project content, task and goal pursued. Notes This area can be used for standard Microsoft CRM notes. Notes can also be used for keeping documents and attachments. Tip: For keeping documents within the project, we recommend using document management integration of Microsoft CRM with Microsoft Sharepoint. 1.10 Settings Automation & Controlling „Inherit responsibility”: You are able to choose whether the responsibility is inherited or not after changes for a project node. The default standard is ‘Yes’. „Calculate Progress automatically”: Use this setting to specify whether the project progress is automatically filled as a percentage (see field "Progress") by the system or whether the information is entered manually by the person in charge of the project. „Consider HR Budget”: This setting is only available on the topmost level of every project. You can use this button to control whether the budgets entered manually are used to calculate budgeting or whether the scheduled resources are included in budgeting via the cost rates kept there. Please refer to section “Structuring projects” for more on the topic of budgeting. “Forecast Calculation”: Revenue can be calculated depending on the option in this field (see section “All about the project”). Use the “By Activities” option to calculate revenue based on activities scheduled for project nodes. In this case, projected, but still open activities are represented as “Pending MDs” (see section “All about the project”). When using the “By Planning Table” option, work assigned to the project members via Planning Table is considered. If you don’t want to calculate revenue at all, set the option to “Off”. CRM-Project Rollup 16 and higher 12 / 24 “Last manually calculated on”. The date and time of the last manual calculation (by button “Calculate” on the ribbon bar) is set in this field. This field can also be used as a trigger for individual calculation. “Last journal entry created on”. The date and time of the last project journal entry’s creation is saved in this field (see section “All about the project” to learn more about it). Monetarily Specify here the currency valid for the project. Further entities A sales opportunity can be assigned to a project here to support, early on, (with the project structure) projects that are still in pre-sales. 2 Activities pane CRM-Project Rollup 16 and higher 13 / 24 2.1 Activities The window below depicts all available activities which are assigned to the project node. Additional views and filters are available in the Gantt chart and Work Breakdown Structure (WBS) to provide an overview of all activities within the whole project structure (not only those of the project node currently selected). 2.2 Closed activities In this area are all closed activities assigned to the currently selected project node are to be found. Views and filters are available in the Gantt chart and the WBS to provide an overview of all activities within the whole project structure. 2.3 Documents (if Share Point has been integrated beforehand) Information about Share Point added documents can be found in this area. 2.4 Travel Here, all travels related to the currently selected project node can be found. Views and filters are available in the Gantt chart and WBS to provide an overview of all travels within the whole project structure. 2.5 Receipts The Receipts area provides you with direct access to the receipts created for travels pertaining to this project node. Views and filters are available in the Gantt chart and WBS to provide an overview of all receipts within the whole project structure. 2.6 Cases The Cases area enables you to see whether (and if yes) which cases are assigned to this project node. This enables the user to collect service cases pertaining to a particular work areain a project or subproject. CRM-Project Rollup 16 and higher 14 / 24 3 3.1 Planning pane Work Breakdown Structure (WBS) The Gantt chart and the WBS are the two ways to structure a new project and to edit and monitor an existing one. „Complete“ button With the "Complete" button (in the project tree), several work packages can be simultaneously marked as complete. If an open activity is still present in a project node, the node cannot be marked as complete. You will be prompted with an error message. To complete a project node, make sure to mark all activities and task within the node as complete. Filter The filter is available in the Work Breakdown Structure, the project-related Gantt chart and the company-wide Gantt chart, and filters the elements shown using the Classification attribute (see section “All about the project” for details on the attribute). The filter “Mainnodes only" option is only available in the company-wide Gantt chart because there is only ever one main node in the project-related Gantt chart. Any number of classification values can be included/excluded. Filtering pertains by default to all nodes in the project structure displayed. Alternatively, all elements of the project structure can be shown. A gray background denotes elements not meeting the criteria. Electively, the option "Display only filtered elements" can be selected; then all elements not matching the classification are hidden from view. For this, the structure of the project in this view is converted to a list. Activities The Activities drop-down menu enables you to display activities, travels and vouchers within the project structure. The following filters are available: None (default): No activities are shown and only project nodes are displayed. All activities: All activities; travel and receipts for the respective project elements are displayed (completed and open). All open: All open activities, i.e. all incomplete elements, are displayed. My activities: All activities; travel and receipts for the user currently logged into the project are displayed (completed and open). My open: All pending resource activities (status is "active") of the current user are displayed in the project structure. CRM-Project Rollup 16 and higher 15 / 24 Hide completed "Hide completed" pertains to project nodes within the Work Breakdown Structure or Gantt chart. The tick is set by default and all project nodes already complete are hidden from view for the sake of clarity. Unchecking the option shows the project nodes completed. Automatic Mode Automatic mode makes available various automations that simplify and accelerate scheduling with the Gantt chart. Please refer to Section “All about the project” for more details. Tip: You can also show the Gantt function in the WBS by using the mouse to drag the vertical divider from the righthand border to the left. View View is used to increase or decrease the scale of the time line in the Gantt chart. Please refer to Section 0for more details. Columns of the Work Breakdown Structure Line number: Automatic numbering of lines shown. Clicking a line number opens the selected element in a new window. Title: Represents the "internal title" of the relevant project node or the title of the relevant activity, travel or receipt. Start (projected) and End (projected): The projected start and end dates of the relevant element. For activity types relating only to a day (such as tasks), the due date is displayed in both the start and end date. Duration: The duration (in calendar days) is calculated as end date less start date. Predecessors: The Predecessors column enables you to define one or more project nodes as predecessors for the project node selected. Different types of relationships are possible. Level: Represents the level defined in the project and allows a change of level via a drop down menu. Owner: Represents the owner of the relevant project node. This selection can also be changed via the field. Only users who are enabled for project management are shown in this list. Status Code: The state reason of the project node. MD Projected (Level): Represents the man-days projected for the respective project node. You can enter changes directly MD Projected (Inherited), MD Projected (∑), Actual MD (∑): Project form information calculated by the system (shown read-only). MD Sold (Level): Information from the same-named field in the project form with the possibility of changing it directly. Classification: Shows the project classification with the ability to change it. Priority: Shows the selected value from the project form with the ability to change it. Risk: Shows the selected value from the project form with the ability to change it. Functions of the Work Breakdown Structure The following functions are available within the tabular view of the Work Breakdown Structure. 3.1.8.1 Shortcuts located in the keyboard The following key shortcuts are available inside the table to help you work faster: 3.1.8.2 "F2": Edits the cell selected "Esc": Exits editing mode without saving changes "Tab" or "Enter" Saves the field content Creating project nodes New project nodes and activities can be created from a context menu or by keyboard shortcut. Pressing the righthand mouse button in the table view enables access to the context menu. CRM-Project Rollup 16 and higher 16 / 24 The following items can be added using the context menu: Activity: task, fax, phone call, email, letter, appointment, service activity, rendered service, resource usage, material usage Project node: program, project, subproject, phase, activity package, milestone. The following items can be added with a shortcut: Add row (shortcut: "Ins"): Inserts another project node of the same level underneath the row selected. Add sub row (shortcut: "Shift" + "Ins"): Inserts another project node of the level below the row selected. 3.1.8.3 Removing project nodes Existing project nodes can also be removed from the context menu (Remove row) or with a shortcut ("Del"). Note: Please remember that removing a project node also irreversibly deletes all project nodes below and all related activities and information. If you only want to delete a single project node and preserve the structure underneath, we recommend "relocating" the lower-level nodes beforehand. Please refer to section “Structuring projects” for more information. 3.2 Gantt In addition to the functions of the Work Breakdown Structure, the Gantt link provides a Gantt chart with other functions for project creation and organization. Tip: General information on viewing projects within a Gantt chart is available in the relevant project management literature. CRM-Project Rollup 16 and higher 17 / 24 3.3 View Symbols The following symbols are available for project nodes with the following settings for the level: Project / Program / Phase / Undefined (bracket) Subproject / Work package (bar) Milestone (diamond) For activities, travel and receipts, points are displayed on the relevant date in the Gantt chart. Red arrows denote predecessor and successor relationships in the Gantt chart. For project nodes with level setting Project, Program, Subproject, Phase and Work Package, project progress, the degree of completion is shown additionally in the Gantt chart with a line inside the relevant Gantt bar. Information from the "Progress" field of the relevant project node is used as value. A red exclamation mark after the relevant bar in the diagram signals when a project has been completed by more than 100%. Note: Completion by more than 100% can occur when the project progress is calculated automatically by the system, and already more man-days have been entered for the project than originally projected. Colors The objects on the Gantt chart (project parts, milestones, activities) are displayed in different colors depending on their status: Blue = active, in processing Orange = active, in planning Green = inactive, complete Grey = inactive, cancelled or interrupted Violet = template CRM-Project Rollup 16 and higher 18 / 24 3.4 Functions Filter See “All about the project” Activities See “All about the project” Hide completed See “All about the project” Automatic Mode Automatic Mode makes available various automations that simplify and accelerate scheduling with the Gantt chart. Behavior with Automatic Mode enabled and disabled is explained below for improved understanding. Note: The effects described below only pertain to project nodes whose start and end dates are not marked as "Fixed Dates". Fixed elements are not moved or aligned with Automatic Mode. 3.4.4.1 Changes of higher-level and lower-level elements with Automatic Mode disabled Inner limitations for higher-level nodes: If a node to be moved or changed has lower-level elements, the higher-level nodes can only be moved within the time range of the lower-level elements. It is not possible to set a Start date later or an End date earlier than defined by the lower-level nodes. Outer limitation for lower-level elements Start and End dates of a bar or bracket can only be moved within the time period of the enclosing brackets (higher-level project node). This also applies to changes in the table on the left-hand side of the Gantt view. 3.4.4.2 Changes of higher-level and lower-level elements with Automatic Mode enabled Automatic alignment of higher-level project nodes: The consequence of moving or changing a date value of a lower-level node is that the higher-level nodes are automatically given the Start date of the earliest, or the End date of the latest lower-level node. Automatic alignment of lower-level project nodes Moving a higher-level node has the following effect on lower-level elements: o Moving the higher-level element also moves all lower-level nodes, or instantly connected nodes (successor nodes) within the same time period. o Aligning the start or end date of the higher-level element moves the start or end date values of elements underneath or connected (successor elements), if they would otherwise lie outside the new range. The duration of the lower-level element is not changed however. o Increasing the time span of the higher-level element has no effect on the nodes underneath. Tip: For activities, whose due date (after a change), is no longer within the time period of the project node, the due date in Automatic Mode is set to date value "End (Projected)" of the project node belonging to the task. Activities without a due date are ignored in this automation. Also, this alignment is only run for active tasks. Tasks already closed or completed remain unchanged. View View is used to increase or decrease the scale of the time line in the Gantt chart. The following selection options are available: Weekly View Monthly View Quarterly View CRM-Project Rollup 16 and higher 19 / 24 Yearly View Drag & drop Drag & drop can be used to move the individual brackets and bars of the Gantt chart along the time axis. Also, the start and end can be changed in the chart by moving the start and end of the bar. Note: The possible movement range is based on the relevant settings of the Automatic Mode. In addition, all elements in the Gantt or structure plan, from small tasks to all parts of the project, are arranged using drag and drop; this enables a new arrangement within the structure. More information on this topic can be reviewed in Section “Structuring projects”. 3.5 Planning table The planning table is used to assign resources to the scheduled nodes within the project. This means assignment is possible up to the "Work Package" detailing level. The CRM activities are available within the project nodes for more detailed planning. The planning table is made up of various areas that are based on each another. CRM-Project Rollup 16 and higher 20 / 24 Area 1: WBS Area 3: Work Allocation Area 2: Resource Area 4: Utilization Selection Area 1: Work Breakdown Structure Area 2: Resource Selection Area 3: Work Allocation Area 4: Utilization Area 1 provides access to all the nodes of a project. Resource assignment is on a per-node basis (i.e. per row). The required project node must be selected first. Resources are then, for this node, assigned in area 2. You can decide whether you wish to assign defined users and/or service types. When assigning work, employees can be selected through options related "Services" or "Business Unit", when planning criteria. After selection of the required resources by checking the checkboxes, Area 3 is used to allocate the work. The "MD Projected (Level)" column provides information on the amount of work scheduled for the project node. By activating the setting “Actual MD” (in the legend) for each team member the “actual time entries” will be shown beside the planned time. The "Work Assigned" column automatically shows the total of man-days already distributed. To the right are all the selected resources in columns. The assigned and actual work for every resource can be viewed under each team member. Please refer to section “All about the project” for more information. Linking man-days to the pre-selected resources displays these resources and their respective project utilization in Area 4 below the work allocation. Note: The resource preview in Area 4 can be deactivated by the user. This allows faster planning, especially when you are working on big projects with many lines. Use the option “Display Resource Utilization” in the header for activating or deactivating. The legend shows the meaning of the individual colors of the bars shown: The legend is minimized by default; you can re-open the legend by clicking the side arrow. The work use, from the project node currently selected, is shown in cyan. Other projects, still active for the resource, are shown in orange while they are still in planning and blue as soon as projects are in processing. Fixed appointments are shown in yellow on the relevant day. If an employee is planned for a project while absent, a red error frame will appear. There may be overload or underutilization depending on work utilization. These scenarios can be solved with the following actions for example: CRM-Project Rollup 16 and higher 21 / 24 Distribution of the project node work in other ratios or to other resources in Area 3. Changing the runtime of the project node via Start date / End date in Area 1. In Area 3, moving back the Gantt view of the project and moving the bar of the project node to another area in which utilization results in fewer conflicts. Tip: Layer transparency enables you to see the Gantt view at all times, even if you only want to use work allocation. After scheduling the resources, you can inform the project members and service managers about upcoming project assignments by e-mail; to do this select the project node, right-click and send the e-mail. The system looks up the participants in the project, and the project sub-nodes, and sends the e-mail to the notification. 3.6 Resource Usage Resource usage is a filtered variant of resource utilization. Unlike resource utilization, in which all resources in all projects are shown, resource usage only shows the distribution of all project work over the resources scheduled for the project. Other projects within the organization are ignored. 3.7 Team Members Employees and/or services scheduled for the relevant project node are stored for team members; how many mandays of work have been scheduled and how many man-days of work have already been entered by the respective resources. CRM-Project Rollup 16 and higher 22 / 24 3.8 Connections Connections are a standard function in Microsoft CRM 2011. The 4th module uses connections to store all relevant information about other objects (contacts, accounts, etc.) within Microsoft CRM. Thus, e.g. individually defined roles can be used to classify and store all the contacts of customers and/or project partners. Additional connections to classify your customers and/or partner contacts can be created in the Connection Roles area under Business Management in Microsoft CRM Settings. More information on connection roles and their management is available in the Microsoft CRM 2011 User Guide. 4 4.1 Settlement pane Orders Under Orders are all the orders assigned to the project. Multiple orders can be assigned to a project (e.g. the initial order plus subsequent follow-up orders). Projects can be generated from orders. All relevant information for the project is transferred automatically. The orders are necessary to access information relevant to billing. Please refer to section “Billing” for more information. 4.2 Billing The billing function allows detailed analysis for all services within the project for a selected time period, and then based on this, allows a decision on the services invoiced to the customer. For this, all of the services selected for billing are kept in a timesheet. Based upon the underlying order for the project and the timesheet, the billing function calculates the amounts invoiced to the customer and generates an invoice within Microsoft CRM, if required. Please refer to section “Project controlling” for more information on the billing function. 4.3 Timesheets In this area, are all timesheets created for the relevant project so far. Active timesheets are still being processed by the Project Manager. Inactive timesheets have already been billed completely. Timesheets can also be used to generate the relevant printouts for the customer as reports (e.g. PDF), see section “Project controlling”. CRM-Project Rollup 16 and higher 23 / 24 5 5.1 Controlling pane Goals We recommend the use of goals for active control of your projects. Goals are a standard function of Microsoft CRM. A goal metric for revenue already exists in the goal metrics. Add another metric for "Number of man-days" to the goal metrics. By specifying goals in your projects or in dedicated project nodes, you are able to define particular focus areas for your Project Managers and specify goals (as money or work). Reports and/or dashboard charts can be used to monitor these. Tip: General information on using Microsoft CRM 2011 goals and the settings for the goal metrics is available in the Microsoft CRM 2011 User Documentation for Module (Sales). 5.2 Audit History If you have Auditing for entity "Project", all changes to the data in the form are stored in the Auditing History, including when the change was made and by whom. Note: As all project entries are extrapolated to the project in real-time, all fields of type "Actual MD" work and type "Costs" are changed very often. We therefore recommend the explicit exclusion of these fields from the monitoring process. Only include these fields in the monitoring process when they are urgently required for the analyses and when you can guarantee that your system is powerful enough and adequate resources are in place to store the additional data volume. CRM-Project Rollup 16 and higher 24 / 24