1
CLIO
ELECTRICAL & ACOUSTICAL TESTS
QC Software extension
User's Manual
AUDIOMATICA
© Copyright 1991–2004 by AUDIOMATICA SRL
All Rights Reserved
January 2004
IBM is a registered trademark of International Business Machines Corporation.
Windows is a registered trademark of Microsoft Corporation.
CONTENTS
14 QUALITY CONTROL ............................................................................ 5
14.1 INTRODUCTION ................................................................................................................... 5
14.2 FEATURES OF CLIOWIN QC .............................................................................................. 5
14.2.1 THE OPERATOR'S POINT OF VIEW ........................................................................... 6
14.2.2 THE ENGINEER'S POINT OF VIEW ............................................................................. 7
14.2.3 THE COMPANY'S POINT OF VIEW .............................................................................. 9
14.3 THE QC SOFTWARE OPERATION ................................................................................... 10
14.4 THE QC CONTROL PANEL................................................................................................ 14
14.4.1 TOOLBAR BUTTONS ................................................................................................. 14
14.4.2 THE QC REPORT PANEL .......................................................................................... 16
14.4.3 REVIEWING A MEASUREMENT .................................................................................. 17
14.4.4 THE QC RESULT PANEL ............................................................................................ 18
14.4.5 THE QC BANNER ....................................................................................................... 19
14.4.6 QUALITY CONTROL MENU AND SHORTCUTS ........................................................ 20
14.4.7 QC REGISTERED FILE EXTENSIONS ...................................................................... 21
14.5 MY FIRST QC SCRIPT ....................................................................................................... 22
14.5.1 WHAT TO KNOW ABOUT QC SCRIPTS ................................................................... 22
14.5.2 HOW TO WRITE MY FIRST QC SCRIPT ................................................................... 22
14.6 NOTES ON LIMITS CURVES .............................................................................................. 26
14.6.1 ABSOLUTE VS. RELATIVE FREQUENCY LIMITS ...................................................... 27
14.6.2 AVERAGE LEVEL CHECK ........................................................................................... 28
14.6.3 ALIGNED MASK ........................................................................................................... 30
14.6.4 FLOATING LIMITS VS. FLOATING CURVES ............................................................... 31
14.6.5 THIELE&SMALL PARAMETERS CHECK .................................................................... 32
14.6.6 SINUSOIDAL HARMONICS CHECK ............................................................................ 33
14.6.7 MULTIMETER LIMITS FILES ........................................................................................ 34
14.7 MANAGING PRODUCTION BATCHES ............................................................................... 35
14.7.1 DIRECTORIES CREATED BY CLIOWIN QC ............................................................. 35
14.7.2 PRODUCTION REPORT FILES ................................................................................. 36
14.7.3 AUTOSAVED DATA FILES ........................................................................................... 37
14.7.4 WYSIWYG OPERATION ............................................................................................. 37
14.7.5 STATISTICAL INFORMATION ON MEASURED DATA ................................................. 38
14.7.6 SERIAL NUMBER COHERENCE ................................................................................ 38
14.7.6 THE SKIP LAST BUTTON ........................................................................................... 39
14.8 INTERACTING WITH EXTERNAL HARDWARE ................................................................. 40
14.8.1 INPUT SENSITIVITY AND OUTPUT VOLTAGE CONTROL ........................................ 40
14.8.2 SC-01 DC OUTPUT CONTROL ................................................................................. 40
14.8.3 CLIOQC AMPLIFIER&SWITCHBOX CONTROL ........................................................ 41
14.8.4 EXTERNAL TRIGGER ................................................................................................. 41
14.8.5 SIGNALS GENERATION .............................................................................................. 42
14.8.6 TIME DELAYS GENERATION ...................................................................................... 43
14.8.7 PARALLEL PORT SIGNALS MANAGEMENT .............................................................. 44
14.8.6 RS-232 SERIAL PORT CONTROL ............................................................................. 45
14.9 LEARNING CLIOWIN QC WITH EXAMPLES ...................................................................... 46
14.9.1 EXAMPLE 1: QC OF A MICROPHONE PREAMPLIFIER ............................................ 46
14.9.2 EXAMPLE 2: THE AMPLIFIER&SWITCHBOX UNDER QC ........................................ 49
14.9.3 EXAMPLE 3: A FOUR-WAYS CROSSOVER .............................................................. 51
14.9.4 EXAMPLE 4: A MEDIUM SIZED PRODUCTION OF A 13CM DRIVER......................... 53
14.9.5 EXAMPLE 5: A LARGE SIZED PRODUCTION OF A 2CM TELEPHONE DRIVER ..... 55
14.9.6 EXAMPLE 6: A CYCLIC SCRIPT (USED TO MANAGE MY ROGERS LS3/5A TWO-
WAYS LOUDSPEAKER PRODUCTION) ............................................................................... 57
14.10 QC SCRIPT SYNTAX REFERENCE ................................................................................ 60
14.10.1 KEYWORDS FOR GENERAL SETTINGS ................................................................ 60
14.10.2 KEYWORDS FOR MEASUREMENTS SETTINGS ................................................... 63
14.10.3 KEYWORDS FOR CONDITIONAL EXECUTION ...................................................... 65
14.10.4 KEYWORDS FOR HARDWARE CONTROL ........................................................... 68
14.10.5 OTHER KEYWORDS ............................................................................................... 69
14.10.6 KEYWORDS USED IN LIMITS FILES ....................................................................... 70
14 QUALITY CONTROL
14.1 INTRODUCTION
The Quality Control software extension for CLIOwin is a powerful suite for executing
state of the art production line testing.
CLIOwin QC implements all the measurement techniques found in the CLIOwin standard
software adding a versatile script processor that handles the test sequence most
appropriate for your needs.
CLIOwin QC is able to test the production of loudspeakers, drivers, microphones,
amplifiers and of any other electroacoustic device.
CLIOwin QC can interact with external hardware or production line controller, with PC
peripherals, with network or with custom written software to realize a fully automatic
line test.
14.2 FEATURES OF CLIOWIN QC
CLIOwin QC is exceptionally powerful as it relies on the power of CLIOwin.
Some of the measurements possible:
- Frequency response with MLS
- Impedance with MLS
- Polarity
- Frequency response with Sinusoidal Sweep
- Impedance with Sinusoidal Sweep
- Single harmonic response with Sinusoidal Sweep
- Narrowband FFT analysis with definable stimulus
- T&S parameters
- Sensitivity
- Frequency
- THD
- IMD
- Noise
The application of single measurements or the combination of more give the best
answer to complex topics like rub&buzz testing.
Some of the QC management features are better explained starting from the various
subjects taking part to this complex operation and from their points of view:
- The operator working on the line
- The quality control engineer responsible for production line operation
- The company and its managers controlling the overall process
Chapter 14 - Quality Control
5
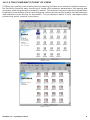
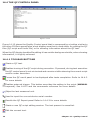
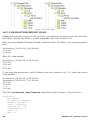
14.2.1 THE OPERATOR'S POINT OF VIEW
A quality control test can be controlled by simple Go-NoGo masks letting even the least
experienced operator work without problems and with a zero time learning curve.
Figure 14.1
A more complex operation foresees the continuous display of the measurements
executed until the reaching of the final result.
Figure 14.2
A third possibility is to view and interact with the test sequence during its execution.
6
Chapter 14 - Quality Control
Figure 14.3
Complete test information and report are always presented to the user.
Figure 14.4
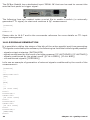
14.2.2 THE ENGINEER'S POINT OF VIEW
As the QC is integrated inside the CLIOwin software no new user interface has to be
learned by the engineer who has experienced CLIOwin inside her or his research
laboratory. A quality control test relies on real measurements saved on disk and on a
simple text script.
Figure 14.5
Chapter 14 - Quality Control
7
Defining a QC script is easy as it takes writing only few descriptive lines of text, no
programming languages or complex instructions are involved.
Figure 14.6
It is possible to capture the active measurement; the check masks can also be input
in a visual manner drawing limits over the measurement; debugging is helped by an
internal corrector.
Figure 14.7
8
Chapter 14 - Quality Control
14.2.3 THE COMPANY'S POINT OF VIEW
CLIOwin for quality control executes line testing in a fast, accurate and reliable manner.
Its flexibility permits easy handling of trade-offs between parameters like speed and
accuracy matching always company's needs. The autosaving and exporting capabilities
together the complete result reporting give instant access to the production parameters
and statistics even during its operation. The production batch is fully managed while
preserving serial number coherence.
Figure 14.8
Figure 14.9
Chapter 14 - Quality Control
9
14.3 THE QC SOFTWARE OPERATION
The QC software is a "file driven" event processor that, in sequence, performs a number
of user-defined measurements to test the quality of a production line.
The text file ('.qc' extension) driving this process is called the QC Script.
CLIO's QC processor does the following job:
-
reads the QC script and loads it in memory
interprets it
executes all the tests
reports the test result and production statistics
manages the production batch and serial number
prompts for the next test
The following block diagram outlines the QC process.
LOAD QC
SCRIPT
WAIT FOR USER
OR TRIGGER TO
START QC TEST
REPORT,
STATISTICS
& BATCH
MANAGEMENT
PERFORM
MEASUREMENT
QC TEST
MEASUREMENTS
ENDED ?
NO
BAD
NO
YES
QC TEST
GOOD
YES
ALL RESULTS
GOOD ?
Figure 14.10
You can see the operation of loading the QC script from disk that begins our quality
control session; then CLIO waits that the user, or an external trigger (for example a
TTL signal from the automation controller), gives the actual start to the QC test; the
measurements defined are then executed in sequence until the last is reached; the result
of the test is given by the sum of all the checks done inside the test sequence, it is good
only is all checks gave positive result; the QC test ends updating report and statistics
while managing the production batch; the next device can then be put under test.
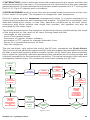
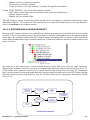
To proceed further it is advisable to go into a greater detail of the former block diagram;
this is done in Fig.14.11 and 14.12; Fig.14.11 zooms the entire QC test sequence adding
the blocks in red, while Fig.14.12 zooms the "Perform Measurement " single block (the
blue one).
Three different operating modes are here outlined: the DISPLAY mode, the INTERACTIVE mode and the DISPLAYONBAD mode.
If none of these modes is active the QC test proceeds without any measurement shown, with simple go-no-go masks, as in Fig.14.1.
If DISPLAY mode is active then the executed measurements are shown and persist
on the screen for a definable amount of time, the test automatically proceeds until the
end. Fig.14.2 depicts such a situation.
10
Chapter 14 - Quality Control
If INTERACTIVE mode is active the executed measurements are shown and then the
software prompts for user input . The sequence is not continued until the user executes
particular actions. It is also possible to loop certain measurements for D.U.T. tuning (see
Fig.14.12). Fig.14.3 depicts such a situation.
If DISPLAYONBAD mode is active then the executed measurements are shown only
if their result is not good. The sequence is stopped for user acceptance.
Fig.14.11 shows also the Autosave management which is of great importance for
controlling the production and characterizing a batch. This feature is completely user
definable allowing for binary or text files, operation conditioned by the test result,
coherence with serial number and single test number; the operator can also be
prompted for file name input.
Two blocks are devoted to the execution of particular actions conditioned by the result
of the single test or the result of all tests. Among these we find:
- messages to the operator
- print of the measurement
- execution of custom written software
- generation of TTL signals to manage automatic lines
- pause for a predefined amount of time
- stop the sequence
The last red block, right before the end of the QC test, represents the Cyclic Script.
The cyclic script is a particular sequence of QC operations described and saved in a script
file that is executed regularly after a certain number of QC tests have been executed;
this is useful for retesting reference quantities that characterize the entire process and
maintain traceability to environmental conditions. The typical example is the reference
loudspeaker tested every 100 production units have passes the QC test.
LOAD QC
SCRIPT
WAIT FOR USER
OR TRIGGER TO
START QC TEST
MANAGE
AUTOSAVE OR
AUTOEXPORT
PERFORM
MEASUREMENT
SHOW
MEASUREMENT
IF DISPLAY
MODE
RESULT
GOOD?
SHOW AND
PROMPT IF
INTERACTIVE
MODE
NO
YES
SHOW
MEASUREMENT
IF
DISPLAYONBAD
EXECUTE
CYCLIC SCRIPT
IF TIME TO
REPORT,
STATISTICS
& BATCH
MANAGEMENT
TAKE USER
DEFINED
ACTIONS
CONDITIONED BY
THE RESULT OF
ALL
MEASUREMENTS
TAKE USER
DEFINED
ACTIONS
CONDITIONED
BY THE RESULT
OF THE SINGLE
MEASUREMENT
QC TEST
BAD
NO
QC TEST
GOOD
ALL RESULTS
GOOD ?
YES
YES
NO
MEASUREMENTS
ENDED ?
Figure 14.11
Chapter 14 - Quality Control
11
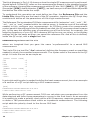
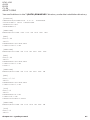
The third diagram in Fig.14.12 shows us how the single QC measurement is performed.
As said before CLIOwin QC relies on the measurements present in the standard version
of the software; the possible measurements within QC are: MLS ([MLS]), FFT ([FFT]),
Sinusoidal ([SIN]) and Multimeter ([MET]); we have now put in evidence the keywords
that define the tests inside the script.
To understand this operation we must define two files: the Reference File and the
Limits File; these files are the heart of the QC operation, together the QC Script they
contribute to define all the parameters of the single measurement.
The Reference File is a standard CLIOwin measurement file (extension '.mls', '.mlsi', '.fft',
'.sin', '.sini' or '.met') created within its relative menu; it contains most of the settings
needed to fully configure your measurement. As CLIOwin resets the measurement
control panel to the settings of the file loaded from disk, the QC processor does the same
job; in this easy but effective way of operating you will be sure that, for example, the
sampling frequency of your QC MLS measure will be the one you chose, or the display
settings will be the same as when you saved the reference file. And all this is defined,
inside the QC script, with a single text line:
REFERENCE=myreferencefile.mls
where we imagined that you gave the name 'myreferencefile' to a saved MLS
measurement.
The Limits File is a text file ('.lim' extension) defining the frequency mask or quantities
needed to check the executed measurement. The syntax used is the same as the QC
script. A Limits file can be as simple as:
[UPPER LIMIT DATA]
100
+5
500
+3
5000
+1
10000
+5
[LOWER LIMIT DATA]
100
-5
500
-3
5000
-1
10000
-5
In principle nothing else is needed to define the basic measurement; here is an example
of a section of a QC script defining a MLS measurement:
[MLS]
REFERENCE=MYREFERENCEFILE.MLS
LIMITS=MYLIMITSFILE.LIM
While performing a QC measurement CLIO can calculate more parameters from the
data acquired and have these parameters to concur to the final result. As an example
it is possible to make a polarity check within a MLS frequency response measurement
or make a T&S parameters check within an impedance measurement. The following
script adds the polarity check to the former MLS test.
[MLS]
REFERENCE=MYREFERENCEFILE.MLS
LIMITS=MYLIMITSFILE.LIM
POLARITY=1
12
Chapter 14 - Quality Control
INPUT
SET QC
OPTIONS
LOAD LIMITS
FILE
LOAD
REFERENCE
FILE
EXECUTE
MEASUREMENT
CALCULATE
OPTIONAL
PARAMETERS
OPTIONAL
LOOP
BAD
CHECK
RESULT
GOOD
READY FOR
NEXT
PERFORM MEASUREMENT
OUTPUT
Figure 14.12
Here is a list of the parameters that can be calculated within each measurement:
MLS
- Average (or single frequency) level
- Polarity
- T&S parameters
FFT
- Average (or single frequency) level
Sinusoidal -
Average (or single frequency) level
2nd harmonic response
3rd harmonic response
4th harmonic response
5th harmonic response
T&S parameters
Chapter 14 - Quality Control
13
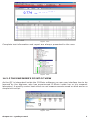
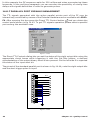
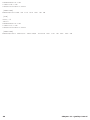
14.4 THE QC CONTROL PANEL
Figure 14.13
Figure 14.13 shows the Quality Control panel that is composed by a toolbar similar to
the other CLIOwin panels plus a text display area that is used either for editing the QC
files (QC script and Limits file) or for showing information about the QC test.
When the QC display handles file editing it has a white background while, when showing
information, it is lightly coloured.
14.4.1 TOOLBAR BUTTONS
Starts a QC test.
Enables tracing of the QC script during execution. If pressed, during test execution
the QC control panel is not minimized and remains visible showing the current script
section under execution.
Forces the QC result panel to be displayed after tests completion. Refer to 14.4.3
for more details.
Enables external trigger. This button overrides the setting in the script (MANUAL
keyword). See 14.8.2 and the commands reference for more details.
Skips the last measured unit.
Used to input the current device serial number.
Recalls the QC Report panel Refer to 14.4.3 for more details.
Starts a new QC script editing session. The text present is cancelled.
Edit the current text.
14
Chapter 14 - Quality Control
Immediately saves the current text as Script or Limits file.
Enters the Script Text mode. The QC display presents the currently loaded QC script
file.
Enters the Limits Text mode. The QC display presents the currently loaded Limits
file.
Enters the Information Text mode. During tests the QC display shows the current
QC script section under execution. When the test sequence is finished the QC display
shows information about the executed tests.
If in Script Text display mode, 'captures' the active measurement generating a
'piece' of script file relative to the currently loaded reference and limits files. The text
is inserted at cursor position. As an example the following text is generated in the
assumption that you have MLS open with the active measurement saved as
'myreferencefile.mls' and that you have loaded the 'mylimitsfile.lim' inside QC; also
captured are output level and input sensitivity (here assumed to be 0dBu and 0dBV
respectively).
[MLS]
OUT=0.0
IN=0
REFERENCE=MYREFERENCEFILE.MLS
LIMITS=MYLIMITSFILE.LIM
If in Limits Text display mode, 'captures' the limits file of the active measurement
loading it inside the QC display.
Creates the frequency curves relative to the limits file under editing and shows them
in the active measurement control panel.
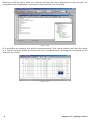
Enables the Draw Limits controls that let you visually input the frequency limits directly
drawing on the active measurement control panel. Fig.14.14 shows the MLS control
panel with the Draw Limits controls on the top. Clicking on one of the two buttons
starts drawing of the relative limit curve; to finish input double-click on the last
frequency point.
Note: it is mandatory to input points from left to right.
Figure 14.14
Chapter 14 - Quality Control
15
Hides (if visible) or shows (if hidden) the limits curves in the active measurement
control panel.
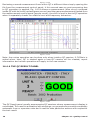
Releases all the measurement control panels. Each panel acquires its normal
appearance. In fact, when a QC test sequence is running, each panel 'loses' its overlay
and curve controls and its status bar in order to maximize the graph display when
the windows are tiled. Fig.14.15 shows the MLS control panel in the two different
situations.
Figure 14.15
When control panels are managed under QC there are two other differences: toolbar
button are usually disabled while the title of the window is used to display the result
of the parameters that have been calculated: in Fig.14.15 we see written 'Level:0.37dB
GOOD' which reports the result of an average level check done on the measured MLS
frequency response.
14.4.2 THE QC REPORT PANEL
Figure 14.16
The QC Report panel serves as an interactive tool of great help for inspecting a
production while it is tested; it is composed by two tree views named STATISTICS
and TEST REPORT that handles all the information pertaining to your QC session in a
very compact form.
The QC Report panel can be kept open during the tests and it accompanies the work
in a really effective visual form.
Under STATISTICS you find information about:
- QC test and Company names
- Date of the first unit tested
16
Chapter 14 - Quality Control
- Name of the production batch
- First serial number tested
- Total number of units tested, number of goods and bads
Under
-
TEST REPORT you find information about:
DUT test result with serial number and time of production
Single tests results
Name of the saved files
The QC Report panel is also the starting point for reviewing a saved measurement as
described below. The name of the saved file is a sensible area where you can doubleclick to review the measurement.
14.4.3 REVIEWING A MEASUREMENT
During a QC tests session it is possible to review a measurement that has been saved
to disk. This is important when, for example, trying to understand why a measurement
went bad. As we saw before the QC report panel indicates all the name of the files that
have been created during the test execution, under the relative serial number and single
test number.
Figure 14.17
As soon as a QC sequence is terminated simply open the tree view of your interest,
identify the measurement you want to inspect and double click on its name (Fig.14.17).
CLIO loads the measurement as if it were performed inside the running QC, together
with its pertinent limits and executes all the calculations defined in the QC script ending
with the result check and display. Fig.14.18 describes such a process; compare it with
Fig.14.12.
DOUBLE-CLIK
ON REPORT
TREE VIEW
LOAD LIMITS
FILE
LOAD
REFERENCE
FILE
LOAD
MEASUREMENT
FROM DISK
BAD
CHECK
RESULT
CALCULATE
OPTIONAL
PARAMETERS
GOOD
DISPLAY
RESULT
REVIEW MEASUREMENT
Chapter 14 - Quality Control
17
Figure 14.18
Reviewing a saved measurement from within QC is different than simply opening the
file from the measurement control panel; it this second case no post processing due
to QC operation is applied. Fig. 14.19 shows a measurement (blue curve) reviewed
inside QC with its limits (red and green curves) and the same measurement loaded from
the measurement control panel (purple curve); the shift in level is due to QC operation
when it separately checks for relative level and frequency behaviour.
Figure 14.19
Note: the review operation can be done only when inside a QC session; if CLIOwin is
exited when, later, QC is started again a new QC session will be created; report
information and review operation will apply to the new session.
14.4.4 THE QC RESULT PANEL
Figure 14.20
The QC Result panel usually accompanies QC sessions where measurement display is
not needed. This result in a situation with simple go-no-go masks for use with completely
automatic lines or operators who don't need to take particular actions with respect to
the test result.
18
Chapter 14 - Quality Control
To activated the QC Result panel from within the QC script use the DISPLAY=0 keyword.
Note: for maximum QC test speed use the QC Result display and don't show
single measurements as the display of a graphical objects and measurement
curves usually employs a lot of processor time.
The QC Result panel can be forced to appear at the end of the QC sequence pressing
the
button.
14.4.5 THE QC BANNER
Figure 14.21
The QC Banner is managing information and messages given to the operator while in
Interactive mode.
Chapter 14 - Quality Control
19
14.4.6 QUALITY CONTROL MENU AND SHORTCUTS
Figure 14.22
Figure 14.22 shows the Quality Control menu accessible from the Analysis menu. Here
below we list also all the available Hot Keys.
ESC or T
Exits the QC test sequence.
End
Exits the QC test sequence in Interactive mode.
SpaceBar
Continues the QC test sequence in Interactive mode.
G Starts a QC test. Equivalent to
.
K Skip last executed measurement. Equivalent to
S Input serial number. Equivalent to
R Show Report. Equivalent to
N New QC script. Equivalent to
E Edit QC script. Equivalent to
F2 Saves QC script. Equivalent to
20
Chapter 14 - Quality Control
CTRL-E
Ends an editing session, while inside the text display.
CTRL-C
Copy selected text.
CTRL-V
Paste selected text.
CTRL-X
Cut selected text.
CTRL-Z
Undo/redo text input.
Q Show QC script. Equivalent to
L Show Limits. Equivalent to
I
Show Information. Equivalent to
H Hide Limits. Equivalent to
M Release measurements. Equivalent to
14.4.7 QC REGISTERED FILE EXTENSIONS
CLIOwin Quality Control registers the following files extensions beyond the ones already
registered by CLIOwin.
QC script files.
QC Limits files.
Chapter 14 - Quality Control
21
14.5 MY FIRST QC SCRIPT
14.5.1 WHAT TO KNOW ABOUT QC SCRIPTS
A quality control script is a text file that stores information in logical groupings, called
sections.
Each section is initiated by a bracketed keyword in the form [keyword].
Within each section, QC definitions are stored in named keys.
Keys within a section take the form keyword=value.
For example the section called [GLOBALS] defines several settings useful all along the
test sequence:
[GLOBALS]
COMPANY=MY COMPANY
TITLE=MY QUALITY CONTROL
BATCH=MY PRODUCTION BATCH NAME
It is possible to input comment lines initiated by a semicolon. It is not possible to start
a comment after a keyword.
;this is a correct comment line
COMPANY=MY COMPANY ;this comment is not allowed
With these brief notes clear you are ready to write a QC script.
14.5.2 HOW TO WRITE MY FIRST QC SCRIPT
You may write your script with any text editor that stores plain ASCII files (usually '.txt'
ones), like Notepad; the only thing you should remember is that QC scripts must have
the '.qc' extension while limits files the '.lim' extension; the common behaviour of
Windows to hide registered files extensions renders this action sometimes difficult. It
is not uncommon to believe to have saved a file with, say, the name 'myfile.qc' (where
you tried to force the extension) and then find it actually saved as 'myfile.qc.txt' because
the text editor automatically appended the registered extension.
You may write your script directly editing it within the QC control panel text display; in
this case the extension management is guaranteed by CLIOwin and you will be able to
use some tools, like measurements capture, that are of help during everyday job. Doing
like this it is possible to immediately test the script pressing Go.
Let's now write our first QC script.
Have your CLIO system in the same situation as when you perform system calibration:
output A connected to input A; see chapter 3 for details. Don't connect any external
device to the system. Set output level at 0dBu and input sensitivity at 0dBV (see Chapter
5 for details). Have default settings loaded.
Open MLS; press Go. You should obtain a straight line as in Fig.14.23. Save this
measurement as 'Loop.mls'.
22
Chapter 14 - Quality Control
Figure 14.23
Now open the QC control panel. Press N, we are starting a new script. Press Ctrl-E to
exit edit mode and then press L to enter Limits Text mode. Input the following frequency
masks as limits:
[UPPER LIMIT DATA]
20
-4.2
30
-4.7
15000
-4.7
20000
-4.2
[LOWER LIMIT DATA]
20
-6.2
30
-5.7
15000
-5.7
20000
-6.2
Press F2 and save the limits file as 'loopmls.lim'. Click now on the
(script) button
(capture) button. Your blank text display should now be filled
and then click on the
with your first QC script:
[MLS]
OUT=0.0
IN=0
REFERENCE=LOOP.MLS
LIMITS=LOOPMLS.LIM
go button; the QC processor should execute a QC test performing an
Click on the
MLS measurement, displaying it together with the defined limits, everything as in
Fig.14.24; the text display should now present information on the executed test.
Chapter 14 - Quality Control
23
Figure 14.24
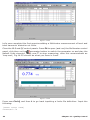
Let's now complete this first exercise adding a Multimeter measurement of level and
total harmonic distortion at 1kHz.
Close the MLS and QC control panels. Press F4 to open (and run) the Multimeter control
generator button to switch the generator on and play the
panel, click then on the
default 1kHz sinusoid. Press now T to stop measuring; save this measurement as
'loop.met'; Fig.14.25 should be what you have in front.
Figure 14.25
Press now Ctrl-Q and then L to go back inputting a limits file definition. Input the
following:
[UPPER LIMIT DATA]
VOLTAGE=0.78
24
Chapter 14 - Quality Control
THD=0.01
[LOWER LIMIT DATA]
VOLTAGE=0.77
THD=0.0001
button and position the cursor inside
Save this as 'loopmet.lim'. Click now on the
the text display after the last line of text; clicking now, as before, on the capture button
the following lines should be added and you are ready for this new QC test.
[MET]
OUT=0.0
IN=0
REFERENCE=LOOP.MET
LIMITS=LOOPMET.LIM
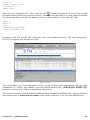
Pressing now Go inside QC executes this two-measurements QC test sequence;
Fig.14.26 shows the test at its end.
Figure 14.26
This concludes our first approach to QC script writing and debugging. All the files
necessary to "study this lesson" are furnished within the '\DATA\MY FIRST QC'
directory under the CLIOwin installation directory.
The 'loop.qc' script is doing exactly what just described with a difference: measurements
are performed in interactive mode; just load it and run it to feel the differences.
Chapter 14 - Quality Control
25
14.6 NOTES ON LIMITS CURVES
As previously outlined the QC processor needs limits data in order to perform the
required checks. These data are saved within the limits files and usually represent a
frequency mask (for frequency response and impedance tests) but they can also define
a single value check (like, for example, a Qms test).
When dealing with frequency checks the options defined affect the way the frequency
masks are calculated, the way data are displayed on screen and the way the result is
checked. It is also possible to add an average or single frequency level check that concur
to the final result.
Fig. 14.27 shows us the procedure for calculating the frequency mask after the limits
file is loaded into memory. You can see that the frequency data saved under [UPPER
LIMIT DATA] and [LOWER LIMIT DATA] are treated differently if the limits is absolute or
relative (see 14.6.1) or if an align point is defined (see 14.6.3).
LOAD LIMITS
FILE
RELATIVE?
YES
GET
REFERENCE
DATA
NO
ALIGNED?
YES
GET ALIGN
POINT
DATA
CALCULATE
LIMITS
CURVES
NO
Figure 14.27
Fig.14.28 shows us the way a frequency check is performed and the measurement is
presented on screen. You may appreciate the presence of an average level check (see
14.6.2) or a single point (aligned) level check (see 14.6.3) that concur to the final result.
When a level check is defined, either the measured curve or the limits curves
are shifted if presented on screen; in this way it is possible to appreciate the
frequency behaviour of the measured curve without the effect of a difference in
sensitivity which is checked apart.
AVERAGE
LEVEL CHECK?
NO
SHIFT
MEASUREMENT
CURVE
YES
CHECK
RESPONSE
NO
YES
ALIGNED?
CALCULATE
LEVEL @
ALIGN POINT
FLOATING
LIMITS?
SHIFT LIMITS
CURVES
FINAL
RESULT
YES
NO
CALCULATE
LEVEL IN
LIMITS BAND
CHECK
LEVEL
Figure 14.28
26
Chapter 14 - Quality Control
As a final, but not least important, note on how to define a limits file it is possible to input
the frequency mask as a text file as below.
[UPPER LIMIT DATA]
FILE=UPPER.TXT
[LOWER LIMIT DATA]
FILE=LOWER.TXT
The files 'upper.txt' and 'lower.txt' are export ASCII files that may be produced by other
applications or CLIOwin itself.
The 'upper.txt' file may look like:
Freq[Hz]
100
500
5000
10000
dBV
5
3
1
5
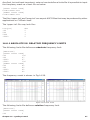
14.6.1 ABSOLUTE VS. RELATIVE FREQUENCY LIMITS
The following limits file defines an absolute frequency limit.
[ABSOLUTE]
[UPPER LIMIT DATA]
200
100
300
97
10000
97
15000
100
[LOWER LIMIT DATA]
200
82
300
85
10000
85
15000
82
The frequency mask is shown in Fig.14.29.
Figure 14.29 and 14.30
The following limits file defines a relative frequency limit.
[RELATIVE]
[UPPER LIMIT DATA]
200
5
Chapter 14 - Quality Control
27
300
2
10000
2
15000
5
[LOWER LIMIT DATA]
200
-5
300
-2
10000
-2
15000
-5
The frequency mask is shown in Fig.14.30. Relative means with respect to the
reference file defined in the QC test. Data values will be added and subtracted to
the reference value at the specified frequencies.
It is possible to input up to 100 frequency points to define the check mask. The QC
processor will execute the check starting from the first frequency point, ending at the
last; no check will be done outside this frequency range.
Inside a frequency limits file it is possible also to define an average level check (see 14.6.2
and 14.6.3) and a Thiele&Small parameters check (see 14.6.4).
A frequency limit file can be applied to an MLS, Sinusoidal or FFT test. To define a limits
file for a Multimeter measurement see later.
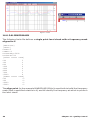
14.6.2 AVERAGE LEVEL CHECK
The following limits file defines an average level check inside the same relative
frequency limit shown before.
[RELATIVE]
[LEVEL]
UPPER=3
LOWER=-3
[UPPER LIMIT DATA]
200
5
300
2
10000
2
15000
5
[LOWER LIMIT DATA]
200
-5
300
-2
10000
-2
15000
-5
When a level check is defined inside a limits file the QC result is actually a combination
of two separate checks; one is the frequency behaviour of the measurement compared
against the frequency mask, the second is a level check which compares the average
level of the measured curve with the average level of the reference.
The levels are calculated averaging in the frequency band defined by the limits.
Fig.14.31 shows such a situation; the title of the measurement control panel reports
the level check.
28
Chapter 14 - Quality Control
Figure 14.31
The level check shown means that the value of the measurement averaged in the band
shown is 0.09dB higher than the reference average level in the same frequency band.
The measured curve is shifted of this value and then the frequency check is
performed (see also 14.6.4).
The level shift means that the curve is displayed with a level different from the
measured one. Refer also to Fig. 14.19.
As two separate checks are done there may be two distinct cases when a unit results
bad. The following figures try to explain these two cases.
Figure 14.32 shows us the case when a unit is testing bad because the frequency
behaviour is not good while the average level is OK.
Figure 14.32
Figure 14.33, instead, shows us the case when a unit is testing bad because the average
level is not good while the frequency behavior is OK.
Chapter 14 - Quality Control
29
Figure 14.33
14.6.3 ALIGNED MASK
The following limits file defines a single point level check with a frequency mask
aligned to it.
[ABSOLUTE]
[LEVEL]
UPPER=3
LOWER=-3
ALIGNFREQ=5000
ALIGNLEV=90
[UPPER LIMIT DATA]
200
5
300
2
800
2
1000
6
3000
6
4000
2
7000
2
15000
8
[LOWER LIMIT DATA]
200
-5
300
-2
10000
-2
15000
-5
The align point (in the example 90dBSPL@5000Hz) is used both to build the frequency
mask (that is specified relative to it) and to identify the frequency at which to perform
the level check.
30
Chapter 14 - Quality Control
Figure 14.34
Fig.14.34 shows an mask aligned to the point (90dBSPL@5000Hz). The level check
means that the value of the measurement at 5000Hz is 0.22dB higher than the align
point.
The measured curve is shifted of this value to pass exactly at 90dBSPL at
5000Hz; then the frequency check is performed (see also 14.6.4).
The level shift means that the curve is displayed with a level different from the
measured one. Refer also to Fig. 14.19.
14.6.4 FLOATING LIMITS VS. FLOATING CURVES
When an average or single frequency level check is defined (14.6.2 or 14.6.3) it is
possible to define floating limits instead of floating curves using the [FLOATING]
keyword.
[RELATIVE]
[FLOATING]
[LEVEL]
UPPER=3
LOWER=-3
[UPPER LIMIT DATA]
200
5
300
2
10000
2
15000
5
[LOWER LIMIT DATA]
200
-5
300
-2
10000
-2
15000
-5
In this case the measured curve is presented on screen with correct values while
the limits curves are moved around it.
Chapter 14 - Quality Control
31
14.6.5 THIELE&SMALL PARAMETERS CHECK
It is possible to execute QC tests of the following T&S parameters:
Qt, Qe, Qm, Fs, Cms, Mms, Mmd, Bl, Vas, dBSPL and ZMin.
To evaluate the first four parameters it is necessary to input the value of the DC
resistance of the voice coil with the keyword REDC.
To evaluate the remaining parameters, by means of a simplified estimation routine, it
is necessary to input the value of the driver diameter with the keyword DIAMETER and
one among the following fixed quantities: KNOWNMMD (fixed mass) or KNOWNMMS
(fixed mass plus air load) or KNOWNCMS (fixed compliance).
The following limits file defines a T&S parameters check inside a limits file with a frequency
mask for an impedance response. The parameters checked are Qt, Qe, Qm and Fs.
[TSPARAMETERS]
QTUPPER=0.3
QTLOWER=0.05
QEUPPER=0.3
QELOWER=0.05
QMUPPER=5
QMLOWER=2
FSUPPER=90
FSLOWER=50
REDC=5.5
[UPPER LIMIT DATA]
29.89
142.35
40.52
161.18
102.15
161.18
152.62
143.53
[LOWER LIMIT DATA]
29.89
11.29
49.23
20.00
64.33
45.88
76.28
47.06
98.49
22.35
141.87
11.76
The following section define a T&S check of Qts, Fs, Cms, Bl and ZMin having fixed the
mechanical mass Mmd value.
[TSPARAMETERS]
REDC=6.2
DIAMETER=110
KNOWNMMD=10.7952
QTSUPPER=0.6
QTSLOWER=0.3
FSUPPER=90
FSLOWER=50
CMSUPPER=1.1
CMSLOWER=0.8
BLUPPER=6.5
BLLOWER=6
ZMINUPPER=7.5
ZMINLOWER=7
32
Chapter 14 - Quality Control
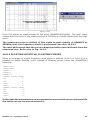
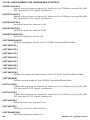
14.6.6 SINUSOIDAL HARMONICS CHECK
When executing sinusoidal frequency response measurements it is possible to activate
quality control checks over single harmonic responses from the second to the fifth.
This QC operation will be defined in the relative limits file as in the following example:
[UPPER LIMIT DATA]
1000
106
2000
116
5000
116
7000
96
[LOWER LIMIT DATA]
1000
89
2000
99
4000
99
6000
80
[3 UPPER LIMIT DATA]
300
70
500
90
2000
90
5000
70
[4 UPPER LIMIT DATA]
200
55
400
68
1300
79
1900
79
2500
77
5300
77
6300
67
In this example we defined a check on the third and fourth harmonic with an upper limit
only. It is possible to define also the lower limit but usually this is not the case. The
complete listing of the applicable keywords is in the reference section.
Fig. 14.35 shows the sinusoidal control panel after the test defined with the above limits
file.
Figure 14.35
You may note that the buttons of the harmonics are now active to let you inspect them.
When pressed the relative harmonic is shown with its limits as in fig. 14.36.
Chapter 14 - Quality Control
33
Figure 14.36
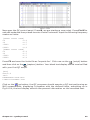
14.6.7 MULTIMETER LIMITS FILES
The following limits file defines a multimeter QC check.
[UPPER LIMIT DATA]
VOLTAGE=0.78
THD=0.01
[LOWER LIMIT DATA]
VOLTAGE=0.77
THD=0.0001
The parameters available are:
- PRESSURE
- VOLTAGE
- FREQUENCY
- THD
- IMD
34
Chapter 14 - Quality Control
14.7 MANAGING PRODUCTION BATCHES
Managing a production batch is a rather complex while delicate topic as it involves diverse
needs of diverse areas inside your company.
CLIOwin QC handles your batch doing the following:
- Maintains a directory structure where different files are saved
- Automatically saves production report files
- If requested autosaves data files
- Maintains serial number coherence
- Calculates statistical data about the batch
The result is that you will find the production well documented both for your internal
purpose aimed to achieve the highest quality standard and also for interfacing with your
client who request technical information about the units.
14.7.1 DIRECTORIES CREATED BY CLIOWIN QC
Suppose you saved your script inside the directory 'My qc'. When you run the script
CLIOwin automatically creates one or more directories under 'My qc'. There are four
cases depending on the option you set:
1) No Autosave is active. A Batch is not defined.
CLIOwin creates the 'Report' directory where all the production report files are saved.
Fig.14.37 shows this situation.
2) Autosave is active. A SaveFolder is not defined. A Batch is not defined.
CLIOwin creates the 'Report' directory where all the production report files are saved.
It also creates the 'Autosave' directory where all data files are saved. Fig.14.38
shows this situation.
Figure 14.37 and 14.38
3) A Batch is defined and is named 'My Batch'. A SaveFolder is not defined.
CLIOwin creates the 'My Batch' directory where all the production report and also
data files are saved. Fig.14.39 shows this situation.
4) A SaveFolder is defined and is named 'My Savefolder'.
CLIOwin creates the 'My Savefolder' directory where all the production report and
also data files are saved. Fig.14.40 shows this situation.
Chapter 14 - Quality Control
35
Figure 14.39 and 14.40
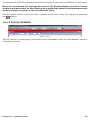
14.7.2 PRODUCTION REPORT FILES
Suppose that today, June 6, 2002, at 6:46, you started a production of your devices;
the batch, named 'My Batch', ended yesterday with unit number 100.
After two units tested CLIOwin will add, under the folder 'My Batch', the following report
files:
'production_06-06-02_6.46.18.txt'
'101.txt'
'102.txt'
After 20 units tested:
'production_06-06-02_6.46.18.txt'
'101.txt'
'102.txt'
...........
'120.txt'
If you stop the production, exit CLIOwin, and then restart it at 7:01, after two more
units tested:
'production_06-06-02_6.46.18.txt'
'production_06-06-02_7.01.05.txt'
'101.txt'
'102.txt'
...........
'122.txt'
The files 'production_date time.txt' describe the QC session. They look like:
STATISTICS
MY COMPANY
MY QUALITY CONTROL
BATCH = My Batch
DATE = 06-06-02
INITIAL SN = 101
TOTAL TESTS = 2
GOOD = 2
BAD = 0
36
Chapter 14 - Quality Control
TEST REPORT
UNIT N.102 GOOD 6.46.24
1
GOOD MLS
Response GOOD
C:\Program files\Audiomatica\Cliowinpci\Data\My
Batch\102_1.mls
2
GOOD MET
Voltage:0.775Vrms GOOD
THD:0.006% GOOD
C:\Program files\Audiomatica\Cliowinpci\Data\My
Batch\102_2.met
UNIT N.101 GOOD 6.46.18
1
GOOD MLS
Response GOOD
C:\Program files\Audiomatica\Cliowinpci\Data\My
Batch\101_1.mls
2
GOOD MET
Voltage:0.775Vrms GOOD
THD:0.006% GOOD
C:\Program files\Audiomatica\Cliowinpci\Data\My
Batch\101_2.met
qc\My
qc\My
qc\My
qc\My
The files 'serialnumber.txt' describe the single QC test and look like this:
1 GOOD MLS
Response GOOD
2 GOOD MET
Voltage:0.775Vrms GOOD
THD:0.006% GOOD
06-06-02 6.46.24
UNIT N. 102 GOOD
14.7.3 AUTOSAVED DATA FILES
Again supposing we are in the situation of the preceding paragraph let's see how data
files are saved. As it can be seen from the report files our QC test consists of a MLS and
a Multimeter measurement. As the MLS test is defined before the Multimeter inside the
script then it assumes number 1 as single QC test while the Multimeter test assumes
number 2; this is already clear from the report files above.
After two units tested we find the following measurement files:
'101_1.mls'
'101_2.met'
'102_1.mls'
'102_2.met'
As you see the QC single test numbering is integral part of the name of the autosaved
data file.
14.7.4 WYSIWYG OPERATION
Wysiwyg (i.e. "what you see is what you get") operation is the way the QC processor
saves and exports data files while executing quality control. Setting WYSIWYG=1 under
[GLOBALS] results in files saved as you see them on screen, with all the processing
Chapter 14 - Quality Control
37
peculiar to QC applied. For example if a frequency response is executed with
MODE=DIFFERENCE active (i.e. divided by the reference) than the saved file will be
divided by the reference, if wysiwyg is active, otherwise no.
14.7.5 STATISTICAL INFORMATION ON MEASURED DATA
Statistical information characterizing the production can be obtained by CLIOwin using
the STATISTICS keyword under [GLOBALS].
CLIOwin will save, under the report directory, the following files:
- One file named 'data_table.txt' with statistical informations on all the measured
parameters.
- One file named 'avg_testnumber.txt' per each response test defined containing the
average response for that test.
- One file named 'sdmax_testnumber.txt' per each response test defined containing
the average response plus two times the standard deviation for that test.
- One file named 'sdmin_testnumber.txt' per each response test defined containing
the average response minus two times the standard deviation for that test.
The statistical files keep track of the all the units saved within a batch even if
the production is stopped and then restarted.
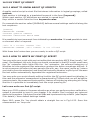
Let's now see how the 'data_table.txt' looks like; supposing the same case of 14.7.2,
after two tests, we would have the following:
SN Voltage THD
101 0.775 0.006
102 0.775 0.006
Avg 0.775 0.006
SDMax 0.776 0.006
SDMin 0.775 0.006
The other response files representing average and standard deviation curves may be
imported within each control panel with the Import feature recallable with Shift-F3.
14.7.6 SERIAL NUMBER COHERENCE
There are several ways to handle the serial numbers of your devices and to maintain
their coherence through all the production of one batch.
Before starting a test it is possible to input manually the serial number thus forcing it;
to do this just click on the
button.
The operator can be prompted for serial number input using the [SNINPUT] keyword.
It is possible to avoid that a bad unit increases the serial number using the
INCREASEONBAD keyword.
Set INCREASEONBAD=0 if you want that only good units participate to serial
number, report , statistical and autosave management.
38
Chapter 14 - Quality Control
The operator, under her or his judgement, can force the final result of a bad test if the
keyword PROMPTFORGOOD=1 is used.
14.7.6 THE SKIP LAST BUTTON
When a QC test is finished it is also possible to null its result pressing the Skip Last
button. All information saved with the test will be erased comprising serial number
increment and statistical data. The production report will mark the unit as 'SKIPPED'.
Chapter 14 - Quality Control
39
14.8 INTERACTING WITH EXTERNAL HARDWARE
The interaction with an external hardware gives CLIOwin the possibility of realizing semi
or fully automatic production lines QC tests. Several keywords have been introduced
to implement this functionality (see to reference section for a complete listing).
14.8.1 INPUT SENSITIVITY AND OUTPUT VOLTAGE CONTROL
As we have already seen it is of fundamental importance to correctly set CLIO's input
sensitivity and output level (see 5.4). The IN and OUT keywords are used for this. The
script below sets the input sensitivity at 10dBV and output level at 0dBu. These numbers
directly appear also in the main tool bar of CLIOwin.
...
IN=10
OUT=0
...
The OUTUNITS keyword can be used, under [GLOBALS], to define the output level unit
of measure; you may choose either V, dBV or dBu; default is dBu. To output 1V simply
write:
[GLOBALS]
OUTUNITS=V
...
OUT=1
...
If you feed the output to a power amplifier the resulting signal at amplifier terminals will
be amplified by the gain of the amplifier. It is possible to take this effect into account
and specify the output level directly at the amplifier in the particular case you are using
a CLIOQC Amplifier&SwitchBox. The following script can be used to set 2.83V at the
output of the amplifier.
[GLOBALS]
OUTUNITS=V
...
OUTQCBOX=2.83
...
14.8.2 SC-01 DC OUTPUT CONTROL
The SC-01 Signal Conditioner has the capability of superimposing a DC voltage to the
generated signal (see 5.4). It is possible to manage this DC voltage with the DCON and
DCV keywords. The script below sets a 0.5V DC at SC-01 channel A output.
[PERFORM]
DCV=0.5
DCON=1
If you feed the output of the SC-01 to a DC coupled amplifier the resulting DC voltage,
if present, at amplifier terminals will be amplified by the gain of the amplifier. It is possible
to take this effect into account and specify the DC voltage directly at the amplifier in
the particular case you are using a CLIOQC Amplifier&SwitchBox. The following script
can be used to have 5V DC at the output of the amplifier.
40
Chapter 14 - Quality Control
[PERFORM]
DCVQCBOX=5
DCON=1
14.8.3 CLIOQC AMPLIFIER&SWITCHBOX CONTROL
Using a CLIOQC amplifier&switchbox it is possible to setup powerful QC environment
like the one depicted in the example 6 (see 14.9.6) where it is shown the simultaneous
control of near and far field responses and impedance.
Custom controls have been implemented to easily control all the internal functions of
this unit:
[SETINPUT1]
Selects input 1 of the CLIOQC Ampli&SwitchBox.
[SETINPUT2]
Selects input 2 of the CLIOQC Ampli&SwitchBox.
[SETINPUT3]
Selects input 3 of the CLIOQC Ampli&SwitchBox.
[SETINPUT4]
Selects input 4 of the CLIOQC Ampli&SwitchBox.
[SETINPUT5]
Selects input 5 of the CLIOQC Ampli&SwitchBox.
[SETINPUT6]
Selects input 6 of the CLIOQC Ampli&SwitchBox.
[SETINPUT7]
Selects input 7 of the CLIOQC Ampli&SwitchBox.
[SETINPUT8]
Selects input 8 of the CLIOQC Ampli&SwitchBox.
[SETIMPEDANCE]
[SETISENSE]
Selects impedance mode of the CLIOQC Ampli&SwitchBox.
Selects I Sense mode of the CLIOQC Ampli&SwitchBox.
14.8.4 EXTERNAL TRIGGER
It is possible to trigger the QC tests sequence with an external TTL signal wired to the
PC parallel printer port. This operation is controlled by the External Trigger button
in the QC control panel and by the MANUAL keyword inside the QC script.
Fig.14.41 shows a foot pedal switch and diagrams its connection to the PC to obtain
the control of the QC test.
PC
LPT
Start
Figure 14.41
Chapter 14 - Quality Control
41
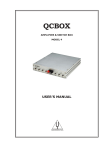
The QCBox Model4 has a dedicated input 'PEDAL IN' that can be used to connect the
external foot pedal or trigger signal.
The following lines are needed inside a script file to enable a switch (or externally
generated TTL signal) to start and continue a QC measurement.
[GLOBALS]
...
...
MANUAL=0
Please refer to 14.8.7 and to the commands reference for more details on TTL input
signal management.
14.8.5 SIGNALS GENERATION
It is possible to define the status of the bits of the active parallel port thus generating
TTL signals controlled by the software; the following is a list of the kind of signals possible:
- signals output at startup (INITIALBITS)
- signals conditioned by the result of a single measure ([IF LAST GOOD], [IF LAST BAD])
- signals conditioned by the global result ([IF ALL GOOD], [IF ALL BAD])
- unconditioned signals ([PERFORM])
Let's see an example of generation of external signals conditioned by the result of the
measurement:
[GLOBALS]
...
...
INITIALBITS=0
[FFT]
...
...
[MLS]
...
...
[IF LAST BAD]
BIT=3
BITVALUE=1
DELAY=200
[IF LAST GOOD]
BIT=3
BITVALUE=0
DELAY=200
[IF ALL GOOD]
BIT=1
BITVALUE=1
[PERFORM]
BIT=0
42
Chapter 14 - Quality Control
BITVALUE=1
DELAY=200
[PERFORM]
8BITVALUE=0
This example defines a signal high on bit 3 if the MLS test performs bad, a signal high
on bit 1 if all the tests are OK and an unconditioned pulse of 200 ms on bit 0 that may
be used to signal the end of the QC test sequence.
Referring to Figure 14.42 we can see the time signal of the three bits in the two possible
cases A and B; in case A the MLS test performed bad and in case B good.
Figure 14.42
In the example shown each single bit of the parallel port was controlled separately by
means of the BIT and BITVALUE keywords; it is also shown how to simultaneously
control the 8 bits with the 8BITVALUE keyword.
In the next example the value of 33 (decimal) is directly output, thus setting bits 0 and
4 to one and all the others to zero.
[PERFORM]
8BITVALUE=33
14.8.6 TIME DELAYS GENERATION
It is possible to define a time delay in any point of a script file with the following definition:
[PERFORM]
DELAY=200
Chapter 14 - Quality Control
43
In this example the QC sequence waits for 200 millisecond when encountering these
keywords. In the previous paragraph you can see also the possibility of mixing time
delays with signals definitions in order to generate pulses.
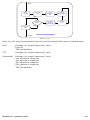
14.8.7 PARALLEL PORT SIGNALS MANAGEMENT
The TTL signals generated with the active parallel printer port of the PC may be
interactively controlled by means of the External Hardware menu recallable with Shiftand you obtain the
F4. After opening this box press the Direct TTL Control button
control panel shown in fig 14.43. To get TTL signals operation please select a parallel
port among the available ones.
Figure 14.43
The Direct TTL Controls dialog lets you set the status of the eight output bits using the
appropriate check boxes while triggering it with the Set Bits button; a decimal
representation of the output binary word is also present. On the left side it is reported
the status of the input start bit.
The pinout of the standard parallel port is shown in fig.14.44; note the eight output bits
and the start trigger pulse in input.
1
14
2
15
3
16
4
17
5
18
6
19
7
20
8
21
9
22
10
23
11
24
12
25
13
BIT 0
BIT 1
BIT 2
BIT 3
BIT 4
BIT 5
BIT 6
BIT 7
START
Figure 14.44
44
Chapter 14 - Quality Control
14.8.6 RS-232 SERIAL PORT CONTROL
During QC execution it is possible to control serial devices, like label printers, connected
via an RS-232 link to your PC. You can select and configure a COM port for QC control
within the File>Setup>QC panel (see 6.3.6).
The following script can be used to print a label at the end of a QC test if the
result of the test is good; the printing commands refer to a Zebra Z4M printer.
[GLOBALS]
OPENSERIAL=1
SERIALMONITOR=1
...
...
...
...
...
...
[IF ALL GOOD]
SERIALOUT=^XA^LH40,100,^F020,10^AD^FD@SERIALNUMBER^FS^XZ
Note the @SERIALNUMBER acronym that is used to output the current serial number.
It is possible to activate, mainly for debugging purposes, a monitor window that echoes
RS-232 activity; to do this use the SERIALMONITOR keyword.
The same text output in the above example could be saved in an ASCII file and loaded
with the SERIALOUTFILE keyword:
...
...
[IF ALL GOOD]
SERIALOUTFILE=SERIAL.TXT
Chapter 14 - Quality Control
45
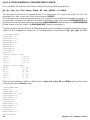
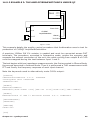
14.9 LEARNING CLIOWIN QC WITH EXAMPLES
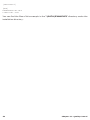
14.9.1 EXAMPLE 1: QC OF A MICROPHONE PREAMPLIFIER
INPUT A
INPUT B
CLIO
OUTPUT A
OUTPUT B
Input
PRE-01
Preamplifier
Output
Figure 14.45
This example is taken form our internal QC procedure for the PRE-01 Microphone
Preamplifier. Figure 14.45 shows the connections required. The PRE-01 features three
weighting filters and two gain positions. This test is a representative case of the following
requirements:
1) The limits are ABSOLUTE as they are taken from the IEC tables for the specified
tolerance. Since the perfect device has still to be build it is not possible to use relative
limits from a real life measured reference.
2) The IEC specifies a response in term of a 0 dB at 1kHz. The absolute level at 1kHz
is however left to the test procedure. As we want to perform the test near the highest
level the device is able of accept, we need to use the PROCESS feature to shift the real
measure to the specs level.
3) Changing in switches position is required during test. We have therefore to use the
INTERACTIVE feature.
4) A level regulation is required to align the gain at 1kHz with and without filter. This brings
in the LOOP feature of the [MET] multimeter test.
5) Its very difficult for the operator to set switch accordingly to the next test to be
performed. The PERFORM and MESSAGE feature greatly simplifies this, avoiding
errors.
The QC script, reported here with comments, allows the check of the filters response
against Type 1 tolerance specification. It also check for +/- 0.2 dB gain tolerance of the
gain switch in both position. As an additional features allows, within the test, to adjust
a variable gain trimmer that has to be settled; this procedure, LOOP, also ends with
a check of the adjusted level to be within +/- 0.2 dB. At every level check a distortion
test, THD defined in the LEV1.LIM file, is performed. As a general rule a QC procedure
is defined from one QC file (.qc extension) and several limits file (.lim extension) declared
in the qc file. Process files (.mpro or .spro) are also involved here and these are the only
ones not specifically QC related. It is a good idea to dedicate a directory for each QC
test. The files involved here are:
PRE01.QC
46
Chapter 14 - Quality Control
LEV1.LIM
A.LIM
B.LIM
C.LIM
ASHIFT.SPRO
You can find them in the '\DATA\EXAMPLE1' directory under the installation directory.
[GLOBALS]
COMPANY=AUDIOMATICA S.R.L. FLORENCE
TITLE=PRE01 TEST PROCEDURE
INTERACTIVE=1
SAVEONBAD=1
[PERFORM]
MESSAGE=FILTER OFF DIP ON OFF OFF OFF
[MET]
OUT=2.44
IN=10
REFERENCE=FILTER.MET
LIMITS=LEV1.LIM
[PERFORM]
MESSAGE=FILTER ON DIP ON OFF OFF OFF
[MET]
OUT=2.44
IN=10
REFERENCE=FILTER.MET
LIMITS=LEV1.LIM
LOOP=1
[PERFORM]
MESSAGE=FILTER ON DIP ON OFF OFF ON
[MET]
OUT=-17.56
IN=10
REFERENCE=FILTER.MET
LIMITS=LEV1.LIM
[SIN]
OUT=-10
IN=10
REFERENCE=A.SIN
LIMITS=A.LIM
PROCESS=ASHIFT.SPRO
[PERFORM]
MESSAGE=FILTER ON DIP OFF ON OFF ON
[SIN]
OUT=-10
IN=10
Chapter 14 - Quality Control
47
REFERENCE=A.SIN
LIMITS=B.LIM
PROCESS=ASHIFT.SPRO
[PERFORM]
MESSAGE=FILTER ON DIP OFF OFF ON ON
[SIN]
OUT=-10
IN=10
REFERENCE=A.SIN
LIMITS=C.LIM
PROCESS=ASHIFT.SPRO
[PERFORM]
MESSAGE=SET DEFAULT SETTINGS FILTER OFF DIP ON OFF OFF ON
48
Chapter 14 - Quality Control
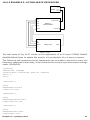
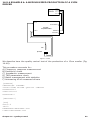
14.9.2 EXAMPLE 2: THE AMPLIFIER&SWITCHBOX UNDER QC
INPUT A
CLIO
INPUT B
OUTPUT A
OUTPUT B
In 1
From CLIO
In 2
CLIOQC
Ampli/SwitchBox
ISense
D.U.T.
To CLIO
10 Ohm 1%
Figure 14.46
This example details the quality control procedure that Audiomatica uses to test its
production of CLIOQC Amplifier&Switchbox.
A precision 10Ohm 2W 1% resistor is needed and must be connected across DUT
terminals. The procedure, executed in Interactive mode, guides the operator and
requests the manual connection of the unit; the cable coming from output B of CLIO
must be swapped during the test between input 1 and 2.
The test begins with two impedance measurements, the first executed in ISense Mode,
the second executed in Internal Mode. Then it is performed a THD measurement with
FFT and finally the frequency response of each input channel.
Note the keywords used to alternatively mute CLIO's output.
[GLOBALS]
COMPANY=AUDIOMATICA S.R.L. FLORENCE
TITLE=QCBOX TEST PROCEDURE
INTERACTIVE=1
[PROMPT]
MESSAGE=CONNECT:
MESSAGE2=[OUTA->FROM
CLIO][INA->TO
CLIO][OUTB->CH1][INB->ISENSE]
[PROMPT]
MESSAGE=PLACE 10 OHM 1% RESISTOR ACROSS D.U.T. TERMINALS
[SETIMPEDANCE]
[SETMUTEB]
[PERFORM]
DELAY=500
[SIN]
Chapter 14 - Quality Control
49
OUT=0
IN=-20
REFERENCE=IMPEDANCE.SINI
LIMITS=IMPEDANCE.LIM
[SETINPUT1]
[PERFORM]
DELAY=500
[SIN]
OUT=10
IN=-20
REFERENCE=ISENSE.SINI
LIMITS=IMPEDANCE.LIM
[FFT]
OUT=10.0
IN=-10
ACQUISITIONDELAY=200
REFERENCE=FFT.FFT
LIMITS=FFT.LIM
[RESETMUTEB]
[SETMUTEA]
[PERFORM]
DELAY=500
[SIN]
OUT=10
IN=10
REFERENCE=CH.SIN
LIMITS=CH.LIM
[PROMPT]
MESSAGE=CONNECT:
MESSAGE2=[OUTB -> CH2]
[SETINPUT2]
[PERFORM]
DELAY=500
[SIN]
REFERENCE=CH.SIN
LIMITS=CH.LIM
[RESETMUTEA]
You can find the files of this example in the '\DATA\EXAMPLE2' directory under the
installation directory.
50
Chapter 14 - Quality Control
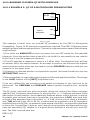
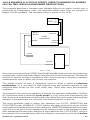
14.9.3 EXAMPLE 3: A FOUR-WAYS CROSSOVER
INPUT A
CLIO
INPUT B
OUTPUT A
OUTPUT B
In 1
From CLIO
In 2
MODEL 3
Ampli/SwitchBox
In 3
In 4
To CLIO
D.U.T.
Hi
Mid
MidLo
4 Ways Xover
Input
Lo
Figure 14.47
The test setup of Fig.14.47 shows us the application of an 8 input CLIOQC Model3
Amplifier&Switchbox to assess the quality of a production of a 4-ways crossover.
The following self-explaining script implements the procedure required to tests the
frequency response of each way; to be noted are the unique input and output settings
under [GLOBALS].
[GLOBALS]
COMPANY=MY COMPANY
TITLE=4-WAYS CROSSOVER QUALITY CONTROL
OUT=0.0
IN=10
[SETINPUT1]
[MLS]
REFERENCE=LO.MLS
LIMITS=LO.LIM
[SETINPUT2]
[MLS]
REFERENCE=MIDLO.MLS
LIMITS=MIDLO.LIM
[SETINPUT3]
[MLS]
REFERENCE=MID.MLS
LIMITS=MID.LIM
Chapter 14 - Quality Control
51
[SETINPUT4]
[MLS]
REFERENCE=HI.MLS
LIMITS=HI.LIM
You can find the files of this example in the '\DATA\EXAMPLE3' directory under the
installation directory.
52
Chapter 14 - Quality Control
14.9.4 EXAMPLE 4: A MEDIUM SIZED PRODUCTION OF A 13CM
DRIVER
INPUT A
CLIO
INPUT B
OUTPUT A
OUTPUT B
In 1
From CLIO
CLIOQC
Ampli/SwitchBox
ISense
D.U.T.
To CLIO
Mic
Speaker
Figure 14.48
We describe here the quality control test of the production of a 13cm woofer (Fig.
14.48).
This procedure accounts for:
A) Frequency response measurement
B) Sensitivity check
C) Impedance measurement
D) T&S parameters check
E) Batch management with statistics
F) Autosaving of all measured drivers
[GLOBALS]
COMPANY=MY COMPANY
TITLE=133MM DRIVER QUALITY CONTROL
AUTOBATCH=1
STATISTICS=1
AUTOSAVE=1
[SETINPUT1]
[SIN]
OUT=0.0
IN=10
REFERENCE=RESPONSE.SIN
LIMITS=RESPONSE.LIM
Chapter 14 - Quality Control
53
[SETISENSE]
[SIN]
OUT=0.0
IN=10
REFERENCE=IMPEDANCE.SINI
LIMITS=IMPEDANCE.LIM
Inside the 'RESPONSE.LIM' file we find the section defining the sensitivity check.
[LEVEL]
UPPER=3
LOWER=-3
Inside the 'IMPEDANCE.LIM' file we find the section defining the T&S parameters
check; with the KNOWNMMD keyword we implements the simplified estimation
method fixing the driver's mass value. The parameters tested are Fs, Qts, Vas, Bl, Cms
and Zmin.
[TSPARAMETERS]
REDC=3
DIAMETER=133
KNOWNMMD=19.75
FSUPPER=55
FSLOWER=45
QTSUPPER=0.6
QTSLOWER=0.3
BLUPPER=7
BLLOWER=5
ZMINUPPER=5
ZMINLOWER=3
VASUPPER=13
VASLOWER=10
CMSUPPER=0.6
CMSLOWER=0.3
You can find the files of this example in the '\DATA\EXAMPLE4' directory under the
installation directory.
54
Chapter 14 - Quality Control
14.9.5 EXAMPLE 5: A LARGE SIZED PRODUCTION OF A 2CM
TELEPHONE DRIVER
CLIO
Out
In
Personal Computer
LPT Bit 6
Bit 7
PASS/FAIL
READY
START
PRODUCTION LINE
AUTOMATION
GOOD
BAD
Figure 14.49
We describe here the quality control test of the production of a 2cm telephone driver.
The test setup, in Fig. 14.49, shows us a fully automatic test environment where CLIO
is interacting with a production line automation controller.
The automatic interaction is instructed with the MANUAL keyword which tells the QC
processor to start when triggered by the external automation; on the other end the
signals generated by CLIO tell to the automation controller the result of the test and
the ready status.
[GLOBALS]
MANUAL=0
INITIALBITS=0
OUT=-3.0
IN=10
[MLS]
REFERENCE=RESPONSE.MLS
LIMITS=RESPONSE.LIM
POLARITY=1
[IF ALL GOOD]
Chapter 14 - Quality Control
55
BIT=7
BITVALUE=0
[IF ALL BAD]
BIT=7
BITVALUE=1
[PERFORM]
DELAY=1000
BIT=7
BITVALUE=0
[PERFORM]
BIT=6
BITVALUE=1
[PERFORM]
DELAY=1000
BIT=6
BITVALUE=0
You can find the files of this example in the '\DATA\EXAMPLE5' directory under the
installation directory.
56
Chapter 14 - Quality Control
14.9.6 EXAMPLE 6: A CYCLIC SCRIPT (USED TO MANAGE MY ROGERS
LS3/5A TWO-WAYS LOUDSPEAKER PRODUCTION)
This example describes a hardware and software setup to do quality control over a
production of loudspeakers units; the responses taken come from our samples of
Rogers LS3/5A speakers. The hardware setup is shown in Fig.14.50
INPUT A
CLIO
INPUT B
OUTPUT A
OUTPUT B
Mic No 1
Mic No 2
From CLIO
CLIOQC
Ampli/SwitchBox
ISense
Speaker
To CLIO
far field
near field
Figure 14.50
As you can see we employ a CLIOQC Amplifier&SwitchBox that connects two measuring
microphones, one for near field response and the other for far field response. The internal
switcher is used to configure impedance with current sensing or frequency response
measurements and to select the correct microphone.
The quality control of such a production relies on what is called a reference
loudspeaker i.e. a unit which is kept aside the line and retested regularly to give
reference data curves for the units under test. These data trace environmental
conditions.
To accomplish the recurrent operation of testing the reference loudspeaker CLIOwin
QC implements what is called the cyclic script i.e. a QC script that is launched by the
main script on a timed basis and executed once. When the cyclic script is launched the
operator is prompted and the reference unit must be placed on the line.
The three keywords used to define this operation are CYCLIC, REPETITION and
CYCLICFIRST under [GLOBALS]. CYCLIC defines the name of the cyclic script; this file
must reside in the same directory of the calling one. REPETITION defines after how many
units it is run; we put 4 in the example only for letting you test it, this number is chosen
after evaluating the particular condition of the production line. CYCLICFIRST, which in
the example is commented away, tells the software to execute the cyclic script before
Chapter 14 - Quality Control
57
the first run of the main script; this is useful to set known conditions at the beginning
of a QC session.
[GLOBALS]
CYCLIC=ROGERSCYCL.QC
;CYCLICFIRST=1
REPETITION=4
OUT=0
IN=-20
The rest of the main script for producing my LS3/5As deals with the three actual
measurements for testing nearfield, farfield and impedance data; the first two are done
with MLS, the third with Sinusoidal. Before each measurement definition the relative
commands that set the correct function of the Amplifier&SwitchBox; note that the
impedance is done in 'ISense' mode.
[SETINPUT2]
[MLS]
REFERENCE=NEARFIELD.MLS
LIMITS=NEARFIELD.LIM
[SETINPUT1]
[MLS]
REFERENCE=FARFIELD.MLS
LIMITS=FARFIELD.LIM
[SETISENSE]
[SIN]
OUT=-6.0
IN=-30
REFERENCE=IMPEDANCE.SINI
LIMITS=IMPEDANCE.LIM
The main QC script end here. It is a fairly simple one, that can be customized for any
production of loudspeaker. Let's now see the cyclic script. The basic idea is to execute
the same measurements as in the main script and save them with the names of the
reference files for the main script itself. AUTOSAVE=1 prepares for saving all the
measurements done; SAVEFOLDER= is a particular syntax to set the script directory
as the current one.
[GLOBALS]
AUTOSAVE=1
SAVEFOLDER=
OUT=0
IN=-20
The rest of the cyclic script resembles the main script with the difference that, after each
measurement, we define the name of the file to be saved and force it to be equal to
the name of the reference file; in this way the reference file itself is updated.
SAVEPROMPT=1 instructs the QC processor to prompt for user acceptance of the save
operation; this is useful for validating the procedure and avoiding errors.
[SETINPUT2]
58
Chapter 14 - Quality Control
[MLS]
REFERENCE=NEARFIELD.MLS
LIMITS=NEARFIELD.LIM
SAVENAME=NEARFIELD
SAVEPROMPT=1
[SETINPUT1]
[MLS]
REFERENCE=FARFIELD.MLS
LIMITS=FARFIELD.LIM
SAVENAME=FARFIELD
SAVEPROMPT=1
[SETISENSE]
[SIN]
OUT=-6.0
IN=-30
REFERENCE=IMPEDANCE.SINI
LIMITS=IMPEDANCE.LIM
SAVENAME=IMPEDANCE
SAVEPROMPT=1
You can find the files of this example in the '\DATA\EXAMPLE6' directory under the
installation directory.
Chapter 14 - Quality Control
59
14.10 QC SCRIPT SYNTAX REFERENCE
14.10.1 KEYWORDS FOR GENERAL SETTINGS
NOTE: "SCRIPTDIR" means the directory where the QC script is saved.
[GLOBALS]
Starts a section containing settings and definitions valid for the whole test
sequence.
AUTOBATCH
=1 Enables automatic batch naming. The name of the production batch is
set equal to the current name of the folder where the QC script is saved
(SCRIPTDIR).
=0 Does not perform autobatch. If omitted defaults to 0.
AUTOSAVE =1 Autosaves all measurements. Applies to all measurements.
=0 Does not perform autosave. If omitted defaults to 0.
BATCH
Name of the production batch. See also AUTOBATCH and SAVEFOLDER.
CYCLIC
Name of the cyclic script. The cyclic script is executed every REPETITION
times instead of the actual script. All measurements executed inside the
cyclic script do not take part in production report, batch management and
serial numbering. See also CYCLICFIRST.
CYCLICFIRST
=1 Executes the cyclic script before executing the QC test itself.
If omitted defaults to 0 i.e. no cyclic script executed first.
Refer also to CYCLIC and REPETITION for defining the cyclic script behavior.
COMPANY Text used as the first title of the QC control panel. Usually the company
name.
DCON
=1 sets DC voltage superimposed to channel A output active.
=0 sets DC voltage to 0.
If omitted defaults to 0.
DCV
Value of output DC voltage to be set (see DCON).
DCVQCBOX
Value of output voltage to be set (see DCON) taking into account QCBox
gain. This is the DC voltage that will be present at QCBox output..
DELAY
Value in milliseconds of a pause to be performed.
DISPLAY
=1 displays the result of each measurement.
=0 executes all the measurements without displaying.
If omitted defaults to 0 i.e. NOT DISPLAY.
DISPLAYONBAD
=1 displays the measurement if bad. Applies to all the measurements.
=0 Not active. If omitted defaults to 0.
DISPLAYTIME
Approximate time of display (in ms) when in DISPLAY mode.
60
Chapter 14 - Quality Control
IN
Sets the input sensitivity; if omitted autorange is activated.
INITIALBITS
8-BIT binary value that will be output at startup before QC script execution.
INCREASEONBAD
=1 Increases serial number when unit is bad.
=0 Does not increase serial number when unit is bad.
If omitted defaults to 1 i.e. increases on bad.
INTERACTIVE
=1 displays the result of each measurement and prompts.
=0 executes all the measurements without prompting.
If omitted defaults to 0 i.e. NOT INTERACTIVE.
MANUAL
=1 starts the QC sequence manually (pressing Go).
=0 the sequence is started by an external trigger signal.
If omitted defaults to 1 i.e. MANUAL.
MESSAGEONBAD
Text to be displayed when unit performs bad.
If omitted defaults to 'BAD'
MESSAGEONGOOD
Text to be displayed when unit performs good.
If omitted defaults to 'GOOD'
OPENSERIAL
Opens the QC COM port for serial communication. See 6.3.6 for RS-232
settings. See also SERIALMONITOR.
OUT
Sets the generator output level (with OUTUNITS defined under [GLOBALS]).
OUTQCBOX
Sets the generator output level taking into account QCBox gain (with
OUTUNITS defined under [GLOBALS]). This is the level that will be present
at QCBox output.
OUTUNITS Sets the unit of measure of the output level. It is possible to set dBu, dBV
or V.
If omitted defaults to dBu.
PHANTOM =1 Switches phantom power supply on.
=0 Switches phantom power supply off. If omitted defaults to 0.
Valid trough all the QC test sequence.
PROMPTFORGOOD
=1 Prompts when unit is bad for user acceptance and overrides result.
=0 No prompt when unit is bad.
If omitted defaults to 0 i.e. no prompt.
REPETITION
Number representing the frequency of execution of the cyclic script.
SAVEBINARY
=1 saves also in binary format if SAVETEXT=1. Ignored if used alone. Applies
Chapter 14 - Quality Control
61
to all the measurements. If omitted defaults to 0. Remember that if neither SAVETEXT nor SAVEBINARY are specified the default format is binary.
SAVEFOLDER
Forces the name of the autosave directory.
If omitted the default autosave directory is SCRIPTDIR\AUTOSAVE if no
batch name is defined, otherwise it is SCRIPTDIR\BATCH where BATCH is
the name of production batch.
If you desire to save files in the script directory itself use the particular syntax
"SAVEFOLDER=" i.e. leave blank the right part.
SAVEONGOOD
=1 Autosaves all measurements, if global result is good. Applies to all
measurements.
=0 Does not perform autosave. If omitted defaults to 0.
If you want to autosave also in case of bad measurement add the keyword
SAVEONBAD=1 under [GLOBALS].
SAVEONBAD
=1 Autosaves all measurements, if global result is bad. Applies to all the
measurements.
=0 Not active. If omitted defaults to 0.
Refer also to SAVEONGOOD and AUTOSAVE.
SAVETEXT =1 saves ASCII file instead of binary format. Applies to all the measurements.
=0 saves files with normal binary format. If omitted defaults to 0.
SERIALMONITOR
=1 Activates the RS-232 monitor panel during QC execution.
=0 Does not activate the RS-232 monitor panel. If omitted defaults to 0.
STARTSIGLOGIC
Defines the logic of the external trigger signal.
=1 is active high.
=0 is active low.
If omitted defaults to 0 i.e. active low.
STATISTICS
=1 Enables statistical data files generation.
=0 Disables statistical data files generation. If omitted defaults to 0.
STATFILESRES
Number of data lines present in statistical frequency files; maximum is 2048.
TITLE
Text used as the second title of the QC control panel. Usually a description
of the test.
WYSIWYG =1 Enables wysiwyg processing.
=0 Disables wysiwyg processing. If omitted defaults to 0.
62
Chapter 14 - Quality Control
14.10.2 KEYWORDS FOR MEASUREMENTS SETTINGS
[FFT]
Starts a section containing the definition of an FFT measurement.
[MLS]
Starts a section containing the definition of an MLS measurement.
[SIN]
Starts a section containing the definition of a Sinusoidal measurement.
[MET]
Starts a section containing the definition of a Multimeter measurement.
ACQUISITIONDELAY
Approximate time in milliseconds that is expected before executing the
measurement after switching the generator on. Valid only for FFT and
Multimeter measurements.
COMMENT Input a comment used by the report files.
DCON
=1 sets DC voltage superimposed to channel A output active.
=0 sets DC voltage to 0.
If omitted defaults to 0.
DCV
Value of output DC voltage to be set (see DCON).
DCVQCBOX
Value of output voltage to be set (see DCON) taking into account QCBox
gain. This is the DC voltage that will be present at QCBox output..
DISPLAYONBAD
=1 displays the measurement if bad.
=0 Not active. If omitted defaults to 0.
IN
Sets the input sensitivity; if omitted autorange is activated.
LIMITS
Name of the limits file.
LOOP
=1 Loops the current Multimeter measurement to let the user perform an
adjustment on the unit under test.
=0 Executes the Multimeter measurement and exits.
If omitted defaults to 0.
MODE
=DIFFERENCE Executes the measurement referring it to the reference file.
Valid only for MLS and Sinusoidal measurements.
=NORMAL Executes the measurement normally.
If omitted defaults to NORMAL
OUT
Sets the generator output level (with OUTUNITS defined under [GLOBALS]).
OUTQCBOX
Sets the generator output level taking into account QCBox gain (with
OUTUNITS defined under [GLOBALS]). This is the level that will be present
at QCBox output.
POLARITY =1 Executes a polarity check. Valid only for an MLS measurement.
=0 Not Active. If omitted defaults to 0.
PROCESS Name of a process file to be applied to the test. Valid only for MLS and
Sinusoidal measurements.
Chapter 14 - Quality Control
63
REFERENCE
Name of the reference file.
SAVEBINARY
=1 saves also in binary format if SAVETEXT=1. Ignored if used alone.
If omitted defaults to 0. Remember that if neither SAVETEXT nor SAVEBINARY
are specified the default format is binary.
SAVENAMEName of the file to be saved.
SAVEONBAD
=1 automatically saves the current measurement if bad.
=0 Not active. If omitted defaults to 0.
Refer also to AUTOSAVE.
SAVEONGOOD
=1 Autosaves the current measurements, if result is good.
=0 Does not perform autosave. If omitted defaults to 0.
If you want to autosave also in case of bad measurement add the keyword
SAVEONBAD=1.
SAVEPROMPT
=1 Prompts the user for file name input.
=0 Autosaves without prompting.
If omitted defaults to 0.
SAVETEXT =1 saves ASCII file instead of binary format.
=0 saves files with normal binary format. If omitted defaults to 0.
SAVETEXTPARAM
Controls the number of saved frequency points (valid only for MLS)
=0 saves 256 points.
=1 saves 512 points.
=2 saves 1024 points.
=3 saves 2048 points.
If omitted defaults to 0, i.e. 256 points.
64
Chapter 14 - Quality Control
14.10.3 KEYWORDS FOR CONDITIONAL EXECUTION
[PERFORM]
Starts a section always executed, unconditioned by the result of the
preceding measurement. See below for the keywords possible within.
[IF LAST GOOD]
[IF LAST BAD]
Starts a section conditioned by the result of the preceding measurement.
[IF ..parameter.. GOOD]
[IF ..parameter.. BAD]
Starts a section conditioned by the result of one particular parameter
measured during the preceding measurement.
..parameter.. can be one of the following:
2HARMONIC
3HARMONIC
4HARMONIC
5HARMONIC
FREQUENCY
FS
IMD
LEVEL
POLARITY
QTS
QES
QMS
RESPONSE
PRESSURE
THD
VOLTAGE
[IF ALL GOOD]
[IF ALL BAD]
Starts a section conditioned by the global result of the QC sequence.
Note: The following keywords apply to any kind of section for conditional execution.
BIT
BITVALUE
8BITVALUE
ABORT
Number of the bit to be singularly controlled with "BITVALUE".
Status (=1 or =0) of the bit defined with "BIT".
8-BIT decimal value to be output by the currently selected parallel port..
Stops the script execution after executing all keywords in the current
section. Result is forced bad. See also STOP.
CLOSESERIAL
Closes the QC COM port after serial communication.
Chapter 14 - Quality Control
65
DCON
=1 sets DC voltage superimposed to channel A output active.
=0 sets DC voltage to 0.
If omitted defaults to 0.
DCV
Value of output DC voltage to be set (see DCON).
DCVQCBOX
Value of output voltage to be set (see DCON) taking into account QCBox
gain. This is the DC voltage that will be present at QCBox output..
DELAY
Value in milliseconds of a pause to be performed.
EXPORTGRAPHICS
Exports the current measurement to a graphical file. The same file naming
convention used for data files is used.
EXTERNAL Name of an executable file to be launched. See also PARAMETERS and
WAITCOMPLETION.
IN
Sets the input sensitivity; if omitted autorange is activated.
MESSAGE Text to be displayed in a prompting message to the user.
MESSAGE2Second line of text to be displayed in a prompting message to the user.
MESSAGE3Third line of text to be displayed in a prompting message to the user.
MESSAGE4Fourth line of text to be displayed in a prompting message to the user.
OPENSERIAL
Opens the QC COM port for serial communication. See 6.3.6 for RS-232
settings.
OUT
Sets the generator output level (with OUTUNITS defined under [GLOBALS]).
OUTQCBOX
Sets the generator output level taking into account QCBox gain (with
OUTUNITS defined under [GLOBALS]). This is the level that will be present
at QCBox output.
PARAMETER1
String to be passed, as first parameter, to the executable defined with
"EXTERNAL". Some parameters relative to the QC tests can be passed with
the following acronyms:
@SERIALNUMBER passes the current serial number.
@RESULT passes the current result.
@LASTRESULT passes the last test result.
@GLOBALRESULT passes the global test result.
PARAMETER2
String to be passed, as second parameter, to the executable defined with
"EXTERNAL". See also PARAMETER1 above.
PARAMETER3
String to be passed, as third parameter, to the executable defined with
"EXTERNAL". See also PARAMETER1 above.
66
Chapter 14 - Quality Control
PARAMETER4
String to be passed, as fourth parameter, to the executable defined with
"EXTERNAL". See also PARAMETER1 above.
PRINT
Prints the current measurement. The default Windows printer is used.
SERIALOUT
ASCII text to be sent to serial device.
You may use some acronyms preceded by @:
@SERIALNUMBER is translated in the current serial number
@DATE is translated in the current date
@TIME is translated in the current time
SERIALOUTFILE
Name of an ASCII file containing text to be sent to serial device.
STOP
Stops the script execution after executing all keywords in the current
section. Result is unaltered. See also ABORT.
WAITCOMPLETION
=1 The QC script wait for the external program to end before continuing
execution.
=0 The QC sequence continue without waiting. If omitted defaults to 0.
Chapter 14 - Quality Control
67
14.10.4 KEYWORDS FOR HARDWARE CONTROL
[RESETLOOPA]
Opens internal loop on channel A. Valid only for CLIOwin running PB-4281
PCI card and SC-01 signal conditioner.
[RESETLOOPB]
Opens internal loop on channel B. Valid only for CLIOwin running PB-4281
PCI card and SC-01 signal conditioner.
[RESETMUTEA]
Switches mute for channel A off.
[RESETMUTEB]
Switches mute for channel B off.
[RESETPHANTOM]
Switches phantom power off.
[SETIMPEDANCE]
Selects impedance mode of the CLIOQC Amplifier&SwicthBox.
[SETINPUT1]
[SETINPUT2]
[SETINPUT3]
[SETINPUT4]
[SETINPUT5]
[SETINPUT6]
[SETINPUT7]
[SETINPUT8]
Selects the relative input channel of the CLIOQC Amplifier&SwicthBox.
[SETISENSE]
Selects isense mode of the CLIOQC Amplifier&SwicthBox.
[SETLOOPA]
Closes internal loop on channel A. Valid only for CLIOwin running PB-4281
PCI card and SC-01 signal conditioner.
[SETLOOPB]
Closes internal loop on channel B. Valid only for CLIOwin running PB-4281
PCI card and SC-01 signal conditioner.
[SETMUTEA]
Switches mute for channel A on.
[SETMUTEB]
Switches mute for channel B on.
[SETPHANTOM]
Switches phantom power on.
68
Chapter 14 - Quality Control
14.10.5 OTHER KEYWORDS
[SNINPUT]
Prompts the user for serial number input.
[STOP]
Immediately stops the script execution.
Chapter 14 - Quality Control
69
14.10.6 KEYWORDS USED IN LIMITS FILES
[ABSOLUTE]
Defines an absolute limit file. This is also the default condition when the
[RELATIVE] keyword is not specified.
[FLOATING]
If present forces floating limits curves.
[RELATIVE]
Defines a relative limit file.
[LEVEL]
Starts a section defining a check on the sensitivity of the measured curve.
ALIGNFREQ
Align frequency for the sensitivity check. Valid only when ALIGNLEV is
specified and it is not ALIGNLEV=REFERENCE. See below.
ALIGNLEV Align level for the sensitivity check. If it is specified "ALIGNLEV=REFERENCE"
then the sensitivity check is against the average level of the reference in the
band defined by the frequency mask used for the response check.
If omitted defaults to ALIGNLEV=REFERENCE.
LOWER
Lower limit for the sensitivity check.
UPPER
Upper limit for the sensitivity check.
[TSPARAMETERS]
Starts a section defining a Thiele&Small parameters check.
REDC
Value (in Ohms) to be input representing the DC resistance of the voice coil.
REDC must always be specified.
DIAMETER Input value (in mm) specifying the driver diameter. It is needed only when
testing Cms, Mms, Mmd, Bl, Vas, dBSPL or ZMin; used with one of the fixed
parameters: KNOWNMMD or KNOWNMMS or KNOWNCMS. You must
specify only one fixed parameter.
KNOWNMMD
Input value for the fixed Mmd parameter. It is needed only when testing
Cms, Mms, Mmd, Bl, Vas, dBSPL or ZMin.
KNOWNMMS
Input value for the fixed Mms parameter. It is needed only when testing
Cms, Mms, Mmd, Bl, Vas, dBSPL or ZMin.
KNOWNCMS
Input value for the fixed Cms parameter. It is needed only when testing Cms,
Mms, Mmd, Bl, Vas, dBSPL or ZMin.
FSLOWER Lower limit for Fs.
FSUPPER
Upper limit for Fs.
QELOWER Lower limit for Qes.
QEUPPER Upper limit for Qes.
70
Chapter 14 - Quality Control
QMLOWER Lower limit for Qms.
QMUPPER Upper limit for Qms.
QTLOWER Lower limit for Qts.
QTUPPER Upper limit for Qts.
CMSLOWER
Lower limit for Cms.
CMSUPPER
Upper limit for Cms.
MMSLOWER
Lower limit for Mms.
MMSUPPER
Upper limit for Mms.
MMDLOWER
Lower limit for Mmd.
MMDUPPER
Upper limit for Mmd.
BLLOWER Lower limit for Bl.
BLUPPER
Upper limit for Bl.
VASLOWER
Lower limit for Vas.
VASUPPER
Upper limit for Vas.
DBSPLLOWER
Lower limit for dBSPL.
DBSPLUPPER
Upper limit for dBSPL.
ZMINLOWER
Lower limit for ZMin.
ZMINUPPER
Upper limit for ZMin.
[UPPER LIMIT DATA]
[LOWER LIMIT DATA]
Start a section containing the frequency mask used for the QC check. The
frequency mask has to be defined as a list of N couples like:
Frequency_1
......
......
Chapter 14 - Quality Control
Value_1
71
Frequency_N
Value_N
In the case of a multimeter measurement contains several measured
parameters value.
It is possible to load frequency data from an external ASCII text file using
the FILE keyword.
FILE
Name of a text file containing a frequency mask definition.
FREQUENCY
Executes a frequency check. Valid for a multimeter measurement.
IMD
Executes an intermodulation distortion check. Valid for a multimeter
measurement.
PRESSURE Executes a sound pressure level check. Valid for a multimeter measurement.
THD
Executes a total harmonic distortion check. Valid for a multimeter measurement.
VOLTAGE Executes a voltage check. Valid for a multimeter measurement.
[2 UPPER LIMIT DATA]
[2 LOWER LIMIT DATA]
[3 UPPER LIMIT DATA]
[3 LOWER LIMIT DATA]
[4 UPPER LIMIT DATA]
[4 LOWER LIMIT DATA]
[5 UPPER LIMIT DATA]
[5 LOWER LIMIT DATA]
Start a section containing the frequency mask used for the QC check of the
single harmonics of a sinusoidal frequency sweep. The presence of the
relative section defines the QC check.
The frequency mask has to be defined as a list of N couples like:
Frequency_1
......
......
Frequency_N
Value_1
Value_N
It is possible to load frequency data from an external ASCII text file using
the FILE keyword.
FILE
72
Name of a text file containing a frequency mask definition.
Chapter 14 - Quality Control
[REFERENCE DATA]
Start a section containing the frequency response used as reference; if
present substitute data taken from the reference file (as defined in 14.3).
The frequency mask has to be defined as a list of N couples like:
Frequency_1
......
......
Frequency_N
Value_1
Value_N
It is possible to load frequency data from an external ASCII text file using
the FILE keyword.
FILE
Name of a text file containing a frequency mask definition.
Chapter 14 - Quality Control
73
74
Chapter 14 - Quality Control