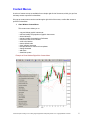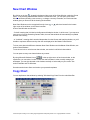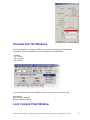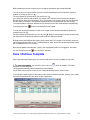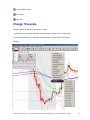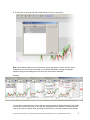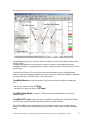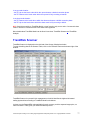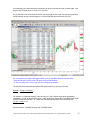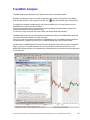
1
TRADE INTERCEPTOR CHARTING 4.0
USER MANUAL
Trade Interceptor Charting 4.0 is a trading support application developed by Riflexo Ltd - Copyright ©Riflexo Ltd 2009
1
Welcome to Trade Interceptor Charting 4.0 help file
This help file has been created to give you a fast understanding of what's possible with Trade
Interceptor Charting 4.0 in order to get you started right away. It offers a full screen shot-based
explanation of each application’s functionality.
In the "how to" section below, you will learn how to use the most important features and trading
techniques provided by Trade Interceptor Charting 4.0 through simple step by step instructions.
Before you go through this printable version of Trade Interceptor Charting 4.0 Help, we
recommend you take a look at our Quick Tour, which is available from the Online Help version. You’ll
very quickly understand how the application works by clicking on the image areas of both the
Charting Window and the Quotes & Analysis Window.
To get you to speed quickly, we highly recommend that you take a look at our self-running video
demos, where the most important functionalities and techniques are explained in a few steps. You
can have access to the demos while using the application, either by selecting "Help>Contents" from
the application Menu Bar
Trade Interceptor Charting 4.0 is a trading support application developed by Riflexo Ltd - Copyright ©Riflexo Ltd 2009
2
CONTENT
APPLICATION OVERVIEW
The Chart Window
The Quotes & Analytics Window
Context Menus
Workspace Management
Online Help Menu
QUOTES
Streaming Quotes Table
Add Securities
Find Securities
Remove securities
Save Quote List
Table Management
Sort Tables
Resize tables
Create charts from quote table
Advanced quotes
CHARTS
Chart Windows
Caption Bar
Menu Bar
Fixed Toolbar
Charts area / Charts panes
Charts icons bar
Info Bar
Icons definitions
Create / Open a chart
Default Chart
Chart axis
Set Software to Local Time
Securities Window
New chart window
Copy chart
Compare Charts
Cascade and Tile windows
Lock/Unlock chart windows
Save / Retrieve templates
Rename / Delete templates
Change chart type
Change timescale
Chart and data visualization options
Cross cursor
Vertical cursor
Show last price barrier line
Zoom In / Zoom Out
Selective zoom
Timescale Up/Timescale Down
Scroll chart back and forth
Scroll to last bar
Move chart
Fit chart in window
Trade Interceptor Charting 4.0 is a trading support application developed by Riflexo Ltd - Copyright ©Riflexo Ltd 2009
6
6
7
8
12
12
13
13
14
14
15
16
16
16
17
17
18
19
19
20
20
21
22
23
24
25
26
27
28
28
30
31
31
32
33
33
34
35
35
36
37
38
38
39
39
40
40
40
41
41
41
3
Resize / Enlarge chart panes
Resize / Enlarge / Close indicators panes
Data Values Window / Table
Print Chart
GRAPHIC TOOLS, STUDIES AND OBJECTS
Change tools, studies and objects properties
Graphic tools
Trend Lines
Extend Trend Lines
Support and Resistance Lines
Vertical Time Lines
Lines and support
Regression Lines and Channels
Remove Graphic Objects
Graphic Studies
Fibonacci Retracements
Fibonacci Arcs
Fibonacci Target
Fibonacci Time Zones
Gann Fans
Gann Angle Lines
Gann Lines
Graphic Objects
Add Buy and Sell Signals
Add Text
Add Rectangle
Add Ellipse
Add Triangle
Add Arrow Line
Add Segment
INDICATORS
Indicators List
Add Indicators
Remove indicators
Change indicators properties
Copy indicators
TRENDRISK ANALYTICS
TrendRisk Analytics
TrendRisk Indicator
TrendRisk Scanner
TrendRisk Analysis
Add Alarm
TRADING
42
42
43
44
44
44
44
45
46
46
47
48
50
52
52
53
54
56
57
58
59
60
61
61
62
63
64
65
66
67
69
69
70
72
73
73
75
75
75
77
80
82
83
Paper Account Management
Paper Trading Control Panel
83
Trading Intelligence
Paper Trading in the Past
84
86
Trade Interceptor Charting 4.0 is a trading support application developed by Riflexo Ltd - Copyright ©Riflexo Ltd 2009
4
CUSTOMIZE APPLICATION
General User Preferences
Color Preferences
Chart Grid Options
Screen style
Personalize Fixed Icons Bar
Messages
EXIT APPLICATION
Exit application
Trade Interceptor Charting 4.0 is a trading support application developed by Riflexo Ltd - Copyright ©Riflexo Ltd 2009
91
92
94
96
96
98
98
98
5
APPLICATION OVERVIEW
Trade Interceptor Charting 4.0 is a new generation trading support station which gives you access to
multi-feed market data.
It gives you the opportunity to use exclusive analytics such as TrendRisk, used by professional
traders, which are supplied with full training support. It also offers full integration to excel for endless
real-time and history calculation.
Furthermore, you don't need to burden your PC with another heavy download: the application resides
on the server side. This also gives you the fastest connection to market data, together with the
possibility to have access to the program from any PC in the world, through an internet connection.
All your preferred templates and preferences will always be there, as they are saved on the server
side.
Once you've logged in, you will have access to all the application's functionalities through 2 main
windows:
- Chart Window
- Quotes & Analytics window
The Chart Window:
Chart windows gives you access to all the charting functionalities (see Chapter: Charts).
Trade Interceptor Charting 4.0 is a trading support application developed by Riflexo Ltd - Copyright ©Riflexo Ltd 2009
6
To see how to open a new chart window and to learn about the difference between the Master Chart
Window and New Chart Windows, see section Chart Windows.
The Quotes & Analytics Window:
The Quotes & Analytics Window gives you access to a series of tabs and table management
functionalities. It allows you to save and manage your personal configurations, access the real-time
quotes list functionalities, TrendRisk scanner functionalities, TrendRisk Analysis and the interactive
pointer-driven Chart Values table, Alarms module, Advanced Quotes, Data Values table.
- The Streaming Quotes table allows you to monitor real-time streaming market prices
- TrendRisk Scanner table allows you to know TrendRisk Risk/Reward ratio associated to each
currency, and the expected target expected for each timescale. The system also gives you
recommended Stop levels
- TrendRisk tab provides you with ongoing market commentaries and forecasts for each currency
- The interactive Data Values table helps you read chart data values through the help of your mouse
pointer.
- Alarms tab allows you to enter various and sophisticated alarms for each currency you want
- Advanced Quotes allows to visualize (and detach) quote windows with more data in them as well as
monitoring the quotes of any the brokers provided
- Messages tab provides administrators' messages sent to all or specific users regarding issues
related to the application or user accounts
Trade Interceptor Charting 4.0 is a trading support application developed by Riflexo Ltd - Copyright ©Riflexo Ltd 2009
7
Context Menus:
A series of context menus are available from a simple right-click of the mouse, which give you fast
and easy access to specific functionalities.
Six pop-up context menus can be used through a right-click of the mouse, to allow fast access to
specific functionalities:
1. Chart Window Context Menu:
This context menu allows you to:
-
copy and delete graphic instruments
read and modify the properties of graphic instruments
delete indicators
read and modify the properties of indicators
rescale the chart to fit in window
scroll to the last bar
restore default scale
close indicator chart area
load pre-defined or custom color templates
change timescale
add alarm
show/hide quotes
Example of Chart Window Right-Click Context Menu:
Trade Interceptor Charting 4.0 is a trading support application developed by Riflexo Ltd - Copyright ©Riflexo Ltd 2009
8
2. Icons Bar Context Menu:
This menu allows you to:
- enable/disable specific icon groups, personalizing to fit your needs,
- show or hide the Menu Bar
Example of Icons Bar Context Menu:
3. Quotes & Analytics Template Tabs
- This menu allows you to rename or delete a previously saved template
Example of Template Tabs Context Menu:
Trade Interceptor Charting 4.0 is a trading support application developed by Riflexo Ltd - Copyright ©Riflexo Ltd 2009
9
4. Streaming Quote Table Context Menu:
This context menu allows you to:
- open a new security chart in a new chart window
- place new order
- remove selected security or all securities from the Streaming Quote Table
- customize columns of the table
- customize color and font properties of Streaming Quote Table
Example of Streaming Quote Table Right-Click Context Menu:
5. TrendRisk Scanner Table Context Menu
This context menu allows you to:
- open a security chart in a new window
- add a security to the Streaming Quote Table
Trade Interceptor Charting 4.0 is a trading support application developed by Riflexo Ltd - Copyright ©Riflexo Ltd 2009
10
Example of TrendRisk Scanner Table Right-Click Context Menu:
6. Data Values Table Context Menu:
This Menu allows attaching or detaching the Data Values Table from the Quotes & Analytics Window.
For further details see section Data Values Window / Table
Example:
Trade Interceptor Charting 4.0 is a trading support application developed by Riflexo Ltd - Copyright ©Riflexo Ltd 2009
11
Workspace management / Preferences
The application gives you the possibility to:
- work with several chart windows simultaneously
- resize and enlarge both charting and indicators areas
- copy charts
- copy indicators
- cascade, tile windows horizontally and vertically in your screen
- attach/detach the Data Values window to better read chart data
- save and retrieve your templates
- personalize the chart panes colors
- set general user preferences
- resize the icons bar and hide the Menu Bar
Online Help Menu
By selecting "Help/Content" from the Menu Bar, you'll have access to a comprehensive Help Menu
including Online Video Demos of the application's main functionalities, a printable PDF version of the
Help File, and the complete Online Web Help.
You can open this menu at any time while using the application to run a demo or check the help file,
and therefore be up to speed in a minimum learning time.
Trade Interceptor Charting 4.0 is a trading support application developed by Riflexo Ltd - Copyright ©Riflexo Ltd 2009
12
QUOTES
Streaming Quotes Table
The Streaming Quotes Table is the first table displayed in the Quotes & Analytics window.
It allows you to watch real-time currency price updates from various data feed providers and create
new charts automatically through a simple double-click of the mouse.
Example of Steaming Quotes Table:
From this table you can:
- select and upload new currencies to your quote table: see section Add Securities
- remove currencies from the quote table: see section Remove Securities
- create a new chart: see section Create Chart from Quote Table
- open, rename or delete your configurations
- sort data in the quote table: see section Sort Table
- resize the table's columns: see section Resize Table
Two right-click context menus are available on this table:
- one from the configurations tab
- another one from the main quotes table
To find out more about these context menus, see section: Context Menu
See also section: Advanced Quotes
Trade Interceptor Charting 4.0 is a trading support application developed by Riflexo Ltd - Copyright ©Riflexo Ltd 2009
13
Add Securities
To add securities to the Streaming Quotes Table, open the Securities Window, by clicking on the
"Select Securities" button, located in the bottom right corner of the table.
In the Securities Window, first select one of the data feed providers from the providers list, in the
upper left part of the window. The window will automatically display the security list offered by the
provider in the main table.
To find a security, you can either:
- use the scroll bar, located on the right side of the security table, in order to visualize all the table's
rows
- or use the Speed Search option provided in the panel which is located above the currency table.
See section Find Securities.
To add one security to the Streaming Quotes Table, select it from the main security table in
the Securities Window and press the "OK" button in the bottom right part of the window, or simply
double-click on it.
You can add more than one security at a time to the Streaming Quotes Table, in two ways:
- you can either add a full list of securities by using the "Shift" key of your keyboard:
After you've selected the first instrument you want to add to the table, keep the "Shift" key pressed
and select the last security you want to add to the list. To add the selected currency list to the Quote
table, press "OK"
- or you can add a specific selection of securities by using the "Ctrl" key of you keyboard:
Keep the "Ctrl" key pressed and select the currencies you want to add to the Quote table. When you
finish selecting the securities, press "OK"
To close the window and ignore the operation, press "Cancel".
To remove securities from the Streaming Quotes Table, see section: Remove Securities
Find Securities
With the Speed Search functionality provided in the upper part of the Securities Window, you can
quickly find a security by typing either its Code or its Full Name in the appropriate box. The security
will automatically be displayed in the Security table, under the Speed Search Panel.
Trade Interceptor Charting 4.0 is a trading support application developed by Riflexo Ltd - Copyright ©Riflexo Ltd 2009
14
Remove Securities
You can remove securities from the Streaming Quotes Table, in two ways:
1. Select a security in the table and press the "Remove" button located under the table
2. Select a security in the table, open the right-click menu and select "remove"
To remove more than one security at a time from the quote table, you can either:
- Select a list of securities by using the "Shift" key of your keyboard (after you've selected the first
instrument you want to remove, keep the "Shift" key pressed and select the last security you want
remove from the list).
Then open the right-click menu and select "remove", or press the "Remove" button.
- Make a specific selection of securities by using the "Ctrl" key of you keyboard (keep the "Ctrl" key
pressed and select the currencies you want to remove from the Quote table).
Then open the right-click menu and select "remove", or press the "Remove" button.
Save Quote Lists
Quote lists can be saved as part of personal templates.
To see how to save your personal templates, see section Save / Retrieve Templates.
Trade Interceptor Charting 4.0 is a trading support application developed by Riflexo Ltd - Copyright ©Riflexo Ltd 2009
15
Table Management
A series of functionalities allow to easily manage the tables of the Quotes & Analytics window.
1. Each table of the Quotes & Analytics window can be:
- sorted by columns
- resized
2. A series of buttons located in the bottom right corner of the tables allow to:
- add new securities to the quote grid
- remove one or more securities from the quote grid
- refresh TrendRisk scanner
3. Two vertical and horizontal scroll bars allow visualizing table rows and columns easily.
4. A series of pop-up context menus allow you to:
- rename or delete template by right clicking on a template tab
- remove one or more securities from the quote grid, by right clicking on a currency row
- open a new currency chart from the quote grid or from TrendRisk Scanner, by right clicking on a
currency row
- add a currency of the TrendRisk Scanner table directly to the quote grid, by right clicking on a
currency row of TR Scanner table.
Sort Table
You can sort the Streaming Quotes Table by selecting one of the columns headers and doubleclicking on it.
Repeating the operation will reverse the table's sort order.
See also section Resize Table
Trade Interceptor Charting 4.0 is a trading support application developed by Riflexo Ltd - Copyright ©Riflexo Ltd 2009
16
Resize Table
You can resize each column of the Streaming Quotes Table by placing your mouse on the line
separating 2 column headers and use the mouse double-arrow by keeping your mouse pressed while
resizing the column.
See also section Sort Table
Create Charts from Quote Table
To create a currency chart directly from the quote table, first open the Quotes & Analytics Window,
and make sure you've already inserted securities to the Streaming Quotes Table (see section Add
Securities).
There are 2 ways to create a chart from the Quote Table:
1. If you double click on a currency row, a new chart will be created in your Master Chart
Window (This window is directly linked to the Quotes & Analytics window and can be recognized from
the icon
).
2. If you right-click on a currency and select the "+ Chart" function, a new chart will be created in
a New Chart Window. You will have the possibility to decide whether to lock or unlock this new
window from the
Quotes & Analytics Window. For more details see New Chart Window.
Trade Interceptor Charting 4.0 is a trading support application developed by Riflexo Ltd - Copyright ©Riflexo Ltd 2009
17
Advanced Quotes
This window allows you to have better visual perception of quotes.
Advanced Quotes window allows you to add or remove quote widows of different currencies even
from any feed that we provide (FXCM, Dukaskopy, MBT, FXSOL, Riflexo).
Thus you may compare for example quotes and spreads of a currency provided by different brokers.
You can also detach (and re-attach) any of these quote windows from Advanced Quotes window in
order to place it somewhere over the main chart
See also: Streaming Quotes Table
Data Values Window/Table
Add Alarms
Trade Interceptor Charting 4.0 is a trading support application developed by Riflexo Ltd - Copyright ©Riflexo Ltd 2009
18
CHARTS
Chart Windows
Chart windows are composed of:
- a caption bar
- a menu bar
- a fixed toolbar
- main charts area
- a chart icons bar
For a description of each icon's function click here.
It's important to distinguish between the "Master Chart Window" and "New Chart Windows":
The Master Chart Window (or Main Chart Window) is the first which appears after you've logged in.
You can recognize it from the
icon shown at the bottom right of the window, located on the Chart
Icons Bar.
This icon tells you that this window is locked to the Quotes & Analytics window, and cannot be
unlocked. It means that any request made from the Quotes & Analytics window will automatically be
displayed on the Master Chart Window.
Example scenarios:
- When you double click on a currency from the Streaming Quotes Table of the Quotes & Analysis
Window, the Master Chart Window will instantly display the new requested currency chart.
- When you double click on a currency from TrendRisk Scanner Table, the Master Chart Window will
instantly display the new requested currency chart and timescale.
New Chart Windows, can be recognized from the
or
icons at the bottom right of the window
and can be locked or unlocked from the Quotes & Analytics Window. When you ask for a new chart
window, it will be locked by default.
A locked chart window
will react as follows:
- any request from the Streaming Quotes Table will subsequently affect the new locked chart window.
- requests from TrendRisk Scanner Table will only affect the Master Chart Window.
On the contrary, an unlocked chart window will be totally independent from the Quotes & Analytics
window, which means that it won't be affected by double clicks from either the Streaming Quotes
Table, nor TrendRisk Scanner Table.
An unlocked chart window can be managed independently by using the icon
drop-down list to request a new currency chart, or change timescale.
and the timescales
Trade Interceptor Charting 4.0 is a trading support application developed by Riflexo Ltd - Copyright ©Riflexo Ltd 2009
19
To know how to open New Chart Windows, see section: New Chart Window
To see how to lock or unlock New Chart Windows, see section: Lock/Unlock chart window
Caption Bar
The caption bar is the first bar you see at the top of the Chart Window and shows you:
- the application's version number
- the data provider
- the chart currency and timescale
- on the right end, Microsoft's icons to iconize, enlarge and close the window.
The caption bar shows you which of the windows your working with is active.
Menu Bar
The Menu Bar is located at the top of the application's Chart Window, just under the caption bar.
This bar is displayed by default and can be hidden by selecting "View>Main Menu Visible". For a
more detailed description, see section Icons Bar Context Menu.
If you click or place your mouse over one of the Menu Bar's titles, a drop-down menu will appear
automatically.
Trade Interceptor Charting 4.0 is a trading support application developed by Riflexo Ltd - Copyright ©Riflexo Ltd 2009
20
These menus give you access to the following functionalities:
- set security
- open & save templates
- print chart
- select chart window color scheme
- enable X/Y chart panning
- rescale to fit in window
- scroll to last bar
- select chart style (bar, candlesticks, line chart etc.)
- use graphic lines and tools
- use graphic studies
- use graphic objects
- zoom in/out
- hide / show extended trend lines
- set general user preferences
- set color preferences
- set grid options
- set default Fibonacci preferences
- open new chart window
- copy chart
- cascade, tile windows horizontally or vertically
- open Help link
- exit application
For a detailed description of these functionalities, click on the above links.
Fixed Toolbar
The fixed toolbar is located under the Menu Bar of the Chart Window.
With the fixed toolbar you can:
- select a new chart currency
- set new chart timescale
- add/remove and use indicators
- add/remove and use graphic instruments
- add/remove and use graphic objects
- use cursors
- use selective zoom
For a detailed explanation of each icon's functionality, see also section Icons Definition.
This toolbar is fully customizable:
- you can select which icon groups to display or hide. This action is possible through a simple rightclick on the bar, which will open the context menu.
- you can also hide the Toolbar and the Menu Bar together by clicking on the small arrow below the
Toolbar
Trade Interceptor Charting 4.0 is a trading support application developed by Riflexo Ltd - Copyright ©Riflexo Ltd 2009
21
Example: Toolbar context menu
For more details see section Context menu.
Charts Panes
Charts Panes include the currency chart and indicators areas of the Chart Window. They show:
- The main chart (or currency) pane, with its title indicating currency pair, time period, price type and
broker
When you open the application, you'll see a default currency chart , which can be personalized using
the General Preferences Window.
- Indicators are displayed on separate panes, under the main currency chart.
To see how to add, remove or copy indicators, change indicators properties and create your own
indicators, see the Indicators list and the appropriate links.
Real-Time price updates and indicators levels are indicated on the Y axis ; the time and date on the X
axis
A series of chart management tools are displayed on the Chart Icons Bar, located under the charts
panel, next to the scroll bar.
Trade Interceptor Charting 4.0 is a trading support application developed by Riflexo Ltd - Copyright ©Riflexo Ltd 2009
22
Example of a Charts Panel:
Chart Icons Bar
The Chart Icons Bar, is located at the bottom of the Chart Window, under the Chart Panes.
It shows a series of small icons, designed to help you easily manage charts.
This menu gives you access to the following functionalities:
- Timescale UP/ Timescale Down- load one step higher or lower timeframe of the chart
- Lock / Unlock chart window, see also section Chart Windows
- Zoom In and Zoom Out
- Open General Preferences window
- Copy chart
For a detailed explanation of each icon's functionality, see also section Icons Description
See also section Scroll Chart
Trade Interceptor Charting 4.0 is a trading support application developed by Riflexo Ltd - Copyright ©Riflexo Ltd 2009
23
Icons Definitions
Each of the icons described below is located either on the Fixed Toolbar, in the Menu Bar's tabs or on
the Chart Icons Bar.
1. Icons of the Fixed Toolbar
Opens the Securities Window for the selection and upload of a currency pairs to the Chart
Panes
Create and remove simulation accounts. Set the initial deposit sum for trading
The Paper Trading Control Panel shows opened, pending and booked orders, as well as the
usual data related to orders- type, size, open price etc. and also equity balance, margin levels ans
s.o.
Opens the "Add Indicator" window for indicators selection
Opens Perspective Chart in a pane at the bottom of the screen showing visualized part of the
historical data and the whole historical data period
Makes candlesticks three dimensional, for different than usual 2D visualization.
Allows to use cross cursor, cursor line and zoom on the chart from the drop down menu of the
icon
Allows drawing a trend line
Allows placing a support/resistance line
Allows placing a vertical line on the chart
Opens access to 5 different regression tools available
regression line
raff regression channel
standard error channel
standard deviation channel
regression channel
Opens access to Fibonacci tools
fibonacci retracement
Trade Interceptor Charting 4.0 is a trading support application developed by Riflexo Ltd - Copyright ©Riflexo Ltd 2009
24
fibonacci target
fibonacci arcs
fibonacci time zones
Opens access to Gann Tools
gann line
gann fan
angle lines
Draw different graphic objects like rectangle, ellipse, arrow, enter text etc.
arrow up Allows to insert a Buying signal on the chart
arrow down Allows to insert a Selling signal on the chart
allows to insert text on the chart
rectangle Allows to draw a rectangle on a chart
ellipse Allows to draw on Ellipse on a chart
triangle Allows to draw a triangle on a chart
arrow line Allows to draw an Arrow pointing a place on the chart
segment Allows to draw segment lines in order to construct patterns for example
Draw different graphic tools- Channel Lines, Andrew's Pitchfork etc
quadrant line
tirone levels
speed resistance lines
speed resistance arcs
andrew's pitchfork
odds
cycle lines
channel lines
percentage retracements
Place Eliot Wave labels
Remove all indicators from the whole currency pair window, both superior and inferior indicators
Remove all tools, i.e. Fibonacci tools, trend lines, support/ressistane annotations etc.
,
,
,
Fine tune the appearance of candlesticks
Trade Interceptor Charting 4.0 is a trading support application developed by Riflexo Ltd - Copyright ©Riflexo Ltd 2009
25
Create / Open a Chart
There are 4 possible ways to create a chart with Trade Interceptor Charting 3.3:
- from the chart window, opening the Securities Window - see point1
- using the Streaming Quotes Window - see point 2
- by opening a New Chart Window - see point 3
- by copying an existing chart - see point 4
1. Using the Securities Window:
- Open the securities window, either by clicking on the
icon located on the Fixed Toolbar of
the Chart Window, or by selecting "File/Set Security" from the Menu Bar.
- First select one of the data feed providers from the providers list, in the upper left part of the window.
The window automatically displays the items offered by the provider in the currency list.
You can find a security by either using the scroll bar, located on the right side of the currency list, in
order to visualize all the table rows, or the Speed Search option which is located above the currency
list. See section Find Securities with Speed Search.
- Select a security from the security list,
- Select the Timescale in the left column,
- Select the history period from the second column,
- finally press the "OK" button to create the chart.
- Press "Cancel" if you want to close the window without creating a new chart.
2. Using the Streaming Quotes Window:
See section: Create Charts from Quote Table
3. Opening a New Chart Window:
See section: New Chart Window
4. Copying an existing chart window:
See section: Copy Chart
Trade Interceptor Charting 4.0 is a trading support application developed by Riflexo Ltd - Copyright ©Riflexo Ltd 2009
26
Default Chart
When you open the application, the chart window displays a default currency chart, including:
- the chart's title, which is shown at the top, including the currency, data provider, price type and
timescale
- outlined candlesticks chart:
To change chart style to bar chart or line chart see section Change Chart Type
To remove the candles outlines and customize charts, see section General User Preferences
- TrendRisk indicator: TrendRisk Bands, TrendRisk Stop Bands and Tip Center
click on the following links to see how to modify indicators properties, delete indicators or add new
indicators
- White screen color scheme with solid color background:
to change chart skin or personalize colors, see section General User Preferences
- Y axis showing only the last price value.
To personalize the Y axis, see General Preferences
For more information about the chart axis, read also section Chart Axis
Example of Default Chart:
Trade Interceptor Charting 4.0 is a trading support application developed by Riflexo Ltd - Copyright ©Riflexo Ltd 2009
27
Chart Axis
Chart data can be read using the X axis or horizontal coordinates, and the Y axis or vertical
coordinates.
Prices and chart levels on the Y axis:
The Y axis shows pips-based price coordinates.
- Currency prices are updated in real-time and streamed to the vertical axis of the chart. The last
price update is shown by default on red background.
It is possible to change the background color of the real-time price updates by clicking on the icon
located on the chart icons bar and selecting "Color Preferences" from the General Preferences
window. Then select "Real-Time Price Label" to select the new background color and click Apply and
OK to complete the operation.
- Indicators levels are not displayed on the Y axis by default.
You can modify this in the General Preferences to have all indicators and oscillators' latest levels
automatically displayed on the vertical axis. For this you need to open the Indicators option window,
either by clicking on the icon
located on the chart icons bar, or by selecting "Options/General
Preferences" in the Menu Bar, then enable with "tick" the option " Show indicator price label on Yaxis" in Indicators
You can also add a pips-based grid shading to the chart and indicators areas.
See how to personalize the grid and chart area in section General Preferences.
Time and Dates on the X axis
The X axis shows time and date based on the selected timescale unit.
You can also personalize the vertical timelines of the grid, from the General Preferences window.
See section General Preferences.
See also section Software Time Zones.
Software Time Zones
To set the application on your local time zone, open the General Preferences window - either by
selecting "Options/General Preferences" from the Menu Bar, or clicking on the icon
located on
the Chart Icons Bar - and select the appropriate time from the "Time Zone" frame.
Trade Interceptor Charting 4.0 is a trading support application developed by Riflexo Ltd - Copyright ©Riflexo Ltd 2009
28
Example:
If you press "Save as Default" before closing the General Preferences window, the application will
automatically be set on your preferred time zone each time you use the application.
You can change the application's time zone for a single work session (ie. if you're traveling) in the
same way, without saving the new time as default, but by simply selecting a time zone and closing
the General Preferences window.
You can read the last price time in the Streaming Quotes table, which is automatically updated
according to your local time zone.
Example:
Trade Interceptor Charting 4.0 is a trading support application developed by Riflexo Ltd - Copyright ©Riflexo Ltd 2009
29
Securities Window
This window allows you to select and upload currency prices on both the chart panels of the Chart
Window, and the tables of the Quotes & Analytics window.
To open the securities window from the chart window, you can either select File/Set Security from
the Menu Bar, or click on the icon
, located on the Fixed Toolbar.
To open the securities window from the Streaming Quotes Table, click on the "Select securities"
button located in the bottom right corner of the window.
Note that when you open this window from the Streaming Quote Table to create a quote list, the
columns Timescale and Period are not active.
To see how to upload currency prices on a chart Panel, see Create/Open a chart
To see how to upload currency prices on the Streaming Quotes table, see Add Securities.
Trade Interceptor Charting 4.0 is a trading support application developed by Riflexo Ltd - Copyright ©Riflexo Ltd 2009
30
New Chart Window
By clicking on the icon
- located in the bottom right corner of the Chart Window, under the Charts
Panel - or by selecting "Window/New Window" from the Menu Bar, you can open a New Chart
Window and start uploading a new currency, or change a currency timescale, etc. Each new chart
window gives you access to all the charting functionalities.
New Chart Windows can be recognized from the icons
right corner of the window, on the Chart Icons Bar.
A New Chart Window can either be:
or
which are located in the bottom
- "locked" meaning that it's linked to the Quotes and Analytics window, in which case, if you request a
new currency from the Streaming Quotes Table, the new chart window will automatically be updated
with the new currency,
- or "unlocked", meaning that it remains independent from the Quotes and Analytics window, so you'll
be able to request a different security than the one displayed on the Master Chart Window.
To learn more about the difference between New Chart Windows and the Master Chart Window, see
section Chart Windows.
To see how to lock or unlock a new chart window, see section Lock/Unlock chart window.
You can open as many new chart windows as you want.
By using Microsoft Windows' icons
in the top right corner of each new window, on the
caption bar, you can resize, iconize or close the chart windows in order to easily manage your
workspace, you can also cascade or tile windows vertically or horizontally on your screen. See
section Cascade and Tile Windows.
See also section how to Save and retrieve your personal templates.
Copy Chart
You can duplicate a chart window by selecting "Windows/Copy Chart" from the main Menu Bar
Trade Interceptor Charting 4.0 is a trading support application developed by Riflexo Ltd - Copyright ©Riflexo Ltd 2009
31
Or you can do this from Chart Icons Bar
This will automatically open a new chart window with the same chart and indicators configuration.
See also sections:
New chart window
Chart Windows
Lock / Unlock chart window
Compare Charts
This function available on Trade Interceptor 4.0 allows you to compare two currency pairs on one
single chart.
Its "Properties select compare security" window gives access to the settings.
The window has "Parameters" and "Style" sections where you
can:
- select a security for comparison
- set comparison options
- set the style of the secondary currency's chart
Trade Interceptor Charting 4.0 is a trading support application developed by Riflexo Ltd - Copyright ©Riflexo Ltd 2009
32
Cascade and Tile Windows
You can automatically re-arrange windows in your screen by selecting one of the following
visualization options, accessible from the menu "Windows" on the Menu Bar:
- Cascade
- Tile 1 column
- Tile 2 columns
- Tile Vertically
You can subsequently save your template in order to retrieve your screen layout easily.
See sections:
Save / Retrieve templates
Rename / Delete templates
Lock / Unlock Chart Window
Trade Interceptor Charting 4.0 is a trading support application developed by Riflexo Ltd - Copyright ©Riflexo Ltd 2009
33
Before reading this section, make sure you've read the explanation about Chart Windows
You can unlock a new chart window, so that it remains independent from the Quotes & Analytics
window, by clicking on the icon
.
The chart window is unlocked when you see the icon
.
If you decide to unlock a chart window, any change you'll request from the Quotes and Analytics
Window will not affect this chart window. So, if you request a new currency chart from the Streaming
Quotes Table, for example, the unlocked chart window won't be updated with the new currency.
You'll also be able to request a different security directly from the New Chart Window independently,
by clicking on the icon
of New Chart Window's Fixed Toolbar.
You can lock a new chart window in order to link it again to the Quotes and Analytics Window by
clicking on the icon
.
The chart window is locked when you see the icon
. When a chart window is locked, it means that
any request from the Quotes & Analytics window will also affect this window.
By default new chart windows are locked, which means that if you request a new currency chart from
the Streaming Quotes Table or from TrendRisk Scanner table, all the chart windows which are locked
will be updated with the new currency.
Note that the Master Chart Window - which is the first appearing after you've logged in, and which
you can recognize from the
icon - cannot be unlocked.
Save / Retrieve Template
With Trade Interceptor Charting 4.0 you can save and retrieve as many template as you'd like.
1. To save a template, you can either click on the icon
, which is located in "File/Save
template" from the Menu Bar.
The system automatically loads configurations in a default file.
All you have to do is to give a name to your configuration and press the "Save" button.
A new tab will instantly appear at the bottom of the Quotes & Analytics window, allowing you to easily
retrieve this template at any time while using the application.
Trade Interceptor Charting 4.0 is a trading support application developed by Riflexo Ltd - Copyright ©Riflexo Ltd 2009
34
2. To open a template:
There are 3 ways to retrieve a configuration. You can either:
1) click on one of the tabs at the bottom of the Quotes & Analytics window (See image above)
2) right-click on the chart and choose Open Template from the context menu
or 3) select "File/Open template"
from the Menu Bar.
This will open the default directory from where you can select a template and press the "Open" button
to open it.
You can use the right-click context menu to rename or delete template.
See sections: Context Menu and Rename / Delete Configurations.
Rename / Delete templates
Template tabs are located at the bottom of the Quotes & Analytics Window.
To Rename a previously saved template, right-click on the name of the template you would like to
rename. This will open the pop-up context menu. Select "Rename". Give a new name to your
template. Press "Save" to save the new template's name.
To Delete a previously saved template, right-click on the name of the configuration you'd like to
delete. This will open the pop-up context menu. Select "Delete" to automatically remove and cancel
this template from the templates tabs.
See also sections:
Context Menus
Save / Retrieve Configurations
Change Chart Type
To switch from one chart type (bar chart, candlesticks chart, line chart etc.), to another, you can
click Menu Bar>View and you will be able to switch to:
bar chart
candlestick chart
line chart
candlevolume chart
equivolume chart
Trade Interceptor Charting 4.0 is a trading support application developed by Riflexo Ltd - Copyright ©Riflexo Ltd 2009
35
point and figure chart
renko chart
kagi chart
Change Timescale
There are 3 ways to change the timescale of a chart:
1. right-click on the chart and change the time scale from the bottom of the context menu
2. select a timescale from the Timescale drop-down menu, located in the Fixed Toolbar
Example:
Trade Interceptor Charting 4.0 is a trading support application developed by Riflexo Ltd - Copyright ©Riflexo Ltd 2009
36
3.You can also change timescale and history period through the Securities Window.
For more details, see section Securities Window
Charts and Data Visualization
There are various ways to visualize chart data and read data values with Trade Interceptor Charting
4.0
- using the cross cursor
- using the vertical cursor
- using the Zoom in / Zoom out functionalities
- using the selective Zoom
- using the scrolling functionalities
- using the chart panning functionality to move the chart vertically and/or horizontally
Trade Interceptor Charting 4.0 is a trading support application developed by Riflexo Ltd - Copyright ©Riflexo Ltd 2009
37
- repositioning the chart to fit in window
- resizing and enlarging charts panels
- resizing and enlarging indicators panels
- using the interactive data values table simply moving your mouse over the chart
- print the chart
Cross Cursor
The Cross Cursor is one of the ways to read chart data.
It can be activated or disabled through a single mouse click on the icon
Example of active Cross Cursor:
To use the cross cursor:
- first click on the
icon, located on the Fixed Toolbar
- click on a chart or indicator pane to activate the cursor
- two crossing lines are automatically displayed on the chart and the values (level and time) are
shown on the x and y axis
- move the mouse over the chart area to read data values of chart and indicators.
Before using any other chart tool, you first need to disable the cross cursor, by simply clicking again
on the icon
Vertical Cursor
The Vertical Cursor is one of the ways to read chart data.
This cursor can be activated or disabled through a single mouse click on the icon
To read chart data with the vertical cursor, click on the icon
, located on the Fixed Toolbar, and
Trade Interceptor Charting 4.0 is a trading support application developed by Riflexo Ltd - Copyright ©Riflexo Ltd 2009
38
click on the chart or indicator panel. A vertical line is displayed automatically together with a data info
box, showing the data values of the selected chart level.
To read other chart values, click on another point of the chart and the new data will be displayed
automatically.
The data values shown by the vertical cursor in the info box are:
- the date and time of the selected level
- the open, high, low and close prices of the selected chart bar or candle stick, or alternatively, the
closing price of selected line chart level
Users can choose to hide or show the info box displaying the cursor line values, from the General
Preferences window, but default setting is hidden info box.
To open the General Preferences window, select Options/General Preferences from the Menu Bar, or
located on the Chart Icons Bar, in the bottom right corner of the Chart Window.
click on the icon
See more details in section: General User Preferences
Before using any other chart tool, you first need to disable the vertical cursor functionality, by simply
clicking again on the icon
Show last price barrier
You can draw a barrier line at the last price level by using the General Preferences window.
To open the General Preferences Window, select Options/General Preferences from the Menu Bar,
or click on the icon
located on the Chart Icons Bar, in the bottom right corner of the Chart Window.
In the Chart Options, select the option: "Draw barrier line on last value" and the line will be displayed
automatically.
If you want to have this line drawn by default on all your charts, click on the button "Save as default"
and press "OK" to close the operation.
Zoom In / Zoom Out
There are 3 ways to change the chart's visualization scale:
- An easy way is to use the mouse wheel, and scroll in or out by simply activating the wheel.
If you don't have a Wheel Mouse, you can either:
- Click on one of the icons
or
, located in the bottom right corner of the Chart Window, on
Trade Interceptor Charting 4.0 is a trading support application developed by Riflexo Ltd - Copyright ©Riflexo Ltd 2009
39
the Chart icons bar, and repeat the operation as many times as you'd like until you reach the right
visualization scale
- Select "Options/Zoom In" or "Options/Zoom Out" from the Menu Bar and repeat the operation as
many times as you'd like until you reach the right visualization scale
You can also zoom into a specific part of a chart, by using the selective zoom (see section: Selective
Zoom)
Or you can enlarge you chart or indicator panels by double-clicking on the chart or on the indicator
(see sections: Enlarge Chart and Enlarge Indicator)
Selective Zoom
Using the selective zoom is one of the ways to visualize chart data. Other methods are explained in
section : Charts and Data Visualization
To zoom into a specific chart area, click on the icon
the charts Panel.
, displayed on the Fixed Toolbar above
Use the left-click command of your mouse to select the first part of the area you'd like to zoom into.
Release the command and move your mouse to the other end of the area you'd like to zoom into. The
charts Panel will automatically show the selected area.
To confirm the area you'd like to zoom into, just press the left-click command of your mouse again.
Timescale UP/ Timescale Down
To quickly switch between different time frames of the chart window use the icons
Icons Bar
and
in Chart
The icon
allows switching to the next higher timescale with one step for every click
The same applies for the icon
which allows to switch on the next lower timescale with every click
Scroll Chart Back and Forth
To scroll historical data of charts and indicators, you can
Use the scroll bar which is displayed under the Charts Panel.
To move back in time on the chart, move the scroll bar to the left.
To move forward in time, move the scroll bar to the right.
It is possible to hide the scroll bar thanks to the General Preferences window. See section General
Preferences
This functionality also give you the possibility to scroll in the future, in order to give you the necessary
empty space on the chart for projections of strategies and studies.
See also related sections:
- Scroll to the Last Bar to see how to quickly rescale the chart to the last bar in one click.
- Move Chart
- Fit in Window
Other ways to read or visualize chart data are explained in section: Charts and Data Visualization
Trade Interceptor Charting 4.0 is a trading support application developed by Riflexo Ltd - Copyright ©Riflexo Ltd 2009
40
Scroll to last bar
To automatically rescale a currency chart to the last bar - meaning that the last bar of the chart shows
the last price update - you can either:
- right-click in the chart area and select "Scroll to the Last Bar" from the Context Menu
- or select "View/Scroll to the Last Bar"
from the Menu Bar
See also related sections:
- Move Chart
- Scroll Chart
- Fit in Window
Move Chart
You can move currency charts vertically and horizontally by clicking on the main
chart pane and dragging them right, left,up or down. This functionality is called "chart panning" and is
activated by default.
After you've moved a chart, it is possible to automatically rescale it using the "Fit in Window"
functionality.
To see how to use this feature, see section Fit in Window.
To move a chart horizontally only, you should activate the function: "Y panning", which will
automatically disable the X chart panning functionality.
To activate this function, you can either click on the icon
the Menu Bar.
located in "View/Y Panning" from
To restore the default "X and Y chart panning" option, allowing both vertical and
horizontal panning, you can click on the icon
Bar.
again in "View/Enable Y Panning" from the Menu
See also: section “Scroll to Last Bar” to see how to rescale the chart to the last bar automatically.
Fit In Window
To restore the default position of your main chart in the screen, you can either
- Right-click on the main chart. This will open the right-click context menu.
Then select "Fit in Window".
- Or you can select "View/Fit in Window" from the Menu Bar
Trade Interceptor Charting 4.0 is a trading support application developed by Riflexo Ltd - Copyright ©Riflexo Ltd 2009
41
Example: How to restore the "Fit in Window" option through the right-click context menu:
See also related sections:
- Move Chart
- Scroll Chart
- Scroll to the Last Bar
Resize/Enlarge Main Chart
- To enlarge a currency chart to full screen, double click on the chart pane.
To go back to the previous chart lay-out, simply double click again on the chart.
- To resize the main chart area, place your mouse over the horizontal line between the main chart
area and the indicators area. When the mouse pointer shows resizing arrows, keep your left-mouse
button pressed and drag the bordering line to another place.
Other ways to read or visualize chart data are explained in section: Charts and Data Visualization
See also section: Resize/Enlarge/Close Indicator
Resize/Enlarge/Close Indicator Area
- To enlarge an indicator area to full screen, double click on it.
To go back to the previous lay-out, double click again on the indicator's area.
- To resize indicator areas, place your mouse over the horizontal line bordering the indicator area.
When the mouse pointer shows resizing arrows, keep your left-mouse button pressed and drag the
bordering line to another place.
- To close an indicator pane, right-click on it and select "Close" from the context menu.
See also section Resize/Enlarge Main Chart
Trade Interceptor Charting 4.0 is a trading support application developed by Riflexo Ltd - Copyright ©Riflexo Ltd 2009
42
Data Values Window/Table
This interactive window / table gives you the possibility to read the exact value of each chart and
indicator level, by simply moving your mouse pointer over a chart.
The Data Values Table appears by default as a detached window in front of the Chart Window when
you open the application.
Example of detached Data Values window:
This window can easily be attached to or detached from the application's main window as follows:
- by right-clicking on the Data Values table, and selecting "Detach" or "Attach"
- If you close the detached Data Values Window, it will automatically be attached to the Quotes &
Analytics Window as the 4h Tab.
Example of attached Data Values table:
Trade Interceptor Charting 4.0 is a trading support application developed by Riflexo Ltd - Copyright ©Riflexo Ltd 2009
43
Other ways to read or visualize chart data are explained in section: Charts and Data Visualization
Print Chart
To print a chart window,
Select "File/Print"
from the Menu Bar
Then select printing and printers options, to print the chart window.
GRAPHIC TOOLS, STUDIES AND OBJECTS
Graphic Tools
Graphic tools available in Trade Interceptor Charting 4.0 are:
- trend lines
- support/ resistance lines
- vertical time lines
- regression lines and channels
- lines and supports
To find out more about these graphic tools, click on the appropriate link in the above list.
Other graphic instruments such as studies and objects are explained in sections:
- Graphic Studies
- Graphic Objects
To know how to change the properties of Graphic tools and instruments, see section Change Tools
Properties
Change Tools Properties
There are 2 ways to change the properties of graphic tools such as lines, objects and studies.
1. Using the Context menu:
- place your mouse on the tool
- open the right-click context menu and select "Properties+ tool name"
- modify properties from the properties box
- press "Save As Default" if you want to activate the new properties each time you will use this
indicator
- or press "OK" to apply these properties only to the active chart window
- press "Cancel" to ignore modifications and return to the default settings.
Trade Interceptor Charting 4.0 is a trading support application developed by Riflexo Ltd - Copyright ©Riflexo Ltd 2009
44
2. Using the Active objects window
Graphic tools can also be personalized through the "Show Active Objects" icon
in the upper left
corner of the chart pane.
There you can set the properties of your choice of interest from all the tools and indicators currently
on the chart.
Trend Lines
This section explains how to:
- draw one or more trend lines
- extend a trend line
- move a trend line
- remove a trend line
- copy a trend line
- To see how to change trend lines properties, go to section: Change Tools Properties
1. How to draw one or more trend lines:
A. Using the icons of the Fixed Toolbar
- To draw a trend line on a chart or on an indicator, click once on the icon
.
Click on the chart where you'd like the trend line to start and keep the left command of your mouse
pressed while drawing the line.
Release your left mouse command when you finish drawing the trend line.
After the operation, the trend line function is not disabled. In order to disable it from drawing a second
trend line unintentionally, right-click on the chart and the function will be instantly disabled or click on
the icon
.
B. Using the Menu Bar
Alternatively, you can select "Tools/Tools/Trend Line" from the Menu Bar and start drawing trend
lines. To disable the function, select "Tools/Tools/Trend Line" again or right-click on the chart.
2. How to move a trend line:
You can move a trend line on the chart by disabling "freeze" from the trend line "Properties"
accessible through right-click over the trend line.
You can set this setting (unfreeze) as default so that from now on other trend lines will be movable by
default.
3. How to extend a trend line:
You can extend a trend line from one end or the other, by selecting one end (placing your mouse over
it) and keep the left-command of your mouse pressed to extend the line to another chart level.
Trend Lines extend in the future through a dashed line if this setting is enabled in their "Properties"
Trade Interceptor Charting 4.0 is a trading support application developed by Riflexo Ltd - Copyright ©Riflexo Ltd 2009
45
menu. This function is not enabled by default.
4. How to copy a trend line:
You can copy and paste a trend line by right-clicking on the trend line you'd like to copy and select:
Copy Trend Line
A new similar trend line will automatically appear on the chart.
5. How to remove a trend line:
You can remove a trend line either by right-clicking on it and select: Delete Trend Line.
Or by using the "Clear all tools" icon
(See section: Remove Graphic Instruments)
Extend Trend Lines
With Trade Interceptor Charting 4.0, Trend Lines are not extended in the future by default.
You can enable and disable this function again from "Properties Trend Line" when you righ-click on
the trend line.
If you save as default after making this setting, all the trend lines from that moment on will be
extended.
If you only click "OK" this setting will apply for that trend line only.
Support and Resistance Lines
This section explains how to:
- draw one or more support and resistance lines
- move support and resistance lines
- copy support and resistance lines
- delete support and resistance lines
- To see how to change horizontal lines properties, go to section: Change Tools Properties
1. How to draw support and resistance lines on a chart or on an indicator:
A. Using the icons of the Fixed Toolbar:
-To draw a horizontal line, click once on the icon
. Then click on the chart where you'd like the
support or resistance line to be drawn. A horizontal line will automatically be drawn on that point and
the function will automatically be disabled after the operation. By default the function is enabled until it
is turned off manually by clicking the icon.
B. Using the Menu Bar
Alternatively, you can select "Tools>Tools>Support/Resistance Line" from the Menu Bar and start
drawing one or more lines.
To disable the function go through the same path "Tools>Tools>Support/Resistance Line" again.
The function is automatically disabled when you select another graphic instrument.
Trade Interceptor Charting 4.0 is a trading support application developed by Riflexo Ltd - Copyright ©Riflexo Ltd 2009
46
2. How to move support and resistance lines:
You can move a support or resistance line on the chart by selecting it and dragging it to a different
place. By default this is not possible until it is unfrozen from properties menu of the tool.
3. How to copy support and resistance lines:
You can copy and paste support and resistance lines by right-clicking on the line you'd like to copy
and select: Copy Support/Resistance Line
A new similar line will automatically appear on the chart.
4. How to delete support and resistance lines:
You can remove support and resistance lines either by right-clicking on them and select: Delete
Support/Resistance Line.
Or by using the "Clear all tools" icon
(See section: Remove Graphic Instruments)
Vertical Time Lines
This section explains how to:
- draw one or more vertical time lines
- move vertical time lines
- copy vertical time lines
- delete vertical time lines
- To see how to change vertical lines properties, go to section: Change Tools Properties
1. How to draw vertical time lines on a chart or on an indicator:
A. Using the icons of the Fixed Toolbar:
-To draw a vertical line, click once on the icon
. Then click on the chart where you'd like the line to
be drawn. A vertical line will automatically be drawn on that point.
You can continue placing vertical lines on every mouse click until you disable the function by clicking
its icon on the Fixed Toolbar.
- To draw several lines, double-click on the icon, draw the lines one after the other. When you're
finished, click on the icon again to disable this function.
B. Using the Menu Bar
Alternatively, you can select "Tools/Tools/Vertical Line" from the Menu Bar and start drawing 1 ore
more lines.
To disable the function, select "Tools/Tools/Vertical Line" again.
The function is automatically disabled when you select another graphic instrument.
Trade Interceptor Charting 4.0 is a trading support application developed by Riflexo Ltd - Copyright ©Riflexo Ltd 2009
47
2. How to move vertical time lines:
You can move a vertical line on the chart by selecting it and dragging it to a different place. By default
this is not possible until it is unfrozen from properties menu of the tool.
3. How to copy vertical time lines:
You can copy and paste vertical time lines by right-clicking on the line you'd like to copy and select:
Copy Vertical Line.
A new similar line will automatically appear on the chart.
4. How to delete vertical time lines:
You can remove vertical time lines either by right-clicking on them and select: Delete Vertical Line.
Or by using the "Clear all tools" icon
(See section: Remove Graphic Instruments)
Lines and Supports
The tools representing "Lines and Supports" category on Fixed Toolbar are:
Quadrant Lines
Tirone Levels
Speed Resistance Lines
Speed Resistance Arhes
Andrew's Pitchfork
ODDS
Cycle Lines
Channel Lines
Percentage Retracement
This section explains how to:
- draw tools
- move tools
- extend tools
Trade Interceptor Charting 4.0 is a trading support application developed by Riflexo Ltd - Copyright ©Riflexo Ltd 2009
48
- copy tools
- delete tools
- To see how to change "Lines and Supports" tools' properties, go to section: Change Tools
Properties
1. How to draw tools from "Lines and Supports" category:
A. Using the icons of the Fixed Toolbar:
- To draw a "Lines and Supports" tool on a chart or on an indicator, click on the icon
in Menu
Bar and click on the desired tool's icon (see above) in order to start drawing it on the chart.
Select one of the lines' ends and keep the left command of your mouse pressed to extend to line to
the level where you'd like the channel line to end up. Release your mouse command when you finish
drawing the tool.
B. Using the Menu Bar
Alternatively, you can select "Tools/Lines and Supports" from the Menu Bar, choose specific tool and
start drawing it
To disable the function, select "Tools/Lines and Supports" again.
The function is automatically disabled when you select another graphic instrument.
2. How to move tools from "Lines and Supports" category:
You can move one tool at a time by just selecting it with your mouse and dragging it to a different
place( first make sure in "Properties+ tool name" that the tool is not frozen)
To move for example both channel lines (the tool with icon
the lines and drag them to another place.
) together, press the Shift key, select
3. How to extend tools of category "Lines and Supports:
You can extend some tools in the past and in the future by selecting one end of a line, keeping the
left-command of your mouse pressed, and drag the lines to extend them.
You can automatically draw extended dashed lines of the tool in the future, by changing the tool's
properties (this applies only to Quadrant- and Channel Lines and Tirone levels)
Tools properties can be changed:
- through a right-click of the mouse on the tool. Then select "Properties+ tool name" from the context
menu, and select "Extend Lines" from the Properties box on tools which allow this option. You can
also save this option as default to activate it each time you will use this graphic tool
Trade Interceptor Charting 4.0 is a trading support application developed by Riflexo Ltd - Copyright ©Riflexo Ltd 2009
49
You can save this option as a default option by pressing "Save As Default" to activate it each time
you will use this graphic tool
4. How to copy tools of category "Lines and Supports:
To copy your tool, right-click on the instrument you'd like to copy and select: "Copy + tool name"
A new similar set of lines will automatically appear on the chart.
5. How to delete tools of category "Lines and Supports:
You can remove the tools either by right-clicking on them and select: "Delete + tool name"
Or by using the "Clear all tools" icon
(See section: Remove Graphic Instruments)
Regression Lines and Channels
The regression tools available on Trade Interceptor 4.0 are:
Regression Line
Raff Regression Channel
Standard Error Channel
Standard Deviation Channel
Regression Channel
This section explains how to:
- draw regression tools
- extend regression tools
- copy regression tools
- delete regression tools
- To see how to change regression tools' properties, go to section: Change Tools Properties
1. How to draw regression tools:
A. Using the icons of the Fixed Toolbar:
- To draw a regression tool on a chart or on an indicator, click on the icon's right-side arrow
Trade Interceptor Charting 4.0 is a trading support application developed by Riflexo Ltd - Copyright ©Riflexo Ltd 2009
and
50
choose the desired regression tool by clicking on its icon( see above) then click on the chart where
you'd like the lines to start. Keep the left command of your mouse pressed to draw the lines from the
beginning to the end of the selected chart area. Release your mouse command when you're finished
with the drawing.
When you're finished, click on the icon again to disable this function since it is not disabled
automatically by default.
B. Using the Menu Bar
Alternatively, you can select "Tools>Regression Lines" from the Menu Bar choose one of the five
tools and start drawing.
To disable the function go through the same path "Tools>Regression Lines" again.
The function is automatically disabled when you select another graphic instrument.
2. How to extend regression tools:
You can extend regression tools in the past or in the future by selecting one line's end and using the
left-command of your mouse to extend the lines to another chart level.
You can automatically draw extended dashed lines in the future, by changing their properties.
Tools properties can be changed:
- through a right-click of the mouse on the tool. Then select "Properties+tool name" from the context
menu, and select "Extend Lines" from the Properties box. You can also save this option as default to
activate it each time you will use this graphic tool
- or by using the "Active Objects Window": see Change Tool Properties
You can save this option as a default by pressing "Save As Default" to activate it each time you will
use this graphic tool.
3. How to copy regression tools:
You can copy and paste regression tools by right-clicking on the instrument you'd like to copy and
select: "Copy+ tool name"
A new similar instrument will automatically appear on the chart.
4. How to delete regression tools:
You can remove regression tools either by right-clicking on them and select: "Delete + tool name".
Or by using the "Clear all tools" icon
(See section: Remove Graphic Instruments)
Trade Interceptor Charting 4.0 is a trading support application developed by Riflexo Ltd - Copyright ©Riflexo Ltd 2009
51
Remove Graphic Instruments
You can delete graphic tools, studies and objects, either one by one, or all together simultaneously.
1. To remove one graphic instrument at a time:
You can either:
- Right-click on an instrument and select: Delete Instrument
- Or click on the icon
located in the upper left corner of the chart pane then choose the desired
instrument for removing and click" Delete" button.
2. To remove all graphic instruments simultaneously:
- simply click on the icon
and all tools will be canceled simultaneously.
Graphic Studies
Graphic studies available in Trade Interceptor Charting 4.0 are:
- Fibonacci Arcs
- Fibonacci Retracements
- Fibonacci Target
- Fibonacci Time Zones
- Gann Lines
- Gann Fans
- Angle Lines
To find out more about these graphic studies, click on the appropriate link in the above list.
See also sections:
- Graphic Tools
- Graphic Objects
Trade Interceptor Charting 4.0 is a trading support application developed by Riflexo Ltd - Copyright ©Riflexo Ltd 2009
52
Fibonacci Retracements
You can find all Fibo tools in the Fixed Toolbar:
1. To draw Fibonacci Retracements:
A. Using the icons of the Fixed Toolbar:
- Click on the icon
.
Click on the chart where you'd like the retracements line to start
Keep the left command of your mouse pressed to draw the retracements
Release your mouse command when you're finished.
B. Using the Menu Bar
Alternatively, you can select "Tools/Fibonacci Tools/Fibonacci Retracement" from the Menu
Bar and start drawing one or more retracements.
To disable the function, select "Tools/Fibonacci Tools/Fibonacci Retracement" again.
The function is automatically disabled when you select another graphic instrument.
2. To move Fibonacci Retracements:
Just click on the main line to select the tool and drag it to a different place. This option is
possible after you unfreeze the tool form "Properties" box
3. To copy Fibonacci Retracements:
You can copy and paste Fibonacci Retracements by right-clicking on the instrument you'd like
to copy and select: Copy Fibonacci Retracements
A new similar instrument will automatically appear on the chart.
4. To change the level and angles of Fibonacci Retracements:
You can change Fibonacci retracements angles directly from the graph by selecting the main
line from one end and move it to the new chosen angle.
This is not possible by default until the tool is unfrozen from its "Properties" box
Trade Interceptor Charting 4.0 is a trading support application developed by Riflexo Ltd - Copyright ©Riflexo Ltd 2009
53
Example:
Fibonacci Arcs
You can find all Fibo tools in the Fixed Toolbar:
This section explains how to:
- draw Fibonacci arcs
- move Fibonacci arcs
- extend Fibonacci arcs
- change the properties of Fibonacci arcs
- copy Fibonacci arcs
- delete Fibonacci arcs
1. How to draw Fibonacci arcs:
A. Using the icons of the Fixed Toolbar:
- click on the icon
.
Click on the chart where you'd like the arcs line to start
Keep the left command of your mouse pressed to draw the line and arcs
Release your mouse command when you're finished.
Trade Interceptor Charting 4.0 is a trading support application developed by Riflexo Ltd - Copyright ©Riflexo Ltd 2009
54
B. Using the Menu Bar
Alternatively, you can select "Tools/Fibonacci Tools/Fibonacci Arcs" from the Menu Bar and start
drawing one or more arcs.
To disable the function, select "Tools/Fibonacci Tools/Fibonacci Arcs" again.
The function is automatically disabled when you select another graphic instrument.
2. How to move Fibonacci arcs:
You can move Fibonacci arcs on the chart by selecting the arcs area and dragging it to a different
place. By default this is not possible until it is unfrozen from properties menu of the tool.
3. How to extend Fibonacci arcs:
You can extend Fibonacci arcs in the past and in the future, by selecting one end of the line and
using the left-command of your mouse to extend the line to another chart level.
4. How to change the properties of Fibonacci arcs:
You can change Fibonacci arcs properties either by right-clicking on the main line. Then select
"Properties Fibonacci Arcs" from the context menu, and modify properties from the Properties
window,
or by clicking the icon "Show Active Objects"
in order to choose the Properties window from
there
You can save the new properties as default properties to activate them each time you will use this
graphic tool by pressing "Save As Default", or you can apply these properties only to the active
chart window by pressing "OK".
If you want to cancel the operation and return to the default properties, press "Cancel"
5. How to copy Fibonacci arcs:
You can copy and paste Fibonacci arcs by right-clicking on the instrument you'd like to copy and
select: Copy Fibonacci arcs
A new similar instrument will automatically appear on the chart.
6. How to delete Fibonacci arcs:
You can remove Fibonacci arcs either by right-clicking on them and select: Delete Fibonacci arcs.
Or by using the "Clear all tools" icon
(See section: Remove Graphic Instruments).
Trade Interceptor Charting 4.0 is a trading support application developed by Riflexo Ltd - Copyright ©Riflexo Ltd 2009
55
Fibonacci Target
You can find all Fibo tools in the Fixed Toolbar:
1. To draw Fibonacci Target:
A. Using the icons of the Fixed Toolbar
- Click on the icon
.
Click on the chart to select the first level of the Fibonacci Target area.
Keep the left command of your mouse pressed to draw the Fib. Target
Release your mouse command when you're finished.
B. Using the Menu Bar
Alternatively, you can select "Tools/Fibonacci Tools/Fibonacci Target" from the Menu Bar and
start drawing one or more retracements.
To disable the function, select "Tools/Fibonacci Tools/Fibonacci Target" again.
The function is automatically disabled when you select another graphic instrument.
2. To move Fibonacci Target:
Just click on the main line to select the tool and drag it to a different place. This option is
possible after you unfreeze the tool form "Properties" box
3. To copy Fibonacci Target:
You can copy and paste Fibonacci Target by right-clicking on the instrument you'd like to
copy and select: Copy Fibonacci Target
A new similar instrument will automatically appear on the chart.
4. To change the properties of Fibonacci Target:
A. You can set your Fibonacci preferences as default properties, in order to apply them each
time you use the study by selecting "Show Active Objects" from the chart's upper left
corner , find your "Fibonacci Target" tool and insert new properties such as add lines,
change line color and style, insert new line level, automatically extend retracements lines.
Then press OK to save the new properties as default settings.
B. Directly from the chart:
Right-click on the tool.
Trade Interceptor Charting 4.0 is a trading support application developed by Riflexo Ltd - Copyright ©Riflexo Ltd 2009
56
Then select "Properties Fibonacci Target" from the context menu.
Modify properties from the Properties window
Click on "Save As Default" if you want these properties to be applied each time you use the
Fibonacci Target, or click on "OK" to apply them only to the current chart window.
To ignore properties modifications and go back to the default settings, press "Cancel".
5. To delete Fibonacci Target:
You can remove Fibonacci Target either by right-clicking on them and select: Delete
Fibonacci Target.
Or by using the "Clear all tools" icon
(See section: Remove Graphic Instruments)
Fibonacci Time Zones
You can find all Fibo tools in the Fixed Toolbar:
1. To draw Fibonacci Time Zones:
A. Using the icons of the Fixed Toolbar
- Click on the icon
.
Click on the chart to select the first level of the Fibonacci Time Zones area.
Keep the left command of your mouse pressed to draw the Fib. Time Zones.
Release your mouse command when you're finished.
B. Using the Menu Bar
Alternatively, you can select "Tools/Fibonacci Tools/Fibonacci Time Zones" from the Menu Bar
and start drawing one or more retracements.
To disable the function, select "Tools/Fibonacci Tools/Fibonacci Time Zones" again.
The function is automatically disabled when you select another graphic instrument.
2. To move Fibonacci Time Zones:
Just click on of the time lines to select the tool and drag it to a different place or change lines
places( by moving the first or second time line). This option is possible after you unfreeze the tool
form "Properties" box
Trade Interceptor Charting 4.0 is a trading support application developed by Riflexo Ltd - Copyright ©Riflexo Ltd 2009
57
3. To copy Fibonacci Time Zones:
You can copy and paste Fibonacci Time Zones by right-clicking on the instrument you'd like to
copy and select: Copy Fibonacci Time Zones
A new similar instrument will automatically appear on the chart.
4. To change the properties of Fibonacci Time Zones:
A. You can set your Fibonacci preferences as default properties, in order to apply them each time
you use the study by selecting "Show Active Objects" from the chart's upper left corner .
B. Directly from the chart:
Right-click on the tool.
Then select "Properties Fibonacci Time Zone" from the context menu.
Modify properties from the Properties window
Click on "Save As Default" if you want these properties to be applied each time you use the
Fibonacci Time Zones, or click on "OK" to apply them only to the current chart window.
To ignore properties modifications and go back to the default settings, press "Cancel".
5. To delete Fibonacci Time Zones:
You can remove Fibonacci Time Zones either by right-clicking on them and select: Delete
Fibonacci Time Zones.
Or by using the "Clear all tools" icon
(See section: Remove Graphic Instruments)
Gann Fan
1. To draw Gann Fan:
A.. Using the icons of the Fixed Toolbar:
To draw Gann Fan click on the icon
-Click on the chart where you'd like the fan to start
-Keep the left command of your mouse pressed to draw the line to the end point of the fan
-Release your mouse command when you're finished
- Gann Fan will automatically be drawn
B. Using the Menu Bar
Alternatively, you can select "Tools/Angles/Gann Fan" from the Menu Bar and start drawing
the angles.
To disable the function, select "Tools/Angles/Gann Fan".
The function is automatically disabled when you select another graphic instrument.
2. To move Gann Fan:
- simply click on one of the fan lines and drag it to a different place of the chart. This is not default
option, so you need to unfreeze the tool when you enter "Properties" box
3. To copy Gann Fan:
Trade Interceptor Charting 4.0 is a trading support application developed by Riflexo Ltd - Copyright ©Riflexo Ltd 2009
58
You can copy and paste Gann Fan by right-clicking on the instrument you'd like to copy and
select: Copy Gann Fan
A new similar instrument will automatically appear on the chart.
4. To delete Gann Fan:
You can remove Gann Fan either by right-clicking on them and select: Delete Gann Fan.
Or by using the "Clear all tools" icon
(See section: Remove Graphic Instruments)
5. To change the properties of Gann Fan:
To see how to change properties, go to section: Change Tools Properties.
Gann Angle Lines
This section explains how to:
- draw Angle lines
- move Angle lines
- extend Angle lines
- remove Angle lines
To see how to change Angle lines' properties, go to section: Change Tools Properties
1. How to draw Angle Lines:
A. Using the icons of the Fixed Toolbar:
- To draw angle lines, click on the icon
and then click on the icon of Angle Lines
you may click on the chart where you'd like the angle lines to start.
Keep the left command of your mouse pressed to draw the lines.
Release your mouse command when you've drawn the angle lines.
. After that
B. Using the Menu Bar:
Alternatively, you can select "Tools/Angles/Angle Lines" from the Menu Bar and start drawing one or
more studies.
To disable the function, select "Tools/Angles/Angle Lines" again.
The function is automatically disabled when you select another graphic instrument.
2. How to move Angle Lines:
You can move Angle lines on a chart by simply selecting the main line and dragging it to a different
place.
3. How to extend Gann Angle Lines:
You can extend Angle Lines from one end or the other, by selecting one of the main line's ends and
Trade Interceptor Charting 4.0 is a trading support application developed by Riflexo Ltd - Copyright ©Riflexo Ltd 2009
59
keeping the left-command of your mouse pressed to extend the lines to another chart level.
4. To copy Gann Angle lines:
You can copy and paste Gann Angle lines by right-clicking on the instrument you'd like to copy and
select: Copy Angle Lines
A new similar instrument will automatically appear on the chart.
5. To delete Gann Angle lines:
You can remove Angle Lines either by right-clicking on them and select: Delete Angle Lines.
Or by using the "Clear all tools" icon
(See section: Remove Graphic Instruments).
Gann Lines
This section explains how to:
- draw Gann lines
- move Gann lines
- copy Gann lines
- remove Gann lines
To see how to change Gann lines' properties, go to section: Change Tools Properties
1. How to draw Gann Lines:
A. Using the icons of the Fixed Toolbar:
- To draw Gann lines, click on the icon
and then click on the icon of Gann Lines
you may click on the chart where you'd like the angle lines to start.
Keep the left command of your mouse pressed to draw the lines.
Release your mouse command when you've drawn the angle lines.
. After that
B. Using the Menu Bar:
Alternatively, you can select "Tools/Angles/Gann Lines" from the Menu Bar and start drawing one or
more studies.
To disable the function, select "Tools/Angles/Gann Lines" again.
The function is automatically disabled when you select another graphic instrument.
2. How to move Gann Lines:
You can move Gann lines on a chart by simply selecting the main line and dragging it to a different
place. This option is possible after you unfreeze the tool form "Properties" box
3. To copy Gann Lines:
Trade Interceptor Charting 4.0 is a trading support application developed by Riflexo Ltd - Copyright ©Riflexo Ltd 2009
60
You can copy and paste Gann Lines by right-clicking on the instrument you'd like to copy and select:
Copy Gann Lines
A new similar instrument will automatically appear on the chart.
4. To delete Gann Lines:
You can remove Gann Lines either by right-clicking on them and select: Delete Gann Lines.
Or by using the "Clear all tools" icon
(See section: Remove Graphic Instruments).
Graphic Objects
Graphic objects available in Trade Interceptor Charting 4.0 are:
- Buy and Sell signals
- Custom Text
- Rectangle
- Ellipse
- Triangle
- Arrow Line
- Segment
To find out more about these graphic tools, click on the appropriate link in the above list.
See also sections:
- Graphic Studies
- Graphic Tools
Add Buy and Sell signals
A. Using the icons of the Fixed Toolbar:
To add up- or down arrow, click once on one of the icons
or
located in graphic objects' menu:
Trade Interceptor Charting 4.0 is a trading support application developed by Riflexo Ltd - Copyright ©Riflexo Ltd 2009
61
Then click on the chart where you'd like the signal to be drawn
B. Using the Menu Bar
Alternatively, you can select "Tools/Objects/Arrow Up" or "Tools/Objects/Arrow Down" from the
Menu Bar and start drawing arrows.
To disable the function, select "Tools/Objects/Arrow Up" or "Tools/Objects/Arrows Down" again.
The function is automatically disabled when you select another graphic instrument.
You can move buy and sell signals by selecting them and dragging them to another chart area.
By default this is not possible until it is unfrozen from properties menu of the tool.
You can copy an instrument by right-clicking on it and select: Copy instrument
There are 2 ways to remove buy or sell signals, see section: Remove Graphic Instruments
To see how to change objects properties, go to section: Change Tools Properties.
Add Custom Text
To add text to charts and indicators:
A. Using the icons in the graphic objects menu of the Fixed Toolbar:
-
click on the icon
- select a point on the charts panel
- enter your text in the text box
- select the font color, style and size
- select your text background
- press the "ok" button to confirm the operation, or press the "cancel" button to cancel the
operation.
B. Using the Menu Bar
Alternatively, you can select "Tools/Objects/Custom Text" from the Menu Bar and start typing
text annotations.
Trade Interceptor Charting 4.0 is a trading support application developed by Riflexo Ltd - Copyright ©Riflexo Ltd 2009
62
To disable the function, select "Tools/Objects/Custom Text" again.
The function is automatically disabled when you select another graphic instrument.
You can move text by selecting the text area and dragging it to a different chart area. By
default this is not possible until it is unfrozen from properties menu of the tool.
You can copy an instrument by right-clicking on it and select: Copy Custom Text
There are 2 ways to remove text from charts and indicators, see section: Remove Graphic
Instruments
To change text properties, go to section: Change Tools Properties.
Add Rectangle
1. To draw rectangles:
A. Using the icons in the graphic objects menu of the Fixed Toolbar:
- To draw a rectangle:
Click on the icon
.
Click on the chart to start drawing the rectangle.
Keep the left command of your mouse pressed to draw the rectangle.
Move your mouse to define the rectangle area.
Release the mouse command to confirm the rectangle area.
B. Using the Menu Bar
Alternatively, you can select "Tools/Objects/Rectangle" from the Menu Bar and start drawing the
rectangle
To disable the function, select "Tools/Objects/Rectangle" again.
The function is automatically disabled when you select another graphic instrument.
Trade Interceptor Charting 4.0 is a trading support application developed by Riflexo Ltd - Copyright ©Riflexo Ltd 2009
63
2. To move rectangles:
Just click on the rectangle area and drag it to a different place. By default this is not possible until it is
unfrozen from properties menu of the tool.
3. To copy a rectangle:
Right-click on it and select: Copy Rectangle
4. To remove rectangles:
There are 2 ways to remove rectangles. See section: Remove Graphic Instruments
5. To change objects properties, see section: Change Tools Properties
Add Ellipse
1. To draw ellipses:
A. Using the icons in the graphic objects menu of the Fixed Toolbar:
- To draw an ellipse:
Click on the icon
.
Click on the chart to start drawing the ellipse.
Keep the left command of your mouse pressed to draw the ellipse.
Move your mouse to define the ellipse area.
Release the mouse command to confirm the ellipse area.
Trade Interceptor Charting 4.0 is a trading support application developed by Riflexo Ltd - Copyright ©Riflexo Ltd 2009
64
B. Using the Menu Bar
Alternatively, you can select "Tools/Objects/Ellipse" from the Menu Bar and start drawing arrows.
To disable the function, select "Tools/Objects/Ellipse" again.
The function is automatically disabled when you select another graphic instrument.
2. To move an ellipse:
Just click on the object area and drag it to a different place. By default this is not possible until it is
unfrozen from properties menu of the tool.
3. To copy an ellipse:
Right-click on it and select: Copy Ellipse
4. To remove an ellipse:
There are 2 ways to remove ellipses. See section Remove Graphic Instruments
5. To change objects properties, see section: Change Tools Properties
Add Triangle
1. To draw triangles:
A. Using the icons in the graphic objects menu of the Fixed Toolbar:
Trade Interceptor Charting 4.0 is a trading support application developed by Riflexo Ltd - Copyright ©Riflexo Ltd 2009
65
- To draw a triangle:
Click on the icon
.
Click once on the chart to start drawing the triangle.
Move your mouse on the chart to the second angle point of the triangle and click to confirm the
second angle.
Move your mouse to define the third angle and finish drawing the triangle. Click again to confirm the
object shape.
B. Using the Menu Bar
Alternatively, you can select "Tools/Objects/Triangle" from the Menu Bar and start drawing arrows.
To disable the function, select "Tools/Objects/Triangle" again.
The function is automatically disabled when you select another graphic instrument.
2. To move an ellipse:
Just click on the object area and drag it to a different place. By default this is not possible until it is
unfrozen from properties menu of the tool.
3. To copy an ellipse:
Right-click on it and select: Copy Triangle
4. To remove an ellipse:
There are 2 ways to remove triangle. See section Remove Graphic Instruments
5. To change objects properties, see section: Change Tools Properties
Add Arrow Line
1. To draw Arrow Line:
A. Using the icons in the graphic objects menu of the Fixed Toolbar:
Trade Interceptor Charting 4.0 is a trading support application developed by Riflexo Ltd - Copyright ©Riflexo Ltd 2009
66
- To draw an arrow line:
Click on the icon
.
Click on the chart to start drawing the arrow line.
Keep the left command of your mouse pressed to draw the arrow.
Move your mouse to define the pointing direction and length of the arrow.
Release the mouse command to confirm the arrow line.
B. Using the Menu Bar
Alternatively, you can select "Tools/Objects/Arrow Line" from the Menu Bar and start drawing the
arrow
To disable the function, select "Tools/Objects/Arrow Line" again.
The function is automatically disabled when you select another graphic instrument.
2. To move Arrow Line:
Just click on the arrow line and drag it to a different place. By default this is not possible until it is
unfrozen from properties menu of the tool.
3. To copy Arrow Line:
Right-click on it and select: Copy Arrow Line
4. To remove Arrow Line:
There are 2 ways to remove arrow lines. See section: Remove Graphic Instruments
5. To change objects properties, see section: Change Tools Properties
Add Segment
1. To draw a Segment:
A. Using the icons in the graphic objects menu of the Fixed Toolbar:
Trade Interceptor Charting 4.0 is a trading support application developed by Riflexo Ltd - Copyright ©Riflexo Ltd 2009
67
- To draw a segment:
Click on the icon
.
Click on the chart to start drawing the segment.
Keep the left command of your mouse pressed to draw the line.
Move your mouse to define the angle and length of the segment line.
Release the mouse command to confirm the segment line.
You can repeat this unlimited times so that you can custom draw possible formation of price patterns
and so on.
B. Using the Menu Bar
Alternatively, you can select "Tools/Objects/Segment" from the Menu Bar and start drawing the arrow
To disable the function, select "Tools/Objects/Segment" again.
The function is automatically disabled when you select another graphic instrument.
2. To move a Segment:
Just click on the segment and drag it to a different place. By default this is not possible until it is
unfrozen from properties menu of the tool.
3. To copy a Segment:
Right-click on it and select: Copy Segment
4. To remove a Segment:
There are 2 ways to remove segments. See section: Remove Graphic Instruments
5. To change objects properties, see section: Change Tools Properties
Trade Interceptor Charting 4.0 is a trading support application developed by Riflexo Ltd - Copyright ©Riflexo Ltd 2009
68
INDICATORS
Indicators list
Trade Interceptor Charting 4.0 offers a series of pre-programmed indicators which you can
easily insert, enlarge, remove, copy and customize.
List of pre-programmed indicators included in the current application version:
- ADX
- ADXR
- Accumulation Distribution Line(ADL)
- Adaptive Price Zone(APZ)
- Alligator
- Aroon
- Aroon Oscillator
- Automatic Trend Line(beta)
- Awesome
- ATR (Average True Range)
- Balance of Power(BOP)
- Bollinger Bands
- Bollinger Bandwidth
- Bollinger Percent
- CMO
- Commodity Channel Index
- DMI
- Darvas Box
- Detrended Price Oscillator
- Donchian Channel
- Exponential Moving Average
- Fisher Transform
- High Low Bands
- Index Builder
- Keltner Bands
- Keltner Channel
- Linear Regression Forecast
- Linear Regression Intercept
- Linear Regression Squared
- Linear Regression Slope
- Lineary Weight MA
- MACD
- Mass Index
- Momentum
- Momentum Oscillator
- Money Flow Index
- Moving Average Envelope
- Negative Volume Index
- On Balance Volume (OBV)
- Parabolic SAR
- Performance Index
- Pivot Points
- Positive Volume Index
- Price ROC
- Relative Strength Index
- Simple Moving Average
- Smoothed Moving Average
- Standard Deviation
- Stochastic Oscillator
- Time series Moving Average
- Tip Up
- Tip Down
- Tip Center
- Trade Volume Index
- TrendRisk Bands
- TrendRisk Stop Bands
- Triangular Moving Average
- TRIX
- Ultimate Oscillator
- Variable Moving Average
- VIDYA Moving Average
- Volume
- Volume Oscillator
- Volume ROC
- Weighted Moving Average
- Williams %R
- Zig Zag
Trade Interceptor Charting 4.0 is a trading support application developed by Riflexo Ltd - Copyright ©Riflexo Ltd 2009
69
Add Indicators
To add indicators to the Charts Panel there are 3 major options:
1. Click the icon
in the Fixed Toolbar to open the "Add Indicator" window and choose among
groups of indicators the one you want.
2. Open the Indicators drop-down menu, by clicking on "Indicators" tab located on the Menu Bar.
Then select an indicator from the list and it will be automatically inserted on the Charts Panel.
Trade Interceptor Charting 4.0 is a trading support application developed by Riflexo Ltd - Copyright ©Riflexo Ltd 2009
70
3. To right-click on the chart and select "Add Indicator" from the context menu
Note: When adding indicators in multi-time frame, server may impose a limit on the time series
requested by you. If that limit is exceeded, an "Insufficient bandwidth" message is displayed.
Indicators using the exceeding time series as source would not be calculated.
Example:
You can have a setup with one currency with two moving averages on higher timescales. This equals
to three time series for this setup. If you open four such setups in four windows, this means they are
using 12 time series requests. Now, assuming 13 request limit, if you open another window with this
Trade Interceptor Charting 4.0 is a trading support application developed by Riflexo Ltd - Copyright ©Riflexo Ltd 2009
71
setup, some of the indicators would not be calculated, and "Insufficient bandwidth" message on the
chart would indicate that the request limit is exceeded.
Note: Recently the application's request limit for bandwidth was increased to 64 which means that the
above commentaries remain just as an example. With the current time series request limit you can
have far more charts with multiple time series.
See also sections:
- Remove Indicators
- Change Indicators Properties
- Enlarge Indicators
- Multi-Time Frame Indicators and Indicator Groups
Remove Indicators
There are 2 ways to remove indicators from the Charts Panel:
1. Right-click on the indicator you'd like to delete and select "Delete + Indicator name".
2. Click on icon
located on the upper left corner of the chart, select and delete the desired indicator
See also sections:
- Add Indicators
Trade Interceptor Charting 4.0 is a trading support application developed by Riflexo Ltd - Copyright ©Riflexo Ltd 2009
72
- Change Indicators Properties
- Enlarge indicators
Change Indicators Properties
There are 2 ways to change indicators properties.
1- Using the Context menu:
- place your mouse on the indicator
- open the right-click context menu and select "Properties+Indicator name"
- modify properties from the properties box (such as Period, Source, Signal Period, Style, Color, etc.)
- press "Save As Default" if you want to activate the new properties each time you will use this
indicator
- or press "OK" to apply these properties only to the active chart window
- press "Cancel" to ignore modifications and return to the default settings.
2- Using the Color Preferences window
Properties can also be changed using the Color Preferences/Indicators tab.
See section: Setting Indicators Colors and Properties from the Color Preferences window
3- Using the "Active Objects" window:
Properties of any indicator or graphic tool are accessible in "Active Objects" window through
instantly when you select one
icon
See also sections:
- Add Indicators
- Resize/Enlarge/Close indicators
- Copy Indicator
-Multi-Time Frame Indicators and Indicator Groups
Copy Indicator
You can copy an indicator from one chart pane to another, or copy it to a new pane, by right-clicking
on an indicator to open the context menu:
Trade Interceptor Charting 4.0 is a trading support application developed by Riflexo Ltd - Copyright ©Riflexo Ltd 2009
73
You should first select "Copy+ indicator name" and then select the pane where you'd like the indicator
to be copied (either an existing chart/indicator pane, or a new pane).
See also sections:
- Add Indicators
- Resize/Enlarge/Close indicators
- Change indicators properties
Trade Interceptor Charting 4.0 is a trading support application developed by Riflexo Ltd - Copyright ©Riflexo Ltd 2009
74
TRENDRISK ANALYTICS
TrendRisk Analytics
No one on the market can be sure whether prices are now going to go up or down. Anything can
happen at any time. Whether there is a trend or not.
In fact there isn't a perfect analysis system.
What TrendRisk gives you is the possibility to see the future from a probability point of view.
TrendRisk model calculates ex-ante (before it happens) where the probabilities are that the current
trend will reverse, and at which precise level (Trend Inversion Point T.I.P)
In other words, TrendRisk gives you very stable risk-reward levels, which allow you to know today
where your risk will be tomorrow.
So it gives you a unique forecasting edge, putting the odds on your side.
This drastically reduces you risk to loose on the market, and consequently increases your chances to
win.
That's why TrendRisk has been used for over 13 years in banks and major financial institutions by
professional traders.
TrendRisk analytics offer 3 different analysis instruments:
- TrendRisk indicator, also called "TrendRisk Bands" and "TrendRisk Stop Bands"
- TrendRisk Scanner
- TrendRisk Analysis
TrendRisk Indicator
TrendRisk Indicator bands are those you see by default on Trade Interceptor Charting 4.0 price
charts.
The indicator is based on TrendRiskTM mathematical model and composed of 2 series of bands and
TIP center (a central line in-between):
- TrendRisk Bands
- TrendRisk Stop Bands
- TrendRisk TIP Center
Trade Interceptor Charting 4.0 is a trading support application developed by Riflexo Ltd - Copyright ©Riflexo Ltd 2009
75
Example showing how TrendRisk indicator bands can help you forecast trend inversions:
TrendRisk Bands (in green on the above chart) are made of a series of points called Trend Inversion
Points (or TIPs)
TrendRisk Stop Bands (in red on the chart) are made of a series of recommended Stop levels.
TrendRisk TIP Center (in grey dashed line) is made of a series of points in the center between TIP Up
and TIP Down
Trend Inversion Points or TIPs are the levels, which are calculated ex-ante by TrendRisk Model,
where the trend has the highest probability to reverse. So they give traders the possibility to anticipate
the highest risk level of a trend inversion, on any time horizon.
TrendRisk Bands are made of a series of Trend Inversion Points, forming the 2 dotted green
lines:
- the up line is made of a series of TIP Up
- the down line is made of a series of TIP Down
TrendRisk Stop Bands are made of a series of recommended Stop levels, forming the 2
dashed red lines.
TrendRisk TIP Center is made of a series of equilibrium points between TIP Up and TIP Down.
The TIP Center is the point where supply and demand are in perfect balance
Note that TrendRisk is not a Trading System - and therefore it doesn't give you buying or selling
signals - but a Decisional Support System helping you identify trend inversion and high risk/reward
levels.
Trade Interceptor Charting 4.0 is a trading support application developed by Riflexo Ltd - Copyright ©Riflexo Ltd 2009
76
In an up trend situation:
- the TIP Up are the levels under which the up trend enters a bearish correction phase
- the TIP Down are the levels under which the up trend is fully reversing to bearish.
In an down trend situation:
- the TIP Down are the levels above which the down trend enters a bullish correction phase
- the TIP Up are the levels above which the down trend is fully reversing to bullish.
N.B.: Note that according to TrendRisk Model, a trend inversion only occurs when 3 consecutive bars
under or above the Trend Inversion Points have been registered.
More details about TrendRisk Model can be found in sections: TrendRisk Scanner and TrendRisk
Analysis
TrendRisk Scanner
TrendRisk Scanner is displayed on the third tab of the Quotes & Analytics window.
To start visualizing data in the Scanner Table, click on the "Refresh" button at the bottom right of the
window.
TrendRisk Scanner is a powerful risk management tool which identifies the highest risk/reward
trading opportunities according to TrendRisk Model's calculations.
It shows you the Reward/Risk ratio applicable for each currency, and the expected target price, on
each time frame. It also gives you recommended Stop levels.
Trade Interceptor Charting 4.0 is a trading support application developed by Riflexo Ltd - Copyright ©Riflexo Ltd 2009
77
You can change the sorting order of the table (if you want to see for example the highest risk/reward
positions, or if you want to sort the table by security name, etc.) by simply clicking on a column's
header. To reverse the sorting order, click again on the header.
You can also use the "Timescale" or the "Feed" filters at the top of the window to view only selected
data in the table.
You can open a chart directly from TR Scanner table:
- either by double clicking on a security row (in that case the chart will open in the Master Chart
Window)
- or by right-clicking on a security row and selecting "+ chart" (in that case the chart will be created in
a New Chart Window)
You can also insert a quote directly from the scanner to the Streaming Quote Table by rightclicking on it and selecting "Add to Streaming Quotes".
Example of how TrendRisk Scanner can help you identify the highest risk/reward positions:
In this example you can see how we used TrendRisk Scanner to identify the highest risk/reward
trading opportunities.
We chose to open the chart of the EUR/CHF on a 15 min. time frame, which was given by TrendRisk
Model as one of the highest risk/reward trading opportunities.
You can see on the chart that the price is very close to the Trend Inversion Point or TIP up. If you
decide to sell at that level (carefully watching the system and following TrendRisk Analysis
Trade Interceptor Charting 4.0 is a trading support application developed by Riflexo Ltd - Copyright ©Riflexo Ltd 2009
78
commentaries) your chances that the momentum will be over and the price will go down again - with
target at the TIP down level of 1.5150 - are very high.
As you can see on the second picture below, a bit more than an hour later, the price has gone down
and is following its way to a new target at 1.5153 and the R/R ratio has become very low.
So, to summarize, the highest R/R opportunities given by TrendRisk Scanner ratio are either:
- when the last price is close to the TIP down in an up trend situation
- or when the last price is close to the TIP up in a down trend situation
The way the model calculates the highest R/R opportunities is by giving you the ratio:
Reward = Target - Last Price
Risk
Last Price - StopTIP
For example, in a Uptrend situation, if the last price is 1.3100, and the target price calculated by
TrendRisk is 1.3130, and the StopTIP down - which is the level calculated by TrendRisk Model under
which the trend would reverse - is 1.3000, then the Risk/Reward ratio in this case will be low:
1.3130 - 1.3100 = 0.3
1.3100 - 1.3000
See also section: TrendRisk Analysis and TrendRisk Bands
Trade Interceptor Charting 4.0 is a trading support application developed by Riflexo Ltd - Copyright ©Riflexo Ltd 2009
79
TrendRisk Analysis
TrendRisk Analysis are displayed on the 4th tab of the Quotes & Analytics window
By default, the analysis shown on this tab correspond to the currency and timescale of the Master
Chart Window (which you can recognize from the icon
shown at the bottom right of the window.)
To visualize the analysis corresponding to other chart windows click on a chart window and go to
TrendRisk tab of Quotes & Analytics window.
This will automatically refresh the commentary, which will display the latest analysis update of the
requested timescale for the requested currency.
(To see how to open more than one chart window, see section New Chart Window).
TrendRisk Analysis shows you ongoing market commentaries based on TrendRisk Model, about the
current and future trend situation, for each timescale.
They give you all the necessary information to understand the use of TrendRisk system and have to
be considered as a support tool for the use of TrendRisk Bands and Trend Inversion Points.
Combined with TrendRisk Bands, this multi time-frame analytical tool provides you with an important
edge by giving you an instant snap-shot of a currency situation on various time horizons (i.e. TR
Bands and Analysis can show you simultaneously a bearish trend in the short term and a bullish trend
in the long term).
Trade Interceptor Charting 4.0 is a trading support application developed by Riflexo Ltd - Copyright ©Riflexo Ltd 2009
80
Each analysis is composed of:
1- Data Summary:
This summary includes:
- Last update time and date of the analysis
- Close price (at the last analysis update)
- Trend Inversion Point level (TIP Up or TIP Down depending on the trend direction)
- Trend Direction
- Target (targets are constantly recalculated by the system on each last price update)
2- Long Term Forecast:
This section gives you.
- The primary and secondary trend directions
- The TIP Up and TIP Down levels
- TrendRisk long term forecast commentary
3 - Short Term Forecast:
This part gives you a brief commentary about the expected market move in the short term.
Note that each analysis has to be related to the selected time horizon (i.e. a short term forecast on a
5 min. timescale will have to be related to the next price updates, whereas a long term forecast on a
weekly timescale will refer to several weeks’ market moves).
Trade Interceptor Charting 4.0 is a trading support application developed by Riflexo Ltd - Copyright ©Riflexo Ltd 2009
81
Add Alarm
The Alarm feature of the platform allows you to put various types of conditions under which an alarm
should activate
Alarm window is divided by two modules. The upper one is for adding/removing the alarm itself. You
can even place a message name for the alarm.
The lower pane is dedicated for the condition/s for that alarm.
For example you may place 2 conditions:
- EUR/USD > Support/Resistance Line 1.45355
- RSI> 30
This way the alarm will be activated only if both conditions fulfill
Trade Interceptor Charting 4.0 is a trading support application developed by Riflexo Ltd - Copyright ©Riflexo Ltd 2009
82
TRADING
Paper Account Management
Paper Trading Control Panel
You can click on the icon
in the Fixed Toolbar in order to open the Paper Trading Control Panel
On this panel you can watch the historical trades that you made as well as current active orders and
remove any order from the list.
With a right-click on a row of active order you can choose to:
- Place new order - for the same currency pair in the selected row
- Modify order - place or change S/L and T/P
- Close order - you close the order in the selected row
- Close all orders - you can close all active orders
- Consolidate- you can combine orders of one security with different size and direction in order to
have a single net position
- Profit - show profit in different ways
- Customize columns - change width and order of columns as well as remove/add columns
Trade Interceptor Charting 4.0 is a trading support application developed by Riflexo Ltd - Copyright ©Riflexo Ltd 2009
83
See also other related sections:
- Paper Accounts Management
- Trading Intelligence
- Paper Trading in the Past
Trading Intelligence
Trading intelligence gives you detailed information and statistics on all your trades in any paper
trading account you use, as well as their performance.
It is accessible through the "Trade" tab in Menu Bar.
You can see several different representations of trading performance:
- Summary( see image above)- overall trading performance data
Trade Interceptor Charting 4.0 is a trading support application developed by Riflexo Ltd - Copyright ©Riflexo Ltd 2009
84
- Statistics- win and loss statistical data
- Equity Line- graphical representation of the value of equity (in absolute numbers) relative to the
number of trades
-Trade-By-Trade- graphical representation of profit/loss (in Pip value) on each trade, relative to the
number of trades
Trade Interceptor Charting 4.0 is a trading support application developed by Riflexo Ltd - Copyright ©Riflexo Ltd 2009
85
The information about all trades can be exported easily and instantly by clicking on the "Export to
Clipboard" button. Later you may paste the data in a Microsoft Excel spreadsheet, for example.
See also other related sections:
- Paper Accounts Management
- Paper Trading Control Panel
- Paper Trading in the Past
Paper Trading in the Past
This function is unique for Trade Interceptor 4.0 and offers the rare opportunity for faster learning
process in trading. You can learn from simulated trading on different signals, strategies and systems
with a fast pace, since the chart is replayed period-by-period no matter what time frame you have
chosen. For example trades made on daily chart will reveal in seconds since each new daily candle
will appear in a few seconds, (depending on the replay speed you have adjusted).
You can access the Simulation Trading Configuration panel by clicking on the icon
menu "Trade" of the Menu Bar
located in
In this configuration panel (see above image) you can:
- Set the initial interval for historical data playback
- Make settings for the chart auto advance
- Synchronize the time intervals for two or more charts. Thus you may follow a strategy on different
time scales for example.
When you click OK, the Simulated Trading Control Panel opens up and you are ready to start
playback and placing orders. Moreover Paper Trading Control Panel docks at the bottom of the chart
so that you see your trades as well as here in the square box of the Simulated Trading Control Panel
Trade Interceptor Charting 4.0 is a trading support application developed by Riflexo Ltd - Copyright ©Riflexo Ltd 2009
86
With this control panel you can:
- Replay and pause the chart's auto play
- Adjust the auto play speed ( i.e. faster or slower appearance of each period)
- Place and close orders
- Watch performance of the opened order in the control panel screen (the square in the above
image). The P/L is presented in PIP value
- Get a report for the booked trades. See Trading Intelligence
See also other related sections:
- Paper Accounts Management
- Trading Intelligence
- Paper Trading Control Panel
- Multi-Time Frame Indicators and Indicator Groups
Trade Interceptor Charting 4.0 is a trading support application developed by Riflexo Ltd - Copyright ©Riflexo Ltd 2009
87
Advanced Trailing Stop Management and Advanced
Stop
This exclusive feature of Trade Interceptor Charting 4.0 is one of the most advanced and
comprehensive S/L (Stop Loss) and T/P (Take Profit) management modules on the market, and
allows you to train exactly like in real trading conditions. The ATM Strategy function is reachable
when you open a "New Order" window.
To the right of ATM Strategy drop-down menu there is a button that allows opening ATM Strategy
Editor.
Trade Interceptor Charting 4.0 is a trading support application developed by Riflexo Ltd - Copyright ©Riflexo Ltd 2009
88
- set a name for the strategy
- place up to 3 different targets( these are separate orders with own S/L and T/P targets which open
simultaneously)
- set different stop loss and take profit targets(in PIP value) for each target
- set a simple trailing stop(if any) for each order
Set advanced stop
- with profit trigger( pip value of profit which will place auto breakeven stop order)
- auto trailing function with up to 3 steps
- set the distance and profit trigger of each auto trail step
Example: Advanced stop on 2 steps may look like this (see the image above):
- 1st step- stop loss 15, profit trigger 5, frequency 1
- 2nd step- stop loss 5, profit trigger 10, frequency 1
When an order with these settings is placed then IF price leads the trade with 5 pip profit (profit
trigger 5) the first step of the advanced stop will be triggered and its stop loss will be 15 pips away
from the trigger point, or 10 pips below the opening level.
Trade Interceptor Charting 4.0 is a trading support application developed by Riflexo Ltd - Copyright ©Riflexo Ltd 2009
89
IF price leads the trade to 10 pips profit, the trailing stop from the first step will be already on a level 5
pips below opening price, but the second step trigger (profit trigger 10) will execute the second step.
This will move the trailing stop 5 pips away from the trigger point which is 5 pips above the opening
level.
This is the way to test (see Paper Trading in The Past) which advanced settings for stop and profit
levels best fit your trading style, risk and money management techniques.
Multi-Time Frame Indicators and Indicator Groups
The Multi-Time functionality is one of the most exclusive features on Trade Interceptor Charting 4.0,
which allows to display an indicator with various timeframes on a single chart.
With this feature, you can build an indicator, calculated on 2 or more time scales, depending on your
needs. You can then save this group of Multi-Time Frame (MTF) indicator and load it instantly on any
chart you want. This functionality allows you to have a good perspective view of market conditions on
different time frames from a single chart.
The major way to build multi-time frame indicator is to:
1. Load an indicator through Menu Bar > Indicators> Superior/Inferior
2. Click the tab localized on the right side of Timescale module
3. The Indicator Group Editor will be opened
4. Change Timescale, add indicator in order to create the multi-time frame group. The indicators will
instantly show up
5. Save as default if you want to keep this setup from now on, otherwise click close
6. Close Properties box with OK
Trade Interceptor Charting 4.0 is a trading support application developed by Riflexo Ltd - Copyright ©Riflexo Ltd 2009
90
After you've created the multi-time frame indicator group (see the right image- 5 min, 1h and 4h
timescales) you can load this group instantly on any chart when you click "Load group" button in
"Properties" box of this indicator. This is actually the second means of loading MTF group of an
indicator, to right-click on the indicator and choose "Properties of <indicator name>" then clicking the
above mentioned button" Load group"
See also:
Add indicators
Change Indicators Properties
Paper Trading in The Past
CUSTOMIZE APPLICATION
There are various ways to customize Trade Interceptor Charting's screen
- By using the General Preferences window
- By selecting new color templates
- By creating your own color template
- By modifying indicators style and properties
- By modifying graphic tools style and properties
Trade Interceptor Charting 4.0 is a trading support application developed by Riflexo Ltd - Copyright ©Riflexo Ltd 2009
91
- By personalizing the chart panes grid
- By personalizing the Icons Bar
General User Preferences
You can customize the application and set your personal preferences thanks to the General
Preferences window.
To open the General Preferences Window, select "Options/General Preferences" from the Menu Bar,
located on the Chart Icons Bar, in the bottom right corner of the Chart
or click on the icon
Window.
This window gives you the possibility to:
1. Change the default language:
You can choose between Italian and English languages in General preferences/Main
2. Set various chart options:
You can set these options in General preferences/General
- hide or show the scroll bar at the bottom of the Chart Panel (scroll bar is activated by default)
- activate or disable the auto-scaling functionality (this function is activated by default)
- activate or disable the auto-scrolling functionality to the last bar (this function is activated by default)
Trade Interceptor Charting 4.0 is a trading support application developed by Riflexo Ltd - Copyright ©Riflexo Ltd 2009
92
- show or hide perspective chart on the bottom of the chart window( it is enabled by default)
- hide or show the last values of indicators/oscillators on the vertical-axis, next to the last currency
price (only the last currency price is shown by default)
- hide or draw a horizontal barrier line on last value level (the barrier line is hidden by default)
- activate or disable candlesticks external bordering line (candlesticks are outlined by default)
- show or hide quotes( they are hidden by default)
- hide squashed objects (squashed objects are shown by default)
3. Set your time zone:
From the Time Zone option you can set the software time on New-York time, Central European time,
or GMT time.
4. Set chart background:
From the Charts background option, you can choose between:
- Solid color background (this option is selected by default)
- Grid Shading on Main Chart: selecting this option will activate a 2 color shading pips-based price
axis, only on the main chart
- Grid Shading on All Panes: selecting this option will activate a 2 color shading pips-based price axis
on both the main chart and the indicator panes.
5. Set graphic quality resolution:
From the Graphics option, you can select the "performance" quality resolution to enhance precision
of lines and tools. However, note that when the performance option is activated, some operations
such as scrolling, might become slightly slower.
The "quality" resolution is selected by default
6. Set chart grid options:
You can also personalize the chart grid by choosing General Preferences/ Chart Grid option or Chart
Background
See: Chart Grid
7. Set data values appearance options:
On Data Values option you can choose how data values appear, either at cursor line or at cross hair
Trade Interceptor Charting 4.0 is a trading support application developed by Riflexo Ltd - Copyright ©Riflexo Ltd 2009
93
Color Preferences
The Color Preferences window gives you the possibility to personalize the colors of all the chart
items.
To open the Color Preferences Window, select "Options/Color Preferences" from the Menu Bar, or
right-click on the chart to chose "Load Template
This window displays 4 different areas: Factory color templates, User color templates, color
adjustments through RGB, HSB etc., Preview
1. Setting the colors of the Charting window Area:
To personalize the colors of the chart area:
- first select chart items from the left column,
Trade Interceptor Charting 4.0 is a trading support application developed by Riflexo Ltd - Copyright ©Riflexo Ltd 2009
94
- choose a color for each item, using either the pre-defined color swatches table, or creating your own
color values through the HSB or RGB tabs
- colors are automatically displayed on the chart window to give you an instant preview of the new
color settings
- if you want to save a color skin, press "Save As.." from the "User color templates" area, give a name
to your color template and press "OK" to save it and add it to the templates list.
- if you want to apply the colors you've selected without saving the template, press the "OK" button in
the bottom-right corner of the window
- if you'd like to cancel the operation and go back to the previous color template, just press "Cancel"
You can Rename or Delete a color template by selecting it from the drop-down list and pressing
either the "Rename" or "Remove" button, to instantly update the list.
To apply a custom color skin to a new chart window, either select a template from the list of
Factory Color Templates,or right-click directly on the chart and select the template from the context
menu.
Example: How to retrieve custom color templates using the right-click context menu from the chart
See also section: Context Menus to see how to change indicators and tools properties directly from
the chart panel, through a simple right-click of the mouse.
Trade Interceptor Charting 4.0 is a trading support application developed by Riflexo Ltd - Copyright ©Riflexo Ltd 2009
95
Chart Grid options
To open the Chart grid option, select Options/General Preferences/Chart Grid from the Menu Bar.
The Chart Grid window gives you the possibility to personalize the Charts Panel's grid by selecting
the x and y axis options. Changes can be saved as defaults settings, by clicking on the "Save as
Default" button, or only applied to the current chart window instantly then close the window.
Screen Style
To change your Chart Panels color scheme, you can:
1. Select pre-programmed color skins, by using right-click context menu directly from a
chart
Trade Interceptor Charting 4.0 is a trading support application developed by Riflexo Ltd - Copyright ©Riflexo Ltd 2009
96
Example:
2. Create your own custom color templates:
You can create and save you own color scheme templates (or color skins) and apply them to new
chart windows. This functionality is accessible either by selecting "Options / Color Preferences" from
the main menu bar, or by using the right-click context menu from the charts area (see above image).
From the Color Preferences window, select Axis Text, Background Odd/Even days, Panes
Background etc. from the left column and choose a color for each item, watching the instant preview.
Once a template is made, click on "Save As..." in the "Use Color Templates" area, and give a name to
the new color skin, in order to save it and add it to the color skin drop-down list. You can then apply
custom color skins to new chart windows, by simply selecting a template from the drop-down list.
To apply a custom color skin to a new chart window, either select a template from the drop-down
list of the Color Preferences and press "OK" or right-click directly on the chart and select the template
from the context menu.
See also sections:
- Color Preferences
- General Preferences
Trade Interceptor Charting 4.0 is a trading support application developed by Riflexo Ltd - Copyright ©Riflexo Ltd 2009
97
Personalize Fixed Icons Bar
You can personalize the Fixed Toolbar
By right-clicking on it and selecting the icons groups you want to hide or show on the Fixed Toolbar
(all icons are shown by default)
Messages
This tab provides messages from the application administrator. There are number of cases when it is
reliable and effective to inform you in this window.
Specific issues regarding the application and user accounts can be posted here to each Trade
Interceptor user.
Exit application
To exit the application:
- either close the Quotes & Analytics window
- or select "File/Exit" from the Menu Bar
Trade Interceptor Charting 4.0 is a trading support application developed by Riflexo Ltd - Copyright ©Riflexo Ltd 2009
98