1
1
ATLAS.ti 7
User Guide and Reference
ATLAS.ti 7.1 USER MANUAL
2
ATLAS.ti 7 User Manual
Copyright ©2013 by ATLAS.ti Scientific Software Development GmbH, Berlin. All rights reserved.
Manual Version: 109.20131230. Updated for program version: 7.1.0
Author: Dr. Susanne Friese (QUARC Consulting)
Programming/Design/Layout: Dr. Thomas G. Ringmayr (www.hypertexxt.com)
Copying or duplicating this manual or any part thereof is a violation of applicable law. No part of this manual may be reproduced or
transmitted in any form or by any means, electronic or mechanical, including, but not limited to, photocopying, without written
permission from ATLAS.ti GmbH.
Trademarks: ATLAS.ti is a registered trademark of ATLAS.ti Scientific Software Development GmbH. Adobe Acrobat is a trademark of
Adobe Systems Incorporated; Microsoft, Windows, Excel, and other Microsoft products referenced herein are either trademarks of
Microsoft Corporation in the United States and/or in other countries. Google Earth is a trademark of Google, Inc. All other product
names and any registered and unregistered trademarks mentioned in this document are used for identification purposes only and remain
the exclusive property of their respective owners.
ATLAS.ti 7.1 USER MANUAL
3
Contents
About this Manual....................................................................................................................6
Introduction..............................................................................................................................9
The VISE Principle.............................................................................................................................................................9
Areas of Application........................................................................................................................................................10
Main Concepts and Features.................................................................................................. 13
The Hermeneutic Unit (HU)............................................................................................................................................13
Primary Documents (PD or PDoc)...................................................................................................................................14
Primary Document Families (Data Attributes)..................................................................................................................14
Quotations.....................................................................................................................................................................15
Codes.............................................................................................................................................................................17
Memos...........................................................................................................................................................................18
Families ..........................................................................................................................................................................18
Network Views...............................................................................................................................................................19
Analysis..........................................................................................................................................................................20
Team Tools.....................................................................................................................................................................21
Export.............................................................................................................................................................................22
Other Tools....................................................................................................................................................................24
ATLAS.ti Mobile..............................................................................................................................................................24
Main Steps in Working with ATLAS.ti.....................................................................................25
Data and Project Management.......................................................................................................................................26
The Process.....................................................................................................................................................................26
General Steps when Working with ATLAS.ti...................................................................................................................27
Main Workspace: The HU Editor............................................................................................29
Components of the HU Editor.........................................................................................................................................30
The Object Managers.....................................................................................................................................................36
Primary Document Manager...........................................................................................................................................42
Quotation Manager........................................................................................................................................................45
Code Manager................................................................................................................................................................47
Memo Manager..............................................................................................................................................................50
The Manager Side Panel ................................................................................................................................................51
Data Preparation ................................................................................................................... 58
Starting and Ending an ATLAS.ti Session.........................................................................................................................58
Creating, Opening and Saving a Hermeneutic Unit.........................................................................................................60
Preparing Primary Documents ........................................................................................................................................62
Adding Documents to a Project......................................................................................................................................70
Rearranging and Renumbering PDs................................................................................................................................76
Loading and Navigating Primary Documents..................................................................................................................77
Removing Primary Documents from a Project.................................................................................................................86
ATLAS.ti 7.1 USER MANUAL
4
Data Transcription..........................................................................................................................................................87
Importing Survey Data ...................................................................................................................................................96
Data Management in ATLAS.ti.............................................................................................102
The Document Libraries................................................................................................................................................103
How To Use The Two Libraries.....................................................................................................................................104
Setting Up a New Project..................................................................................................... 108
Setting up Single User Projects......................................................................................................................................109
Setting up Team Projects..............................................................................................................................................109
Migrating ATLAS.ti 5 and 6 Projects ....................................................................................119
Migrating ATLAS.ti 5 and 6 Single-User Projects to ATLAS.ti 7.....................................................................................119
Migrating version 5 and 6 Team Projects to ATLAS.ti 7.................................................................................................121
Project Backup and Transfer.................................................................................................128
Backup Copies..............................................................................................................................................................128
Editing Primary Documents.................................................................................................. 137
User Management................................................................................................................147
Merging Hermeneutic Units................................................................................................. 154
The Data Level - Basic Functions.......................................................................................... 166
Creating Quotations.....................................................................................................................................................166
Creating and working with Textual and PDF Quotations..............................................................................................166
Creating and Working with Graphical Quotations.........................................................................................................171
Creating and Working with Multimedia Quotations......................................................................................................174
Creating and Working with Google Earth Quotations...................................................................................................182
Deleting Quotations.....................................................................................................................................................186
Coding Techniques.......................................................................................................................................................187
Coding PDF documents................................................................................................................................................196
Coding Image documents.............................................................................................................................................198
Coding audio and video documents..............................................................................................................................199
Coding Google Earth documents..................................................................................................................................200
More Coding-Related Functions...................................................................................................................................201
Text Search & Auto Coding..........................................................................................................................................211
The Auto-Coding Tool..................................................................................................................................................219
Family Life............................................................................................................................225
Common Procedures....................................................................................................................................................226
Working with Variables: Primary Document Families............................................................234
Code Families...............................................................................................................................................................240
Memo Families.............................................................................................................................................................242
Working with Memos...........................................................................................................243
Margin Drag & Drop.....................................................................................................................................................249
ATLAS.ti 7.1 USER MANUAL
5
Data Analysis and Theory-Building Tools..............................................................................251
Analysis Tools...............................................................................................................................................................251
Tools for Visualization and Theory Building...................................................................................................................252
The Word Cruncher......................................................................................................................................................253
Query Tool...................................................................................................................................................................258
Super Families...............................................................................................................................................................280
Co-occurrence Tools.....................................................................................................................................................290
Codes-Primary Documents Cross-Tabulation................................................................................................................302
Calculating Inter-Coder Reliability using CAT................................................................................................................304
Network Views.............................................................................................................................................................307
Hypertext.....................................................................................................................................................................352
Special Tools.........................................................................................................................366
The Object Crawler.......................................................................................................................................................366
The HU Explorer...........................................................................................................................................................368
Redundant Coding Analyzer.........................................................................................................................................374
Sorting and Filtering.............................................................................................................378
Generating Output...............................................................................................................385
Output Destinations.....................................................................................................................................................385
Report Layout...............................................................................................................................................................386
Creating Output for the Main Objects..........................................................................................................................388
Creating Reports with the XML Converter....................................................................................................................395
Export & Import................................................................................................................... 405
SPSS Export..................................................................................................................................................................405
Export & Import using XML..........................................................................................................................................413
Exporting the Hermeneutic Unit in XML ......................................................................................................................415
HTML Export................................................................................................................................................................416
Export and Import of Document Attributes (PD Families)..............................................................................................421
Exporting A Mobile Project (iPad App)..........................................................................................................................421
Importing A Mobile Project to ATLAS.ti Desktop .........................................................................................................422
Preference Settings...............................................................................................................424
Appendix..............................................................................................................................455
Useful Resources...........................................................................................................................................................455
Reporting Bugs.............................................................................................................................................................460
Service Packs & Patches – Live Update..........................................................................................................................461
Index....................................................................................................................................465
ATLAS.ti 7.1 USER MANUAL
ABOUT THIS MANUAL
6
About This Manual
This manual describes the concepts and functions of ATLAS.ti 7.
It is not required that you read the manual sequentially from first page to last. Feel
free to skip sections that describe concepts you are already familiar with, jump
directly to sections that describe functions you are interested in, or simply use it as
a reference guide to look up information on certain key features.
For users with no prior knowledge of ATLAS.ti, we do, however, recommend that
you especially read through the first part of this manual in order to become
familiar with the concepts used by ATLAS.ti and to gain an overview of the
available functions. These are the chapters: “The VISE Principle” on page 9,
“Main Concepts and Features” on page 13and “Main Workspace: The HU
Editor” on page 30.
Further, to set up a project, we recommended that you read about the “Main
Steps in Working with ATLAS.ti” on page 26 and “Preparing Primary
Documents” on page 63. For all basic-level work like creating quotations, coding,
and writing memos, consult the chapters under the main heading: “The Data
Level - Basic Functions” on page 166ff. Advanced functions are described under:
“Data Analysis and Theory-Building Tools“ on page 251ff.
The sequence of the chapters follows the steps that are necessary to start and
work on an ATLAS.ti project:
First, the main concepts that ATLAS.ti utilizes are explained; then an overview of
all available tools is provided. These introductory and more theoretically-oriented
parts are followed by more practically-oriented chapters providing step-by-step
instructions. You will learn how to manage your data, how to set up and start a
project, and how to prepare and edit documents.
After a project is set up, the basic functions like coding, text search, auto-coding,
writing memos, etc. become relevant. Conceptual-level functions like the Network
Editor, the Query Tool and Co-occurence Explorer build on the data-level work (at
least in most cases) and are therefore described last.
The chapter “Resources” on page 455 offers some useful advice on how to get
support and where to find further information on the software.
How To Use This Manual
This manual is predominantly intended for:
• Those who have no prior knowledge of ATLAS.ti
• Those who have worked with a previous version, ATLAS.ti 5 or 6.
ATLAS.ti 7.1 USER MANUAL
ABOUT THIS MANUAL
7
There is no need for users with prior knowledge to read through the entire
manual. However, we highly recommend that they still read the following
sections/chapters:
• “Main Concepts and Features“ on page 13.
• “Main Workspace: The HU Editor“ on page 30.
• “ Supported Formats“ on page 64.
• “Data Management in ATLAS.ti“ on page 103.
• “Setting Up a New Project“ on page 109.
• “Project Backup and Transfer“ on page 128.
• “Coding Techniques“ on page 187.
• “Family Life“ on page 225.
• “Working with Memos“ on page 243.
• “Data Analysis and Theory-Building Tools“ on page 251.
• “Network Views“ on page 307,
• “Creating Reports with the XML Converter“ on page 395.
Some general familiarity with concepts and procedures relating to the Windows
operating system and computing in general (e. g., files, folders, paths) is
assumed.
This is largely a technical document. You should not expect any detailed
discussion of methodological aspects of qualitative research other than
cursory statements from this manual.
To those seeking in-depth instruction on the methodological aspects and
how to put ATLAS.ti to practical use in an actual research/project
environment, we highly recommend the following book: Dr. Susanne Friese:
Qualitative Data Analysis with ATLAS.ti. Sage, 2011. More information
from http://www.atlasti.com/frieseqda.html.
Also, the ATLAS.ti Training Center offers a full complement of dedicated
ATLAS.ti training events worldwide, both through online courses and face-toface seminars in nearly all parts of the world. Visit the Training Center at
http://training.atlasti.com.
Manual Conventions
Notes
Margin notes:
Margin notes
contain important
observations of a
general nature.
This paragraph contains a general note that may be of interest or worth
remembering.
ATLAS.ti 7.1 USER MANUAL
ABOUT THIS MANUAL
8
Tip/Recommendation
This paragraph contains a tip or recommendation, i. e., something we
advise you to make a practice in your work.
Caution
This paragraph contains a warning or caution, i. e., something you should
avoid doing or be aware of consequences beyond the action itself.
Instruction
This paragraph contains an instruction, i. e., something you should follow
along and/or execute in the program.
Additional resources/Suggested further reading
Additional information about this topic is available elsewhere, usually online
from our web site or some other place on the Web.
ATLAS.ti 7.1 USER MANUAL
INTRODUCTION
9
Introduction
ATLAS.ti is a powerful workbench for the qualitative analysis of large bodies of
textual, graphical, audio, and video data. It offers a variety of tools for
accomplishing the tasks associated with any systematic approach to
unstructured data, i. e., data that cannot be meaningfully analyzed by formal,
statistical approaches. In the course of such a qualitative analysis, ATLAS.ti
helps you to explore the complex phenomena hidden in your data. For coping
with the inherent complexity of the tasks and the data, ATLAS.ti offers a
powerful and intuitive environment that keeps you focused on the analyzed
materials. It offers tools to manage, extract, compare, explore, and reassemble
meaningful pieces from large amounts of data in creative, flexible, yet
systematic ways.
The VISE Principle
The main principles of the ATLAS.ti philosophy are best encapsulated by the
acronym VISE, which stands for Visualization, Integration, Serendipity, and
Exploration.
Visualization
The visualization component of the program means directly supports the way
human beings (this includes researchers!) think, plan, and approach solutions in
creative, yet systematic ways.
Tools are available to visualize complex properties and relations between the
objects accumulated during the process of eliciting meaning and structure from
the analyzed data.
The object-oriented design of ATLAS.ti seeks to keep the necessary operations
close to the data to which they are applied. The visual approach of the
interface keeps you focused on the data, and quite often the functions you
need are just a few mouse clicks away.
ATLAS.ti 7.1 USER MANUAL
INTRODUCTION
10
Integration
Another fundamental design aspect of the software is to integrate all pieces
that comprise a project, in order not to lose sight of the whole when going into
detail.
Therefore, all relevant entities are stored in a container, the so-called
"Hermeneutic Unit (HU).” Like the spider in its web, the HU keeps all data
within reach. Loading a project with hundreds of files is merely a matter of
opening a single HU.
Serendipity
Webster’s Dictionary defines serendipity as "a seeming gift for making
fortunate discoveries accidentally." Other meanings are: Fortunate accidents,
lucky discoveries. In the context of information systems, one should add:
Finding something without having actually searched for it.
The term "serendipity" can be equated with an intuitive approach to data. A
typical operation that relies on the serendipity effect is browsing. This
information-seeking method is a genuinely human activity: When you spend a
day in the local library (or on the World Wide Web), you often start with
searching for particular books (or key words). But after a short while, you
typically find yourself increasingly engaged in browsing through books that
were not exactly what you originally had in mind.
Examples of tools and procedures ATLAS.ti offers for exploiting the concept of
serendipity are the Object Managers, the HU Explorer, the interactive margin
area, full text search, and the hypertext functionality.
Exploration
Exploration is closely related to the above principles. Through an exploratory,
yet systematic approach to your data (as opposed to a mere "bureaucratic"
handling), it is assumed that especially constructive activities like theory
building will be of great benefit. The entire program’s concept, including the
process of getting acquainted with its particular idiosyncrasies, is particularly
conducive to an exploratory, discovery-oriented approach.
Areas Of Application
ATLAS.ti serves as a powerful utility for qualitative analysis, particularly of
larger bodies of textual, graphical, audio, and video data. The content or
subject matter of these materials is in no way limited to any one particular field
of scientific or scholarly investigation.
Its emphasis is on qualitative, rather than quantitative, analysis, i. e.,
determining the elements that comprise the primary data material and
interpreting their meaning. A related term would be “knowledge
ATLAS.ti 7.1 USER MANUAL
INTRODUCTION
11
management,” which emphasizes the transformation of data into useful
knowledge.
ATLAS.ti can be of great help in any field where this kind of "soft data"
analysis is carried out. While ATLAS.ti was originally designed with the social
scientist in mind, it is now being put to use in areas that we had not really
anticipated. Such areas include psychology, literature, medicine, software
engineering, quality control, criminology, administration, text linguistics,
stylistics, knowledge elicitation, history, geography, theology, and law, to name
just some of the more prominent.
Emerging daily are numerous new fields that can also take full advantage of the
program’s facilities for working with graphical, audio, and video data. A few
examples:
• Anthropology: Micro-gestures, mimics, maps, geographical locations,
observations, field notes
• Architecture: Annotated floor plans
• Art / Art History: Detailed interpretative descriptions of paintings or
educational explanations of style
• Business Administration: Analysis of interviews, reports, web pages
• Criminology: Analysis of letters, finger prints, photographs, surveillance data
• Geography and Cultural Geography: Analysis of maps, locations
• Graphology: Micro comments to handwriting features.
• Industrial Quality Assurance: Analyzing video taped user-system interaction
• Medicine and health care practice: Analysis of X-ray images, CAT scans,
microscope samples, video data of patient care, training of health personal
using video data
• Media Studies: Analysis of films, TV shows, online communities
• Tourism: Maps, locations, visitor reviews
Many more applications from a host of academic and professional fields are the
reality. In fact, we encourage all users to let us know about the specific use
they are making of ATLAS.ti in their area or work. You can always reach us via
the ATLAS.ti Support Center at http://support.atlasti.com.
ATLAS.ti offers
support to the
researcher without taking
control of the
intellectual
process.
The fundamental design objective in creating ATLAS.ti was to develop a tool
that effectively supports the human interpreter, particularly in handling
relatively large amounts of research material, notes, and associated theories.
Although ATLAS.ti facilitates many of the activities involved in qualitative data
analysis and interpretation (particularly selecting, indexing/coding, and
annotating), its purpose is not to automate these processes. Automatic
interpretation of text cannot succeed in grasping the complexity, lack of
explicitness, or “contextuality” of everyday or scientific knowledge. In fact,
ATLAS.ti was designed to be more than a single tool—think of it as a
professional workbench that provides a broad selection of effective tools for a
variety of problems and tasks.
Teamwork Support
ATLAS.ti facilitates co-authoring, i. e., it allows two or more researchers or
work groups to work on the same project, albeit asynchronously. This means
each person works on his or her own project file. Access to the same data
source is possible. The sub-projects are then merged into one comprehensive
MASTER project. ATLAS.ti provides the tools that allow for the transfer and
ATLAS.ti 7.1 USER MANUAL
INTRODUCTION
12
conversion of research data while keeping the respective sources of ideas
identifiable at all times.
ATLAS.ti 7.1 USER MANUAL
MAIN CONCEPTS AND FEATURES
13
Main Concepts And Features
The concepts of primary documents, quotations, codes, and memos are the
overall foundation you need to be familiar with when working with ATLAS.ti,
complemented by a variety of special aspects such as families, network views
(=the main visualization tool), and analytical/data querying tools. All of these
come together in the overall “project container,” The Hermeneutic Unit (HU,
for short).
The Hermeneutic Unit (HU)
The Hermeneutic Unit (HU), provides the data structure for each project in
ATLAS.ti. The name was chosen to reflect the initial approach taken when
building a support tool for data interpretation. There was no intention to
intimidate users with this admittedly tongue-twisting name.
Acquaint yourself with this general “container” concept and its implications.
Once you understand the HU concept, you understand almost everything that
is necessary to work with ATLAS.ti. And in spite of its impressive name, it is
really simple and practical to use.
Everything that is relevant to a particular project (e. g., a research topic) is part
of the HU and resides in the digital domain. For instance, the Primary
Documents, i. e. the data you are analyzing, the quotations, the codes, the
conceptual linkages (families, networks), and the memos, etc., are all part of
one HU.
One obvious advantage of this container concept is that the user only has to
deal with and think of one entity. Activating an HU is the straightforward
selection of a single file; all associated material is then activated automatically.
ATLAS.ti 7.1 USER MANUAL
MAIN CONCEPTS AND FEATURES
14
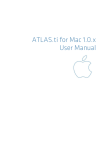
Figure 1: The hierarchy of objects inside a Hermeneutic Unit
The most basic level of an HU consist of the Primary Documents, followed
closely by the "quotations" (= selections from the Primary Documents). On the
next level, codes refer to quotations. Memos - you meet them everywhere.
An HU can become a highly connected entity, a dense web of primary data,
associated memos and codes, and interrelations between the codes and the
data. To find your way through this web, ATLAS.ti provides powerful browsing,
retrieval and editing tools.
Primary Documents (PD Or PDoc)
Primary Documents represent the data you have added to an ATLAS.ti project.
These can be text, image, audio, video or geographic materials that you wish to
interpret.
Primary Document Families (Data Attributes)
Families in ATLAS.ti are a group of objects (see the entry “Families” below).
Primary document families fulfill a special function as they can be regarded as
quasi dichotomous variables. You can group all female interviewees into a PD
family named “female,” all male interviewees into a PD family named “male.”
You can do the same for different professions, marital status, education levels,
ATLAS.ti 7.1 USER MANUAL
MAIN CONCEPTS AND FEATURES
15
etc. The classification is a 0/1 classification: “1” meaning the document is part
of a particular group; “0” meaning it is not part of the group.
Following a special syntax, you can also create PD families that can be
imported or exported as variables with two or more characteristics based on an
Excel table like Gender::male and Gender::female.
PD Families can be later used to restrict code-based searches like: “Show me all
data segments coded with 'attitude towards the environment' but only for
females who live in London as compared to females who live in the country
side.”
You can also use PD families as a filter, for example to reduce other types of
output, like a frequency count for codes across a particular group of
documents. See the chapter on “Working with Variables: Primary Document
Families” below on page 234.
Quotations
A quotation is a segment from a PD that is interesting or important to the user.
In textual documents, a quotation is an arbitrary sequence of characters
ranging in length from a single character, to a word, a sentence, or a
paragraph, even up to the entire data file.
Free quotations resemble passages "scribbled" on the margin of a book.
Usually, quotations are created manually by the researcher. However, if
repetitive words or phrases are contained in the text, the Auto-Coding feature
can be used to automatically segment these quotations and assign a code to
them.
When a quotation is created, ATLAS.ti automatically assigns an identifier to it.
This identifier is built from the index of the primary text to which it belongs and
the first 30 letters (note that a different length can be set via Preferences) of
the text segment, e. g., "1:21 Therefore a more efficient fil....". The identifier is
displayed in list windows and printouts. For graphic, audio, and video
segments, the original file name of the PD is chosen as an identifier.
Although the creation of quotations is almost always part of a broader task
like coding or writing memos, "free" quotations can be created that
indicate interesting parts in the primary data for which a meaningful
classification has not yet been found (“The Data Level - Basic Functions“ on
page 166).
Quotations As Layers
Quotations can be regarded like a transparent layer on top of a document.
Technically speaking, a quotation consists of the identifier (a number) and a
pair of coordinates that specify the beginning and end of the quotation. The
ATLAS.ti 7.1 USER MANUAL
MAIN CONCEPTS AND FEATURES
16
content of a PD file (the data source) is therefore not altered by the creation,
deletion, or modification of quotations.
Quotations are stored inside the HU, independent of the document to which
they belong.
Additional reading: http://downloads.atlasti.com/library/Maietta_200905_6.pdf
Types Of Quotations
There are six different types of quotations (corresponding with the six different
types of formats ATLAS.ti accepts) :
Text Quotations
A textual quotation originates from an arbitrary sequence of selected
characters.
Textual quotations represent (for the computer) a sequence of characters
("strings") and can be of arbitrary size. Sentences, speech turns, or paragraphs
are often the basis for the length of textual quotations. Only text offers enough
"syntactical clues" to allow for searches for the occurrence of specific evidence
that may support a concept. Text also offers the option for automatic
segmentation as used by the Auto-Coding procedure (“The Auto-Coding Tool“
on page 219).
Graphic Quotations
The creation, activation, and display of graphical quotations has similarities
with, but also differs from, their textual counterparts.
A graphical quotation is a rectangular region inside a graphical PD. From its
data structure, it is identical to textual quotations, since their main attributes
are also the PD identifier and two coordinates that mark the beginning and
end, defining a rectangle through its upper left and lower right corner.
Handling graphical quotations is largely analogous to marking text passages in
a textual document (“Creating and Working with Graphical Quotations“ on
page 171).
PDF Quotations
PDF quotations can be of a textual or of a graphical nature. The quotation
references for textual quotations indicate the page number and the start and
end position on the basis of character counts. For example: (31:1537-31:1745)
means that this quotation is from page 31, starting at character 1537 and
ending at character 1745. The reference for coded images indicates the
position of the quotation within the PDF file, like (@422-@618) (“Creating and
working with Textual and PDF Quotations“ on page 166.
Audio And Video Quotations
Audio and video quotations can be as short as a few milliseconds. The length of
a quotation is selected on a time line. Segment starting points and length are
displayed in the following formats:
milliseconds / HH:MM:SS:ms / frames (for videos)
ATLAS.ti 7.1 USER MANUAL
MAIN CONCEPTS AND FEATURES
17
See “Creating and Working with Multimedia Quotations“ on page 174.
GoogleEarth (GE) Quotations
When creating a GE quotation, you see the ATLAS.ti icon on the GE map. It is
linked to one location and thus is different from all other types of quotations
that present a range. The quotation ID shows either the name of the document
or the feature's name (if applicable). In addition the geographic reference of
the marked location is provided (“Creating and Working with Google Earth
Quotations“ on page 182
Additional reading (Working with GoogleEarth data):
http://downloads.atlasti.com/library/Cisneros_2009-03_17.pdf
Codes
The term code is used in many different ways. First, we would like to define
what that term means in qualitative research, and then in ATLAS.ti.
Coding Objectives
From a methodological standpoint, codes serve a variety of purposes. They
capture meaning in the data. They also serve as handles for specific occurrences
in the data that cannot be found by simple text-based search techniques.
Codes are used as classification devices at different levels of abstraction in order
to create sets of related information units for the purpose of comparison (e. g.,
a concept like "Coping Strategy").
Keep code names brief and succinct. Use the comment pane for longer
elaborations.
From a "low level" tool perspective, codes are typically short pieces of text
referencing other pieces of text, graphical, audio, or video data. Their purpose
is to classify an often large number of textual or other data units.
In the realm of information retrieval systems, the terms "index," "indexing," or
"keyword" are often used for what we call "code" or "coding".
The length of a code should be restricted and should not be too verbose. If
textual annotations are what you want, you should use quotation
comments instead.
The technical aspects of coding are described in the section “Coding
Techniques“ on page 187.
Text Search Tool
From simple string matching to sophisticated pattern match (GREP) and
category search, all is available in the Text Search Tool (see page 211 ff).
ATLAS.ti 7.1 USER MANUAL
MAIN CONCEPTS AND FEATURES
18
Word Cruncher
The Word Cruncher counts all words in textual PDs. The count can be limited
to one PD only or include all PDs.
To clean up the count or to count only certain words, a stop and go list can be
defined. The result can be displayed in form of a word cloud or an Excel table.
The result can be displayed in an Excel table (“The Word Cruncher“, page
253).
Auto Coding Tool
If the primary text itself contains important key words, the Auto Coding Tool
scans the text and automatically assigns a pre-selected code to matching text
passages. If so desired, the process can be controlled by manual confirmation
of each action (“The Auto-Coding Tool“, page 219).
Memos
Memos capture your thoughts regarding the text and are an important device
for creating theory. A "memo" is similar to a code, but usually contains longer
passages of text.
A memo may "stand alone" or it may refer to quotations, codes, and other
memos. They can be grouped according to types (method, theoretical,
descriptive, etc.), which is helpful in organizing and sorting them. Memos may
also be included as the objects of analysis by assigning them as PDs.
See the chapter on “Working with Memos“ on page 243ff. Additional reading
(Memo writing):
http://downloads.atlasti.com/library/Friese_2009-09_1.pdf
http://downloads.atlasti.com/library/Friese_2008-12_8.pdf
Families
Families are a way to form clusters of PDs, codes, and memos for easier
handling of groups of codes, memos, and PDs. Primary Document families can
be regarded as attributes or variables (“Family Life“, page 225).
Families can be combined using logical operators similar to codes and Super
Codes (“Super Families“, page 280).
ATLAS.ti 7.1 USER MANUAL
MAIN CONCEPTS AND FEATURES
19
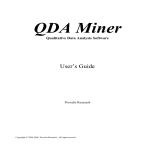
Network Views
Network Views are a bit more sophisticated than families. They allow you to
conceptualize the structure by connecting sets of similar elements together in a
visual diagram. With the aid of Network Views you can express relationships
between codes, quotations, and memos. PDs, families and even Network Views
can also be “nodes” in a network view.
Figure 2: An example of a network view (see sample project)
Nodes, Links And Relations
A node is any object that is displayed in a Network View. You can change their
look and move them around in the Network Editor.
Relations are link prototypes used to create a link between two codes or
between two quotations. An example is the “is-a” (ISA) relation, which is
frequently used to link concepts of different abstraction level (e. g., DOG <isa>
MAMMAL).
Network View Manager
The Network View Manager contains a list of all saved Network Views
previously constructed by the user. It can be used to create new Network
Views, to access or delete existing ones, or to write and edit comments.
Network Editor
The Network Editor displays and offers all editing capability to construct and
refine semantic networks. In addition, it allows the visual creation and traversal
of hypertext structures.
ATLAS.ti 7.1 USER MANUAL
MAIN CONCEPTS AND FEATURES
20
Relation Editor
Should the already built-in relations that are used to connect objects in
Network Views prove not sufficient, you can edit them or create new ones
using the Relation Editor.
Link Managers
The Link Managers provide an overview of all code-code links and of all
quotation-quotation links you have created.
You find more information on the network function under “Network Views“,
starting on page 307.
Video tutorials:
Network Building (1/3): http://www.youtube.com/watch?v=7ObpQ5GMLgU
Network Building (2/3): http://www.youtube.com/watch?v=0umfcNTZqHc
Network Building (3/3): http://www.youtube.com/watch?v=JTKJ95DYA0Q
Hyperlinks: http://www.youtube.com/watch?v=R7IbSt5rpks
Analysis
ATLAS.ti contains multiple powerful, dedicated analytical tool to help to make
sense of your data once it is coded.
Query Tool
For more complex search requests, the Query Tool is at your disposal. Here you
can formulate search requests that are based on combinations of codes using
one or a combination of 14 different operators, Boolean, semantic and
proximity operators (“Query Tool“, page 258).
Super Codes
A Super Code differs from a standard code. A standard code is directly linked
with the quotations to which it is associated, while a Super Code is a stored
query, thus provides an answer to a question (in the best case) that typically
consists of several combined codes (“Super Families“ on page 280).
The Co-occurence Explorer
The Co-occurence Explorer is more exploratory than the Query Tool. Rather
than determining the codes yourself, you can ask ATLAS.ti which codes happen
to co-occur in the margin area. The output can be viewed in form or a tree
view or a table view (CTE: Co-occurence Table Explorer). The CTE provides
frequency of co-occurrence and a coefficient measuring the strength of the
relation is calculated. Since a coefficient is only appropriate for some type of
data, its display can be activated or deactivated.
ATLAS.ti 7.1 USER MANUAL
MAIN CONCEPTS AND FEATURES
21
It is always possible to directly access the data behind the frequency counts or
coefficient.
You find this function under the ANALYSIS menu. For further information, see
“Co-occurrence Tools“, page 290.
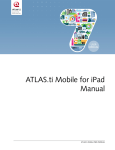
Codes-Primary Document-Table
The Codes-Primary-Document Table contains the frequency of codes across
documents. Aggregated counts based on code and primary document families
are also available. The table can be exported as Excel compatible table.
Optionally, the table cells can also contain the word counts for the quotations
per code across documents.
Figure 3: Codes-Primary-Documents Table
This option can be found under the ANALYSIS menu. See “Codes-Primary
Documents Cross-Tabulation“, page 302.
Team Tools
Team work is a normal scenario in data analysis, and ATLAS.ti is uniquely suited
for collaborative work. A number of special tools and features support efficient
work in a team.
Team Library
In ATLAS.ti 7, documents are stored in a special repository called libraries. For
teams, a team library is provided and HUs using this library are marked as team
HUs.
ATLAS.ti 7.1 USER MANUAL
MAIN CONCEPTS AND FEATURES
22
User Administration
Manage the ATLAS.ti user database through the user administration tool. This
is a prerequisite for collaborative work, but is also useful to individual users
through personalizing the log-in or protecting an HU with a password.
User Management options can be found under the Tools menu. See also the
chapter on “User Management”, page 147.
Hermeneutic Unit Merger
This tool merges different HUs. A variety of options to control the merge
strategy are offered.
You find this function under the Tools menu. Further information is provided in
the chapter “Merging Hermeneutic Units“, page 154.
Coding Analyzer
The Coding Analyzer is helpful after merging HUs. It tests for redundant codes,
i. e., codes used more than once for data segments that overlap or are
embedded in one another (see page 374).
Export
RTF
There are output options for each of the main objects in ATLAS.ti: Primary
Documents, Quotations, Codes and Memos. You find it under the respective
menus. You can output a list of primary documents along with their comments,
all or selected quotations with our without comments, quotations by codes (via
the Codes / Output menu), a list of all codes, code-neighbors lists, etc. For
memos, you can either output just a list of your memos, the content of memos
or the content including the linked objects.
PDF
You can print out coded documents as you see them on the screen with the
codes in the margin area. This option is available for text, image and PDF
documents and you find it under DOCUMENTS / OUTPUT / PRINT WITH MARGIN.
XML Export Of Project File
The XML generator exports all information contained in an HU in XML format.
This universal, open data format allows for a wide variety of possibilities for
display, processing, and even integration of your data with external
applications. Click on the XML button in the main tool bar to explore the
options.
ATLAS.ti 7.1 USER MANUAL
MAIN CONCEPTS AND FEATURES
23
XML Reports
ATLAS.ti offers a number of reports via XML style sheets. If you are skilled in
writing such style sheets, you can create any output you like based on the raw
XML file of your ATLAS.ti project. For all others, we have put together a
selection of useful reports like creating a code book, lists of all families with
their members, all memos with linked quotations, overviews of the various links
created in network views, quotation output by codes, etc. You find this option
under PROJECT / EXPORT / XML EXPLORER.
SPSS Export
You can export your coded data as SPSS syntax file. When executed in SPSS,
your quotations become cases and your codes and code families variables. In
addition, further identifying information in form of variables is provided like the
primary document number for each case, start and end position and creation
date. These variables allow you to aggregate your data in SPSS if needed
(“SPSS Export“, page 405).
If you need a less detailed output, see „Codes-Primary Documents CrossTabulation“ on page 302. The table provides an output that is already
aggregated by primary documents.
Excel Export
The frequency of codes across documents (CODES / OUTPUT / CODES-PRIMARY
DOCUMENT TABLE), the results of the Co-occurence Table Explorer (TOOLS / COOCCURENCE TOOLS, and the word frequency count (see “The Word Cruncher“,
page 253) can be exported as Excel compatible file.
Graphic Files
Network Views can be saved as bmp or emf files: Open a network view and
select NETWORK / SAVE AS GRAPHIC FILE.
HTML Generator
Publishing online or just creating a printout from a project is available with the
HTML generator (see TOOLS / EXPORT TO: / HTML). The results can be viewed
platform-independent with any Web browser. This option can be found under
the Extras menu and is best suitable for exporting your entire project. HTML
preferences can be set under TOOLS / PREFERENCES / HTML PREFERENCES (“HTML
Export“, page 416).
ATLAS.ti 7.1 USER MANUAL
MAIN CONCEPTS AND FEATURES
24
Other Tools
Object Crawler
With the Object Crawler, you can search all of the parts of your project within
ATLAS.ti that contain text. Searches are not restricted to just textual PDs:
codes, memos, quotations, all families, code-code links, hyper-links, and the
HU can be searched. In addition, the scope of the search can be limited to
certain fields. You find the Object Crawler under the Tools menu (“The Object
Crawler“, page 366).
HU Explorer
The HU Explorer displays all the elements of an HU in a strictly hierarchical
manner, even if the structures are non-hierarchical, or even cyclic. You find the
HU Explorer under the Tools menu (“The HU Explorer“, page 368).
ATLAS.ti Mobile
ATLAS.ti Mobile For The IPad
ATLAS.ti, the powerful knowledge workbench, now has a companion−ATLAS.ti
Mobile for the iPad. With the app you can collect and analyze data wherever
you are and can take your iPad along.
Perhaps you want a work on a document while on a long train, plane or boat
ride. Email it to yourself so it is available on the iPad. Add it to an ATLAS.ti
Mobile project, read it, write comments, and perform coding work.
You can later merge the result with your existing ATLAS.ti desktop project. This
is explained in the sections “Exporting A Mobile Project (iPad App)“ and
“Importing A Mobile Project to ATLAS.ti Desktop .“
ATLAS.ti 7.1 USER MANUAL
MAIN CONCEPTS AND FEATURES
25
Figure 4: ATLAS.ti iPad app in action
A complete documentation of the app is available from
http://ipad.atlasti.com. ATLAS.ti Mobile for the iPad is available FREE from
the Apple app store.
ATLAS.ti Mobile For Android
By popular demand, an app for Android devices will be coming soon. Stay
tuned.
ATLAS.ti 7.1 USER MANUAL
MAIN STEPS IN WORKING WITH ATLAS.TI
26
Main Steps In Working With
ATLAS.ti
The figure below illustrates the main steps of working with ATLAS.ti, starting
with the creation of a project, adding documents, identifying interesting things
in the data and coding them. Memos and comments can be written at any
stage of the process, whereas there is possibly a shift from writing comments
like adding meta information to your documents, first code nodes that later
turn in to code definitions, initial thoughts about specific data segments (the
ATLAS.ti quotations) to more extensive memo writing during the later stages of
the analysis. Once your data is coded, it is ready to be queried using the
various analysis tools provided. The insights gained can then be visualized using
the ATLAS.ti network view function.
Some steps need to be taken in sequence--for instance, logic dictates that you
cannot query anything or look for co-occurences if your data has not yet been
coded. But other than that there are no strict rules. Network views, in addition
to presenting findings, also have an exploratory component and as such can
help you to see your data from a different perspective. This may provide
further ideas for coding, querying or even further data collection.
Figure 5: Main work flow
ATLAS.ti 7.1 USER MANUAL
MAIN STEPS IN WORKING WITH ATLAS.TI
27
Data And Project Management
A first important but often neglected aspect of a project is data and project
management. The first step is data preparation. You find more information on
supported file formats in the section “ Supported Formats“ on page 64.
Apart from analyzing your data, you also manage digital content and it is
important to know how the software does it. For detailed information, see the
section “What happens behind the scene if you add documents to a project”
on page 71ff.
As a basic guide, consider the following basic questions:
•
Should data be edited after it is assigned to ATLAS.ti? See the section
on “Editing Primary Documents” on page 137.
•
Do you need data to be shared among team members? For further
information on team project management see “Setting up Team
Projects“ on page 110.Where and how can you create project
backups? (“Project Backup and Transfer“ on page 128).
The Process
There are two principal modes of working with ATLAS.ti, the data level and the
conceptual level. The Data Level includes activities like segmentation of data
files; coding text, image, audio, and video passages; and writing comments and
memos. The Conceptual Level focuses on querying data and model-building
activities such as linking codes to networks, in addition to writing some more
comments and memos.
Data-Level Work
Data-level research activities include segmenting the data that you have
assigned to a project into quotations, adding comments to respective passages
(note-making/annotating), and coding selected text passages or data
segments, secondary materials, annotations, and memos to facilitate their later
retrieval. The act of comparing noteworthy segments leads to a creative
conceptualization phase that involves higher-level interpretive work and
theory-building.
ATLAS.ti 7.1 USER MANUAL
MAIN STEPS IN WORKING WITH ATLAS.TI
28
ATLAS.ti assists you in all of these tasks and provides a comprehensive
overview of your work as well as rapid search, retrieval, and browsing
functions.
Within ATLAS.ti, initial ideas often find expression through their assignment to
a code or memo, to which similar ideas or text selections also become assigned.
ATLAS.ti provides the researcher with a highly effective means for quickly
retrieving all data selections and notes relevant to one idea.
Read more detail in the section on the “Data Level Basic Functions” in the full
manual.
Conceptual Level Work
Beyond coding and simple data retrieval:
ATLAS.ti allows you to query your data in lots of different ways, combining
complex code queries with variables, exploring relationships between codes
and to visualize your findings using the network tool.
ATLAS.ti allows you to visually "connect" selected passages, memos, and
codes into diagrams that graphically outline complex relations. This feature
virtually transforms your text-based workspace into a graphical "playground"
where you can construct concepts and theories based on relationships between
codes, data segments, or memos.
This process sometimes uncovers other relations in the data that were not
obvious before and still allows you the ability to instantly revert to your notes
or primary data selection.
For more detail, see “Data Analysis and Theory-Building Tools“ on page 251ff.
General Steps When Working With ATLAS.ti
The following sequence of steps is, of course, not mandatory, but describes a
common "script:"
Create a project, an "idea container," meant to enclose your data, all your
findings, codes, memos, and structures under a single name. We call this a
"Hermeneutic Unit" (HU). A more detailed explanation is provided below
(“Main Workspace: The HU Editor“ on page 30.
Next, add documents, text, graphic, audio and video files, and Google Earth
as so called Primary Documents (PDs) to your ATLAS.ti project. See “Adding
Documents to a Project“ on page 71.
Read and select text passages or identify areas in an image or select
segments on the time line of an audio or video file that are of further
interest, assign key words (codes), and write comments and memos that
contain your thinking about the data. We call this the Data-Level working
phase (“The Data Level - Basic Functions“, page 166).
ATLAS.ti 7.1 USER MANUAL
MAIN STEPS IN WORKING WITH ATLAS.TI
29
Compare data segments based on the codes you have assigned; possibly add
more data files to the project.
Organize PDs, codes, and memos using “Families” (see the chapter on
“Family Life“ on page 225 for further information).
Query the data based on your research questions utilizing the different tools
ATLAS.ti provides. The key words to look for are: simple retrieval, complex
code retrievals using the query tool, simple or complex retrievals in
combination with variables via the scope button, the co-occurence explorer
(tree and table explorer), the codes-primary document table, Excel and SPSS
export of frequency counts for further statistical analysis (see “Analysis
Tools“ on page 251.
Build semantic, prepositional or terminological networks from the codes you
have created. These networks, together with your codes and memos, form
the framework for emerging theory. Look for the chapter “Network Views“,
page 307).
Finally, compile a written report based on the memos you have written
throughout the various phases of your project and the networks you have
created and even publish your project as a World Wide Web document or an
individual presentation using XML. See “Generating Output“, page 385ff.
Additional reading about working with ATLAS.ti:
- http://downloads.atlasti.com/library/Casasempere_2007-07_11.pdf
- http://www.qualitativeresearch.net/index.php/fqs/article/viewArticle/1632/3149
- http://atlasmalaysia.wordpress.com/2010/09/01/howtolr/
ATLAS.ti 7.1 USER MANUAL
MAIN WORKSPACE: THE HU EDITOR
30
Main Workspace: The HU Editor
The Hermeneutic Unit (HU) Editor is the main workspace. It is opened after the
start of the program, and will be your “home page” most of the time.
Figure 6: The HU Editor with activated line numbers and margin area.
The HU Editor serves as the main editing tool and offers access to all other
workbench tools.
You can decide which parts of the window to display and customize its
appearance to your needs. Use the VIEWS menu to hide some of the buttons,
windows, etc.
ATLAS.ti 7.1 USER MANUAL
MAIN WORKSPACE: THE HU EDITOR
31
Components Of The HU Editor
The numbers in brackets refer to the figure above showing the HU editor.
Title Bar [1]
The title bar is common to all windows and dialog boxes. It displays the name
of the HU that is currently being edited.
Main Menu And Tool Bars [2]
The main menu below the title bar offers access to the different kinds of
objects that populate an HU. Commands found in the main menu are often
also available from context menus and toolbar buttons.
Tool bars offer functions that are generally also available as menu commands.
A short “tool tip” help text is displayed when the mouse pointer rests on a tool
button.
The Edit options in the tool bar are available only when an editable Primary
Document (PD) is displayed. The tools from the Editing Toolbar can be used
after entering edit mode. The various options are explained further in the
section on “Editing Primary Documents” on page 137.
The Primary Document Tool Bar [3]
The PD toolbar is to the left of the PD pane. Note that it is disabled unless a
document is loaded.
Object Drop-Down Lists [4]
Below the main toolbar, you find four drop-down lists that contain the HU’s
main entities. From left to right, these are the drop-down lists for: PDocs,
quotations, codes, and memos.
Click into the entry field or the little drop-down arrow on the right to select an
object. Click the button to the left of the entry field to open an Object
Manager.
Primary Document Pane [5]
The dominant window pane in the HU Editor is the Primary Document Pane.
This pane is the central workspace where text or graphic material is reviewed,
marked, coded, and annotated. It is usually augmented by the Paragraph
number pane when text documents are loaded [8] and the margin area [9].
Paragraph Number Area [6]
To the left of the text area, paragraph numbers can be displayed. Technically
a hard return in text document is interpreted as paragraph.
ATLAS.ti 7.1 USER MANUAL
MAIN WORKSPACE: THE HU EDITOR
32
Margin Area [7]
To the right hand side of the PD area is the optional margin area. Bars are
used to indicate quotations. Attached codes, memos, and hyperlinks are
displayed next to the quotation bars. The margin area is fully interactive: the
displayed objects are sensitive to mouse clicks and have their own context
menus. In addition, a variety of drag-and-drop options are possible. See “
Margin Drag & Drop“ on page 249 for more detail.
You can resize the margin area using the split bar [10] between the PD pane
and the margin pane.
When you double click on a code in the margin area, a comment field pops up
showing the code definition if you have written one.
Figure 7: Margin area context menu
A general context menu can be opened inside the margin area by moving the
mouse pointer onto the background between the objects. It allows you to set
display properties of the objects.
Margin Area Preferences
Several individual preferences can be set for the margin area: the kind of
objects shown, whether icons should be used, whether in-place editing should
be allowed, etc. In order to set your individual preferences:
Select TOOLS / PREFERNCES / GENERAL PREFERENCES (or use the “wrench” button) and
then select the Margin tab.
Windows Splitter [8]
Use the windows splitter to resize the PD pane and margin area.
Region Button [9]
When you click on the plus sign on the right hand side of the editor, you can
open up three more regions for the display of documents. Thus, you can view
(and work on) up to four documents side-by-side.
ATLAS.ti 7.1 USER MANUAL
MAIN WORKSPACE: THE HU EDITOR
33
Document Bar [10]
Figure 8: HU editor with two document regions
Indicates the active region for currently loaded documents.
Navigation Pane [11]
The navigation pane allows easy access to primary documents, quotations,
codes, memos and network views. You can search for objects and also load /
open them them from here.
Open the navigation pane at the left hand side of the editor:
Figure 9: Accessing the navigation pane
Double-click on a document entry to load it into the first document region.
ATLAS.ti 7.1 USER MANUAL
MAIN WORKSPACE: THE HU EDITOR
34
Figure 10: Working with the navigation pane
Use the search field to search for a specific item. This is especially useful if you
work with lots of documents or have a long list of codes or other objects.
If you want to rename an object, use the in-place method (see “In-place Label
Editing“ on page 42.
Switch to View mode by right clicking on an object in the list to see preview
images for each document. This provides a good overview if you work with
different media types and is especially helpful when analyzing lots of image
data (see Figure 11). The View mode is available for primary documents and
for network views.
Figure 11: View preview images for your documents in the
navigation pane
Status Bar [12]
The status bars at the bottom of the window. The leftmost field tells the user
about successful termination of operations, and displays the file name of the
currently loaded file. At times, it also contains short help texts for menu items
and buttons, and shows error messages when necessary.
ATLAS.ti 7.1 USER MANUAL
MAIN WORKSPACE: THE HU EDITOR
35
Figure 12: The status bar
Towards the right side, the current view size of the loaded document is shown.
Next to it the ATLAS.ti icon. It changes to a pen when the PD is switched to
edit mode.
The next field displays the document’s content type (e. g., Rich Text, PDF
image, audio, video and GEO) and the selected language (in Figure 12 this is
DE for German). Click the Default button to select the language.
Figure 13: Select the language you are
using
Pop-up Menus
Pop-up or
"context" menus
are activated with
a right mouse
button click.
‘Context’ or ‘pop-up’ menus are used for commands that apply to a selected
object or to a specific sub-pane inside a multi-pane window. A pop-up menu is
activated by a right mouse click at the current location of the mouse pointer.
They are also termed context sensitive because the offered commands depend
on the type and the current state of the object or the context in which the
menu was activated.
Using pop-up menus to initiate procedures is a three-step procedure typical for
window-mouse user interfaces:
• Select an object.
• Open the pop-up menu with the right mouse button.
• Select a command with the left mouse button.
The HU editor provides specific pop-up menus in each of its sub-panes. The PD
pane alone offers a variety of pop-up menus, depending on what is currently
displayed or selected. When there is no PD displayed (e. g., directly after
starting a session or after closing a PD) you get the wallpaper menu:
ATLAS.ti 7.1 USER MANUAL
MAIN WORKSPACE: THE HU EDITOR
36
Figure 14: Wallpaper pop-up menu
When a PD is loaded and a chunk of text is selected, a different pop-up menu
is displayed:
Figure 15: Pop-up menu for a
selected text segment.
If the selection is an existing quotation, the pop-up menu gets more specific:
Figure 16: Pop-up menu for a
quotation.
The commands are tailored to the objects under the cursor at the time the
context menu pops up.
ATLAS.ti 7.1 USER MANUAL
MAIN WORKSPACE: THE HU EDITOR
37
The Object Managers
The advantage of drop-down lists is that they save space. To provide more
efficient access to the objects listed in the drop-down lists, the lists can be
displayed in a detached window. These windows are called Object Managers
because they not only allow access to the objects, but provide many more
options and functions.
Like many other tools that can be invoked from the main editor, an Object
Manager is a child or dependent window of the main editor.
Child windows have some common properties:
• They are closely related to their parent window (here: the HU editor) and
changes in either the child or the parent window are usually "broadcast"
between them (like the selections of objects).
• They can be resized and positioned independently of their parent window.
• They are minimized when the parent window is minimized and they are
restored with their parent window.
• They are closed when the parent window is closed.
• However, child windows do NOT move with the parent window.
Roll-up Mode
On low resolution screens, Object Managers can cover relatively large areas of
the workspace. You can use the roll-up mode to save screen space. In order to
“roll up” a window, click on the icon on the top left of the window as shown in
Figure 17 and the select the roll-up option from the menu.
Figure 17: Activate the roll-up mode to optimize space
ATLAS.ti 7.1 USER MANUAL
MAIN WORKSPACE: THE HU EDITOR
38
Launching An Object Manager
In addition to the options provided by the navigation pane, you can also open
a list of all documents in a separate window called the Primary Document
Manager. This manager contains a number of additional functions.
To open for instance the Document Manager, select the main menu option
DOCUMENTS / PRIMARY DOC MANAGER or click on the P-Docs button to the left of
the drop-down list.
In the same way, you can launch the QUOTATION, CODE MANAGER and MEMO
MANAGER.
Figure 18: Primary Document Manager
On the right hand side of the window you see the list of objects. Various view
options are available (see View Menu).
On the left hand side, you see an optional side panel that shows the existing
families. Families are a device in ATLAS.ti that allows you to group objects (see
The Manager Side Panel ).
If you select an item that is part of a family, the family icon is highlighted. In
Figure 19 for instance the memo*idea memo is selected. As it is part of the
memo family Instructions, the icon of this family is highlighted.
ATLAS.ti 7.1 USER MANUAL
MAIN WORKSPACE: THE HU EDITOR
39
Figure 19: Link between list items and associated families
If you click on a family in the side panel, you activate a local filter and the list to
the right only shows the items of the selected family. Note that the family is
displayed in bold characters:
Figure 20: Use side panel to filter the list of primary documents
It is also possible to set a global filter in the side panel and to create families
and super families right where you need them in the Manager (see “The
Manager Side Panel “ on page 52).
Click on SHOW ALL to view the full lists of items again.
You can activate or deactivate the side panel by selecting: VIEW / SHOW SIDE
PANEL, or select click on the side panel button in the tool bar (see left).
The Object Manager Window
The four Object Managers have some common properties. The general layout
of their window is as follows:
Title, Menu, And Toolbar
The title bar displays the object type. In the figure above the PD Manager is
shown. The menu and the toolbar below the title bar offer access to frequently
used functions, some of which are also accessible from pop-up menus.
As the functions are different for all four object types, menu and toolbar
options differ for the four Object Managers. The toolbar options are described
in more detail below. The menu items resemble the corresponding main menus
in the HU Editor.
Note that not all options are available at all times. Some menu and toolbar
options need either a single selection or multiple selections.
ATLAS.ti 7.1 USER MANUAL
MAIN WORKSPACE: THE HU EDITOR
40
The List Pane
Below the toolbar is the list pane. Unlike the HU Explorer or the Network Editor
that can handle heterogeneous collections of objects, the Object Managers
display objects of only one type. When you are in “Details” view mode, a
number of attributes of the items are displayed in a table-like manner. The
order of the columns can be changed by dragging a column to a different
position in the list. Items can be sorted or reversed by clicking on the respective
column header.
The Text Pane
The text pane, located below the list pane, displays the comment or, in the case
of memos, the text body. All text panes are Rich Text compatible.
The Split Bar
The relative size of the list and comment pane can be modified by dragging the
split bar between the two panes. The cursor changes when the mouse moves
over the split bar. You can re-size the adjacent panes by dragging the split bar
to the desired position.
The Status Bar
The status bar’s fields display from left to right the number of objects, the
selected object, the filter, and the sort option.
Figure 21: Status bar of primary document manager
The status bar above indicates that the Primary Document Manager lists 12
documents, none of the PDs is currently selected. The filter is set to display only
documents from the PD family: Investigation, and items are sorted by “ID.”
For additional information about how to use the status bar for sort- and filterrelated procedures see “Sorting and Filtering” on page 378.
Pop-Up Menus
The list and text panes offer context sensitive pop-up menus. The list pane’s
context menu contains a portion of the commands available from the main
menu for the selected objects. The text pane’s menu offers standard commands
for editing and formatting.
View Menu
View Options are the same for all Object Managers.
ATLAS.ti 7.1 USER MANUAL
MAIN WORKSPACE: THE HU EDITOR
41
CLOUD VIEW (available in the Code Manager only): Shows all codes in a cloud
view. Once you have activated the cloud view, various other view options are
offered via the CLOUD sub menu, like viewing extended tags, changes the
weight to groundedness / density, to sort by name, etc.
Choose between viewing TILES, LARGE ICONS, SMALL ICONS, a LIST of items, or a list of
items plus additional information in DETAILS view.
The Tiles view is interesting in combination with the option PREVIEW SIZE. This
option is available in the P-Docs and Memo Manager and results in the display
of thumb nail images.
The SINGLE COLUMN view shows the most essential information like name, how
often used, linkages to other objects, start and end position (where applicable).
USE GRID displays lines between rows in Details view.
LEDGER STYLE shades every other row.
DISPLAY FREQUENCIES: Offers a visualization of quotation frequencies in the P-Docs
Manager and of groundedness and density counts in the Code Manager. It
needs to be combined with the Details view.
AUTO-COLOR MODE (only available in the Code Manager). Codes are
automatically assigned a color according to their groundedness and density.
See “T” on page 347 for details.
PREVIEW SIZE is related to the tiles view. You can chose among various sizes
starting with the standard size (32 x 32) up to Godzilla size (512x512).
SHOW SIDE PANEL: The side panels can be used to create and display families (see
Creating Families), to select families as local or global filter (see Filtering)and to
create super families (see Super Families).
SHOW TOOLBAR: turns the display of the toolbar on or off.
USE IMAGES: Shows icons for the various objects.
FONT individually specifies the font used for this list. The default font for the list
and the text area can be set in General Preferences.
REFRESH (F5) refreshes the list display
SELECT ALL ITEMS is self-explanatory.
Selecting Items In Object Managers
Next to thinking, clicking will likely be one of the most frequent activities when
working with ATLAS.ti.
Clicking is done in many different ways such as single- and double-clicking and
clicking with the left or the right mouse button. The "semantics" of a mouseclick are not perfectly straightforward, and a few variations must be learned.
A single click
selects an object,
a double-click
executes an
associated action
for the object.
A single click with the left mouse button selects and highlights an item in each
of the Object Managers.
Double-clicking an item selects the object and invokes a procedure depending
on the type and state of the object. The effect of a double-clicking is described
for each of the Object Managers below.
For multiple selections, you may use the standard Windows selection
techniques.
ATLAS.ti 7.1 USER MANUAL
MAIN WORKSPACE: THE HU EDITOR
42
Sorting And Filtering
The Object Managers permit comfortable sorting and filtering. See “The
Manager Side Panel “ on page 52 and “Sorting and Filtering” on page 378 for
details.
Searching
Use the search field to search for either documents, quotations, codes or
Figure 22: Search field in object managers
memos in the respective managers.
If you enter a search term, all objects that include the term somewhere will be
shown in the list. For example, if you enter the term “children” in the code
manager, all codes that include the word “children” somewhere in the code
name will be shown like children: unrelated to personal happiness, or source:
children, or SQ: Reasons for having children.
Remember to delete the search term if you want to see all codes again.
Incremental List Search
This feature is available in the list pane of all Object Managers. Select any item
in the list and type in an arbitrary sequence of characters to jump to a
subsequent list entry matching this sequence.
For example, suppose a number of codes begin with "em" (e. g., "Emotions")
and others with "ex" (e. g., "External Reference"): typing "em" will jump to
the first of the "EMotion …" codes, while entering "ex" will jump to "EXternal
reference." Every other character typed advances the focus to the next list
entry unless a matching name cannot be found.
Avoid long delays between entering characters. After a certain systemdefined timeout, the next character starts a new forward search.
In-place Label Editing
In-place editing in Object Managers and side panels is a convenient way to
rename objects. On a selected item, you can initiate in-place editing by either
clicking again or pressing the F2 key. Don't rush the second click, though, as
this initiates a double-click action. Under EXTRAS / PREFERENCES / GENERAL
PREFERENCES, tab: Margin you can set whether an in-place action should be a
local or a global action. The default is local.
ATLAS.ti 7.1 USER MANUAL
MAIN WORKSPACE: THE HU EDITOR
43
Editing Text
In the Object Managers, the comment for the selected object or a memo’s
content is displayed in the text pane below the list pane. You may edit the text
right there or you might prefer to open a full-fledged text editor (see button to
the left). For minor changes, working in the Object Manager’s text pane is
quite comfortable.
There are several ways to save a changed comment. With General Preferences
set to "Accept changes in browser silently," an object’s comment (or a memo’s
body) is saved automatically whenever you select another object in the list. This
is the default setting and a quick way to save. However, you will also change
the text if you click on another item accidentally.
If you are not using the Quick Save option, you need to confirm saving the
comment or memo when selecting another object in the list.
Changes can be explicitly saved at any time by pressing the Ctrl-S key
combination, or via EDIT / ACCEPT from the Object Manager’s menu.
Note: All text editors offer full rich text support.
Primary Document Manager
For many operations, the Primary Document Manager is easier to handle than
the drop-down list (see Figure 18).
If you double-click on a document, it will be loaded into the active region. You
can also drag and drop documents from here onto the region buttons (see left)
to load it into a new region. Or click on the region button first to open a new
region and then drag a document in the empty region pane.
As already shown for the navigation pane (see “Navigation Pane [11] on page
33, you can also view your documents as tiles: VIEW / TILES. The standard option
is to see thumb nails. But you can also increase the size by selecting VIEW /
PREVIEW SIZE.
ATLAS.ti 7.1 USER MANUAL
MAIN WORKSPACE: THE HU EDITOR
44
Figure 23: Preview images for documents in Primary Doc Manager
Next to each tile you find information about the document; its type, the
families it belongs to, and the number of quotations.
Double-click: Double-clicking a PD loads the data source and displays its
content in the PD pane.
Single-click – pause – single-click (or F2) activates in-place editing of PD names.
Multiple Selection: You can select more than one PD at a time. This is useful for
printing a selected list of PDs (OUTPUT / LIST).
Filter: Click on a PD family in the side panel to set a local filter.
Ctrl+Shift+double-click sets a family as global filter (see Using Families as
Filters).
Colors:
• Usable PDs are colored black.
• PDs with an inaccessible data source file are colored gray. If this happens,
you have either moved linked documents to a different location or have
renamed them. If you are using managed files, this indicates that the
document is not available in the library (see “The Document Libraries“ on
page 104).
• PDs that are available but cannot be loaded due to a consistency problem
are colored red. This indicates a problem with editing for linked documents.
You have either modified the document outside of ATLAS.ti or have lost or
misplaced the log file that is created when editing a document inside of
ATLAS.ti.
• PDs that can be loaded, but are loaded via the fallback path, are shown in a
dark red color. The fallback path is either the HU or the TBPATH. This only
applies to linked documents.
See the ATLAS.ti 6 manual for further detail on linked documents.
ATLAS.ti 7.1 USER MANUAL
MAIN WORKSPACE: THE HU EDITOR
45
Figure 24: PD Manager toolbar
The PD Manager Toolbar
The toolbar is a convenient alternative to selecting procedures via the main
menu. The difference is –where applicable- the selected option only has an
effect on the currently selected document. When selecting the same option
from the main menu, it is applied to all documents.
From left to right:
• Add a new document to your project
• Open text pane for writing comments in a full-fledged text editor.
• Open a network view on the selected primary document.
• Disconnect the primary document.
• Various View options
• Open the Primary Document Family Manager.
• Search the list of documents
• Hide or show the side panel
PD Manager Columns
The columns of the PD Manager’s details view offer a vast amount of
information to keep track of possible access problems. The arrangement of
columns may differ from your current setting.
Figure 25: PD Manager Columns
Id: The internal ID number assigned to the document when it was first added
as a PD. An icon indicates the document type.
Name: The name of the PD. Note that this name can differ from the file name,
as PDs can be renamed within ATLAS.ti.
Media: The media type.
Quotations: The number of quotations created for this PD.
Location: The actual location of the data source file. This could be My Library,
Team Library, in HU if the document is embedded, or the actual location of a
linked document if accessible.
Author: The name of the ATLAS.ti user who assigned the document
Families: The document families the document has been assigned to.
Created: The date the document was assigned to this HU.
ATLAS.ti 7.1 USER MANUAL
MAIN WORKSPACE: THE HU EDITOR
46
Modified: The date when the PD was last modified, i. e. the date of last usage
within ATLAS.ti, e. g., a quotation was created or removed. The modification
date does not refer to the modification of the data source file.
Usable: ‘Yes’ indicates that a PD’s data source can be loaded, and ‘no’,
indicates that the data source is not accessible.
Origin: The original location of the PD’s data source from where it was
assigned to the HU.
Quotation Manager
This Manager offers you several display and sorting options.
A double-click on a quotation loads its PD (unless already loaded)n and displays
its content in context.
In this example, quotation “11:23” is selected and its comment is displayed in
the text pane.
Single-click selects a quotation. If you have written a comment for the selected
quotation, it is displayed in the text pane.
Figure 26: Quotation Manager
Single-click – pause – single-click (or F2) activates in-place editing of quotation
names.
ATLAS.ti 7.1 USER MANUAL
MAIN WORKSPACE: THE HU EDITOR
47
Double-click: A double-click on a list entry displays the selected quotation in
context.
Multiple Selection: You can select more than one quotation at a time, either to
delete them, to attach codes, to open a network on them, or to create output.
Drag & Drop: By dragging one or more quotations onto other quotations, you
create hyperlinks.
Colors: The color pattern for quotations follows the same rules as for PDs:
• Quotations that can be activated and displayed are listed in black.
• Quotations from linked PDs that are available but cannot be loaded due to
an issue with editing are displayed in red.
• Quotations from PDs with inaccessible data source files are displayed in gray
(see page 44).
• Quotations that can be loaded, but are loaded via the fallback path, are
shown in a dark red color. This applies to linked documents only. See the
ATLAS.ti 6 manual for further detail on linked documents.
Quotation Manager Toolbar
Figure 27: Quotation Manager toolbar
From left to right:
• Open text pane for writing comments in a full-fledged text editor.
• Open a network view on the selected quotation.
• Move forward to the next quotation (or back to the last one)
• Create the link source for a hyperlink (“Hypertext“, page 352)
• Create the target link for a hyperlink.
• Delete selected quotation(s).
• Various View options
• Enter a search term into the search field if you are looking for particular
quotations.
Quotation Manager Columns
Figure 28: Quotation Manager columns
ATLAS.ti 7.1 USER MANUAL
MAIN WORKSPACE: THE HU EDITOR
48
Id: The Id combines the PDoc number and the quotation sequence number.
The quotation Id 3:10 means that the quotation is part of the third (3:)
document, and it is the 10th (:10) quotation that was created in this document.
Quotations are numbered in chronological and not in sequential order.
A tilde sign (~) indicates that a comment was written for this quotation; the
brackets (< or >) indicate that the quotation is a start anchor or target for a
hyperlink.
Name: The first 30 characters of a quotation are used as the default list name.
This name can be changed if desired. The default name of a graphic, audio, or
video quotation is the name of the data file name.
Primary Document: The name of the primary document it belongs to.
Codes: The codes that have been applied to the quotation.
Size (media type dependent):
• Text quotation: number of paragraphs
• Graphic quotation: height in pixel of the quotation’s rectangle.
• Audio quotation: milliseconds
• Video quotation: frames or time (see “Error: Reference source not found“,
page Error: Reference source not found)
• GoogleEarth quotation: 1
Start (media type dependent):
Text quotation: paragraph number
Graphic quotation: upper left coordinate
Audio quotation: h:mm:ss:mil (hours:minutes:seconds: milliseconds)
Video quotation: start frame or time as for audio quotations
GoogleEarth quotation: Geographic reference
Density: Number of links to other quotations.
Author: Name of user who created the item.
Created: Creation date and time.
Modified: Date and time of last modification.
Code Manager
Besides the HU Editor, the Code Manager will probably be one of your most
frequently used tools.
ATLAS.ti 7.1 USER MANUAL
MAIN WORKSPACE: THE HU EDITOR
49
Figure 29: Code Manager – View options set to Details / Display Frequencies / Show Side Panel
A double-click on a code displays the coded quotation highlighted in the
context of its PD. If more than one quotation is associated with this code, a list
pops up from which a quotation can be selected.
The Code Manager is frequently used to create and modify codes, to code data
segments via drag & drop, and to retrieve coded data segments. It can also be
used to sort your codes in multiple ways in order to analyze code book
evolution.
Single-click: Selects a code. If you have written a definition for the selected
code, it is displayed in the text pane. Once selected, the code can be used for
drag & drop coding.
Single-click – pause – single-click (or F2) activates in-place editing of code
names.
Double-click: Opens a list of quotations that have been coded with this code.
Multiple Selection: You can select more than one code at a time to delete, code
a data segment with all of the selected codes, open a network, create output,
assign them to one or more code families, or to create a code family containing
the selected codes (CODES / EDIT FAMILY).
Drag & Drop: You can use the Code Manager as a convenient tool for coding
by dragging codes onto a highlighted piece of data. If you drag codes onto
another code within the same list pane, code-links will be created.
Colors: Super Codes are displayed in red, regular codes in black unless you
color them.
ATLAS.ti 7.1 USER MANUAL
MAIN WORKSPACE: THE HU EDITOR
50
Filter: Click on a code family in the side panel to set a local filter.
Ctrl+Shift+Double click sets a family as global filter (see “The Manager Side
Panel “ on page 52).
Code Manager Toolbar
Figure 30: Code Manager toolbar
From left to right:
• Create a new code.
• Open text pane for writing comments in a full-fledged text editor.
• When double clicking a code, a list of linked quotations is opened. Click the
forward and back buttons to review the list.
• Select a color for one or more selected codes.
• Code the current selection with one or more selected codes.
• Open a network view on the selected code.
• Delete selected code(s).
• Create output.
• Various View options.
• Open the Code Family Manager.
• Enter a search term to search for particular codes.
Code Manager Columns
Figure 31: Code Manager Columns
• Name: Code name.
• Grounded: Code frequency or "groundedness” (i. e., the number of
quotations to which the code is applied).
• Density: Number of links to other codes.
• Created: Creation date and time.
• Author: User who created the code.
• Modified: Date and time of last modification.
• Families: Name of code family if the code has been added to a family.
ATLAS.ti 7.1 USER MANUAL
MAIN WORKSPACE: THE HU EDITOR
51
Memo Manager
The Memo Manager lists the HU’s memos. Memos created or modified today
are listed in bold font. The text pane displays the content of the selected
memo.
Figure 32: Memo Manager
• Single-click selects a memo. The content of the memo is displayed in the text
pane.
• Single-click – pause – single-click (or F2) activates in-place editing of memo
titles.
• Double-click opens the memo editor. This behavior can be changed to
activate the quotation associated with a memo via General Preferences.
• Multiple Selection: You can select more than one memo at a time for bulk
deletion, to attach all selected memos to a data segment, to open a network
on them, to create output, to assign them to one or more memo families, or
to create a memo family containing the selected memos (MEMOS / EDIT
FAMILY).
• Drag & Drop: You can attach a memo to a data selection (“memoing”) by
dragging it into the PD pane (applies to text and image data).
• Colors: Memos content resides in the HU’s file storage until selected for the
first time. Memos, which are not yet loaded are displayed in gray. Memos
which were created or modified today are displayed bold.
ATLAS.ti 7.1 USER MANUAL
MAIN WORKSPACE: THE HU EDITOR
52
Memo Manager Toolbar
Figure 33: Memo Manager toolbar
From left to right:
• Create a new memo
• Toogle: The windows either is display always on top (default), or is closed
when you click somewhere else.
• Open text pane for writing the contents of a memo in a full-fledged text
editor.
• Open a network view on the selected memo.
• Delete the memo.
• Various View options
• Open the Memo Family Manager.
Memo Manager Columns
Figure 34: Memo Manager Columns
• Name: Memo title.
• Grounded: Number of quotations to which a memo is connected.
• Density: Number of codes and other memos to which the memo is
connected.
• Size: Size of content. Counts text characters and embedded objects.
• Author: Name of the user who created the memo.
• Type: Memo type selected for this memo.
• Created: Creation date and time.
• Modified: Date and time of last modification.
• Families: Name of memo family if the memo has been added to a family.
• PDs: Indicates whether the memo is used as the data source for one or more
PDs. A dash indicates that it is not used as a PD.
The Manager Side Panel
The side panels in document, code and memo managers allow much more
immediate access to fundamental activities like selecting families, creating
ATLAS.ti 7.1 USER MANUAL
MAIN WORKSPACE: THE HU EDITOR
53
families and super families, and setting local and global filters. This allows a
much more effective integration into the work flow and saves a lot of mouse
movements and clicks.
You activate or deactivate the side panel by selecting: VIEW / SHOW SIDE PANEL, or
select click on the side panel button in the tool bar (see left)
Figure 35: Side panel in Primary Documents Manager
Creating And Deleting Families
To create a new family, select the items that you want to include using
common Windows selecting techniques (either by holding down the Ctrl- of
Shift key).
Drag and drop the selected items to the side panel, or right-click in the side
panel area and select the option NEW FROM SELECTED ITEMS. Enter a name for the
new family and click ok.
See the chapter Family Life for further information on working with families.
ATLAS.ti 7.1 USER MANUAL
MAIN WORKSPACE: THE HU EDITOR
54
Figure 36: Creating a new family in the side panel
To delete a family, select it in the side panel, right click and select the option
DELETE FAMILY.
Figure 37: Side panel context menu
ATLAS.ti 7.1 USER MANUAL
MAIN WORKSPACE: THE HU EDITOR
55
Renaming A Family
Figure 38: In-place renaming of objects in side panels
Renaming is possible via the in-place method: Select an entry in the side panel
and click left again. Enter a new name.
Side Panel Context Menu
Right-click to open the context menu of the side panel:
Figure 39: Context menu of side panel
New from selected items: Select one or more codes in the Code Manager, then
click this option to create a new family. Another option is to drag the selected
codes in the side panel (see Figure 36).
Set global filter / Remove global filter: See “Setting a Local Filter“ on page 56
and “Setting a Global Filter“ on page 57).
Create Super Family / Change operator: See “Creating Super Families as Global
Filters“ on page 58.
Open Network View: Select a code family and click this option to a open a
network view on this family. See “Families as Nodes“ on page 315.
Delete Family: See “Creating and Deleting Families“ on page 53.
ATLAS.ti 7.1 USER MANUAL
MAIN WORKSPACE: THE HU EDITOR
56
Association Between List Items And Families
If you select an item that is part of a family, the family icon is highlighted. In
Figure 40 for instance the memo*idea memo is selected. As it is part of the
memo family Instructions, the icon of this family is highlighted.
Figure 40: Link between list items and associated families
Setting A Local Filter
If you click on a family in the side panel, you activate a local filter and the list to
the right only shows the items of the selected family. Note that the family is
displayed in bold characters:
Figure 41: Use side panel to filter the list of primary documents
Click on SHOW ALL …. to view the full lists of items again.
Creating A Local Filter Using AND And OR
You can make a selection combining the members of multiple families via AND
or OR. You can see which one is the currently active operator at the button
displayed at the top left of the list of families. The default operator is OR (see
Figure 35 below).
ATLAS.ti 7.1 USER MANUAL
MAIN WORKSPACE: THE HU EDITOR
57
Figure 42: AND and OR operators
To change the operator, you can either click on the button, or right click inside
the side panel and select the option CHANGE OPERATOR from the context menu.
If you select multiple families in the side panel and the OR operator is active, all
items of all selected families are shown (think plus).
If the AND operator is active, only the common items of the selected families
are shown (think intersection).
Setting A Global Filter
If you want to set a family as global filter, thus affecting the display of the
selected items in the entire HU, right click on a family and select the menu
option SET GLOBAL FILTER (see Figure 43 below); or hold down the Ctrl+Shift key
and double-click on a family.
Figure 43: Display of a global filter setting
The family icon is replaced by the filter icon, the name of the family is shown in
red characters and the effected lists show a pale yellow background color.
To reset a global filter, right click the family item and select REMOVE GLOBAL FILTER
(or Ctrl+Shift double-click).
If you have set multiple global filters in more than one manager, use the main
menu option TOOLS / RESET ALL FILTERS.
To set a global filter, you can only select one family at a time. If you want to
set a combination of families as global filters, you need to create a super family
first (see Creating Super Families as Global Filters).
ATLAS.ti 7.1 USER MANUAL
MAIN WORKSPACE: THE HU EDITOR
58
Creating Super Families As Global Filters
You can create super families using the operators AND or OR (see also the
section Super Families).
If you select the OR operator, all items of all selected families are included in
the new a super family (plus).
If you select the AND operator, all common items of the selected families are
included in the new super family (intersection).
To create a new super family, select the desired operator first. Click on the
operator button, or right-click in the side panel and select CHANGE OPERATOR.
Next select the families that you want to combine.
Right-click and select the option CREATE SUPER FAMILY from the context menu (or
hold down the Ctrl-key and click on the operator button).
ATLAS.ti 7.1 USER MANUAL
DATA PREPARATION
59
Data Preparation
Starting And Ending An ATLAS.ti Session
This section describes how to start and end an ATLAS.ti session, how to create
and save a project (a Hermeneutic Unit, see page 13).
Starting ATLAS.ti
ATLAS.ti can be started like many other Windows applications, e. g., via the
Windows Start menu or by clicking on projects or program shortcuts:
Select ATLAS.ti from the Programs menu: START BUTTON / PROGRAMS / SCIENTIFIC
SOFTWARE.
Double-click on the program's shortcut on the desktop, or on your task bar (if
you have created one).
Figure 44: ATLAS.ti desktop shortcut
Figure 45: Loading a primary document
If you open ATLAS.ti for the first time, the Welcome project opens. To load the
welcome document, click on the drop-down arrow in the P-Docs list field and
select the P1: welcome.png.
The welcome document points out the most essential features of the program
so as to help you get started:
ATLAS.ti 7.1 USER MANUAL
DATA PREPARATION
60
Figure 46: Welcome document
The Welcome project is write-protected, i.e. you cannot make make changes
to it, and it is not meant for you to use to add your material. To start your your
own (first) project, you must create a new project.
Select PROJECT / NEW HERMENEUTIC UNIT from the main menu to create a new
ATLAS.ti project.
Logging In
By default, you are automatically logged in as “Super” (Super User). ATLAS.ti
associates the user currently logged in with all objects (like codes, quotations,
memos, etc.) created during a session. If you keep the default settings, all
objects are ‘stamped’ with the user name “Super.”
Create your own
user account!
Especially if you work in a team, we recommend that you create your own user
account. This ensure that every object (quotation, code, memo, etc.) is properly
identified by its author and can even be queried accordingly. For detailed
information, see “User Management“, page 147.
Ending Your ATLAS.ti Session
To close the session, select PROJECT / CLOSE from the main menu. Don't forget to
save your project before closing.
ATLAS.ti 7.1 USER MANUAL
DATA PREPARATION
61
Creating, Opening And Saving A Hermeneutic Unit
Creating A Hermeneutic Unit
For more detail on how to best set up a project see “Setting Up a New Project”
on page 109.
When you start ATLAS.ti and a recently used HU is not loaded, you will see
“New Hermeneutic Unit” in the caption of the HU Editor. You can start
working right away on this new HU.
Alternatively, you can choose PROJECT / NEW HERMENEUTIC UNIT to open a new HU.
To give your HU a name, save it:
Choose PROJECT / SAVE or SAVE
file dialog.
AS
from the main menu, which opens a standard
Browse to the desired folder where you want to save your HU file and enter
a name for your HU.
Click SAVE.
Make it a habit to always write a short comment for any new HU. Describe
the project’s goals and intentions. You and your team members will benefit
from having this useful information available at all times - HU comments are
displayed in HTML and XML output. HU comments are also displayed when
reviewing file properties with Windows Explorer. To write an HU comment,
click on the comment button in the main toolbar.
Opening A Hermeneutic Unit
To Open A Hermeneutic Unit Using The Standard Windows File
Dialog
From the ATLAS.ti main menu select Project / OPEN (shortcut: Ctrl-O).
The Open Hermeneutic Unit file dialog appears. The default folder for
ATLAS.ti projects is the "Textbank" directory, which is assumed to be your
main repository for HUs. But you can store your project file where ever you
want, see “Setting Up a New Project“ on page 109).
Select a HU and click OPEN.
To Open A Recently Used Hermeneutic Unit
Open the PROJECT menu.
Select an HU from the list displayed at the bottom of the Project menu.
ATLAS.ti 7.1 USER MANUAL
DATA PREPARATION
62
To Open The Most Recently Used Hermeneutic Unit At Start-up
When starting ATLAS.ti, the last used HU can be loaded automatically. This
start-up method can be selected under TOOLS / PREFERENCES / GENERAL PREFERENCES,
tab: HU EDITOR. This is the default setting.
To Open A Hermeneutic Unit Using Drag & Drop
You can drag files from the Windows Explorer or the desktop:
From the Windows Explorer, your desktop, or any other folder containing
HU files, drag an HU onto the HU Editor’s main pane or caption.
Protecting The HU Against Concurrent Use (HU .LOK File)
The HU is also
protected against
accidental
concurrent
editing.
When you open an HU, a .lok file is created for this HU (e. g. My
Project.hpr6.lok) to prevent concurrent editing of a HU. The .lok file is deleted
when you close ATLAS.ti.
Sometimes it happens that this file is not deleted (either in case of a system
crash, or the user copied the project folder while ATLAS.ti was still open). If you
then open the HU the next time, a message pops up telling you that the HU is
currently in use by someone and can consequently only be opened in read-only
mode.
If you are sure you are the only person using this HU and you have not already
loaded it in another window, you can treat this message as a “false alarm” and
delete the .lok file for the HU in the Windows file manager.
Saving A Hermeneutic Unit
If you haven’t saved your work already, you will be asked to save the HU when
you close the HU Editor. If you leave ATLAS.ti without saving, your work of the
last session is lost.
To save the currently open HU, select PROJECT / SAVE (AS) from the main
menu. The file dialog opens.
Select a folder and enter a name for your HU.
Click on the Save button. The extension .HPR7 is automatically appended to
the file name.
The Hermeneutic Unit file does not contain your documents! If you want to
save your entire project, you need to create a copy bundle file. See “How to
Create A Copy Bundle File“ on page 131. The copy bundle file contains
your HU file + all data sources.
ATLAS.ti 7.1 USER MANUAL
DATA PREPARATION
63
Pending Changes
Pending changes are changes in open memo or comment text editors (unless
you have saved the text) and in network editors with modified layout that has
not yet been saved. If you are currently editing a PD’s data source, this would
also count as a pending change. If any pending changes are detected when
you are about to close or save the HU, you will be offered the choice to accept
or discard such changes. By accepting the changes, they become part of the
HU and are then saved to disk along with all other changes in the HU.
The extended dialog below lists all pending changes and allows control over
which pending changes are to be committed.
Figure 47: Lists all objects with pending changes
Before taking any further action you can inspect any pending changes in their
respective editors simply by double-clicking an item in the list.
Preparing Primary Documents
Primary Documents (PDs) play a major role in ATLAS.ti’s framework. They are
the interface between a Hermeneutic Unit (HU) and the data. They provide
access to data sources, which are usually files stored on the disks of your
computer or a network drive. This chapter outlines the steps needed to create,
select, and prepare documents so that they will be suitable to use in ATLAS.ti.
ATLAS.ti 7.1 USER MANUAL
DATA PREPARATION
64
Supported Formats
In principle, most textual, graphical, and multimedia formats are supported by
ATLAS.ti. For some formats, their suitability depends on the state of your
Windows system, particularly in regard to what other software is already
installed. Before deciding to use an exotic data format, you should check if this
format is available and if it is sufficiently supported by your Windows system.
For a list of formats that are currently supported as primary documents choose
DOCUMENTS / NEW / ADD DOCUMENTS ... from the main menu and click the File
Type drop-down list that appears at the bottom left of the window (see “
Documents via the File Dialog” on page 72). Only the formats listed in the
drop-down list are supported by ATLAS.ti. To ensure that files are compatible
with your system, assign a few of your documents as PDs. They should loaded
and display (or play, when the source is multimedia) correctly. See also the
sections below on “Preparing Textual Documents“, “Preparing PDF files“,
“Preparing Graphical Documents“, Preparing Audio- and Video Documents“
and “Preparing Google Earth Documents“.
Files that might prove problematic are multimedia files using exotic “codecs”
(software that enables playing of a certain multimedia file format on your
computer) and files that rely on RTF converters like doc and docx files.
However, ATLAS.ti does provide a file quality check when adding document to
a project (see “File Quality Check“ on page 74).
Language Settings
ATLAS.ti can handle documents in pretty much ANY language and character
set, although the program interface is, of course, in English only.
Requirements
A first requirement is that language-specific fonts are installed on the
computer. If you use special regional languages, this might require that you
install an appropriate language pack on your computer.
Next, make sure that the correct language is set in the Language tab at the
bottom right of the ATLAS.ti window. It is set to Default if nothing else is
selected.
ATLAS.ti 7.1 USER MANUAL
DATA PREPARATION
65
Figure 48: Bosnian (Cyrillic) is selected as
language in this case
After you have selected a specific language that is not the default language on
your computer, a two letter abbreviation is displayed in the language tab.
User Interface Language
The user interface language can be set under TOOLS / PREFERENCES. See “To Set
The User Interface Language“ on page 454.
Font Settings
If characters are not displayed properly in all windows and lists, you may need
to adjust the font settings:
Select TOOLS / PREFERENCES / GENERAL PREFERENCES and then the Font tab.
In order to reduce the list of displayed fonts, select only those that are
compatible with the language you are using:
Figure 49: Selecting language compatible fonts
Select one or more or all object types for which you want to change the font.
Select a font and appearance (bold, italic) for these object types.
If you have projects in different languages, you can specify different font
themes (see top of tab).
ATLAS.ti 7.1 USER MANUAL
DATA PREPARATION
66
Figure 50: Creating new font themes
InVivo Code Settings
First check whether the appropriate language is set in the language tab (see
above).
Then select TOOLS / PREFERENCES / GENERAL PREFERENCES and then the TEXT EDITOR
tab.
Select the desired language:
Figure 51: Language setting for InVivo coding
System Settings For Thai And Asian Language Support
On Western European And US Windows Systems
In case you are working with Thai and Asian languages on non-Asian systems
such as U.S. or Western European Windows, the appropriate language pack
needs to be installed on your computer.
Log in to your computer with full administrative rights.
Select START / CONTROL PANELS / REGIONAL
AND
LANGUAGE OPTIONS.
Select the Languages tab and then the option to install the language files
that you need.
Under the Advance tab, select the language in the field "Language for nonUnicode programs”.
ATLAS.ti 7.1 USER MANUAL
DATA PREPARATION
67
Size Restrictions
Theoretically, size restrictions do not play a major role due to the way ATLAS.ti
handles documents. However, you should bear in mind that your computer's
processing speed and storage capacity affect the performance. Excessively large
documents can be uncomfortable to work with, even when you have an
excellently equipped computer. The crucial issue is not always the file size, but
rather, in the case of multimedia files, the length of playing time. For textual
documents, the number and size of embedded objects may cause
extraordinarily long load times. There is a high likelihood that if a textual
document loads slowly in ATLAS.ti, it would also load slowly in WORD or
WordPad.
Make your data
sources as small
as possible but as
large as
necessary.
For very long texts or multimedia files, navigation can be severely handicapped,
e. g., scrolling to exact positions.
We recommend making data sources as small as possible but as large as
necessary without breaking passages that belong together. Even with many
smaller documents, ATLAS.ti supports unified processing and fast navigation.
Preparing Textual Documents
Supported Formats
ATLAS.ti principally handles documents in plain and Rich Text Format (RTF).
MS Word .doc And .docx Files
For your convenience we also support the inclusion of documents that are not
RTF. ATLAS.ti converts these documents for you and -if you work with
managed documents- stores the RTF version in the library. Thus, conversion
takes only place one time.
ATLAS.ti uses converters installed on your system (as part of the basic
Windows or Office installation). In case ATLAS.ti informs you that it cannot
add a doc or docx file to your project, you need to download the latest
compatibility pack from the Microsoft website and install it. It is available free
of charge.
Rich Text
Rich Text
supports
character- and
paragraph-related
formatting. Data
from other
applications can
be embedded
RTF (Rich Text Format) is a proprietary text data format developed and
propagated by Microsoft, and intended as an industry standard for exchanging
documents between different applications. It supports such extensions as
character formatting (bold, italic, color, etc.) with different fonts and sizes,
paragraph formatting (bullets, indentation, alignment, etc.), embedded objects
(graphics, tables, video, etc). and more.
All textual documents are displayed on the basis of Rich Text within ATLAS.ti.
Saving documents as rich text is a standard feature that can be found in most
word processing programs. In Word, for instance, this is an option that can be
selected in the data type field when saving documents under a different name
("Save as"). We recommend storing documents as “rich text” right away even
if they are currently “plain text” and do not contain any formatting.
ATLAS.ti 7.1 USER MANUAL
DATA PREPARATION
68
Plain Text
Of course, plain (not formatted) text documents can always be used, including
documents using Unicode. In the course of editing plain text documents within
ATLAS.ti, they can be “enriched” and saved with all added formatting.
Preparing PDF Files
In general it is useful to have an understanding what PDF is—and what it is
not.
When PDF was invented, it was never meant to be a text format. Its goal was
to preserve the same layout for onscreen display and in print. Thus, PDF is
perfect if you need the original layout.
When preparing PDFs, you need to pay attention that you prepare a text PDF
file and not a graphic PDF. If you do the latter, then ATLAS.ti treats it as a
graphic file and you cannot search it or retrieve text.
When scanning a text from paper, you need to use character recognition
software (OCR, frequently provided with your scanner) in order to create a text
PDF file.
Another issue that needs to be pointed out is that you can retrieve text, e. g.
from a coded segment, but the output will be in rich text. Thus, you may loose
the original layout. This is due to the nature of PDF as mentioned above. It is a
layout format and not really meant for text processing.
File Converter Service
File Convert Service offers a convenient way to batch converts Word document
to PDF files and Word DOC(X) files to rtf files.
Figure 52: File Convert Service
To use this service, select DOCUMENTS / DATA SOURCE MANAGEMENT / FILE CONVERT
SERVICE.
The File Explorer opens. Select for instance a few DOC files that you want to
convert and click OPEN.
ATLAS.ti 7.1 USER MANUAL
DATA PREPARATION
69
ATLAS.ti converts the files for you. The converted versions, e.g. the RTF files,
will be stored in the same folder as the DOC files that were converted.
Preparing Graphical Documents
Supported Formats
More than twenty graphic file formats are accepted by ATLAS.ti as valid data
sources for PDs, including BMP, JPEG, and TIFF. Scanners often produce TIFF
and digital cameras usually create JPEG images. Multipage TIFF files are also
supported. They need to prepared in an image editing software that supports
such an option.
Size Recommendations
Digital cameras and scanners often create images with a resolution that
significantly exceeds the screen’s resolution. When preparing a graphic file for
use with ATLAS.ti, use image-processing software to reduce the size so that the
graphics are comfortably displayed on your computer’s screen. If an image
does not fit into the primary pane, you may need to use the zoom function
available via the mouse wheel or the zoom button when displaying the image
using ATLAS.ti.
Preparing Audio- And Video Documents
Supported Formats
ATLAS.ti’s multimedia capabilities are built upon directX technology. Both MCI
and DirectShow are available to use virtually all files that can be played on your
computer. While drivers for AVI and WAV files are installed in any basic
Windows system, formats like MOV, QT, AU, SND, MPG, M4A, M4V and
MP3 may require a dedicated driver.
Check the Multimedia section in HELP / TECH SUPPORT INFO / SYSTEM REPORT for a
complete list of supported media types.
In case you have problems playing a video file, the likely cause is a missing
codec. Codec is an artificial blend of two words, coder and decoder. Thus, a
codec is capable of encoding and/or decoding a digital data stream or signal.
When creating a video file, a certain codec is used to encode it; when you want
to play it, you need the same codec to decode it. But if this codec is not
available on your computer, the file cannot be played. The solution is to go
online and to search for a codec package. They are available in a number of
languages and are usually available free of charge.
Detailed instructions for preparing video files for use in ATLAS.ti are
available from http://www.atlasti.com/uploads/media/video_formats.pdf
ATLAS.ti 7.1 USER MANUAL
DATA PREPARATION
70
Preparing Google Earth Documents
Even with a non-standard data source as the "World" (as seen through Google
Earth) we still remain within the Primary Document metaphor. Thus, there is
only ONE data source worldwide, and all Google Earth PDs created in any HU
all refer to the same data source located at the Google servers.
However, you can also use more than one Google Earth PD (even if there is
only world...) in order to create distinct sets of locations, to simulate tours, to
simply tell different stories.
The prerequisite for use of the features described in this section is that
Google Earth is installed on your computer. See http://earth.google.com/
(or your respective language website) for more detail.
KMZ And KML Documents
KMZ files are zipped KML (Keyhole Markup Language) files, which will start
Google Earth and fly you to a specified location.
KML, or Keyhole Markup Language, is an XML grammar and file format for
modeling and storing geographic features such as points, lines, images,
polygons, and models for display in Google Earth and Google Maps.
KML is used to share places and information with other users of Google Earth
and Google Maps (and now ATLAS.ti). You can find many KML files that
describe interesting features and places On the Google Earth Community site.
ATLAS.ti 7.1 USER MANUAL
DATA PREPARATION
71
Adding Documents To A Project
When you add a document to your project, a new Primary Document, which is
an ATLAS.ti internal object, is created, e. g., (“P 1”) and the “data source” (e.
g., file text_1.rtf) is associated with this PD at the same time. Exceptions are
embedded documents. The content of embedded documents is stored with the
HU file. This is the case when you create a new text document (see “Adding
embedded documents (Text files only)“ on page 76), when you import f4 or f5
transcripts (see Importing Associated Documents Transcribed elsewhere) and
when importing survey data (see Importing Survey Data ).
More than one data source can be added as a PD at the same time (e. g., by
selecting multiple files in the file dialog), but there is no need to add all
documents at one time. You can add more files during the course of the
analytical process.
Bulk-added files are listed in alphabetically order. For every PD created during
assignment, an ID is created consisting of a prefix “P” and a consecutive
number. In addition, the name of the data source (file name) is appended to
the ID. This name can be changed later for display purposes.
This “one source - multiple PDs” principle is not restricted to one HU. A data
source can be added as a PD (or many PDs) in more than one HU. Each PD,
however, refers to exactly one data source.
Thus, if you plan to analyze a single document source from several different
perspectives, there is no need to create physical copies of the document and
add each of the copies as a PD to the HU. A single data source can be added
more than once, which creates as many PDs, each with its own number and ID,
but they all refer to the same data source.
What Happens Behind The Scene If You Add
Documents To A Project
Up until ATLAS.ti 7, documents were assigned to a project and linked to the
HU. Frequently, users were not aware that they were working with linked
documents and they did not pay attention to the dependencies this created
between the documents and the ATLAS.ti HU. This meant documents could
not be moved to different locations or renamed without “notifying” the
ATLAS.ti HU about it.
There have always existed solutions to the problem like the one-folder setup
(HUPATH). However, if users ended up in a situation where they could no
longer load their documents, it caused moments of irritation (“have I lost all of
my coding now?”), many hours of support time explaining users the principles
of linked documents and why it actually makes a lot of sense to NOT import all
materials: For one, the HU file remained extremely small, and that in turn, lets
the program perform smoothly even if you work with hundreds or even
thousands of files and/or with huge documents such video files.
ATLAS.ti 7.1 USER MANUAL
DATA PREPARATION
72
But even if this makes a lot of sense from a technical point of view, working
with linked documents can be problematic for some users, especially when they
are not aware of this structure.
Managed Documents
So ATLAS.ti 7 introduces a powerful new solution to make data and project
management easier. The solution is called managed documents and it combines
the best of both worlds now.
How does this work?
If you add (rather than assign) documents to a project, ATLAS.ti makes a copy
of the documents (the data sources) and puts them into a library. The library is
a special file repository. When you install ATLAS.ti, the needed folders for the
two available libraries are created automatically. The library locations are a
workspace for ATLAS.ti and you do not have to concern yourself with them.
You can, however, change the location of the library if you want to. This for
example is relevant for team projects where documents are stored at a shared
location (see “Setting up Team Projects“ on page 110).
Two predefined libraries are available to you, a private library for single user
projects and a team library for team projects (see “The Document Libraries“ on
page 104 for further detail).
Once you have added documents to either the private or the team library,
ATLAS.ti will not need the original source documents anymore.
Unique Fingerprints For Documents
During the process of importing documents into the library, each document is
provided with a unique fingerprint. In version 6, the order of the documents
(P1, P2, P3, ….) still mattered when merging projects. This does no longer
apply due to the new way of identifying documents in ATLAS.ti 7.
Team projects: In order to ensure that identical documents in fact get the
same fingerprint, the project administrator must create a Master HU first,
add documents to it and then distribute a copy bundle file to all team
members. If a shared location is used as library, then it is sufficient to
distribute the Master HU file. See “Team Projects Using a Shared Location“
on page 115.
In users' everyday work, we realize that this new way of identifying primary
documents via fingerprints is either not known or the effect has not been fully
understood. In case you end up with two primary documents after merging
HUs that however contain the same content, please read the following
“Trouble-shooting after merging“ on page 163.
Adding Documents Via The File Dialog
To add files:
From the Documents or Project main menu, choose NEW / ADD DOCUMENTS.....
Or click on the file loaded button in the main tool bar. For single user
ATLAS.ti 7.1 USER MANUAL
DATA PREPARATION
73
projects select Add Documents (My Library); for team projects select Add
Documents (Team Library).
If documents already exist in the library select Add from Library. By default,
all file types that are permitted to be assigned as PDs are offered. By
selecting from the filter drop-down, you can restrict the type of documents.
Browse and select one or more data source files to be added to the HU and
click the Open button.
The selected files are added as Primary Documents and the data sources are
imported into the library.
ATLAS.ti remembers which library you have chosen when adding documents to
a new HU. If you add further documents, these will be imported into the same
library. If you have chosen the team library, the HU will be marked as a team
HU.
Figure 53: Your project becomes a Team HU if you add documents to the team
library
Adding Documents Using Drag & Drop
Adding documents via Drag & Drop may be more convenient when you have
different browsers opened on different folders.
Open Windows File Explorer. (e. g., by selecting TOOLS / EXPLORER from the
main menu)
Select the folder from where you want to add files.
Select one or more files.
Drag the selected files onto the HU Editor.
You will then be asked whether the files should be added to My Library or
the Team Library (see Figure 54).
ATLAS.ti 7.1 USER MANUAL
DATA PREPARATION
74
Figure 54: Select a location when adding documents via drag & drop
Complete folders
can be assigned in
one step
You may also drag & drop sub folders. This essentially add all files stored in the
sub folders and any sub folders below. Documents not compatible with
ATLAS.ti are rejected.
You can imagine that this operation can assign an unexpected number of files
to your HU. Make sure you know what is in the folders.
You can drag arbitrary files (as opposed to the standard technique that
filters the files offered). ATLAS.ti however detects incompatible file formats
during the quality check (see page 74).
Adding Documents By Dragging A Link
Add documents by dragging a link directly from your web browser into the PD
list field or PD Manager window.
If the HU does not contain documents yet, you will be asked which library you
want to use (see Figure 54 above).
File Quality Check
During the import process, a quality check takes place. If you add large-sized
files, you will be asked whether you want to keep these documents linked
rather than to import them.
If your audio files were created with a variable bit rate (VBR), ATLAS.ti offers to
convert them into files with a constant bit rate instead. Unless you have very
good reasons against it, you should always allow conversion; this increases the
precision of quotations.
VBR files can behave very poorly when it comes to playing the exact clips
that were captured as quotations.
ATLAS.ti 7.1 USER MANUAL
DATA PREPARATION
75
Figure 55: File quality check during import
If you add a non-compatible format (like an Open Office document), you will
also be informed:
Figure 56: File quality check: Adding non-compatible file formats
If the document only contains plain text, you can choose to import it as text
document.
Adding Multimedia Documents
You can add audio and video files using the methods described above. As the
data sources are copied when they are imported into the library, you may want
to consider to add large video files as external documents. The file quality
check will alert you if this is the case ( (see “File Quality Check“ on page 74).
When adding a video file, preview images are created and displayed on the
right-hand side of the video. The size of the preview images is up to 50 x 50
pixels. To create these images, one frame per second is selected. Depending on
the length of the video, this may take a few seconds or up to a few minutes.
You can already start working on the file. You don't need to wait for all images
to be created. Next to the preview images you see the audio wave form (see
also Figure 67).
ATLAS.ti 7.1 USER MANUAL
DATA PREPARATION
76
Adding Embedded Documents (Text Files Only)
Embedded documents are stored with the HU file. Thus, the data sources are
neither linked as external files nor is a copy stored in the library.
A project solely consisting of embedded documents is suitable for smaller
studies with up to approximately 100 documents. It however always depends
on the size of the documents.
This approach is also a good option for working with sensitive data material.
When saving the HU, the data material is highly compressed and therefore
unreadable outside ATLAS.ti. In addition, the HU can be password-protected.
This should make unauthorized access reasonably difficult.
Embedded documents are also used:
• when working with associated documents or when importing f4 / f5
transcripts (see page 88ff)
• when importing survey data (see page 97ff)
• when using memos as PDs (see page 77).
How To Create A New Embedded Document
You generate a new empty text document within ATLAS.ti and then you copy
and paste the contents that you want to analyze into it:
Open ATLAS.ti and select the main menu option DOCUMENTS / NEW / NEW TEXT
DOCUMENT.
Enter a name for the document into the window that opens.
The document is loaded in edit mode.
Copy the text you want to analyze and paste it into the primary document.
Protect the document by quitting edit mode. You will find the edit mode
button in the main toolbar towards the right hand side. Click on the pen and
select the option SAVE AND LEAVE EDIT MODE.
Proceed in the same way with all other documents that you want to analyze.
Save the HU file.
Make sure that you always create a backup copy of this file and store it at a
safe location!
Adding A Google Earth Document
To create a new GE PD,
ATLAS.ti 7.1 USER MANUAL
DATA PREPARATION
77
From the Documents or Project main menu, choose NEW / NEW GOOGLE EARTH
PD. Or click on the file loaded button in the main tool bar.
ATLAS.ti starts the application Google Earth for you and displays the Google
Earth window within the ATLAS.ti editor. Depending on the speed of your
internet connection this may take a few seconds.
Create And Adding A Google Earth Snapshot
You can create a snapshot from the geographic region that is currently shown
on your screen within the HU editor. This snapshot is automatically add as
primary document.
From the Documents or Project main menu, choose NEW / NEW GOOGLE EARTH
SNAHPSHOT PD. Or click on the file loaded button in the main tool bar.
Then check your list of primary documents. The new GE snapshot has been
added at the end of PD list and can now be loaded and treated like an image
document.
Adding Memos As Primary Documents
You can also use memos as PDs. They will be turned into embedded
documents (see “Adding embedded documents (Text files only)“). This allows
you for example to apply codes to your analytic notes on the data.
Select a memo in the Memo Manager.
Select the menu option MISCELLANEOUS / USE AS PRIMARY DOC. T
You find more detail on the memo function on page 243.
Rearranging And Renumbering PDs
The Id of a PD determines its position in the list of PDs when in default sort
order (by name).
To rearrange PDs (to change their Ids), use one of the following options:
• Rearrange a selected PD only.
• Rearrange one or more PDs using drag & drop.
• Renumber all PDs to make the current sort permanent while eliminating
gaps in the numbering at the same time.
Of course, all quotations belonging to a repositioned PD are taken along.
Rearranging A Selected Primary Document
Select the PD in the Document Manager whose list position should be
changed.
ATLAS.ti 7.1 USER MANUAL
DATA PREPARATION
78
Choose DOCUMENTS / MISCELLANEOUS /CHANGE POSITION from the main menu.
Enter a position number after which the selected document is to be moved.
Rearranging Primary Documents Using Drag & Drop
Rearranging PDs via drag & drop is a convenient alternative and lets you
rearrange a number of selected PDs concurrently.
Open the PDocs Manager.
Select one or more PDs.
Start to drag the PD(s).
A dashed bar appears at the current list insertion point.
Drop the PDs when you reach the desired location for the documents.
Set the sort criterion to ID by clicking on the ID header for an optimal
feedback of the renumbering procedure.
Renumbering All Primary Documents
This option becomes useful after you removed several documents from a HU.
When removing PDs from a HU, previously assigned IDs (e. g. "P 1") are not
"released." This results in gaps in the sequence of PD numbers. You may
remove these gaps by renumbering all PDs in the HU using the Renumber All
feature.
Select DOCUMENTS / MISCELLANEOUS / RENUMBER ALL from the main menu.
It is not necessary to renumber PDs in ATLAS.ti. Doing so can give reports a
cleaner appearance.
Loading And Navigating Primary Documents
Loading Primary Documents
Whenever the content of a PD needs to be displayed, printed, or searched, it
accesses its data source (file, memo) and loads the content. This request is
often triggered indirectly, e. g., by displaying (or printing) a quotation. For
performance reasons, documents are only loaded once; they are “cached”
unless this option is turned off.
ATLAS.ti 7.1 USER MANUAL
DATA PREPARATION
79
The following lists a few procedures that directly or indirectly load the content
of a PD:
• Activating it in the document drop-down list or the PD Manager.
• Activating a quotation in the quotation drop-down list or the Quotation
Manager.
• Selecting a quotation for an activated (double-clicked) code or memo.
• Activating a hyperlink in the margin area.
• Using the LOAD option from the context menu of a PD node in a Network
Editor.
To Load A PD Using The Drop-down List
Click on the PD drop-down list.
Select a PD by clicking on an entry in the list. The selected PD is displayed in
the PD pane. If the list does not display all PDs assigned, the scrollbar lets
you navigate the list of entries.
To Load A PD Using The PD Manager
Open the PD Manager by clicking the button to the left of the PD dropdown list.
Double-click an entry in the PD Manager to load and display the PD.
The HU is also
protected against
accidental
concurrent
editing.
Content Caching
By default, the content of PDs is “cached,” (i. e., kept in memory) unless this
option has been switched off in GENERAL PREFERENCES. The benefit of caching is
that the time a document requires to be ready for use is greatly reduced
whenever its content is accessed more than once (e. g., when auto-coding text
passages). The drawback of caching is that a larger amount of internal memory
is needed when loading many large documents, which might in turn create
performance issues on systems with insufficient memory. Caching can be
turned off completely, but you can also empty the cache periodically by
choosing menu option DOCUMENTS / DATA SOURCE MANAGEMENT / CLEAR DOCUMENTS
CACHE.
With caching turned off, repetitive operations like auto-coding will be
significantly slowed down.
ATLAS.ti 7.1 USER MANUAL
DATA PREPARATION
80
Multi Document View
When you click on the plus sign on the right hand side of the HU editor, you
can open up three more regions for the display of documents. Thus, you can
view (and work on!) up to four documents side-by-side.
Drag a document from the navigation pane (see Navigation Pane [11]) or the
P-Docs Manager onto the region button at the right hand side of the HU Editor
to load a second document. Alternatively, click on the region button first to
open a new region and then drag a document in the empty region pane.
Figure 57: HU editor with two document regions
The PD bar is yellow to indicate the current active document. All inactive PD
bars are gray. You can turn an inactive document into an active one by either
clicking on the gray PD bar, or simply click inside the document pane of the
inactive document.
If you only want to compare the documents without seeing the margin area,
you can switch the margin area off by selecting the main menu option VIEWS /
MARGIN AREA or click on the Margin button in the vertical tool bar. This switches
the margin area on or off for the currently active document only.
If you want to change the position of the documents, click on a PD bar and
drag & drop it into the desired document region.
ATLAS.ti 7.1 USER MANUAL
DATA PREPARATION
81
Figure 58: Moving documents between regions
Navigating Within Primary Documents
The available navigation options depend on the media type of the selected PD.
Navigating Within Textual Primary Documents
Textual PDs allow for a variety of options to display different parts of the text:
• You can scroll up and down using the mouse wheel.
• The arrow keys and other navigational keys can be used to move through
the text.
• Jump to specific line/paragraph numbers using the GO-TO-PARAGRAPH button
to the left of the PD pane.
• You may also zoom the content via the ZOOM PD button in the vertical tool
bar (see left). To reset the view to 100%, hold down both SHIFT+CTRL key
while you click on the ZOOM + button.
You find a selection of predefined sizes in the Size tab in the bottom right of
the ATLAS.ti window:
ATLAS.ti 7.1 USER MANUAL
DATA PREPARATION
82
Figure 59: Setting the display
size of primary documents
Some Additional Notes On Displaying And Navigating PDF
Documents
You can view PDF documents page by page or select to view continuous
pages. If your PDF documents contain bookmarks, you can chose whether you
want to see them or not and where to position them.
To change the settings for PDF documents, select the main menu option
TOOLS / PREFERENCES / PDF PREFERENCES.
Figure 60: Setting PDF preferences
ATLAS.ti 7.1 USER MANUAL
DATA PREPARATION
83
Click on the colored rectangular area to select a highlight color.
Select the continuous page display option to scroll down the entire PDF
document.
If selecting the single page option, only one page at a time is displayed. When
moving down and up the scroll bar, a preview image of the other pages is
displayed (see below).
Figure 61: Single page view with preview image
When selecting the single page view, click on the Page button in the status bar
to move back and forth. Or click on the preview image to jump to the
displayed page.
Figure 62: Page button in the
status bar
In case, the PDF document includes bookmarks and you want to display them,
select the appropriate option in the Preferences window (see Figure 60).
Bookmarks are displayed in the navigation pane:
ATLAS.ti 7.1 USER MANUAL
DATA PREPARATION
84
Figure 63: Display of PDF bookmarks
Changing The Display Size Of PDF Documents
If you increase the size of the editor window, the size of the PDF page is
enlarged. You can also use the Zoom buttons in the vertical tool bar and the
size tab in the status bar to set the display size of your PDF document. The size
tab in status bar shows the actual size of the PD.
When clicking on the Size tab when a PDF document is loaded, you have a few
additional options:
Figure 64: Additional display options for PDF files
Navigating Within Image Primary Documents
To change the visible section of a graphical PD:
Use the scroll bar.
You can scroll up and down using the mouse wheel.
The cursor arrows and other navigational keys can be used.
ATLAS.ti 7.1 USER MANUAL
DATA PREPARATION
85
Figure 65: Displaying comments of image documents
When you click on the upper left corner of an image PD, its comment is
displayed in a pop-up window:
Figure 66: A red dot indicates that the photo PD contains
geographical information
If you see a red dot in the upper left hand corner, the image contains
information about the geographical location where the photo was taken.
Double-click on the red dot to open Google Maps at this location.
Navigating Within Multimedia Primary Documents
ATLAS.ti 7.1 USER MANUAL
DATA PREPARATION
86
Figure 67: The various aspect of a loaded video document`
If you move the cursor inside the video pane, the media controls appear and
you can start, stop and pause the video, skip forward and backwards.
If you right-click on the video preview, you can set a number of display options
in the context menu (see Figure 67). You can for instance hide the preview
images, the audio waveform or the time indicators that are displayed when
selecting a multimedia data segment (see “Coding audio and video
documents“ on page 199 .
Two orange sliders that appear when you move the mouse pointer over the full
preview let you select just the section of the video that you want to see in the
margin area (see Figure 68):
ATLAS.ti 7.1 USER MANUAL
DATA PREPARATION
87
Figure 68: Selecting an area of the video file to be displayed in the margin area
SHORT-CUT KEYS
Play / Pause: Play = P, to switch between play and pause, press the Space bar.
Stop = S
Removing Primary Documents From A Project
If you remove a PD, the data source to which it refers is not deleted or
otherwise affected. If you have documents to one of the two libraries, the
document remains in the library (see “The Document Libraries“ on page 104).
However, removing a PD does delete all of its quotations from the HU. As a
consequence, all references to other quotations (hyperlinks), other codes, and
memos are also removed.
Select the PD to be removed from the HU.
Choose DOCUMENTS / REMOVE FROM PROJECT from the main menu. Or select a PD
in the Primary Document Manager, right click on the document and choose
REMOVE FROM PROJECT from the context menu.
ATLAS.ti 7.1 USER MANUAL
DATA PREPARATION
88
Data Transcription
The A-Docs function, introduced in ATLAS.ti 6, allows you to not only
transcribe your data within ATLAS.ti, but to also link documents to each other
in such a way that you view them synchronously. This means you can read
your transcript and listen to the audio file hearing the original tone of voice or
viewing the segment in the video file. When in the midst of your analysis, you
can mark a segment or a quotation of an associated document and instantly
listen to the original audio or view the video. The audio/ video file stops at the
end of the marked segment. You can also use the association points as
navigation device, e. g., to enter at a particular point in the file or to easily
jump around.
Adding And Associating Multimedia Files And
Transcripts
Below the process of adding a blank transcript file to an ATLAS.ti project and
the process of transcription is explained step-by-step:
Add the audio file or the video file that you want to transcribe: From the
Documents or Project main menu, choose (NEW /) ADD DOCUMENTS.....
Create a a new internal document for the transcript: DOCUMENTS / NEW / NEW
TEXT DOCUMENT.
Enter a name for the transcript. It is immediately loaded in the HU editor in
edit mode.
Load the audio or video PD into the second region of the HU editor (see
“Multi Document View“ on page 80).
Next you need to associated the two files with each other.
From the main menu select DOCUMENTS / ASSOCIATED DOCS / ASSOCIATE WITH PD
FROM REGION.
A new association is automatically created and the Association Editor opens.
The default name is S 1, S 2, S3 and so on. For a better overview, it is
recommended that you replace the default name with a unique name:
Select FILE / RENAME from the Association Editor's menu and overwrite the
default name. Click OK to confirm.
You can also associate documents by dragging & dropping them from the
PDocs Manager into the Association Editor. To open the Association Editor
chose DOCUMENTS / ASSOCIATED DOCS / OPEN ASSOCIATION EDITOR.
One Hermeneutic Unit can include as many associations as you like, one
association for each set of associated documents, and two documents per set.
The following combinations are currently supported: audio– text and video–
text. In order to keep track of your associations, each association has an ID,
and a unique name can be given as well.
ATLAS.ti 7.1 USER MANUAL
DATA PREPARATION
89
Setting Rewind Time
When transcribing, it is often useful to listen once again to the part one just has
transcribed. Therefore you can set an interval from 1 to 5 seconds. When
starting the multimedia file, the file automatically rewinds the time interval that
you have set.
To set the rewind time, click on the AUDIO menu of the Association Editor and
select the desired rewind time.
Figure 69: Set rewind time
Start Transcribing
The new empty document should still be loaded and in edit mode. If not, load
it again and enter edit mode (click on the pen button in the main tool bar, see
also “Editing Primary Documents“ on page 137).
Check your settings in the Association Editor as shown in Figure 70 below.
Figure 70: Settings for transcription
ATLAS.ti 7.1 USER MANUAL
DATA PREPARATION
90
The default setting is for anchors to be always displayed. You can deactivate
this option in the Association Editor via the menu TEXT / SHOW ANCHORS.
Start the playback of the associated multimedia file via the F4 key or click the
appropriate button in the Association Editor as shown left.
Alternatively, you can also use a foot switch. The foot switch needs to be
configurable to the F4 key for starting and stopping a multimedia file.
Listen to whatever part you can remember; then press the F4 key again.
Type what you heard.
Press the F8 key or click or the anchor button in the Association Editor to set
an anchor. The association anchor links the matching parts in the documents.
A red dot is displayed within your text and an entry is added to the
Association Editor.
Press F4 to play the audio file again.
Listen to whatever you can remember, press F4, type the text, press F8, then
F4 again.
Figure 71: Transcript with association anchors
The closer the distance between two association anchors, the better will be the
synchronization. However, it is not required to set anchors at any particular or
prescribed intervals (for instance at the end of every line of text). If you mark
longer segments, interpolation is used to synchronize the text with the
associated multimedia file.
Save the text from time to time by clicking on the edit pen selecting the SAVE
ONLY option.
ATLAS.ti 7.1 USER MANUAL
DATA PREPARATION
91
When you are finished with your transcript or want to take a break, select
the option SAVE AND LEAVE EDIT MODE. Then save the HU (PROJECT / SAVE).
Figure 72: Edit sub menu
You can either use the functions key F4 to start and stop a recording, or use
a foot switch. This saves about 30% of transcription time. You can use any
foot switch that is configurable to the F4 key (see for example the web
page of the developers of the free transcription software f4:
http://www.audiotranskription.de/english/)
Insert Anchors Automatically
If you want ATLAS.ti to set anchors automatically at the end of each
paragraph, select TEXT / AUTO INSERT ANCHOR WITH RETURN in the Association Editor.
Delete Association Anchors
If you set an anchor accidentally, you can correct this by clicking F8 a second
time, or click on the remove anchor button (see left).
Another way to delete anchors is via the Association Editor: Select an anchor in
the editor and then either press the Del key on your keyboard or select the
menu option ASSOCIATION / DELETE ANCHOR.
Undo
Setting or deleting an anchor can be reversed via the undo option:ASSOCIATION /
UNDO, CTRL+Z)
Naming Anchors
You can use the list of anchors in the Association Editor to navigate through
the associated documents. For this purpose, anchors can be named.
To name an anchor, select it, click on the name field and enter a name.
ATLAS.ti 7.1 USER MANUAL
DATA PREPARATION
92
You can also use the currently highlighted text as name. In order to do this,
click F9 or select the menu option TEXT / GRAB TEXT AS NAME (see Figure 71).
Adding Documents Via The Association Editor's Menu
First you need to create a new association: select FILE / NEW from the
Association Editor's menu. A new association is immediately created. The
default names are S 1, S 2, S 3, S 4, etc.
Load the primary document that you want to transcribe (see “Loading
Primary Documents“ on page 78. Then select the menu option ASSOCIATION /
INSERT PRIMARY DOCUMENT.
Now load the file that you have prepared for transcription. Select the menu
option ASSOCIATION / INSERT PRIMARY DOCUMENT again. Now the two documents
are associated.
Deleting Associations
The active association that is shown in the editor can be deleted via the menu
FILE / DELETE.
Associating Two Already Existing Documents
When you already have a transcript that is not yet associated with its audio or
video file, you can synchronize the two documents by going through the
transcript and setting anchors. This is how it works:
Create a new association in the Association Editor and add the two
documents (see page 88).
Start the multimedia file with F4, listen to it or view it. Stop it at a certain
point (press F4 again), locate the matching text in the transcript, and set an
anchor at the end of the matching text passage (press F8).
Start the multimedia file again with F4, listen to it or view it. Stop it at a
certain point (press F4 again), locate the matching text in the transcript, and
set an anchor at the end of the matching text passage (click F8). And so
on....
As you can open the two documents side by side, you can move through the
documents quite quickly. It should not take much longer to create the
associations than the actual duration of the multimedia file.
Importing Associated Documents Transcribed Elsewhere
Currently, ATLAS.ti supports the import of transcripts produced with f4
(Windows), f5 (Mac) and Transana. Time markers from the transcript are
automatically converted to association anchors. The connected audio or video
file is also imported.
ATLAS.ti 7.1 USER MANUAL
DATA PREPARATION
93
For more information on f4/f5 see:
http://www.audiotranskription.de/english/f4.htm
For more information on Transana, see: http://www.transana.com/
Preparing Transcripts In F4/F5
When preparing a transcript in f4_2012, it is possible to change the format for
time stamps. However, for import in ATLAS.ti, the default format is needed:
00:00:00-0 (hours:minutes:seconds-milliseconds).
Figure 73: Settings for time stampes in F4_2012
After preparing and saving the transcript in F4/F5 do not open it in Word
and make changes in Word. This may corrupt the recognition of the time
stamps in ATLAS.ti. – Also do not change the file names of either the
transcript or the multimedia file. If you do, open the transcript in f4 and reassociate it with the multimedia file.
Preparing Transcripts In Transana
When preparing a transcript in Transana, you need to save it as external file
(FILE / SAVE TRANSCRIPT AS...). Before you do that you need to activate the time
code values as shown in Figure 74. Hide the time code indexes (red symbol).
You can still import a document that shows indexes, but they will just be
displayed as an additional symbol in addition to the red dots that mark the time
stamps in ATLAS.ti and thus are more disturbing than helpful.
ATLAS.ti 7.1 USER MANUAL
DATA PREPARATION
94
Figure 74: Setting before saving a transcript in Transana
How To Import Transcripts
To import a transcript, select the main menu item DOCUMENTS / NEW / IMPORT
TRANSCRIPT. A file browser opens.
Browse to the location where the transcript is stored, select it and click on the
open button. If the associated multimedia file is not automatically
recognized, you will be asked to select it. The file browser opens again and
you can select the multimedia file.
Select whether to import the multimedia file in My Library or the Team
Library (see “The Document Libraries“ on page 104).
The transcript is added as an internal document (see “Adding embedded
documents (Text files only) on page 76). A new association is created in the
Association Editor, the two documents are added to this association and the
time code values are converted to anchors.
Load the transcript into the HU editor and click on the red circle at the top
right-hand side of the document to load the associated multimedia file (see
Figure 75 below).
Working With Associated Documents
All A-Doc functions can be accessed either via the main menu DOCUMENTS /
ASSOCIATED DOCS or from the Association Editor. A Hermeneutic Unit can contain
unlimited numbers of associations, but only one can be active at any given
time.
Associations between documents are automatically activated when a document
is loaded in the HU Editor. In cases where several associations exist, the first
available is automatically selected. You can also select a specific association via
the FILE / USE... menu in the Associations Editor.
ATLAS.ti 7.1 USER MANUAL
DATA PREPARATION
95
When you load a document that has an associated file, a red circle is shown in
the PD bar (see Figure 75).
Figure 75: Click the red dot to load the associated document
Click on the red dot; the associated document is loaded into the document
region next to it.
Play Selected Text
If you select a piece of transcript or a quotation in an associated text, the
selected linked audio or video can be played:
Highlight a a piece of text and select either the menu item DOCUMENTS /
Figure 76: Playing associated audio or video segments
ASSOCIATED DOCS / PLAY SELECTED TEXT or press the key combination CTRL+P.
The associated video or audio recording will be played back from the correct
position. Playback stops at the end of the selection. The accuracy of selected
text playback depends on the precision and the number of the available
anchors.
Synchronization Mode (F3)
In non-synchronous mode, the documents are independent from each another.
“Moving around” in either one of the documents does not affect the other.
When you switch to synchronization mode, associated documents display
ATLAS.ti 7.1 USER MANUAL
DATA PREPARATION
96
synchronously, i. e., they are positioned next to each other. Since synchronous
playback is not useful or desired in all situations, synchronization mode can be
switched on and off.
The non-synchronous mode is particularly important for setting anchor points:
In synchronous mode, associated multimedia documents follow the movements
of the mouse cursor. This makes positioning anchors difficult.
In non-synchronous mode, it is however still possible to click on an anchor in
the Association Editor and jump to the associated data segment.
ACTIVATING AND DEACTIVATION SYNCHRONOUS MODE
Synchronous mode can be enabled and disabled via the main menu entry
DOCUMENTS / ASSOCIATED DOCS / SYNCHRO MODE and via the F3 key.
In the Association Editor, synchronous mode can be selected via the menu item
ASSOCIATION or the SYNCHRO button in the tool bar.
WORKING WITH SYNCHRONOUS MODE
Moving the mouse cursors in the text or clicking a text passage causes
associated multimedia documents to be repositioned. Click F4 to start playback
at this position.
The opposite case - i. e., moving the cursor in the multimedia document —
causes no cursor change in the text document. This would hamper your text
work. However, synchronous display is still possible if you select „Karaoke
mode“ (see below).
Karaoke Mode (CTRL-F4) – not yet available in Version 7.0
“Karaoke” mode lets you follow multimedia content and text documents at the
same time. The multimedia document sets the pace while the current passage is
highlighted in the text document. Because of the moving text selection, normal
text-work tasks such as creating quotations are not possible in this mode.
There are several ways of highlighting text in Karaoke mode. To choose one of
it, select them from the TEXT menu of the Associations Editor:
HIGHLIGHT SECTION: Highlights the section between two anchors.
HIGHLIGHT LINE: Highlights the entire line of text that corresponds to the position
of the “lead” document.
HIGHLIGHT WORD: Highlights the word that corresponds to the position of the
“lead” document.
HIGHLIGHT CHARACTER: Highlights the character that corresponds to the position of
the “lead” document.
Load the associated text document, e. g. the transcript.
To start the Karaoke mode, press CTRL+F4 or select DOCUMENTS / ASSOCIATED
DOCS / KARAOKE. This activates both the SYNCHRO mode and the KARAOKE mode.
Press F4 to start the multimedia document. Both will now be shown side by
side. In the text document, the passage is highlighted that is currently played
back.
ATLAS.ti 7.1 USER MANUAL
DATA PREPARATION
97
Importing And Exporting Associations
Associations are saved together with the HU and remain affiliated. For
exchange between ATLAS.ti projects, they can also be exported and imported
as files:
In the Associations Editor, select menu items FILE / EXPORT… and save the file.
The active association is saved as a file. This file is in XML format and has the
extension “.syn“.
The import function (FILE / IMPORT...) lets you open files that were created in the
above fashion and activates them as new associations in a different HU.
Importing Survey Data
These days a lot of surveys are conducted online. A positive side effect is that
(a) all data is immediately available in digital format and (b) respondents are
often willing to provide lengthy answers to open-ended questions. On paperand-pencil surveys this was rarely the case. Statistical programs like SPSS™ do
offer options to analyze open ended questions, but basically you end up
encoding each answer with a number. A proper qualitative analysis of the
answers is not possible. This is now possible in ATLAS.ti.
A typical work flow for working with survey data looks like this:
Figure 77: Work flow when importing survey data
Online surveys can be created using a number to tools. What most of these
tools have in common is that you can export your data as Excel™ file. And this
is what you need to prepare for import in ATLAS.ti (see below). Based on
specific prefixes that you add to your variable names, ATLAS.ti interprets the
column headers and cells of the Excel™ table in various ways and turns them
into primary documents, the contents of the primary documents, primary
document families, quotations, codes, comments and code families.
Data are imported case-based. This means each row of the Excel™ table that is
imported from the online survey tool is transformed into a primary document.
ATLAS.ti 7.1 USER MANUAL
DATA PREPARATION
98
How Survey Data Is Treated In ATLAS.ti
To represent the results of an online survey within the framework of ATLAS.ti
in the most accurate and complete manner, a few basic requirements need to
be considered.
A survey broadly consists of the name of the survey, the questions, the answers
for each respondent. Questions can be of different types like single choice
questions (yes/no, or offering more than two options), multiple choice
questions, or open ended questions.
Within the framework of ATLAS.ti these concepts are mapped as follows:
Survey Concept
ATLAS.ti Concept
Open-ended question
Primary document
Single Choice 0/1
PD Family
Single Choice > 2
options
PD Family from Question plus Value
Multiple Choice
PD Family from Question plus Value
This does not mean that you cannot turn a multiple choice question into a
code, it all depends on how you define the columns in the Excel table. If you
turn single or multiple choice questions into codes, you later need to do some
automatic coding based on the response choices available in the questionnaire.
Always remember that ATLAS.ti is not a software for analyzing statistical data,
although it is possible to add information from traditional quantitative
questions. It might also be a good idea to be already acquainted with the
ATLAS.ti analysis tools like the query tool and its scope function (“Query
Tool“, page 258), the co-occurence table explorer (“Co-occurrence Tools, page
290), and the codes-primary-documents-table (“Codes-Primary Documents
Cross-Tabulation“, page 302) before preparing the Excel™ table for import.
A general recommendation is to include the following variables from the online
survey:
• Variables describing the respondents, i. e. the classical demographic variables
like age group, gender, profession, educational level, income groups, etc..
Turn those variables into PD families.
• Responses to open-ended questions. Turn those into coded segments.
• Selected other variables like answers to single or multiple choice questions
that are important in relation to analyzing the open-ended questions.
Preparing An Excel™ Table For Import
The following table shows the list of all available prefixes that you can to add
to the column headers in Excel™ in order for ATLAS.ti to interpret the cells in
various ways.
Prefixes and their interpretation
ATLAS.ti 7.1 USER MANUAL
DATA PREPARATION
99
Prefix
Result
!
defines the column to list the names of the primary documents
^
defines the column to list the primary document's author
&
defines the primary document's date, expects ISO8601 format,
see: http://www.cl.cam.ac.uk/~mgk25/iso-time.html
Example: 4th of February 1995 or 1995-02-04 in ISO8601 format
= YYYYMMDD = 19950204
<
Ignore this column, use to exclude stuff inserted by the survey
tool
.
Creates a PD family from the field name. Currently the cell needs
to contain the number 1, or the words Yes or Ja to be applied.
Use for single choice questions where respondents can answer
yes or no (or encoded as 1 and 0). Only the responses encoded
with yes/ja or 1 become part of the PD family.
:
Creates a PD Family from the field name plus cell value. Use for
single choice question like gender.
#
Creates a PD Family from the field name plus the actual cell
value. Use for single choice questions with more than two answer
options or for multiple choice questions.
Add no prefix to all open ended questions. The text in the column
header is used as code. To avoid very long code name, use a
short form to indicate the question and add the full question as
comment (see next row)
::
All text entered after two colons is added to the object's
comment field. This can be applied to cells resulting in PD families
or codes.
Figure 78: Sample table ready for import
By importing the sample table, we get:
• The name, date and author of the resulting PD
• Two dichotomous families Academic and Army. The following comment is
added to the PD Family “Army”: Did you serve?
• Two families Sex::male and Sex::female
ATLAS.ti 7.1 USER MANUAL
DATA PREPARATION
100
• Four families Favorites::Beatles, Favorites::Stones, etc. For the PD families
the following comment is added: What bands do you listen to regularly.
• Two codes Tell us a dream and Open End. The following comment is added
to the comment field of the code “Open End”: Now how do I make a
question be interpreted as open-ended?
How To Import Survey Data
Prepare an Excel table as explained above.
You can add the prefixes already when you prepare the online survey, or
afterward by editing the the resulting Excel table. The drawback of adding the
prefixes to the survey is that such early applied mark-up also displays in the
online survey interface and your respondents might wonder about the funny
characters at the beginning of questions.
Editing the downloaded Excel table prior to importing it into ATLAS.ti has the
advantage of not displaying unusual formatting characters to the user. A
disadvantage is that you need to do this every time you download the table,
for instance, because you are checking incrementally and not all respondents
have filled out the questionnaire yet.
Mark all cells in the table and format them as Text (right click on the
highlighted table and select the option “Format Cells”.
Save the table (as xls or xlsx file).
Close Excel (or at least the document that you want to import).
Open ATLAS.ti and select DOCUMENTS / NEW / IMPORT SURVEY DATA.
The import procedure starts and ATLAS.ti informs you when all data are
imported.
During the import, one primary document is created from every row. Unlike
“normal” PDs who get their contents from files, these primary documents need
to have their content (data source) created as well. These data sources are
embedded within the HU (see “Adding embedded documents (Text files only)”
on page 76).
The creation of the textual contents is done as follows: Each row is scanned
from left to right, column by column. Each cell's content belonging to an openended question field is appended to the currently built document (case). In
addition, each piece of appended text is also referenced as a quotation
automatically coded with the current question.
ATLAS.ti 7.1 USER MANUAL
DATA PREPARATION
101
Figure 79: Pre-coded data by question
Those columns defined as variables are turned into PD Families. See the section
on “Family Life“ on page 225 for further information. If you select a case, all
applicable families are highlighted (see Figure 80).
Figure 80: P-Docs Manager with imported survey data and the
corresponding families
Special families are created for all imported PDs and codes to make filtering for
the survey material easy.
Save the Hermeneutic Unit. As default name the name of the Excel file is
used. If you import the same table repeatedly, rows with already existing PDs
are ignored. This way, you do not have to wait until the last respondent has
filled out the questionnaire.
Analyzing Survey Data
In order to analyze survey data, you should get acquainted with the following
features and functions of ATLAS.ti:
ATLAS.ti 7.1 USER MANUAL
DATA PREPARATION
102
Primary Document Families, especially their use as data attributes (see Family
Life on page 225 and Working with Variables: Primary Document Families on
page 234.
Basic coding techniques to add some additional codes to the precoded
responses (see Coding Techniques on page 187).
Code Families (see page 240)
The Codes-Primary-Documents-Table (see page 302)
The query tool and the scope function (see page 258, page 278)
Creating and working with super families (see page 280)
The Co-occurence-Table-Explorer (see page 291).
ATLAS.ti 7.1 USER MANUAL
DATA MANAGEMENT IN ATLAS.TI
103
Data Management In ATLAS.ti
As explained in the section “What happens behind the scene if you add
documents to a project“ on page 71), you can delegate your data management
to ATLAS.ti. ATLAS.ti 7 is smart enough to manage your documents for you!
In ATLAS.ti 7, you add rather than assign documents to a project. ATLAS.ti
makes a copy of the documents and puts them into one of two libraries: My
Library for single user projects and the Team Library for team projects.
The libraries are a workspace for ATLAS.ti and you do not have to concern
yourself with it. You can, however, change the location of the library if you
want to. This for example is relevant for team projects where documents are
stored at a shared location (see “Team Projects Using a Shared Location“ on
page 115).
What Happens To Version 5 Or 6 HU(s)?
If you load a version 5 or 6 project, you will be asked whether you want
ATLAS.ti to manage your documents (see “Migrating ATLAS.ti 5 and 6 Projects
“).
You can also decide that the HU should currently not be managed by ATLAS.ti.
This is for example necessary in the process of migrating an team projects to
ATLAS.ti 7 if team members work at different locations (see “Migrating version
5 and 6 Team Projects to ATLAS.ti 7“ on page 121.
What File(s) Do I Need To Pay Attention To?
Basically, the only files you need to concern yourself with are your HU file and
a proper backup thereof:
A version 7 project (HU) file has the file extension hpr7. This file can be stored
anywhere and you can move it to any location as long as access to the library is
available. Since documents are added to the library and not embedded in the
HU, the HU file still remains rather small.
A second file you will want to attend to is the copy bundle file as a backup of
your entire project (see page Error: Reference source not found).
ATLAS.ti 7.1 USER MANUAL
DATA MANAGEMENT IN ATLAS.TI
104
How Do I Move A Project When I Work With Managed
Files?
To move an ATLAS.ti 7 project to a new location, create a copy bundle file as
usual and install it at the new location (PROJECT / COPY BUNDLE). On the target
computer, all documents that are not already in the library are added to it.
To make it more obvious what a copy bundle file is, we have created a new
icon. We love it and we hope that you will like it too. Furthermore, the copy
bundle file has a new extension: atlcb.
If during the course of the project new files were added to the HU or
documents were modified, you can create a partial bundle that only includes
those documents. This reduces the size of the bundle considerably (see “How
to Create A Copy Bundle Fileon page 131).
Once all documents are available in the library at the various locations, you
only need to move back and forth the HU file.
Can I Still Use Linked Documents?
Yes, if you prefer, you can still manage your documents yourself, i.e. working
with linked documents as before.
However, our recommendation would be that you transfer your projects to the
new managed format since it offers numerous advantages: There is much less
to consider in terms of project and data management; files are compressed, so
you save hard disc space; all document revisions are tracked; you can edit all
text documents (also original doc and docx files); and your entire project is
more robust.
The Document Libraries
The Library Manager offers access to either My Library for single user project,
or the Team Library. The library manager provides information about the name,
type and size of each imported document, the time when it was imported, the
modification date of the source file and the location where it was
added/assigned from.
The Library Manager should primarily be accessed by project administrators
only. Other users should only open it when instructed to do so by the
project administrator. This is for example the case if the location of the team
library needs to be set to a different location.
To access the ATLAS.ti libraries, select DOCUMENTS / DATA SOURCE MANAGEMENT /
OPEN LIBRARY MANAGER .
ATLAS.ti 7.1 USER MANUAL
DATA MANAGEMENT IN ATLAS.TI
105
Figure 81: Library Manager
Switch between the two libraries by clicking on either the My Library or the
Team Library tab.
With a click on each column, you can sort the documents by the various
headers.
Use the search field on the top right hand side to look for particular
documents.
The pane at the bottom left provides information about data source revisions, i.
e., whether a document has already been edited or not.
In the pane next to it, all HUs that use the documents are listed. A double-click
opens the HU(s) from here.
How To Use The Two Libraries
The differences between the two libraries is the default location on your
computer:
• My Library is found in the sub folder structure of the user that is currently
logged in under Windows.
• The Team Library is stored in a sub folder under Public Documents on your
computer (see EXTRAS menu in the Library Manager).
The recommendation is to use My Library for single user projects and the
Team Library for team projects.
ATLAS.ti 7.1 USER MANUAL
DATA MANAGEMENT IN ATLAS.TI
106
Libraries Menu
Via the LIBRARIES menu, you can also switch between My Library and the Team
Library.
Figure 82: Library Manager: Libraries
menu
A further option is to VALIDATE LIBRARIES. During the process of validating,
ATLAS.ti checks the library for inconsistencies. Possible inconsistencies are
documents that are still managed by the library, but do no longer exist; or
documents that are no longer used any of the HUs, etc. If inconsistencies are
found, you will be informed by the following dialogue:
Figure 83: Result of a library validation
Click on REPAIR CATALOG and close the window.
Figure 84: Validating: No problems found
If no problems are found, you will see the following message:
Select LIBRARIES / EXIT to close the Library Manager.
ATLAS.ti 7.1 USER MANUAL
DATA MANAGEMENT IN ATLAS.TI
107
Data Sources Menu
Figure 85: Library Manager:
Data Sources menu
Currently, the DATA SOURCES menu only offers you the option to delete
documents from the library. In a later ATLAS.ti 7 release, two more options - to
copy or move selected documents between libraries – will be added.
Use the DELETE option with care. If you delete documents from the library
that are used by one or more HUs, the documents will no longer be
available in the HU(s) and you lose all coding, commenting, etc. that you
have done.
Extras Menu
Use the EXTRAS menu to
• move the libraries to a different location (MANAGE LIBRARY LOCATION)
• and to set the library location to a different folder if it has been moved (SET
LIBRARY LOCATION)
These options are particular relevant for team projects, if they want to access
documents via a shared location (see “Team Projects Using a Shared Location“
on page 115).
Figure 86: Library Manager: Extras menu
The option OPEN LIBRARY FOLDER opens the Explorer and takes you to the folder
on your computer where the files are actually stored.
ATLAS.ti 7.1 USER MANUAL
DATA MANAGEMENT IN ATLAS.TI
108
We strongly advises users against moving the library to Dropbox or other
cloud-synced services and folders. It is the *very nature* of Dropbox and
other cloud-based services that they will change data in your repository if
this data has been changed elsewhere--with or without the user's knowing
or consent. This corrupts the integrity of your ATLAS.ti project and may
result in data loss!
The idea of “managed documents” is that the repository is a location that is
solely managed by ATLAS.ti and not by any other application. ATLAS.ti
GmbH therefore accepts no responsibility and no liability for any data loss
caused by moving your libraries to Dropbox or cloud-based service.
Copying Documents Between Libraries
If you accidentally or for whatever reason put a document into the wrong
library, you can move it:
Open the Primary Document Manager and highlight the document(s) that
you want to move.
Right-click and select DATA SOURCE MANAGEMENT / COPY SELECTED DOCUMENTS TO...
Depending on where the documents are currently stored, the menu offers
the choice to either move them to My Library or the Team Library.
Figure 87: Moving documents between libraries
Exporting Documents From The Library
As all documents are copied to the library (unless you work with linked
documents), all modifications you make to the document are only reflected in
the library document and no longer in your original Word document (as was
the case in version 6). Therefore, ATLAS.ti 7 offers an export option:
Select the documents you want to export in the Pdocs Manager. Right-click
and selections DATA SOURCE MANAGEMENT / EXPORT SELECTED DOCUMENTS. Select a
destination where you want to store them and click OK.
ATLAS.ti 7.1 USER MANUAL
SETTING UP A NEW PROJECT
109
Setting Up A New Project
If you click on the main menu DOCUMENTS / NEW / …. you find a number of to a
project options to add documents to an ATLAS.ti project:
Figure 88: The various options to add documents to an ATLAS.ti 7 project
• Adding documents to either My Library or the Team Library (see “How To
Use The Two Libraries“ on page 105).
• Adding documents from the library. Use this option if you want to use
documents that are already in one of the two libraries.
• Importing documents that you have transcribed using f4 (Windows), f5
(Mac) or Transana. The transcripts are turned into an embedded documents
and the associated media file are added to a library of your choice (see
“Importing Associated Documents Transcribed elsewhere“ on page 92).
• Importing survey data based on an Excel spread sheet. Case-based data are
imported as embedded documents (see “Importing Survey Data “ on page
97).
• Creating a new embedded text document (see “Adding embedded
documents (Text files only)“ on page 76).
• Creating a new Google Earth PD (see page 76).
• Creating a snapshot from the currently loaded GoogleEarth location as
image PD (see page 77).
ATLAS.ti 7.1 USER MANUAL
SETTING UP A NEW PROJECT
110
• Assigning external (linked) documents like you are used to from older
versions of ATLAS.ti. Please see the V6 manual for a description of various
project setup options.
• The option “THIS IS A TEAM HU” is activated, if documents were added to the
team library.
Setting Up Single User Projects
Open ATLAS.ti and select DOCUMENTS / NEW / ADD DOCUMENTS (MY LIBRARY), or
drag and drop a folder / selected documents from the File Explorer onto the
HU Editor (see “Adding Documents using Drag & Drop“ on page 73).
During the data import process a file quality check is carried out (see page 74).
After you have added documents to your project, save the project file to any
location: PROJECT / SAVE.
Figure 89: Creating a single-user project.
Setting Up Team Projects
When working in teams, multiple scenarios are possible:
• A team analyzes a common set of documents across different sites.
• Initially, the documents at each site are different. Every person analyzes a
sub set of the data before merging the HUs.
• A team analyzes a common set of documents, which are stored on a server
that everyone can access.
Commonalities Of Team Projects
Most team scenarios require that one person of the team takes on the role of
project administrator. The designated project administrator usually sets up the
ATLAS.ti 7.1 USER MANUAL
SETTING UP A NEW PROJECT
111
project, distributes it to the other team members, collects the sub projects again
and merges them.
Unless there are good reasons to work with linked documents, all documents
should be either embedded or added to the team library.
If documents are imported into the team library, the HU is marked as team HU
(see Figure 100).
Figure 90: HUs that reference documents in the team library are marked as Team HU
Once the team library has been selected as location for the data sources, all
further documents that are added to the project will automatically be imported
into the team library (unless you explicitly select My Library as location).
All team members best create an ATLAS.ti user account on their computer and
log in with their user name. You find the User Management menu under the
Tools menu (see also “User Management“ on page 147).
Distributed Team Work
Team Projects Using A Common Set Of Documents Stored At
Different Locations
If initially a common body of data should be made available to the team, it is
best if one person sets up the project.
Figure 91: Team project setup if all team members access a common data set
Tasks Of The Project Administrator
Create a new Hermeneutic Unit and add documents to the team library:
ATLAS.ti 7.1 USER MANUAL
SETTING UP A NEW PROJECT
112
DOCUMENTS / NEW / ADD DOCUMENTS (TEAM LIBRARY), or drag and drop a folder /
selected documents from the File Explorer onto the HU Editor (see “Adding
Documents using Drag & Drop“ on page 73).
Save the project file to any location: PROJECT / SAVE.
Create a copy bundle file (PROJECT / COPY BUNDLE / CREATE BUNDLE) and
distributes it to all team members (see “How to Create A Copy Bundle File“
on page 131).
Ask all team members to create an ATLAS.ti user account on their computer
and to log in.
If your project contains linked documents, the recommendation is to store
these documents in the same folder as the HU file (i.e. HUPATH). This
facilitates project transfer in case you do not want to include the large-sized
documents in the bundle file. You can simply copy the folder that contains
the HU and the large-sized documents and provide a copy of this folder to
each team member. All other documents can be transferred as usual via a
copy bundle file.
Tasks Of The Team Members
Create an ATLAS.ti user account on your computer and log in with your user
name. You find the USER MANAGEMENT menu under the TOOLS menu (see also
“User Management“ on page 147).
Install the copy bundle file that you received from the project administrator
(see “Install a Bundle“ on page 132).
Save the HU under a different name, e.g. by adding your name or initials to
the file name: PROJECT / SAVE AS...
Continuous Project Work (Documents Are Not Edited)
Tasks Of The Team Members
After an agreed-upon interval, each team member sends their work to the
project administrator for merging. As none of the documents was modified, it
is sufficient to send the HU files.
Tasks of the project administrator
Merge the various HU files you receive from the team members (see
“Merging Hermeneutic Units“ on page 154.
Create a new Master HU and distribute the new Master file to the team
members.
ATLAS.ti 7.1 USER MANUAL
SETTING UP A NEW PROJECT
113
Figure 92: Continuous process of merging and distributing
Tasks Of The Team Members
Rename the new Master file by adding your name or initials to the file name
and continue your work.
Continuous Project Work (Documents Are Edited)
Please note, even under the managed document concept, editing the same
data source at two different locations should not be allowed. If you do so
anyway, this primary document can no longer be merged. You end up with
two versions of it.
Tasks Of The Team Members
Create a copy bundle file and send it to the person who volunteered to be
the project administrator (PROJECT / COPY BUNDLE / CREATE BUNDLE).
Tasks Of The Project Administrator
Installs all copy bundle files (PROJECT / COPY BUNDLE / INSTALL BUNDLE).
Merges all HUs and saves the outcome as new Master HU (see “Merging
Hermeneutic Units“ on page 154.
Creates a copy bundle file and distributes it to all team members. This is
similar to the process shown in Error: Reference source not found.
ATLAS.ti 7.1 USER MANUAL
SETTING UP A NEW PROJECT
114
Initially Different Documents Are Analyzed At Each Site
Tasks Of The Team Members
Create an ATLAS.ti user account on your computer and log in under your
user name. You find the USER MANAGEMENT menu under the TOOLS menu (see
also “User Management“ on page 147).
Set up your sub project by creating a new Hermeneutic Unit and add
documents to the team library:
DOCUMENTS / NEW / ADD DOCUMENTS (TEAM LIBRARY), or drag and drop a folder /
selected documents from the File Explorer onto the HU Editor (see “Adding
Documents using Drag & Drop“ on page 73).
If your project contains linked documents, the recommendation is to store
these documents in the same folder as the HU file (i.e. HUPATH). This
facilitates project transfer in case you do not want to include the large-sized
documents in the bundle file. You can simply copy the folder that contains
the HU and the large-sized documents and provide a copy of this folder to
each team member. All other documents can be transferred as usual via a
copy bundle file.
Save the project file to any location: PROJECT / SAVE.
Begin to work on your sub project.
Continuous Project Work
After an agreed-upon interval, each team member sends their work to the
project administrator for merging:
Create a copy bundle file (PROJECT / COPY BUNDLE / CREATE BUNDLE) and send it to
the project administrator (see “How to Create A Copy Bundle File“ on page
131).
As mentioned before, the project administrator can be someone from the team
who volunteers to take on the task of merging and re-distributing.
Team Project Setup If Different Data Sources Are
Analyzed At Every Site
ATLAS.ti 7.1 USER MANUAL
SETTING UP A NEW PROJECT
115
Figure 93: Team project setup if different data sources are analyzed at every site
Tasks Of The Project Administrator
Installs all copy bundle files (PROJECT / COPY BUNDLE / INSTALL BUNDLE).
Merges all HUs and saves the outcome as new Master HU (see “Merging
Hermeneutic Units“ on page 154.
Creates a copy bundle file and distributes it to all team members (see
Tasks Of The Team Members
Install the copy bundle file that you receive from the project administrator
(PROJECT / COPY BUNDLE / INSTALL BUNDLE).
Rename the HU file by adding your name or initials (PROJECT / SAVE AS...)
Continue to work on the project.
Repeat the above cycle as often as necessary to complete the analysis.
Team Projects Using A Shared Location
If all team members access the data at a shared location like a network drive,
the team library needs to be set to the this location and the documents need to
be added to the team library at the new location. This needs to be done by the
designated project administrator:
Tasks Of The Project Administrator
Select DOCUMENTS / DATA SOURCE MANAGEMENT / OPEN LIBRARY MANAGER.
In the Library Manager, select EXTRAS / MANAGE LIBRARY LOCATION.
ATLAS.ti 7.1 USER MANUAL
SETTING UP A NEW PROJECT
116
Figure 94: The Manage Library window
Select the shared location for the team library and click OK.
You will be asked to restart ATLAS.ti.
If you click on the RESET button, ATLAS.ti sets the location of My Library or
the Team Library back to the default location.
To add documents, select DOCUMENTS / NEW / ADD DOCUMENTS (TEAM LIBRARY), or
drag them from the File Explorer into the HU editor (see “Adding Documents
using Drag & Drop“ on page 73).
The HU file can be saved to any location (PROJECT / SAVE).
Send the new Master HU to all team members and instruct them a) to create
a user account on their computer and b) to reset the location of the team
library (see below).
If your project contains linked documents, the recommendation is to store
these documents on the server in the same folder as the HU file (i.e.
HUPATH, see ATLAS.ti 6 manual).
Tasks Of The Team Members
Create an ATLAS.ti user account on your computer and log in under your
user name. You find the USER MANAGEMENT menu under the TOOLS menu (see
also “User Management“ on page 147).
Next, set the location of the team library to the shared location as instructed by
the project administrator:
ATLAS.ti 7.1 USER MANUAL
SETTING UP A NEW PROJECT
117
Select DOCUMENTS / DATA SOURCE MANAGEMENT / OPEN LIBRARY MANAGER.
In the Library Manager, select EXTRAS / SET LIBRARY LOCATION.
Figure 95: Set Library Location window
Set the location of “Team Library” to the shared location and click on the OK
button.
Save the Master HU file under a different name, e.g. by adding your name or
initial to it. The HU file can be saved to any location.
Figure 96: Team project setup on a server
Make a copy of the Master HU and rename it, e.g. by adding your name or
initial to the file name. The HU file can be stored at any location, either
locally or on the server as well, unless the project contains linked documents
that are stored on the server. In the latter case, the HU files should remain on
the server in the same folder as the documents.
ATLAS.ti 7.1 USER MANUAL
SETTING UP A NEW PROJECT
118
Editing primary documents can be allowed as for server-based projects,
ATLAS.ti controls the process. Documents can only be edited by one person
at a time. If a modified document is loaded by other team member later,
the codings in their HUs are adjusted automatically (see “Editing Primary
Documents in Team Projects“ on page 144.
Continuous Project Work
After an agreed upon interval, the project administrator merges the HUs of the
team members. If team members store their HU files locally, they should move
them to the server (see Figure 97 below).
Tasks Of The Project Administrator
Merge the various HU files
Create a new Master HU and save it at at the shared location under a new
name, e.g., by adding the date. The old Master HU can be moved to a
backup folder.
Tasks Of The Team Members
Make a copy of the new Master file, rename it by adding your name or initial
and continue your work.
Figure 97: Merging and distributing server based team projects
ATLAS.ti 7.1 USER MANUAL
MIGRATING ATLAS.TI 5 AND 6 PROJECTS
119
Migrating ATLAS.ti 5 And 6 Projects
Compatibility between ATLAS.ti Version 5 , 6 and 7 projects: If you save
your project in ATLAS.ti 7 the file is saved as .hpr7 file. Thus, version 5 or
version 6 project files will not be overwritten. However, a hpr7 file cannot
be read by older version of ATLAS.ti. It is not possible to save a file as .hpr6
or .hpr5 file in Version 7. In other words, ATLAS.ti is upward but not
downward compatible.
Migrating ATLAS.ti 5 And 6 Single-User Projects To ATLAS.ti 7
Open an ATLAS.ti 5 or 6 project in version 7. You will see the following
message:
ATLAS.ti 7.1 USER MANUAL
MIGRATING ATLAS.TI 5 AND 6 PROJECTS
120
Figure 98: Invitation to turn over data management to ATLAS.ti
Select the first option to import all documents.
The conversion process starts and may take up to a few minutes depending on
the number of primary documents in your project. During the import process, a
quality check takes place (see “File Quality Check“ on page 74). Fix problems
as necessary.
Once this process is finished, you will see the following message:
Figure 99: Dialog informing you about the number of
documents that have been added to the library.
Click on the OK button and save the HU.
It is not necessary to change the file name if you want to keep your old version.
ATLAS.ti simply adds a new file extension (hpr7). Your version 6 file remains
untouched.
Figure 100: Display of ATLAS.ti 7 file in File
Explorer
ATLAS.ti 7.1 USER MANUAL
MIGRATING ATLAS.TI 5 AND 6 PROJECTS
121
Migrating Version 5 And 6 Team Projects To ATLAS.ti 7
Team Members Work With Different Documents At
Different Locations
If all team members work with a different set of documents, they can open
their ATLAS.ti 6 HUs in Version 7 and allow ATLAS.ti to import all documents
into the team library (see Error: Reference source not found).
Common Set Of Documents Stored At A Shared
Locations
See Figure 99 for a depiction of the work-flow.
Tasks Of The Project Administrator
Open the ATLAS.ti 5/6 HUs of the various team members in ATLAS.ti 7,
import all documents into the team library (see Figure 101) and save the files
as ATLAS.ti 7 HUs.
Figure 101: Project migration for team projects if documents are stored at a shared location
Merge the ATLAS.ti 7 HUs and create a new Master project file (PROJECT /
MERGE WITH HU).
Now the team library needs to be moved by the project administrator (you) to
a location that can be accessed by all team members. The steps are:
ATLAS.ti 7.1 USER MANUAL
MIGRATING ATLAS.TI 5 AND 6 PROJECTS
122
Select DOCUMENTS / DATA SOURCE MANAGEMENT / OPEN LIBRARY MANAGER.
In the Library Manager, select EXTRAS / MANAGE LIBRARY LOCATION.
Figure 102: The Manage Library window
Select the appropriate location for the team library and click OK.
You will be asked to restart ATLAS.ti. During this process all documents are
moved to the new location.
If you click on the RESET button, ATLAS.ti sets the location of My Library or
the Team Library back to the default location.
Send the new Master HU to all team members and instruct them to reset the
location of the team library (see below).
Tasks Of The Team Members
The team members need to set the location of the team library to the shared
location as instructed by the project administrator:
Select DOCUMENTS / DATA SOURCE MANAGEMENT / OPEN LIBRARY MANAGER.
In the Library Manager, select EXTRAS / SET LIBRARY LOCATION.
ATLAS.ti 7.1 USER MANUAL
MIGRATING ATLAS.TI 5 AND 6 PROJECTS
123
Figure 103: Set Library Location window
Set the location of “Team Library” to the shared location and click on the OK
button.
Save the Master HU file under a different name, e.g. by adding your name or
initial to it. The HU file can be saved to any location.
ATLAS.ti 7.1 USER MANUAL
MIGRATING ATLAS.TI 5 AND 6 PROJECTS
124
Figure 104: Work flow for team project migration if a common data set is stored at a shared location
Common Set Of Documents Stored At Different
Locations
See Figure 113 for a depiction of the work-flow.
ATLAS.ti 7.1 USER MANUAL
MIGRATING ATLAS.TI 5 AND 6 PROJECTS
125
Tasks Of The Team Members
Option A: Team members create a copy bundle file in ATLAS.ti 6 before
upgrading to ATLAS.ti 7 and send it to the project administrator.
Option B: Team members open their ATLAS.ti 6 HU in Version 7 but do not
allow ATLAS.ti to import the documents (see Figure 105).They need to select
option 3: Do not manage this Hermeneutic Unit.
Figure 105: When migrating distributed team projects, initially do not allow ATLAS.ti to
manage your documents
Then they create a copy bundle file and send it to the project administrator.
Tasks Of The Project Administrator
The project administrator first installs the copy bundle files, merges all HUs and
then consolidates the documents into the team library:
Double-click the ATLAS.ti 7 copy bundle file; or if you received ATLAS.ti 6
bundle files, select PROJECT / COPY BUNDLE / INSTALL BUNDLE.
Click on the button Unbundle.
When you are asked whether ATLAS.ti should manage the documents for
you, select the second option Do not manage this Hermeneutic Unit now
(see Error: Reference source not found above).
Save the HU (PROJECT / SAVE).
Repeat this for all copy bundle files.
Merge all ATLAS.ti 7 HUs and create a new Master file (PROJECT / MERGE WITH
HU). See also page 154.
This new Master file can now be turned into a managed project:
ATLAS.ti 7.1 USER MANUAL
MIGRATING ATLAS.TI 5 AND 6 PROJECTS
126
Figure 106: Consolidate unmanaged documents when transferring team projects
To to this, select PROJECT / CONSOLIDATE DOCUMENTS....
Select the second option “Optimize for teams” and save the HU. This means
all documents will be imported into the team library and the HU will be set as
team HU (see Figure 45). Save the HU.
Next, create a copy bundle file (PROJECT / COPY BUNDLE / CREATE BUNDLE) and
distribute the bundle to all team members.
Tasks Of The Team Members
Team members install the copy bundle file (PROJECT / COPY BUNDLE / INSTALL
BUNDLE).
Then they save the HU under a different name, e.g. by adding their name or
initial to it. The HU file can be saved to any location.
ATLAS.ti 7.1 USER MANUAL
MIGRATING ATLAS.TI 5 AND 6 PROJECTS
127
Figure 107: Work flow for distributed team projects working on a common set of data
ATLAS.ti 7.1 USER MANUAL
PROJECT BACKUP AND TRANSFER
128
Project Backup And Transfer
Please also see the following document summarizing all what you need to
know about project backup:
http://downloads.atlasti.com/docs/howto_v7_project_backup.pdf
Backup Copies
The default setting is that ATLAS.ti creates a backup copy of an existing HU
before overwriting it on save. Backup files can be distinguished from their
original by a name prefix: For file “Sample.hpr7” a backup file “backup of
Sample.hpr7” would be created.
To change the default setting, select TOOLS / PREFERENCES / GENERAL PREFERENCES,
Tab: STORAGE from the main menu, or click on the Preference button in the main
tool bar.
Crash Recovery: Automatic Backup
Keep both the
regular backup
and the automatic
recovery backup
on!
As “backup of ..” files are only created from the previous HU when saving the
current HU, this functionality would not protect you from losing the work you
completed since the last save in the event of abnormal termination of the
program, e.g., caused by system crashes or power failures.
For such situations, an automatic periodic backup feature is provided that will
store recovery information every 20 minutes (or a period of time you can set
via TOOLS / PREFERENCES / GENERAL PREFERENCES, Tab: STORAGE. It is strongly
recommended to keep this feature on.
Should ATLAS.ti or Windows crash or in any other way be terminated
irregularly, the amount of work lost is only the work conducted since the last
recovery backup (or regular save). When quitting ATLAS.ti or after saving the
HU, the recovery backup file is removed automatically.
ATLAS.ti 7.1 USER MANUAL
PROJECT BACKUP AND TRANSFER
129
If you experience long delays at the scheduled auto-saving times when
working with large HUs, increase the time intervals rather than turning this
option off!
When you restart ATLAS.ti after a crash, it will ask you if you want to load a
recovery backup of your HU if this backup is indeed newer than the one you
last saved.
Any pending changes in open text or Network Editors are not saved by the
recovery backup feature. Saving such changes from time to time will
preserve these changes.
Copy Bundle – Migrating And Backing Up Projects
The Copy Bundle function lets you make a copy of your entire project, i.e. the
HU and all associated files, packed as a single file. As such, it serves a dual
purpose: Portability (to transfer a project to another location), and data security
(a powerful backup & restore device).
Copy Bundle is a powerful tool. By inspecting the HU, it finds and collects all
files that make up the project. It checks the accessibility of the data sources and
provides feedback in problematic situations. From all the project files it compiles
a single compressed file. On a target computer, “installing” a bundle distributes
the HU, the data source files, and all associated files to appropriate location(s).
Copy bundle files can be recognized by a special icon (an ATLAS.ti project in a
box) and the file extension atlcb (see Figure 108).
Figure 108: File extension and icon for ATLAS.ti 7
copy bundle files
The Copy Bundle Tool
Under PROJECT / COPY BUNDLE, you find two functions: One to create a bundle
and the other to unpack or “install” a bundle. The two procedures are
explained below. To support old habits, the copy bundle tool is still available
from the TOOLS menu :-)
There are two options to save a project as copy bundle file and to unpack a
copy bundle file. You find both options under the PROJECT menu.
ATLAS.ti 7.1 USER MANUAL
PROJECT BACKUP AND TRANSFER
130
A copy bundle file contains your HU plus all data sources that you have
added to your ATLAS.ti project. It is the best and safest way to save your
project. If you want to have a full backup of your project on an external
drive or another computer, use the Copy Bundle tool--saving the HU file
alone is not sufficient for secure storage. The HU file represents your entire
project only in rare cases (i. e. only if you work exclusively with internal
documents). In the vast majority of cases you will need a copy bundle file to
backup or to transfer your project in its entirety.
The bundle tool is separated into two list panes and one report pane (see
Figure 109 below).
Before creating a copy bundle file, you can specifically exclude documents that
should not be in the bundle, e.g., unchanged (or even non-editable) large
documents (e.g., video, audio files) that have already been carried to the target
system via other means or with a previous Copy Bundle.
Figure 109: Copy Bundle Window: Pack & Go
The first list shows all documents that will be included in the bundle.
The second list pane diplays all documents that cannot be bundled: This list
displays documents that are excluded by the system because of an irresolvable
conflict. If all PDs in the HU can be displayed in the HU Editor, there should be
no conflict when bundling the HU.
The following conflicts may occur:
• Source Missing Conflict. The document does not exist.
• Source Unusable Conflict (only applies to linked documents). The document
cannot be loaded. Possible cause: A linked document was manually copied
from another location without its associated LOG file using Windows copy
method.
• PD Source Conflict (only applies to linked documents). Mismatch between
PD and its source. This implies that a linked data source is not the one that is
ATLAS.ti 7.1 USER MANUAL
PROJECT BACKUP AND TRANSFER
131
expected by the PD. Possible causes: mapping changed, data source was
replaced by another file, LOG file was edited manually.
• Ambiguous Reference Conflict (only applies to linked documents) . A linked
data source is used by more than one PD but was assigned using different
paths.
Report: In the report pane, the situation before creating the copy bundle file is
summarized. This includes a list of all excluded documents and the reason for
their exclusion.
How To Create A Copy Bundle File
Save the HU.
Select PROJECT / SAVE COPY BUNDLE from the main menu. The Copy Bundle
window opens. All documents that can be bundled are listed in the top right
pane.
Figure 110: Copy Bundle – Save/Unpack
To exclude documents, deselect documents by clicking on the check boxes or
set a PD family as filter before opening the copy bundle window (see “Using
Families as Filters“ on page 231).
Check the pane on the bottom left for problematic documents. If some are
listed, try to resolve the conflict (see “Conflict Color Code “, page 134.
Check the report pane. If everything is as it should be, click the CREATE BUNDLE
button.
A standard file dialog window opens. Enter a name for the bundle file or
accept the suggested file name. The file extension atlcb (for ATLAS.ti copy
bundle) is automatically appended.
Click Save. By default, the file is saved in the same folder as the HU file.
ATLAS.ti 7.1 USER MANUAL
PROJECT BACKUP AND TRANSFER
132
Install A Bundle
To unpack the copy bundle file on a target computer, it needs to be ‘installed’.
The Install Bundle dialog box looks as follows:
Figure 111: Copy Bundle Install window
Unbundling Strategies
"Unbundling" is the term we have adopted for unpacking (or extracting) the
compressed archive containing the HU and its associated files at the new
location. The installation of a bundle on the same or a different computer can
be done using two slightly different strategies: Migrate and Restore.
MIGRATE
Choose the
“Migrate”
strategy when
moving projects
between two
work locations.
The "Migrate" strategy assumes that the bundle is to be installed on another
computer or another disk in order to resume work at this different location. The
target path for the HU can be freely chosen. When checking for conflicts, this
strategy accepts that older versions of data source files are replaced by newer
versions. If a document in the bundle is older than an existing one at the new
location, it will not be unbundled. This prevents a document from replacing a
newer version of it.
RESTORE
Use the
“Restore”
strategy when
installing a bundle
that was created
as backup copy.
The "Restore" strategy is used to restore a bundle created as a backup of a
project, i.e., an HU and all the data source files referenced by its PDs. This
ATLAS.ti 7.1 USER MANUAL
PROJECT BACKUP AND TRANSFER
133
strategy restores the HU in exactly the same folder as at the original location. It
does not reject an attempt to replace a current file with an older version –
which is indeed the very nature of “restore.”
PATHS
Below the strategy selection section, the original path of the HU is displayed. A
color marker next to the path indicates possible conflicts for this HU, if it were
to be installed in the target environment.
Figure 112: Selecting a location for the HU file
Click on the Browse button to select the location where the HU file should be
stored on the target computer.
If you transfer a project to a different computer, most likely you will need to
change the location. If you use the bundle file as backup and want to install the
backup on your computer, there is probably no need to change the location.
A check box lets you exclude the HU itself from the installation.
Below the HU path, the TBPATH of the target computer is displayed. The
TBPATH is the default location for storing ATLAS.ti project files and can be set
under TOOLS / PREFERENCES / GENERAL PREFERENCES, tab: Paths. This pane is not
visible in Restore mode.
The list of documents included in the bundle can be sorted with a click on the
column header: The following information is provided:
• Name of the document
• Target location of the document.
• A field indicating if this document is used when unpacking the bundle. It also
contains a small colored box indicating a possible conflict (see “Conflict
Color Code ” below).
• Size (the total of the file sizes of the document file and its optional auxiliary
files).
• Last modification date
• Document type
ATLAS.ti 7.1 USER MANUAL
PROJECT BACKUP AND TRANSFER
134
Figure 113: Status report in the copy bundle window
REPORT PANE
The report pane in the lower right of the Install Bundle window displays a
dynamic report of the documents about to be unbundled.
Conflict Color Code
Possible target conflicts are indicated by the colored square in the ‘Use’
column.
Color Code
Description
Dark Green indiates that file already
exists in the library. The Target Location
is indicated as <LocalManaged>.
Light Green is on for every document
that can be installed without
overwriting an existing version
Yellow: A compatible file was detected;
replacing this file does not harm the
integrity of the HU. Other HUs
accessing this document will be
synchronized when needed.
If you unpack a document with this
magenta marker, other HUs with
references to it may no longer be able
to access it. Such documents will not be
extracted in Migrate mode. You can,
however, include these documents in
Restore mode.
Red: If a path does not exist on the
target computer, it is created when
installing the bundle file if possible..
However, not every path can be
created. If you install a bundle on your
personal computer and a Z drive is
required, ATLAS.ti can not create this
drive on your computer. If you see a red
box, you either need to change the
ATLAS.ti 7.1 USER MANUAL
PROJECT BACKUP AND TRANSFER
135
location for the HU file in the HU Path
field (see above), or you need to map
the path (see below for further
information).
A document is marked light green, if
an otherwise irresolvable path could be
resolved via fallback redirection, i.e.
HUPATH or TBPATH. This only applies
if linked documents are included in the
bundle.
Path Mapping (Only Needed For Linked Documents)
You need to map a path, if the original path of a file on the source computer
cannot be created on the target computer. This is likely to be the case when a
project was set up with absolute path references on a network drive that
cannot be accessed by the target computer.
Such a conflict can be resolved by mapping the non-existing path:
Click on the MAP PATH button included in the Install Bundle window. This
opens the Path Map Editor.
Enter a path to be mapped:
Figure 114: Document Path Map Editor
Into the ‘From:’ entry field on the left side of the Path Map Editor, type in
either the full path, select a path from the drop-down list, or click on the file
browser symbol. Generally, useful options (non-accessible paths used in the
current HU) are already offered in the drop-down list.
ATLAS.ti 7.1 USER MANUAL
PROJECT BACKUP AND TRANSFER
136
Once a path is entered or selected, click on the Add Path button. The path
will be added to the list of currently mapped paths.
Now enter (or choose from the drop-down) a replacement path into the ‘To:’
field on the right side of the Path Map Editor in the same fashion:
Click on the Add Path button.
Repeat the above steps for every path to be mapped.
Press Apply & Close to store and activate the new mapping(s).
REDIRECTION: FALLBACK
The option 'Always Use Fallback Paths’ is activated by default in the mapping
tool. If activated, the following happens: all irresolvable files are unbundled in
the HU’s folder, i.e., the folder where the HU (HPR7 file) is stored.
See the ATLAS.ti Version 6 manual for more detail on linked documents and
special paths like the HU and TBPATH.
It is best to organize projects in ways that use absolute path references as
rarely as possible. This reduces the need to use PD Mapping.
How To Install A Bundle File
Select PROJECTS / COPY BUNDLE / INSTALL BUNDLE from the main menu.
From the file dialog select a bundle file and click OPEN (or double click on a
copy bundle file in the file explorer).
The Install Bundle window opens.
Select a strategy for installing the bundle: Migrate or Restore (see “The Copy
Bundle Tool” on page 129).
If in Migrate mode, select the target location for the HU via the “HU Path:”
entry field.
Exclude unwanted documents from the HU before installing the bundle.
Check for conflicts and try to resolve them (see “Conflict Color Code “ on
page 134).
Click on the Unbundle button. When all files have been copied to their
respective locations, a message pops up informing you that the unbundling
process is finished.
ATLAS.ti 7.1 USER MANUAL
EDITING PRIMARY DOCUMENTS
137
Editing Primary Documents
PDs are often
shared between
different projects
and/or
users/team
members. A
single file can be
in use by more
than one project.
Linked documents cannot be edited in ATLAS.ti 7. If you want to edit
documents, you need to add them to your projects as managed files.
One of the core ideas of ATLAS.ti is that PDs are shared and part of an archive.
As you already know, all quotations, codes, and memos are actually not parts
of PDs, but are "transparent layers" that are stored within the HU. Because of
this, editing is blocked by default when you view a PD in ATLAS.ti.
However, it may be necessary to edit the content of a PD. For instance,
transcribed texts are often loaded with typos and other writing errors.
Documents might not be complete and text may need to be added after they
were assigned.
Edit mode must be actively switched on for textual PDs. This section introduces
available editing options and the issues to be considered when editing PDs.
Click the
pencil to enter
edit mode.
Two versions of a coded text are shown in the figure below: one version before
and one version after an editing session. The added text is colored red.
When we refer to "editing a PD," we indeed mean editing the content,
thus the data source file on the computer hard disk is modified by this
procedure.
A powerful
change
maintenance
system records all
changes during
an edit session in
order to inform
other projects to
update their
quotations.
A new paragraph was added between paragraph 4 and 5 in the original
document. As a consequence, all quotations that referenced paragraph 5 and
beyond needed to be updated to take into account their new position. The
quotation starting at paragraph 5 (before the editing procedure) and its
associated code have shifted to paragraph 6.
A word of caution is in order. Even though a number of safeguards are built
into the software to prevent misaligned codes or other nuisances after an
editing session, it is still a good idea to know how ATLAS.ti handles edited
PDs. Therefore, the objective of this section is to inform you about the Dos
and Don’ts of editing PDs.
ATLAS.ti 7.1 USER MANUAL
EDITING PRIMARY DOCUMENTS
138
Figure 115: Primary document, before and after editing
Inside Editing Primary Documents
Quotations are not much more than a set of coordinates that remember the
start and end positions of a text sequence (or a video passage, an image area,
etc.). Quotations are managed and stored inside the HU. The actual document
on the disk "knows" nothing of the references ATLAS.ti compiles about it.
What is needed to be able to edit the content of a document and to update the
quotations so that they never lose their correct alignment?
• ATLAS.ti needs to record every change that has the capacity of misaligned
quotations.
• ATLAS.ti needs to create a "logbook of changes" accessible to EVERY HU
that uses this PD.
• It is also necessary to protect the document against editing by more than
one user at the same time.
ATLAS.ti 7.1 USER MANUAL
EDITING PRIMARY DOCUMENTS
139
The Edit Toolbar
The Edit toolbar provides a number of options known from other Windows
applications. Many of these options are also available from the Edit menu.
Figure 116: Edit toolbar
The highlight color can be set under TOOLS / PREFERENCES / GENERAL PREFERENCES, tab:
Text Editor.
How To Edit A Primary Document
Editing is only possible when logged into ATLAS.ti as an ATLAS.ti user with
administrative rights! See “Administrative and Standard Access Rights“ on
page 150.
Load a rich text or plain text PD. If you have added doc or docx files to your
project, they are converted to rich text during the import process and thus
are available in rich text format as well.
Click on the Edit button in the main toolbar, or select EDIT / DOCUMENT ACCESS /
ENTER EDIT MODE from the main menu.
If a non-editable document (e. g., a doc/docx or PDF document) is loaded, the
editing toolbar is not available.
Edit the document.
When you are done, save your changes and leave edit mode: Click the Edit
button and select SAVE AND LEAVE EDIT MODE.
ATLAS.ti 7.1 USER MANUAL
EDITING PRIMARY DOCUMENTS
Changes to the
document must
be explicitly saved
when leaving the
edit session.
140
Figure 117: Saving a modified primary document
If you leave the edit session without saving the edited PD, the changes will be
discarded. This includes all changes to the HU caused by the editing session, e.
g., quotations deleted, copied, or moved by deleting, copying, or moving text.
If you do not save, the text will revert to the state before the last edit session or
when the document was last saved.
If you choose SAVE ONLY, all modifications are saved, a log file is created or an
existing one modified and you can continue to edit the document.
If you select the option DISCARD CHANGES AND LEAVE EDIT MODE , then all changes
are discarded and no log file is created. If a log file already existed, no
additional information is added to it
If you choose DISCARD CHANGES ONLY, the recent modifications are dropped and
the document is reverted to its last saved state.
Since there is no Undo function for document editing activities, make it a
habit to select SAVE ONLY once in a while during the edit session. Then you
can revert to the last saved status in case you made a mistake by selecting
DISCARD CHANGES ONLY.
Enriching A Plain Text Document
Saving a former
plain text with
formatting does
not change the
file extension.
If you have edited a plain text document and added formatting attributes like
fonts, color, font size, bold, italic, embedded objects, etc., you are asked if you
want to keep the formatting information and save the document as a rich text
(rtf) document:
If you select No, any features contained in the document beyond plain text will
be lost. If you want to keep the rich formatting, you need to confirm the
message.
If you select Yes, the file will be saved in rich text format although the file
extension (e. g., TXT) is not changed to RTF.
Embedded Objects
What Is An Embedded Object?
Data from a variety of applications like Word, Excel, and PowerPoint can be
embedded within a PD’s data source. In fact, objects can be embedded in any
rich text available in an HU, including memos and comments.
ATLAS.ti 7.1 USER MANUAL
EDITING PRIMARY DOCUMENTS
141
How To Embed An Object
There are several ways to embed an object.
EMBED AN OBJECT VIA COPY AND PASTE SPECIAL
Copy a table (or a portion of it) in Excel.
In ATLAS.ti (enter edit mode within the PD area or in the memo or comment
area) choose EDIT / PASTE SPECIAL and select the Excel object.
Figure 118: Paste special dialogue (which will show the language of your Windows system)
The list of formats available in the PASTE SPECIAL dialog may also contain other
non-object formats.
EMBED AN NEW OR EXISTING OBJECT VIA INSERT OBJECT
Enter edit mode and select EDIT / INSERT / INSERT OBJECT from the main menu.
The Insert Object dialog opens and offers all object types installed on your
computer. However, not all of the objects listed in the dialog make sense
inside a PD.
Create a new object: To create a new object select the object type and click
OK. By default the option ‘Create new object’ is activated.
Load an object from a file: Activate the option ‘Create from file’ in the Insert
Object dialog. Click OK and browse for the file to be inserted. If the file’s
content is not an embeddable object, an icon representation is inserted and
displayed instead.
Inserting an object from a file is not the same as INSERT / INSERT FILE, which
appends the usually textual contents of a file at the cursor position.
ATLAS.ti 7.1 USER MANUAL
EDITING PRIMARY DOCUMENTS
142
If you choose to link the object, it will also be inserted, but with a significant
difference:
Linked objects: A linked object keeps a reference to the original file. When you
edit the original Excel table, the changes will be written to the Excel file and will
be updated in ALL documents where this object was embedded. Because of
this, in-place activation is not available and the original application is launched
when double-clicking the object.
An object inserted without checking the link option is fully embedded and has
no reference to the file from which it originated. Editing this object will only
modify this copy of the object.
Coding Embedded Objects
Every object is treated as a single character when it comes to selecting and
coding it in ATLAS.ti.
You cannot “enter” an object in order to select and code parts of it (e. g., a
single cell inside an Excel™ spreadsheet or a graphic inside a PowerPoint™
slide).
However, for some objects, selecting a more suitable format from the list
presented by Paste Special (see also “Embed an Object via Copy and Paste
Special” on page 141) may be the solution. For instance, an Excel table is also
offered as Rich Text. It won’t look as neat as the original Excel object but you
can select and code a single cell or several cells of the spreadsheet.
The same Excel table selection pasted into a document as as an Excel object
and as Rich Text.
ATLAS.ti 7.1 USER MANUAL
EDITING PRIMARY DOCUMENTS
143
Figure 119: Coding embedded objects as compared to inserted text
The margin shows several codes for the Rich Text version and only one code
for the object version below.
Editing Embedded Objects
To edit an embedded or linked object:
Enter Edit mode and double-click the object.
Idiosyncrasies
Objects can be
activated and
edited without
the PD being in
edit mode. Such
changes are not
permanent.
Activating an embedded object is possible even when the embedding PD is not
currently in edit mode. For example, you may want to play a video or
recalculate a range of cells without making such changes permanent. If you
want to make changes and preserve the changes applied to an object in the
ATLAS.ti HU, you need to enter edit mode before editing the object.
After deactivating an active object by clicking outside its border, you might find
that the object has reverted to its original size.
Resizing an object can only be done by grabbing its selection frame at any
resize handle except those located on the frame’s right border. To get enough
space to the left you might want to center or right-align the object before
resizing.
ATLAS.ti 7.1 USER MANUAL
EDITING PRIMARY DOCUMENTS
144
Editing Primary Documents In Team Projects
Editing in team situations needs to be tightly controlled in order to not loose
the integrity of the various HU file involved. If team members work at different
locations and store data locally, the best solution is to restrict editing to the
project administrator. For details on how to setup and manage team projects
see “About this ManualSetting up Team Projects“ on page 110.
If the team project is set up in way that all team members access the data on a
a server (see example below), ATLAS.ti controls the editing process.
Let’s assume you work in a team of five people. Each of you is located in a
separate office or at different geographical locations. All of you work on the
same project and analyze the same pool of data source files. As shown in the
figure below, all data source files are located on a network drive and are shared
by all team members.
While the data
sources
referenced by an
HU can be shared
by multiple users,
HUs cannot be
worked on
concurrently.
Therefore, each
team member
works on her
‘own’ HU. The
work can then be
combined using
the ATLAS.ti
Merge feature.
Figure 120: Editing in a team situation
It is Monday morning at 9 a.m. Peter, Tom, and Agnes are currently working
on the ATLAS.ti project. Agnes works with PD4. She reads through it, codes it,
and writes a few memos. Peter now also wants to look at the document. He
loads the document into his HU, checks a few things, and codes a few more
data segments. Then he continues to work on P5.
Agnes continues her work on P4. While reading through it, she recognizes that
some places are not anonymized and wants to correct it. In order to do so, she
enters edit mode. She can however only do so, if no one else is currently
viewing the document. If this were the case, the following message pops up:
ATLAS.ti 7.1 USER MANUAL
EDITING PRIMARY DOCUMENTS
145
Figure 121: Editing is only possible if no one else is viewing the document
As this is not the case, Agnes can enter edit mode. While Agnes is editing the
document, Tom wants to do some work on P4. He can however not load the
document. Instead he sees the following message:
Figure 122: Server message informing users that a primary document is currently edited
Agnes corrects the document and leaves edit mode and saves the changes
made in the source file of P4.
Tom tries to accesses P4 a bit later. He receives a message stating that changes
have been detected in P4 and that all PDs using this data source need to be
synchronized. In order to load the document, Tom needs to confirm this
message. If he clicks NO, he will not be able to load the document until he
confirms the synchronization. Modified PDs can only be loaded after all
necessary alignments have been processed during the synchronization.
ATLAS.ti 7.1 USER MANUAL
EDITING PRIMARY DOCUMENTS
146
Figure 123: Synchronizing edited primary documents
After synchronizing P4, Tom can continue to work on it, add new codes,
memos etc. He may also edit the document. All other team members will be
informed about any further modifications. For this reason, there is no danger
that the team will end up with five different versions of the document. Due to
ATLAS.ti’s content surveillance system, each team member works with the
most up-to-date version of the document.
The only thing that remains to be done is to merge the HUs from all five team
members from time to time, so that all coding and other work performed on
the data is joined together. See page 154 further detail on merging HUs.
Trouble-Shooting: Problems With Loading An Edited
Document
As explained above, ATLAS.ti needs to keep track of the changes you make to
a document in order to be able to adjust the quotations and coded segments
accordingly. It does not only keep track of the latest changes but also stores a
number of revisions files so that it is possible to revert to a previous version in
case a modified document can no longer be loaded.
With proper handling of your project, there should never been a issue (e.g. if
you always have a copy bundle file of your latest project version). However,
technology (and users) can be unpredictable. If a hard disk fails, for example,
files might be destroyed or no longer work properly. Users may get mixed up
with different versions, and mistakes may occur along the way during the
process of merging and transferring projects. Sometimes it is difficult to
reconstruct the history of what happened. Please do consult the help desk if
you are in a situation like that. They will help you to sort it out as best as
possible.
If you can no longer open an edited document and ATLAS.ti tells you that
the latest revision file is missing, right-click on the document in the PDocs
Manager and select the option DATA SOURCE MANAGEMENT / RESET TO LAST VALID
REVISION.
This still can mean that some of the coded segments have shifted and that you
need to adjust them manually. However, this is probably better than having to
start from scratch again.
ATLAS.ti 7.1 USER MANUAL
USER MANAGEMENT
147
User Management
Collaboration or multi-authoring means that more than one author may work
on an ATLAS.ti project at different times. ATLAS.ti supports this teamwork by
systematically keeping track of each author's productions.
Every object created, including the Hermeneutic Unit itself, is automatically
stamped with a date, time, and author. This identification of the author is what
makes the log in process upon system start necessary (which by default
proceeds automatically). Simultaneous collaboration is not supported, so only
one person can work on a specific Hermeneutic Unit at a time. By default, only
the author who created the Hermeneutic Unit (the owner or original author), is
authorized to load, read, and edit the Hermeneutic Unit.
Letting others participate in creating a Hermeneutic Unit requires a few
bureaucratic adjustments; one of which is the definition of users.
The simple concept of the ATLAS.ti user management allows all data that will
be shared by different users to be placed in publicly accessible directories. But
even with the Hermeneutic Units stored in a public directory, access can be
restricted to the author. In other words, Hermeneutic Units can either be
private or public. The default setting is public. If set to private, other users can
be defined as co-authors for this Hermeneutic Unit (see “Access Rights for the
HU“ on page 151).
ATLAS.ti's user
database is
independent of
the account
database in a
local area
network or your
Windows log-in
name.
Figure 124: User Management sub menu
To keep it simple, it is best to leave the default setting to public access and to
allow all users to create an account with administrative rights. These rights only
apply when working with ATLAS.ti. Users defined in ATLAS.ti are not
necessarily the same as Windows users. Furthermore, administrative rights
assigned to an ATLAS.ti user have nothing to do with Windows user rights.
Adding A New User
If you do not intend to use ATLAS.ti in a work group environment, the only
procedure you might want to know is how to modify the default account called
"Super."
ATLAS.ti 7.1 USER MANUAL
USER MANAGEMENT
148
ATLAS.ti knows two classes of users: administrators, and all others.
Administrators have more rights than "normal" users. The key rights of
administrators are the ability to define new users, to install service packs or use
the more advanced data source management features. Thus, in order to be
able to create new user accounts, you need to be logged as a user with
administrative rights. By default, you are logged in as “Super” user and this
user has administrative rights.
To create a new user account, select TOOLS / USER MANAGEMENT / USER EDITOR
from the main menu.
If this option is grayed out in the menu, you are logged in as standard user.
Choose TOOLS / USER MANAGEMENT / SWITCH USER... and log in as Super user to be
able to access the user administration window.
In addition to being an administrative user in the ATLAS.ti context, you also
must have administrative rights as a Windows user in order to write-access the
user database which is located in ATLAS.ti’s PROGRAM folder below the
Program Files folder. This folder is usually write protected for nonadministrative users on “secure” (well, in principle ..) operating systems like
Windows XP, Windows 2000, Windows Vista, Windows 7 etc..
For Windows Vista and Windows 7 users: When using Windows Vista or
Windows 7, you need to run ATLAS.ti in administrative mode. To do this,
right click on the program icon when you start ATLAS.ti. Then select the
option Run as administrator. If you do not see this option, then you do not
have administrative rights to your Windows system. Thus, you first need to
start Windows with administrative rights. – An alternative way to open
ATLAS.ti in administrative mode is by holding down the Ctrl+Shift key while
double-clicking on the program icon.
ATLAS.ti 7.1 USER MANUAL
USER MANAGEMENT
149
Figure 125: User Administration Editor
The user
administration
tool allows you to
create, modify
and remove users.
A user is characterized by five attributes, four of which you are prompted for in
sequence: Account name, password, last name, first name.
Account name: When working with ATLAS.ti, the account name has to be
entered at log-in time. Every object created, including the Hermeneutic Unit, is
stamped with the account name.
Password: A password should be at least 4 characters (letters, digits, symbols)
long, but should not exceed 10 letters (higher risk of typos). A password can be
changed later by the administrator. However, when logging in, you are not
required to enter a password if the default settings are kept (see Relaxed User
Management below).
Last and first name: Both names really have no important function other then
giving the user a correct welcome. However, both a last and a first name must
be provided when defining a user.
To add a new user:
Select EDIT / NEW USER.
Enter an Account name, a password, the last and the first name into the
sequence of “prompters”.
After completion of the sign up procedure, the new entry appears in the list of
users. The“Access rights” attribute is set to “Administrator” by default (see
“Administrative and Standard Access Rights“ below).
Change the access rights if needed.
ATLAS.ti 7.1 USER MANUAL
USER MANAGEMENT
150
Administrative And Standard Access Rights
Administrative rights allow you to add, delete and change users. In addition,
administrative access rights are necessary if you want to edit primary
documents.
Users with standard rights can only access HUs they have created themselves,
or those where there have been registered as co-author. They are not allowed
to edit primary documents.
Removing A User
To assure that there is at least one user with administrative privileges in the
database, any attempts to remove all administrators is rejected. You cannot, for
instance, remove the user who is logged in.
Select the user to be removed in the list, right click and select the option
DELETE USER or or select the corresponding menu item from the EDIT menu.
Changing User Attributes
You can change the account name, the password, the first and last names of a
user and the access rights.
Right click on a user entry and select the appropriate option from the context
menu, or highlight a user and select the corresponding menu item from the
EDIT menu.
None of the menu options except New user will be available if you select
yourself in the list of users. If you need to change or even delete your own
account, you need to switch to a different administrative account (e.g.
super), edit your normal account and switch back again (TOOLS / USER
MANAGEMENT / SWITCH USER...
Saving The User Database
After new definitions and modifications, the user database must be explicitly
saved or all changes will be discarded. If you close the user administrator
window without saving, you will be prompted to save.
Be default the user data base is stored in a file called HERMENCR.HDB in the
ATLAS.ti program folder. This name and folder should be used, unless you are
about to create a copy of the database.
To save the user data base, select File / Save from the main menu in the User
Administration window.
Switching Accounts
After creating a new account, the next step is log in under your name, i.e. to
switch to your new account:
Select TOOLS / USER MANAGEMENT / SWITCH USER....
ATLAS.ti 7.1 USER MANUAL
USER MANAGEMENT
151
Figure 126: Login Window
Select a user account from the drop-down list.
Password: Note that the password field is grayed out and that you are not
required to enter a password. If you do want to password protect your user
account, you need to change the relaxed user management setting (see page
153. To set a password for the HU, see page “Access Rights for the HU“
below).
Automatic Login: If you are the only person working at this particular
computer (or on a public computer using a personal Windows user account),
then the automatic login can remain activated. This means the current log in
name is also used for the next sessions. If more than one user works on the
same computer, then the automatic log in should be deactivated. If
deactivated, the login window pops up upon start-up and the user is
prompted to log in.
Access Rights For The HU
To change access rights for a HU, choose the option TOOLS / USER MANAGEMENT /
CHANGE ACCESS RIGHTS from the main menu. Four options are offered:
Public - read only: this choice lets all other users load and view the
Hermeneutic Unit, it may even be edited, e. g. for training purposes, but it
cannot be saved to disk.
Public - read & write (default): permits other users to have the same rights as
the author, but not the ability to change the access rights.
Private: By choosing this option you can revoke previously granted rights again.
“Set Password” lets you protect the Hermeneutic Unit against loading unless a
correct password is provided. Make sure you remember the password or you
will not be able to load your own Hermeneutic Unit again!
As with all other access-related options you need to save the Hermeneutic Unit
before any changes are in effect.
ATLAS.ti 7.1 USER MANUAL
USER MANAGEMENT
152
Co-Authors
To restrict access to a group of co-authors (i. e., more than one author), the
sub-menu TOOLS / USER MANAGEMENT / CO-AUTHORS offers three options for
authors: add, remove, and view the list of co-authors currently defined for this
Hermeneutic Unit. This feature only makes sense if public access to the HU has
not been granted.
To Register Co-authors
Co-authors have the same rights as the original author, except for the right to
define or remove co-authors, unless having administrative rights themselves.
Select TOOLS / USER MANAGEMENT / CO-AUTHORS / REGISTER CO-AUTHORS. You are
presented the list of all users known to the system (which have previously
been defined by the administrator or the original author).
Figure 127: Registering co-authors
Select one one more authors from the list and click OK. A message pops up
informing you who is registered as co-authors for the currently loaded. HU.
To Remove Co-authors
Select TOOLS / USER MANAGEMENT / CO-AUTHORS / REMOVE CO-AUTHORS. You are
presented the list of current co-authors. Choose the ones to be removed from
the Hermeneutic Unit.
To Display Co-authors
Select TOOLS / USER MANAGEMENT / CO-AUTHORS / DISPLAY CO-AUTHORS. You see a list
of the co-authors currently assigned to the Hermeneutic Unit.
To Filter By Co-authors
To display only those parts of a Hermeneutic Unit created by a subset of the
co-authors involved, choose the filter-option CO-AUTHORS in any of the Object
Managers.
ATLAS.ti 7.1 USER MANUAL
USER MANAGEMENT
153
The User Database
All ATLAS.ti users are cataloged in a special "database"-file HERMENCR.HDB,
located in the ATLAS.ti system directory. This file is loaded on program startup.
Never modify the user database file HERMENCR.HDB from outside
ATLAS.ti, as this will corrupt it and lock you out of the system!
After the initial installation of ATLAS.ti, there is already one "dummy" user
with administrator privileges set up: Account = SUPER, password = USER.
Because automatic login is the default mode, it is quite likely that you usually
work under this default account.
Creating And Working With Different User Databases
To create a new data base, save the standard data base HERMENCR.HDB
under a new name, e. g. hermencr_2.hdb: FILES / SAVE AS.
Make the desired changes and save the new data base.
When you start ATLAS.ti the next time, the default user data base
“hermencr.hdb” is loaded. To load the newly created user data base, select
FILE / LOAD DATABASE.
Relaxed User Management
The default setting is “relaxed user management”. This feature removes the
password requirement for user accounts. The default setting can be changed by
editing the central configuration file for ALL users, ATLAS.INI. This file can be
found in the common application data folder. You need Windows administrator
rights to be able to modify this file. To access the file for modification:
Changes to
ATLAS.INI affect
all computers in a
networked
environment.
Select TOOLS / EXPLORER / COMMON APPLICATION DATA.
Make a backup copy of ATLAS.INI file.
Open it with a plain text editor (such as Windows Notepad).
Look for the section: [lan] and set the variable "relaxedUserManagement" to
either "enabled" or "disabled."
If relaxed user management it disabled, users need to enter their account
password when logging in.
Settings in ATLAS.ini affect all clients in a networked environment. For any
changes in ATLAS.ini to take affect, ATLAS.ti has to be restarted.
ATLAS.ti 7.1 USER MANUAL
MERGING HERMENEUTIC UNITS
154
Merging Hermeneutic Units
The Merge Tool reunites HU's that were originally divided for analytical or
economical reasons. Its main purpose is the support of teams. It links together
the contributions of different members of a research team. A common scenario
is the analysis of different sets of documents by different team members,
sharing a common code base. Of course, the single researcher can also benefit
from this function using the merge facility to help organize large projects.
Examples Of Application
Text Corpus Reuse
With only PDs to add and everything else IGNORED you can transfer all
documents from any HU into a freshly created, or already existing HU. The PD
comments and any existing quotations are also transferred.
Theory Import
With only codes, networks, and code families selected, a "theory" can also be
migrated to another HU. This is similar to the current "Import Networks"
feature, but also migrates Network Views and code families.
Team Work
Add codes, unify PDs: This would be the strategy when the same set of PDs
is utilized by different team members using different codes.
Unify codes, add PDs: Different PDs were distributed to team members
using the same set of codes, or mainly the same set of codes. Codes that are
different from the common set are not lost but added.
ATLAS.ti 7.1 USER MANUAL
MERGING HERMENEUTIC UNITS
155
Main Concepts Of Merging
Target And Source HUs
The main concepts in Merge are the Target HU and the Source HU. The Target
HU is the HU into which another Source HU is merged. The target HU has to
be loaded into the HU Editor before invoking the Merge HUs option. It is
advisable to store the target HU under a different name before starting the
merge procedure.
To prevent accidental overwrite of an existing HU, you may create a new HU
first, and then merge the two HUs consecutively into this HU. However, this
approach takes two merge steps.
Merge Strategies
Three "strategies" can be chosen for the processing of every object category.
These are "Add," "Unify," and "Ignore." The object categories that can be
processed within the HU are PDs, Quotations, Codes, Memos, PD Families,
Code Families, Memo Families, and Network Views.
Add: The objects of this category are added to the target HU. If an identical
object is found in the target, the added object will get a new name consisting
of the original name plus the suffix "_number". A new number is added until
the name of the object is unique. For instance, if a code "Alchemy" already
exists in the target, the source version of "Alchemy" is renamed to
"Alchemy_1".
Unify: Searches for corresponding objects in the target HU. If such an object is
found, all attributes of the source object are "inherited" by the target object. A
corresponding quotation is one that resides in the corresponding primary
document AND that has the same start and end position.
In this procedure, attention is paid to deviations between two PDs to be
merged that may result in a corrupt PD with misaligned quotations.
Two PDs are
considered equal
for unification
when three
conditions hold.
While most other objects are unified via their name, PDs are treated differently.
A PD from the source HU is unified with a PD from the target HU if the
following conditions hold:
• Both PDs have the same ID (e. g., P 1).
• Both PDs refer to the same data source.
• If none of the PDs can access its data source, the test uses ID and revision
equality only. Thus, HU files can also be merged if the data source files are
not available.
• If two PDs found to be the same but at a different revision status, the PD
with the older revision status is synchronized.
Ignore: Instances from ignored object categories are not transferred during the
merge process. For a finer grained exclusion you can use the "ignore" families
option (see next).
Use specially
named families
for fine-grained
control over items
to be ignored.
"Ignorant" families: To exclude specific objects from the transfer (like private
memos or test codes, etc.), you would create a special family with the name "!
MERGEIGNORE" into which you can move items to be excluded. This can be
done for all three family types.
ATLAS.ti 7.1 USER MANUAL
MERGING HERMENEUTIC UNITS
156
How To Merge Hermeneutic Units
When merging two HUs, the Merge Wizard guides you through the procedure.
In the first step, the source HU is selected. Next, a merge strategy is chosen
and possibly fine-tuned.
Select A Target And Source HU
Load the target HU. It is advisable to save it under a different name, so that
you don’t corrupt the original file in case something goes wrong.
From the HU Editor’s main menu, select PROJECT / MERGE WITH HU.
Alternatively you can drag an HU onto the HU Editor’s caption holding down
the CTRL key. The Merge Wizard opens, guiding you through the merge
procedure (see figure 128 below).
The first page of the Merge Wizard displays the current target HU (i. e., the
one that was loaded first), requesting you to enter the source HU’s file name.
Figure 128: The Merge Tool - select a Source HU after loading the Target HU
Click on the browse button and select a source HU from the file dialog.
Click the NEXT button. The source HU is loaded and you can proceed with the
next step.
If the merge procedure was initiated by drag & drop, the source HU is already
entered into the source entry field. You can immediately proceed by clicking on
the NEXT button. Next, you need to choose a merge strategy.
Choose A Merge Strategy
The second step is the selection of how the source HU is to be merged into the
target HU. Four broad, predefined strategies are available that can be
customized in a second step. Object classes can be selectively added, unified, or
ignored (see “Main Concepts Of merging” on page 155 above).
ATLAS.ti 7.1 USER MANUAL
MERGING HERMENEUTIC UNITS
The Merge
Wizard offers a
variety of options
to set the merge
strategy for every
object type.
157
Select one of the four stock strategies. A short description of the strategy is
displayed at the bottom left of the dialog box.
Fine-tune the strategy so it best suits your needs. For all major object types,
you can divert from the predefined stock strategyand manually define how
the various object types are to be handled in the merge process.
Figure 129: Merge Tool: Select a stock strategy and fine-tune your selection
Same PDs and Codes: Choose this strategy when PDs and codes are (mostly)
the same in the target and source HU. All of the same PDs and codes are then
unified. Different PDs and codes will be added.
The Merge
Wizard offers a
variety of options
to set the merge
strategy for every
object type.
Same PDs – Different Codes: Choose this strategy when target and source HU
contain the same PDs, but different set of codes. If identical codes are found
during the merge procedure, the duplicate codes from the source HU are
automatically renamed by adding a numeric suffix.
Original code name: Alchemy
Duplicate code: Alchemy_1
Different PDs - Same Codes: Choose this strategy when target and source HU
contain different PDs that have been coded with the same code set. This is a
common situation when working in teams and different team members have
coded different PDs using a common set of codes. If a few additional codes
have been added to the common set, these will be added.
Different PDs and Codes: Choose this strategy when both PDs and codes are
different. The PDs and codes from the source HU will be added to the ones in
the target HU. If identical codes are found during the merge procedure, the
duplicate codes from the source HU are automatically renamed by adding a
numeric suffix as shown above.
Check the option "Create Merge Report" to generate an overview of what
has been done. The report lists all added and unified objects and their old
and new names. Statistics about the source and target HUs and the resulting
merged HU are created. The report will be opened in a rich text editor after
the merge process is completed (see “Merge Report” on page 160 for
details).
ATLAS.ti 7.1 USER MANUAL
MERGING HERMENEUTIC UNITS
158
Click FINISH to start the merge process. This may take a while depending on
the size of both the target and source HUs and the strategy chosen. The
Unify strategy is generally more consumptive in processing time than adding
objects.
If you repeatedly merge the same HUs, you might want to deactivate the
option “Merge Comments” as this may unnecessarily blow up the comment
for any of the unified objects and leads to duplication of entries.
Conflict Resolution For Links
or certain entities, a default "conflict resolution strategy" is used. If the
inclusion of objects could result in the modification of a "link" between objects
in the target HU, the target HU link is preferred. Example: If there is a link "isassociated-with" between two codes "Alchemy" and "Gold" in the target HU,
and a conflicting link "is-contrary-to" exists between the corresponding source
HU codes, then the link in the target HU "wins". However, if no link exists
between two objects in the target HU, the link existing in the source HU is
transferred. This strategy is also pursued for hyperlinks and other connections
between objects.
Figure 130: Merging HUs: Link resolution - The link between Code A and Code B in the target
HU survives the merge process.
ATLAS.ti 7.1 USER MANUAL
MERGING HERMENEUTIC UNITS
159
Migration Of General Features
Co-authors are
also merged.
The comment of the source HU is appended to the target, and the list of coauthors in the target is completed with those in the source HU.
Special Considerations For Quotations
Quotations play a special role because they cannot be handled independent of
the PDs. When PDs are ignored, so are quotations. When PDs are added,
quotations are added. The interesting case is when PDs are unified: you can
then select either UNIFY or ADD.
Add quotations if
you want to
calculate intercoder-reliabiltiy.
ADDing quotations will create duplicate quotations in the target PD, even if a
matching quotation already exists. This is a useful option if you want to
calculate inter-coder reliability (see CAT, a free online tool that allows you to
calculate intercoder-reliabiltiy. You can access the tool via HELP / MORE RESOURCES
/ THE CODING ANALYSIS TOOLKIT).
Merging Scaled Codes
When variable codes with a special naming convention (see “Scaled vs.
Dichotomous Codes” on page 409) are added during the merge process, their
values are invalidated in case of name clash. The reason for this is that
imported codes with an identical name are automatically renamed using a
numeric suffix.
Note that before applying the SPSS job generation feature on the resulting HU,
such codes would need to be manually renamed.
A Few Additional Considerations
You can unify codes, but add Network Views. This results in a new network
containing the same nodes as those already contained in the target HU's
network.
Adding nodes and unifying networks could result in an existing Network View
being crowded with both the nodes from the target and the source HUs.
Test merge
effects by
experimenting
with sample HUs.
Unifying Super Codes combines their queries using the OR operator.
To get acquainted to the effects of either adding or unifying entities, you
should experiment with the various strategies using sample HUs. Observe
what happens. Before modifying serious projects, you should gain some
understanding of how the merging process works.
After The Merge
After a successful merge operation, some "cleaning up" might become
necessary. For example, codes with different names but similar meaning (i. e.,
synonyms) are now treated as distinct codes. They may need to be merged (see
“Merging Codes” on page 205). It could also be the case that you end up with
a number of quotations that overlap but are coded by the same code(s). Such
instances can be found with the help of the Coding Analyzer (see “Redundant
Coding Analyzer” on page 374).
ATLAS.ti 7.1 USER MANUAL
MERGING HERMENEUTIC UNITS
160
The Merge Report
If you have checked the option “Create Merge Report” in the Merge Wizard
(default), a report generator keeps track of every object affected during the
merge process.
The report displays:
• the name and location of the source and target HUs
• object statistics and merge strategies for source and target HUs
• added objects sorted by object type (prefixed with a "+")
• unified objects sorted by object type (prefixed with a "=")
• statistics for the resulting HU
Below, excerpts from a merge report are shown resulting from merging “The
Sample” HU with itself using the strategy “Different PDs Same Codes”. During
this merge, PDs, quotations and PD Families are added; and all codes are
unified.
The first part of the report provides an overview of the selected merge
Figure 131: First part of the merge report: An overview of the selected merge strategies
strategies.
Added Objects
When objects are added that have identical names in both the source and
target HUs, the added object is renamed using an incremental numbering
scheme. Note that the PDs are not renamed. This is because the prefix "P x" is
a part of the name, making equally named PDs distinct.
ATLAS.ti 7.1 USER MANUAL
MERGING HERMENEUTIC UNITS
161
Figure 132: Added primary documents using a unique identifier in form of the PD number
The imported PD families are renamed using the numeric suffix "_1".
Figure 133: Names of added primary documents
Unified Objects
Unified codes are displayed along with their new quotation references within
the resulting HU:
ATLAS.ti 7.1 USER MANUAL
MERGING HERMENEUTIC UNITS
162
Figure 134: Report on unified codes
Statistical Summary
The statistical summary at the end of the report provides an overview of all
Figure 135: Statistical summary at the end of the merge report
object types after the merge.
ATLAS.ti 7.1 USER MANUAL
MERGING HERMENEUTIC UNITS
163
Figure 136: Report on unified codes
Trouble-shooting After Merging
PDs Are Added Rather Than Merged
Explanation: If you add documents to a project, the data source files are copied
into the selected library. In your ATLAS.ti HU you see “primary documents” these can be thought of as containers for your data source files. In addition to
the reference to the data source, these containers have a name, an author, a
creation and modification date, etc., basically all the information you see in the
PDocs Manager. Plus, each primary document (PD) has a unique fingerprint
(which you do not see). It is generated when adding the data source to an HU.
The advantage of this is that ATLAS.ti can precisely identify each primary
document and for example the order of primary documents in your HUs do no
longer play a role when merging. The often overlooked consequence, however,
is that if you add the same data sources to a different HU (on the same or a
different computer), the fingerprints will be different.
This means when merging these HUs, ATLAS.ti does not recognize the primary
documents as being the same - due to their different fingerprints - even though
their content is the same.
When merging HUs, you do not merge data sources. You merge primary
document containers.
Solution: As it happens every so often that users do not consider the fact that
fingerprints are created, we added a new option to merge primary documents
ATLAS.ti 7.1 USER MANUAL
MERGING HERMENEUTIC UNITS
164
in case you ended up with two (ore more) primary documents that contain the
same content instead of one after merging HUs.
Before explaining how this is done, let us remind you of what you should have
done to avoid this unwanted outcome :-).
One person in your team should have setup the project adding all needed
documents, creating a copy bundle file and distributing the copy bundle file to
all team members. Variations of this are possible, e. g., that the various team
members add DIFFERENT documents at different locations. What is common to
all possible scenarios is that data files with the same content need to be added
at one location and then a copy of the project in form of a copy bundle file
needs to be distributed to everyone else. See also “Setting up Team Projects“
on page 110.
In case after merging you ended up with two rather than one primary
document and you are sure their content is the same, do the following:
Select the two primary documents in the Primary Document Manager (by
holding down the Ctrl-key).
From the MISCELLANEOUS menu (main menu or context menu) select the option
MERGE SELECTED PDS.
Figure 137: Merge primary documents
Another window opens. Select whether you want to add or unify quotations
and whether to merge comments. In case you accidentally ended up with
two primary documents for one data source, you need to select “unify”
option. The “add” option is useful if you want to compare the coding of two
coders for inter-coder reliability purposes (see “Calculating Inter-Coder
Reliability using CAT“ on page 304.
ATLAS.ti 7.1 USER MANUAL
MERGING HERMENEUTIC UNITS
165
Figure 138: Further merge options
Make your selection and click OK.
ATLAS.ti 7.1 USER MANUAL
THE DATA LEVEL - BASIC FUNCTIONS
166
The Data Level - Basic Functions
As you may already know from the chapter on the main concepts and features
(see page 13), there are two principle levels of interaction, the data level and
the conceptual level.
The data level includes activities like segmenting and organizing data files,
coding data segments, simple retrieval and writing memos, while the
conceptual level focuses on asking more complex questions about your data,
model-building activities, such as linking codes to form semantic networks.
In this chapter, you will learn about the main procedures needed to begin your
data analysis. These include how to mark, code, and comment text, graphic,
audio and video segments; and how to write memos. In addition you learn
about the ATLAS.ti family function. This is a function for grouping objects, i. e.
documents, codes and memo, which can then be used as filters for various
purposes.
Creating Quotations
The most common operations on primary documents -- especially when
starting a project -- are selecting data sections, assigning codes and/or memos
to them.
Marking a segment does not by itself create a quotation, though this is often
the very next step after making a selection.
Creating And Working With Textual And PDF Quotations
Video tutorial: http://www.youtube.com/watch?v=bU6nu-aWhYM
In the majority of cases, creating quotations is part of a higher-level procedure
like coding or writing memos (described later).
ATLAS.ti 7.1 USER MANUAL
THE DATA LEVEL - BASIC FUNCTIONS
167
There are a number of ways to create a quotation. These options are available
via the toolbar and menus, and via drag & drop. For immediate feedback when
creating quotations, switch on the margin area (if not yet activated).
For immediate
feedback, activate
the margin area
Before a quotation can be created, an appropriate selection must exist.
Selecting Text Segments
In addition to the usual selection techniques known from text editors and word
processors, ATLAS.ti offers an extended “semi-automatic” double-click
selection technique for textual primary documents.
Here is how it works:
Double-click selection sequence:
Word
Sentence
Paragraph
Complete Text
Unselect
Figure 139: Text segmenting options
Double-click to select the word (assuming it is not yet selected).
Double-click on the selection to expand it to the sentence embedding the
current selection.
Double-click on the selection to expand it to the full paragraph surrounding
the selection.
Double-click again to select the complete text.
Double-click once more to deselect the selected area.
For the semi-automatic selection of sentences and paragraphs, the currently
used Paragraph Model plays a crucial role. For instance, if you have assigned a
“Legacy” document with hard returns for every line, selecting a paragraph will
select a line unless you have switched interpretation to an “Old Paragraph
Model” (see ATLAS.ti Version 5 manual).
Selecting PDF Segments
Selecting PDF segments works essentially in the same way as selecting
segments in text of graphic files. If you select text in a PDF file, you need to
pay attention that the cursor is positioned left from the first letter of the text. If
ATLAS.ti 7.1 USER MANUAL
THE DATA LEVEL - BASIC FUNCTIONS
168
you begin your selection further to the left or above the text, then ATLAS.ti
handles the selection as a graphic segment (see “Creating and Working with
Graphical Quotations“ on page 171.
Creating A Free Textual Or PDF Quotation
Mark a section in the primary document.
Click the CREATE FREE QUOTATION button (see left) in the HU Editor’s primary
document toolbar. Alternatively you can right click on the selection and choose
CREATE FREE QUOTATION from the context menu. The option is also available from
the main Quotations menu.
Figure 140: Creating free text quotations
If you accidentally select a section for which a quotation already exists, the
context menu will not include the Create Free Quotation command.
A new entry is shown in the quotation drop down list or if opened the
Quotation Manager. The default name consists of the first 30 characters of the
selected text.
Text quotation are highlighted according to the highlight color you have set in
Windows. The highlight color for PDF documents can be set within ATLAS.ti in
the PDF preferences window (TOOLS / PREFERENCES / PDF PREFERENCES).
Creating Quotations Using Drag & Drop
This technique allows you to virtually "throw" pieces of text into the
quotations list. This however only works for textual, not of PDF files (txt, doc,
docx, rtf).
Move the mouse pointer into the selected text. The pointer will change to its
"drag & drop" appearance.
By holding down the left mouse button, drag the selection into the quotation
drop-down list or the Quotation Manager.
ATLAS.ti 7.1 USER MANUAL
THE DATA LEVEL - BASIC FUNCTIONS
169
Figure 141: Creating quotations using drag & drop
You have just created a quotation. A new entry appears in the quotations dropdown list and the Quotation Manager. In the margin, a bar will be displayed.
Quotations are also be created in the course of coding or memoing using drag
& drop.
Quotation References
Figure 142: Quotation reference
The bars in the margin mark the length of the quotation graphically. The entry
in the quotation field shows a textual reference for the quotation. It consists of
the following elements: ID, name, start and end position.
ID: The quotation ID is composed of the number of its P-Doc and a second
number indicating when the quotation was created. The ID 8:1 means that the
quotation is from P-Doc 8 and is the first one that was created in this
document. The reason for the chronological numbering is to do with the fact
that you will not necessarily code a document from the first line to the last. You
will jump between passages and modify or delete some quotations during the
coding process. A linear numeration would have to be updated with every
single quotation that is inserted, which would take up unnecessary
ATLAS.ti 7.1 USER MANUAL
THE DATA LEVEL - BASIC FUNCTIONS
170
computation capacity. Sorting the quotations by their start position, for
example, offers a clear linear view of your quotes. Recently an option was
added to change the chronological numbering to a sequential order if need be
(QUOTATIONS / MISCELLANEOUS / RENUMBER ALL TO DOCFLOW). This can for example be
useful when coding open ended questions from survey data and you want to
keep the cases in synch with the cases in the SPSS file.
Name: The name shows the first 30 characters of a textual quotation. This is
the default setting which can be changed under TOOLS / PREFERENCES / GENERAL
PREFERENCES. Quotations based on image, audio or video files show the file name.
The name of a quotation can be renamed. This is a useful option for image,
audio and video quotations, as we will see below.
Start and end positions: The figures in brackets after the quotation name show
the location (start and end position) in the document. For textual quotations,
the reference given is to the paragraph numbers within which the coded
segment occurs. (9:9) thus means that the quotation starts and ends in
paragraph 9.
For image files, the rectangular area marked as the quotation is referenced.
Audio and video quotes use a time reference:
(hours:minutes:seconds:milliseconds)
References for PDF quotations consist of: page number and number of
characters on the page for start and end positions. In case the document
contains columns, the column number is provided as well.
Video tutorial: http://www.youtube.com/watch?v=bU6nu-aWhYM
Activating And Displaying Textual And PDF Quotations
Quotations can be activated (retrieved) and displayed by selecting an entry
from the drop-down list, by double-clicking on an entry in the Quotation
Manager, or by clicking on the quotation bar in the margin area.
Coded quotations can be retrieved by double-clicking on an associated code
(see “Code Manager” on page 48 for detail). Quotations can also be activated
from the results pane of the Query Tool (see “Output of Query Results” on
page 270).
Figure 143: Activating quotations via its code
ATLAS.ti 7.1 USER MANUAL
THE DATA LEVEL - BASIC FUNCTIONS
171
A quotation can be activated and displayed from virtually any browser
displaying quotations: drop-down list, Object Manager, Network Editor, Object
Crawler, HU Explorer, etc.
Modifying Textual And PDF Quotations
This feature lets you change the boundaries (start and end position) of a
quotation.
Activate the quotation if not already selected.
Select a data segment that you actually want to use as this quotation. When
increasing the size of the quotation, you can simply highlight the text that
you want. If you want to reduce the size of the quotation, you need to
deselect the selection first by clicking somewhere above or below the
highlighted area. Then select a smaller section. When resizing PDF
quotations, you can conveniently use the handles at the upper left and lower
right-hand corners.
Click the modify button, located to the left of the text window or choose
MODIFY BOUNDARIES from the main Quotations menu.
The quotation will be changed reflecting the new boundaries.
New Boundaries Match Existing Quotation
If the new boundaries match another existing quotation, you are asked for
confirmation to "merge" the currently modified and the already existing
quotation. The quotation resulting from the merge operation collects the
references of both quotations. For example, if the modified quotation was
coded with code A and the existing quotation with matching boundaries with
code B, the new quotation will be referenced by both code A and B.
If you modify a previously renamed text quotation, you are asked for
confirmation using the newly selected string (truncated) as its new name.
Creating And Working With Graphical Quotations
Selecting graphical segments differs from the operations required for selecting
segments within textual documents. However, the overall look and feel is
sufficiently similar.
Move the mouse pointer to the upper left corner of the rectangular section
that you are going to create.
ATLAS.ti 7.1 USER MANUAL
THE DATA LEVEL - BASIC FUNCTIONS
172
Drag (holding down the left mouse button) the mouse to the lower right
corner of the rectangle.
Figure 144: Graphical quotation
Release the mouse button. You have now created a selection and the
rectangle will be highlighted.
To create a quotation, select the “create quotation” button in the vertical
tool bar, or right click on the selection, then select CREATE FREE QUOTATION from
the context menu; or select this option from the main menu QUOTATIONS /
CREATE FREE QUOTATION. All quotations within a graphical document are
numbered consecutively.
Activating And Displaying Graphical Quotations
Graphical
quotations in a
document appear
as rectangles. The
selected
quotation is
emphasized.
In addition to the general activation procedures described for textual
quotations, a graphical quotation can be activated by directly double-clicking
within its “box” in the document pane. Where two or more quotations
intersect, you are presented with a list of quotations from which to choose.
All graphical quotations are indicated by borders. A selected quotation is
depicted either framed or filled. To change the display:
Right-click anywhere within the graphical image and select SELECTION-DISPLAY
TYPE / Filled.
ATLAS.ti 7.1 USER MANUAL
THE DATA LEVEL - BASIC FUNCTIONS
173
Figure 145: Filled display of a graphical quotation
Permanent display of graphical quotations' frames can be toggled off and on.
To change the permanent display:
Right click an area on the graphical document and choose TOGGLE AREAS
DISPLAY from the context menu.
Modifying Graphical Quotations
To modify an image quotation, double click inside the rectangle so that you
see the green lines and dots at the four corners. The dots act like handles and
you can use them to resize the quotation.
Figure 146: Use the handles to resize the quotation
Select the area that you actually want to use as quotation.
Click the modify button on the vertical tool bar, or choose QUOTATIONS /
MODIFY BOUNDARIES from the main menu.
The quotation will be changed reflecting the new boundaries.
ATLAS.ti 7.1 USER MANUAL
THE DATA LEVEL - BASIC FUNCTIONS
174
Creating And Working With Multimedia Quotations
Load a video primary document, e.g. “P6: Happiness proverbs of famous
people” in the sample project.
Figure 147: The various aspect of a loaded video document
At the right-hand side, preview images are displayed. When you add a new
video to a project, you do not immediately see the preview images as they first
need to be created. Depending on the length of the video this may take a few
seconds or up to a few minutes (see “Adding Multimedia Documents“ on page
75).
If you move the cursor inside the video pane, the media controls appear and
you can start, stop and pause the video, skip forward and backwards. You can
also start and stop the multimedia file by pressing the space bar.
Context Menu Of Preview Pane
If you right-click on the video preview, you can set a number of display options
in the context menu (see Figure 147).
You can hide or display the video preview and audio wave form.
ATLAS.ti 7.1 USER MANUAL
THE DATA LEVEL - BASIC FUNCTIONS
175
Figure 148:
Quotation overlay
If you mark a segment by moving with your mouse over the video previews,
time indicators are display: start and end position and total length of the
segment.
By default the left and right audio channel are displayed as one audio wave
form. If needed, you can separate the left and right channel and display two
audio wave forms.
Select Waveform Zoom Factor to adjust the size of audio wave.
Use Auto-Scroll if only parts of the video is displayed in the margin area and
you want the margin area to automatically scroll if you play the video. See
Figure 152).
Show Quotation Overlay to see the quotation boundaries displayed on top of
the video preview.
Context Menu Of Document Pane
The options offered by the media controls and the multimedia tool bar (see
Figure 150) can also be accessed via the context menu:
ATLAS.ti 7.1 USER MANUAL
THE DATA LEVEL - BASIC FUNCTIONS
176
Figure 149: Context menu of document pane
Further you have the option to change the display size of the video (Zoom
Video), to generate the preview images again and to display and export some
technical information. The latter options you only need if there was a problem
with generating the preview images.
The Multimedia Toolbar
Figure 150: The multimedia toolbar
ATLAS.ti 7.1 USER MANUAL
THE DATA LEVEL - BASIC FUNCTIONS
177
Tool
Description
Repeat/Loop
Sneak Preview
Adjust audio volume
Adjust play speed
Selection start
Repeats either the complete file or any selected
segment until the pause or stop button is clicked.
Especially useful to repeat noise-covered or
otherwise hard-to-understand passages during
transcription.
Helps to fine-tune a segment end, e. g. to isolate
a word from a contiguous spoken text. When
moving the position while the Sneak Preview
mode is active, a short “preview” of 500
milliseconds (or 2 frames for video data) is played
repeatedly, making it easier for marking the
boundary of your segment. Using this function
takes practice and is best used in combination
with the cursor keys.
Click to adjust the volume.
Click to adjust the speed (not yet implemented in
Version 7.0.xx)
The current position is made the start coordinate
of a quotation to be created.
Keyboard shortcut: < OR ,
Selection end
The current position determines the end
coordinate of a quotation.
Keyboard shortcut: > OR .
Create and modify quotation
Creates a free quotation from the current
selection. This button is disabled unless a valid
segment is marked, or if the segment already
matches an existing quotation. Keyboard
shortcut: q (note: q also starts a new selection).
In combination with the CTRL key, this button
trims the current media quotation to the current
selection.
Create snapshot
Create a snapshot of the currently displayed video
frame as image PD. You will then be asked
whether to import the image into My Library or
the Team Library.
Zooming The Time Line
You can zoom the time inline to select just the section of the audio or video
that you want to see in the margin area:
When you move the mouse pointer over the full preview, two orange sliders
appear (see Figure 151 and Figure 152):
ATLAS.ti 7.1 USER MANUAL
THE DATA LEVEL - BASIC FUNCTIONS
178
Figure 151: Zooming the time line
Move the right and left slider to the desired position. Time indicators display
start and end position and length of the selection.
Figure 152: Selecting an area of the video file to be
displayed in the margin area
Navigating Through The Audio Or Video File Via The
Playhead Pointer
Use page up / page down, to move the position of the playhead pointer by
1/50th increments of the length of the video that is currently displayed in the
margin area.
Use the arrow keys, to move the position of the playhead pointer by 1/1000th
increments of the length of the video that is currently displayed in the margin
area.
Use the arrow keys + the Ctrl-key, to move the position of the playhead
pointer by 1/20th increments of the length of the video that is currently
displayed in the margin area.
ATLAS.ti 7.1 USER MANUAL
THE DATA LEVEL - BASIC FUNCTIONS
179
Creating Audio Or Video Quotations
Using The Mouse-pointer
To code a video segment, move your mouse pointer on top of the audio
wave and mark a section by clicking on the left mouse button where you
want it to start. Then drag the cursor to the end position.
Figure 153: Selecting a
video segment
Using Short-cuts
There are two alternatives to mark start and end positions by using keyboard
short-cuts. Move the playhead pointer to the desired start position. Select <
or , to set the starting point.
Move the playhead pointer to the desired end position. Select > or . to set
the end point of a segment. Depending on your keyboard one of the two
option (<> or ,.) is more convenient to use.
Previewing The Selection
Figure 154: Playing the current video selection
If you want to preview your selection click on the “play current selection”
button.
Click the Create Quotation button (see Figure 154) to create a free
quotation.
ATLAS.ti 7.1 USER MANUAL
THE DATA LEVEL - BASIC FUNCTIONS
180
Figure 155: Display of a video quotation
A new quotation will be listed in the Quotation Manager. The default name for
audio and video quotations is the document name. Each quotation can,
however, be renamed. To do so, right click on the quotation name in the
Quotation Manager and select the RENAME option. See also “Describing
Multimedia quotations to improve output“ on page 200).
In addition the start position and the length of the segment -this is the number
in brackets) in form h:min:sec:millisec is provided.
Figure 156: Renamed audio quotation showing time references
Audio and video quotations can be easily recognized by their special icon.
Activating And Playing Audio And Video Quotations
To play the quotation, double-click on the quotation bar.
If you want to move the play-head to the beginning of an existing quotation,
hold down the Ctrl-key and click on the quotation bar.
You can also move the playhead pointer with the mouse. As soon as you
move it either over the start or end position, the pointer snaps. To override
this behavior, hold down the SHIFT-key.
Figure 157: Positioning the playhead pointer at a beginning of a
quotation
ATLAS.ti 7.1 USER MANUAL
THE DATA LEVEL - BASIC FUNCTIONS
181
Click the space bar to stop and start an audio or video file.
Adjusting The Size Of Audio Or Video Quotations
To adjust or change the length of the quotation, drag the start or end position
to the desired place and click on the “modify quotation” button in the vertical
tool bar on the left hand side of the screen (see Figure 158 below).
Figure 158: Adjusting the size of a video quotation
You can also use the playhead pointer to adjust the size of a quotation: Position
it at the desired point. If you want the start position to change, hold down the
SHIFT-key and double-click on the area above the playhead pointer. To change
the stop position, hold down the SHIFT-key and double-click on the area below
the playhead pointer.
Figure 159: Using the playhead pointer to adjust the size of a video quotation
ATLAS.ti 7.1 USER MANUAL
THE DATA LEVEL - BASIC FUNCTIONS
182
Creating And Working With Google Earth Quotations
Creating Google Earth Quotations
If you haven't done so, you first need to assign a GoogleEarth PD: DOCUMENTS /
NEW / NEW GOOGLEEARTH PD. Then load the Google Earth PD by selecting it from
the drop-down list. This loads Google Earth into the ATLAS.ti editor.
Open the Quotation Manager alongside the HU editor.
Figure 160: Enter or select a location to fly to
To create a new quotation, position Google Earth to whatever location you
want, e. g. by entering a location in the FLY TO field or by selecting a location
in the list of Places.
Double click to select the place where the quotation should be attached to. If
you have selected a location from “My Places”, this is not necessary.
Next, click the Free Quotation button in the vertical toolbar left of the PD
area or choose CREATE FREE QUOTATION from the Quotations menu.
The default name of the quotation is the name of the primary document, e. g..
“Google Earth”. In case you have selected a feature as quotation like a place
from the list of saved places in Google Earth, the name of this place is used. In
addition, the geographical reference is provided.
ATLAS.ti 7.1 USER MANUAL
THE DATA LEVEL - BASIC FUNCTIONS
183
Figure 161: References for Google Earth quotations
Whether the PD name or the feature's name is used, can be set via TOOLS /
PREFERENCES / GOOGLE EARTH PREFERENCES. Depending on your project needs, you
may choose to rename the quotations.
Activating Google Earth Quotations
In the first instance, you only see the newly created quotations within the
Quotation Manager or in the drop down list. In order to see the information in
Google Earth as well, the information needs to be transferred. Thus, the
ATLAS.ti Google Earth PD needs to be “injected” into Google Earth. This is
easily done by reloading the PD.
For the ATLAS.ti placemark in the GE document, the name of the quotation is
used. In addition, you see the quotations in the Places Panel under Temporary
Places on the left hand side.
To reload a PD, select it from the drop down list by holding down the Ctrlkey. OR: select the menu option DOCUMENTS / MISCELLANEOUS /UPDATE GOOGLE
EARTH PD.
Figure 162: The ATLAS.ti placemark shows the location of the quotation within the GE map
ATLAS.ti 7.1 USER MANUAL
THE DATA LEVEL - BASIC FUNCTIONS
184
Displaying Google Earth Quotations
The hierarchy of the elements under temporary places in GE resembles the
structure of the HU. At the top, you see an ATLAS.ti root folder for each HU in
the session. Below this folder, the name of the HU is repeated and all its
Google Earth PDs and quotations are created as GE features. If you write a
comment for a GE quotation or document, it will be shown as well.
Clicking on a quotation’s place mark in GE will show a balloon description with
meta information like its codes or memos. If you have written a comment for
the GE quotation, it can be shown as well.
Figure 163: Display of quotation comments in GE
Modifying Google Earth Quotations
To modify a quotation, select it in the Quotation Manager.
Double click on a new location where it should be moved to.
Select the “revise quotation” button from the vertical tool bar. Or select
QUOTATIONS / MODIFY BOUNDARIES from the main menu.
Moving Around
By default traveling to another quotation is by flying. When you press the
SHIFT key during a transfer, you are "tele-ported" to the other location
directly. The default speed can be set via TOOLS / PREFERENCES / GOOGLE EARTH
PREFERENCES.
ATLAS.ti 7.1 USER MANUAL
THE DATA LEVEL - BASIC FUNCTIONS
185
Extrusion – Display Quotations At Elevated Levels
Usually the placemark icons are fixed to the ground. For hilly environments or
between large buildings you can raise the icon like a balloon to a certain height
(in meters) above ground. The icon is always tied to the ground with a
connecting line. You can set extrusion via TOOLS / PREFERENCES / GOOGLE EARTH
PREFERENCES.
Display A GE Quotation In Google Maps
If Google Earth is just too heavy, you may open a GE quotation in Google
Maps instead.
Select a quotation, e. g. in the Quotation Manager.
From the Miscellaneous menu, select Open in Google Maps.
If you have created hyperlinks to Google Earth quotations, right click on the
hyperlink and select the option Open in Google Maps.
This opens your Internet browser on the same location. However, you do not
have tilt and heading. Currently, there is a fixed zoom factor for the Google
Map view.
Import Google Earth Quotations
If KM* files include placemark features, these can be imported as quotations.
The meta information that was inserted into the placemark is inserted into the
quotation comment field in ATLAS.ti. The default setting is to import
placemarks during the process of assigning a KML / KMZ file as primary
document. This can be configured in the GE Preferences window.
Assign a KML or KMZ file as primary document (DOCUMENTS / NEW / ASSIGN
EXTERNAL DOCUMENTS).
Currently, KML and KMZ files have to be created in GoogleEarth. If you have
created them elsewhere, open them in GoogleEarth and save them again. Then
assign them.
Next, select DOCUMENTS / MISCELLANEOUS / IMPORT QUOTATIONS
from the main menu.
FROM KMZ/KML
Create Graphical Snapshot PDs
The images provided by Google Earth are not stable. They may change over
time. When views are changed is not known to the regular user. Thus,
although positions on earth are stable, the views are not.
A new set of aerial and satellite images may yield a whole different set of
details. This makes making snapshots from a current view a practical thing.
Furthermore you can code detailed sections within a graphical PD. Such PDs do
not require Google Earth to be installed.
ATLAS.ti 7.1 USER MANUAL
THE DATA LEVEL - BASIC FUNCTIONS
186
Position Google Earth to the desired view either manually or by selecting a
GE quotation.
Resize the GE window to the desired size. The content you see will be used
for the PD. Only the main area is used, the side bar title etc. are ignored.
Configure all needed layers.
From the drop down Add button or the main Documents menu, select New
GoogleEearth Snapshot PD.
A new PD is created. The naming convention is as follows:
If selecting a quotation in the Quotation Manager and creating a snapshot
based on that view, the name for the PD will be Google Earth SN (SN for
Snapshot).
If selecting a quotation from the Google Earth sub tree in the Places Panel, the
name that is shown there is used with the prefix GESN:.
Thus, if you have given your quotation a unique name and want to use it as
name for your PD snapshot, then it might be preferable to select the quotation
from the Places Panel. If you prefer neither of the two standard options, you
can always rename the newly created snapshot PD.
The source files for the snapshot PDs are jpg; they are stored in the same folder
as the HU and their name starts with GES plus a two digit letter/number
combination.
This feature is only available if GE has already been started. - Repeated
entries: If you close ATLAS.ti and restart while GE is still open, GE creates a
new feature hierarchy for each HU. You can either manually remove the
feature tree from the GE places panel or close it and let ATLAS.ti start it for
you by loading a Google Earth PD..
Deleting Quotations
Quotations can be deleted. Of course, nothing is removed from the primary
document’s data source.
Deleting a quotation affects only its references. "Free" quotations are deleted
silently. However, if references to codes, quotations, or memos exist, you are
prompted for confirmation.
The option to delete quotations is available in a number of different places: the
main menu, the Quotation Manager (QUOTATIONS / DELETE), the HU Explorer,
and the margin area. To delete a quotation in the margin area, right click on
the quotation bar and select the option DELETE.
You can also right-click on a highlighted quotation and select the Delete option
from the context menu there:
ATLAS.ti 7.1 USER MANUAL
THE DATA LEVEL - BASIC FUNCTIONS
187
Figure 164: Deleting a quotation using the context menu
Deleting Quotation(s) In The Quotation Manager
Select the quotation(s) in question.
Click the REMOVE button.
If references exist for the quotation, confirm or reject the deletion process.
All quotations of a primary document are deleted when the primary
document is disconnected from the Hermeneutic Unit.
Coding Techniques
The coding procedures described in this section do not fully encompass the
complexity of the intellectual activity of coding as, for example, understood in
Grounded Theory (GLASER & STRAUSS, 1967).
In ATLAS.ti coding is simply the procedure of associating code words with
selections of data. Technically speaking, “coding” is the association between a
quotation and a code. The following describes ways to establish, maintain, or
remove such associations. Although some of the coding techniques reflect the
ideas and terminology used in Grounded Theory, you do not have to use this
methodology when analyzing your data within ATLAS.ti.
Four coding procedures are described: Open Coding, In-Vivo Coding, Codeby-List, and Quick Coding. In addition, the purpose and creation of free codes
are explained. Text search and automatic coding is described further below in a
separte chapter (see “The Auto-Coding Tool” on page 219).
Make code names
as succinct as
possible.
A code may contain more than a single word, but should be concise. Use the
code comment area to write a definition. If you find yourself writing prose
ATLAS.ti 7.1 USER MANUAL
THE DATA LEVEL - BASIC FUNCTIONS
188
instead of a succinct code name, you might in fact want to annotate. If this is
the case, use comments or memos instead.
Video Tutorials:
Coding Basics: http://www.youtube.com/watch?v=TUZpXEySp1U
Code Management: http://www.youtube.com/watch?v=_f1jO3B4Z18
Margin Area (1/2): http://www.youtube.com/watch?v=N8e9jPhTXNg
Margin Area (2/2): http://www.youtube.com/watch?v=kfyPwkrFYAA
General Coding Procedure
There are some common steps with each of the coding procedures described
below.
First of all, it is useful to switch on the margin display to see the immediate
effects of the coding process (note: there is no margin area for audio and video
documents). The margin area also permits the direct manipulation of the codes
and the associations between the quotations and the codes.
To Display The Margin Area
Choose VIEWS / MARGIN AREA from the main menu, or click the Margin Area
button in the primary document toolbar. The margin area is a useful feedback
device during coding. Codes are displayed alongside the quotation to which
they are attached.
Figure 165: Text with switched on margin area
The size of the margin area can be changed by dragging the split bar
between the primary document pane and the margin area with the left
mouse button.
Coding creates quotations for selected data sections if needed.
Coding results in codes linked to quotations. Any number of codes may be
assigned to a quotation and vice versa: a code may refer to any number of
quotations. Coding implicitly creates quotations for data segments that do not
already match an existing quotation.
ATLAS.ti 7.1 USER MANUAL
THE DATA LEVEL - BASIC FUNCTIONS
189
You may activate the basic coding procedures either in the primary document
toolbar, the CODING submenu of the CODES menu, the Code Manager or the
context menu of the data selection.
The coding options in the primary document toolbar:
OPEN CODING (CTRL+SHIFT+O)
Create a new code, ask user for name of code
CODE IN VIVO (CTRL+SHIFT+V)
Creates a code from the selected text
CODE BY LIST (CTRL+SHIFT+L)
Selects existing codes from code list
QUICK CODING (CTRL+SHIFT+Q)
Codes with the last used code
CODES TEXT SEARCH RESULTS
Codes the results of a text search
How Codes Are Displayed
After a code has been created, it appears as a new entry in several locations
(e.g., in the margin area, the drop-down list, the code manager).
Figure 166: Codes in ATLAS.ti
The selected code word is written next to the quotation bar in the margin. You
can recognize codes by the yellow diamond symbol.
The entry in the drop-down list in Figure 142: Quotation reference reads: “test
1 {1-0}”. The first number shows the frequency (how often the code has been
ATLAS.ti 7.1 USER MANUAL
THE DATA LEVEL - BASIC FUNCTIONS
190
applied). It gives you some information on the groundedness of a code, i. e.
how relevant this code is in the data. The second number the density (how
many other codes this code is linked to). Hence the code “Test 1” has been
used only once so far and it is not yet linked to any other code.
Display Of Codes In The Code Manager
The Code Manager provides a number of typical Windows display options like
Large Icons, Small Icons, List and Details. See “View Menu“ on page 40 and
“Code Manager Columns“ on page 50.
The Single Column View
Within curly brackets following the code name, groundedness and density are
displayed.
Figure 167: Code display
Grounded(ness). As explained above, groundedness refers to the number of
quotations associated with a code. In the above example, groundedness is 8.
This means, the code *name of suspect: Kosminski has been used for coding
eight times.
Density. In the above example the density is 2, thus two codes have been
linked to the code *name of suspect: Kosminski. Links between codes are
established by the user either by dragging and dropping codes onto each other
in the Code Manager or by linking them in in a Network View (see page 319).
Comment. The tilde character "~" flags commented codes. It is used not only
for codes but for all commented objects.
Coding With New Codes
Open Coding assigns new codes with already existing or newly created
quotations. You can create one ore more codes in a single step.
Select the data section or the quotation you want to code.
Click the Open Coding button (see left) or choose CODING / ENTER CODE
NAME(S) from the main or the context menu.
ATLAS.ti 7.1 USER MANUAL
THE DATA LEVEL - BASIC FUNCTIONS
191
Figure 168: Creating one or more new codes using the context menu
A dialog will open. Enter one or more code names and click OK. To enter a
second code name either click with the mouse into the second entry field, or
if you are used to enter the vertical bar, you can also use the vertical bar ( | )
to jump to the next line.
Figure 169: Entering code names
If a few codes already exist, you see whether a similar code name already exists
as the fields are automatically completed as you type.
The new code now appears in the Code Manager. The coded segment
(quotation) is displayed in the Quotation Manager.
Write comments!
The Code
Manager offers
bi-directional drag
& drop.
Make it a habit to write a comment for every new code (see Writing Code
Comments on page 195.
Coding Via Drag & Drop From The Code Manager
An easy way of coding is via Drag & Drop from the Code Manager.
Select a data section.
Open the Code Manager.
Select one or more codes in the Code Manager.
Drag and drop the codes into the primary document pane. If a quotation
already exists, you can alternatively drop the code onto a quotation bar in the
margin area.
ATLAS.ti 7.1 USER MANUAL
THE DATA LEVEL - BASIC FUNCTIONS
192
Figure 170: Coding via drag & drop
It is not necessary to drop the codes into the selected area. You may drop
the codes anywhere inside the primary document pane.
Use The Code Button In The Code Manager For Coding
Highlight one or more codes in the Code Manager and click on the code
button in the manager's tool bar (see Figure 171):
Figure 171: Use the code button to code a segment with
one or more selected codes
ATLAS.ti 7.1 USER MANUAL
THE DATA LEVEL - BASIC FUNCTIONS
193
In-Vivo Coding
Use in-vivo coding when the text itself contains a useful and meaningful name
for a code.
The term "in-vivo"
in this context stems
from grounded
theory, which draws
the researcher's
attention to
expressions used by
the interviewees
themselves.
In-vivo coding creates a quotation from the selected text AND uses the
selected text (trimmed to 30 characters) as the code name. If the selected text’s
boundaries are not exactly what you want for the quotation, modifying the
quotation’s “spread” (see “Modifying Textual and PDF Quotations” on page
171) is often the next step after creating the in-vivo code.
In-Vivo coding can only be applied to textual primary documents.
To Create An In-Vivo Code
Mark the text passage that you want to use as an in-vivo code. Bear in mind
that the code name is created from the text selection’s first 30 characters .
Click the In-Vivo coding button or choose CODING / IN-VIVO CODING from the
menu.
If needed, change the newly created quotation’s boundaries (“Modifying
Textual and PDF Quotations” on page 171 for details).
In-Vivo Coding Via Drag & Drop
Mark the text passage that you want to use for In-Vivo coding.
Open the Code Manager.
Create multiple
In-Vivo codes
Drag and drop the selected text into the Code Manager’s list pane or the
code drop-down list.
You can create a code from each word of the selected text by holding down
the ALT key when dropping the text.
Code-by-List
Select the data section/quotation to be coded.
Click the Code-by-List button or choose CODING / CODE BY LIST from the menu.
From the list window with applicable codes select one or more codes (while
holding the Ctrl key) and click OK.
This procedure
offers a list of all
current codes
from which one
or more code can
be selected and
associated with
the current data
selection.
The number of codes that you can select from the list is unlimited. If the data
section resembles an existing quotation, only codes not already assigned to this
quotation are offered.
ATLAS.ti 7.1 USER MANUAL
THE DATA LEVEL - BASIC FUNCTIONS
194
Code-by-List Inverse
The standard code-by-list technique associates a list of codes to one selected
quotation. Sometimes, it makes more sense to associate a list of quotations to
one code.
Code multiple
quotations in one
go.
To Link A Code To Many Quotations
In the Code Manager, or the drop down list select the code to be associated
with one or more quotations.
From the main or the code’s context menu, choose CODES / CODING / LINK CODE
TO:/ QUOTATIONS.
A list of quotations that were not already assigned to the selected code
opens. Select one ore more quotations and click OK.
To Link A Code To Many Quotations Via Drag & Drop
In the Quotation Manager select the quotations to be assigned to the code.
Drag & drop the selected quotations into the Code Manager onto the code.
Quick Coding
Quick Coding assigns the last used code to the current data segment. This is an
efficient method for the consecutive coding of segments using the most
recently used code.
Select a code in the Code Manager.
Select a data segment.
Click the Quick Coding button or choose CODING/QUICK CODING from the
menu.
Meaning Of Colored Bars In The Margin
As you saw in Figure 143: Activating quotations via its code, overlapping codes
are displayed in different colors in the margin area. These colors help you to
distinguish which bar belongs to which code word. If you were to add even
more layers, the next two layers would be displayed in violet and blue. After
that, silver is used again. The colors do not contain any information about the
different code levels in the sense of higher or lower ranked categories. When
you delete a quotation, the colors may change.
ATLAS.ti 7.1 USER MANUAL
THE DATA LEVEL - BASIC FUNCTIONS
195
Figure 172: Meanings of colored bars in the margin
It is possible to set your own colors for codes, but not for the bars marking the
length of a quotation (see “Setting code colors“ below).
Unlinking A Code
Just as you can erase a pencil mark in the margin of a paper document, you can
“erase” a code in the margin area on screen as well. The digital equivalent is
called unlinking. It is mostly used when a segment is coded with more than one
code.
To unlink a code, right click on the code in the margin area and click on the
UNLINK option.
When you unlink a code from a segment that only has one code, the bar
remains in the margin. If you want to “erase” both the code and the quotation,
you need to proceed as explained below.
Writing Code Comments
Use code
comments to
define your code
words.
Like Primary Documents, comments can be added to clarify the meaning of a
code or to explain how the code is to be used for coding. The practice of
commenting objects greatly supports a transparent, and, if working as part of a
team, cooperative working style.
Creating And Editing A Code Comment
Open the code manager and select a code.
Right click and select the option: EDIT COMMENT from the context menu.
A text editor opens. Write or edit an existing comment.
Save the changes and close the editor.
You can also use the text pane in the lower part of the Code Manager (see
“Editing Text” on page 43) to create or edit a comment.
Writing Comments For Coded Segments
If you notice something interesting while coding and you want to write it
down, use the quotation comment field for it.
ATLAS.ti 7.1 USER MANUAL
THE DATA LEVEL - BASIC FUNCTIONS
196
Right click on the highlighted quotation and select the option EDIT COMMENT
from the context menu.
An editor pops up. Write a comment on the selected data segment.
Save your comment by clicking on the ACCEPT button and close the editor.
Figure 173: Drag & Drop coding
Quotation comments are visible in the bar in the margin area and by the tilde
(~) sign in front of the quotation name in the quotations list.
Setting Code Colors
If you want to color your codes, select a code in the Code Manager and click
on the rainbow colored circle in the tool bar.
To make code colors visible in the margin, right click on a white space in the
margin area and select the option USE OBJECT COLORS.
In order to still be able see which code label belongs to which quotation bar, a
small bar colored in the same color as the quotation bar is shown in front of the
code label. The code label shows the user-defined color.
Coding PDF Documents
PDF documents allow for various ways of coding. Basically, there are no
restrictions, you can code any area within the document. If it is text, you code
the characters of the text. If the PDF file contains an image, then ATLAS.ti
automatically switched to image mode and you code a rectangular area within
the PDF file. Below you find a number of screen shots demonstrating the
various options.
Coding As Usual
Just highlight a section of text as you do in other text documents.
The difference is that you can set a selection color (see PDF preferences) and
that a PDF quotation has a “handle” on the top left and bottom right that you
can use to easily modify the size of the quotation (see image below)
ATLAS.ti 7.1 USER MANUAL
THE DATA LEVEL - BASIC FUNCTIONS
197
Figure 174: Coding a text segment in a PDF primary document
Coding Embedded Images
Select a rectangular area of your choice and use the handle at each corner to
scale to the appropriate size.
Figure 175: Coding an embedded image within a PDF document
Coding Columns Of Text
As usual, just highlight a section of text within a column:
ATLAS.ti 7.1 USER MANUAL
THE DATA LEVEL - BASIC FUNCTIONS
198
Figure 176: Coding text within a column of a PDF document
Coding Image Documents
Load an image document and select a rectangular area. Proceed to code it as
has been described for text segments.
Load an image document (e.g. P8 or P9), select a rectangular area, right-click
inside the rectangle, and select CODING / ENTER CODE NAMES (S) from the
context menu. Enter a code name.
Figure 177: Coded image segment
To write a comment, right-click on the rectangle and select the option EDIT
COMMENT. An editor opens.
Write something about your personal association with the image. Press
CTRL+S or click on the check-mark to save the comment. Close the editor.
ATLAS.ti 7.1 USER MANUAL
THE DATA LEVEL - BASIC FUNCTIONS
199
Figure 178: Writing a comment for an image quotation
The quotation number and comment bar are optional display features. They
can be turned and off via the context menu.
The look of the quotation bar in the margin area changes if a quotation has
been commented. This applies to all media types.
Coding Audio And Video Documents
To code a video segment, move your mouse pointer on top of the audio
wave and mark a section by clicking on the left mouse button where you
want it to start. Then drag the cursor to the end position.
Figure 179: Selecting a
video segment
Figure 180: Playing the current video selection
Right-click inside the selection and select CODING / ENTER CODE NAME(S)), or use
the coding buttons from the tool bar.
For further detail on how to work with audio and quotations, see “Creating
and Working with Multimedia Quotations“ on page 174.
ATLAS.ti 7.1 USER MANUAL
THE DATA LEVEL - BASIC FUNCTIONS
200
Describing Multimedia Quotations To Improve Output
The name of an audio or video quotation is its data file name. If you want to
add further information, you have two options: renaming the quotations and
adding a comment.
In the process of creating video quotations, rename them so they can serve as
titles for your video segments. To do so, right click on the quotation name in
the Quotation Manager and select the RENAME option.
If 30 characters are not enough for quotation names, you can extend the
number:
From the main menu, select TOOLS / PREFERENCES / GENERAL PREFERENCES / GENERAL.
At the bottom right, you will find the option: LIST NAME SIZE FOR QUOTES.
Increase it to the desired number of characters; 80 characters are probably
enough for short titles.
This allows you to create a meaningful text output of coded audio and video
segments. To create such an output, select a code in the Code Manager.
Select the option OUTPUT/ QUOTATION LIST FOR SELECTED CODE(S).
The output will show an overview of all the titles you have created for your
video (or audio) segments. Plus, it provides the position within the audio or
video file.
Making Use Of Quotation Comments
In addition to using quotation names for titles, you can add a description for
each video quotation in the comment field. When you output quotations and
there is at least one comment, ATLAS.ti asks you whether comments should be
included in the output. As above, you can use the Quotation List output option
from the CODES / OUTPUT menu.
Coding Google Earth Documents
Coding Google Earth quotations is similar to coding audio or video quotations.
Open the Quotation Manager.
To make it a bit easier to select a quotation, set a filter for the currently
loaded Google Earth document: QUOTATIONS / FILTER / SELECTED PD.
Open the Code Manager and drag and drop a code from the Code Manager
onto the quotation in the Quotation Manager (or vice versa). You can also
ATLAS.ti 7.1 USER MANUAL
THE DATA LEVEL - BASIC FUNCTIONS
201
right click on the quotation in the Quotation Manager and select other
coding options from the context menu.
When applying a code, the quotation count behind the code name increases by
one. This is all you can see, as there is no margin area for Google Earth
documents.
Reviewing Google Earth Quotations
You can review video quotations via the Quotation Manager, or by double
clicking on a code that contains GE quotations in the Code Manager, or via the
Places pane in the GE editor window.
Unlinking Codes
Unlinking a code from a GE quotation currently only works via a network view.
Select a GE quotation in the Quotation Manager and click on the Network
View button in the tool bar, or right click and select Open Network View
Proceed with unlinking as explained in the chapter on the Network View
function (see page 307).
Describing GE Quotations To Improve Outputs
Proceed as explained for audio- and video quotations (see “Describing
Multimedia quotations to improve output“ on page 200).
More Coding-Related Functions
This section describes some additional coding-related "house-keeping"
functions, such as creating free codes, importing lists of codes, and renaming
and removing codes.
Free Codes
You can create codes that have not (yet) been used for coding or creating
networks. Such codes are called “free” codes.
Why Create Free Codes?
• To prepare a stock of predefined codes in the framework of a given theory.
This is especially useful in the context of team work when creating a base
project.
ATLAS.ti 7.1 USER MANUAL
THE DATA LEVEL - BASIC FUNCTIONS
202
• To code in a "top-down" (or deductive) way with all necessary concepts
already at hand. This complements the "bottom-up" (or inductive) open
coding stage in which concepts emerge from the data.
• To create codes that come to mind during normal coding work and that
cannot be applied to the current segment but will be useful later.
Creating A Free Code
From the main menu choose CODES / ENTER CODE NAME(S) or click the Create
Code button in the Code Manager.
A prompter opens as in Open Coding. Enter one or more code names and
click OK.
Such a free code shows the name suffix "{0-0}": no quotations, no linked
codes.
Importing Codes
Creating Free Codes Via The Batch Method
To create a large number of free codes, this works best using the Memo
Manager.
Open the Memo Manager (MEMOS / MEMO MANAGER)
From the Memo Manager's menu, select MEMOS / CREATE FREE MEMO.
As title enter “code list”
Add your list of code words, one per line.
Save the memo (MEMO / SAVE or CTRL+S) and close it.
Highlight the memo and select the option MISCELLANEOUS / CREATE CODES FROM
SELECTED MEMO.
Transferring Codes From Other Projects
If you want to import an already existing list of codes from another HU (that
might serve as a repository for codes), use the XML Export/Import function for
codes (see “Exporting and Importing Codes in XML” on page 413). This option
has the advantage that already existing code definitions (i. e., code comments
and colors) are transferred as well. If only a subset of codes is to be transferred
from one project to another, set a code filter in the exporting HU.
How to transfer codes:
Select CODES / IMPORT/EXPORT / EXPORT CODES (XML).
Select the option Send Output to: File.
A file dialog window opens. Select a folder, enter a file name and save the
file.
Open a HU into which the codes will be imported.
For this HU, select CODES / IMPORT/EXPORT / IMPORT CODES (XML).
ATLAS.ti 7.1 USER MANUAL
THE DATA LEVEL - BASIC FUNCTIONS
203
A file dialog window opens. Select the XML file that you just exported and
click Open.
The code list is imported. Check the Code Manager to see whether the
procedure was completed successfully and according to your expectations.
Avoiding Name Clashes When Importing Code Lists
If a code with the same name already exists in the HU, the imported code
name is prefixed with three exclamation marks. Another attempt to load a code
with a conflicting name will be ignored.
Note to ATLAS.ti 4.x users: The old Import Codes function still exists. In
case you have some previously created code lists saved as *.cod files that
you wish to import, select : CODES / IMPORT/EXPORT / IMPORT CODE LIST. If you
want to generate this format, create a simple text file and change the .txt
file extension to .cod.
Renaming And Deleting A Code
Renaming or
deleting a code
has global effects.
Renaming and deleting codes are procedures that seem trivial, but
understanding the "scope" of these operations can be a problem for new
users. For both operations you must understand, that there is only ONE code
object, e. g., "Happiness" in a given HU, even if you applied (associated with
quotations, other codes, etc.) this code many times. With the margin area
switched on, you may see the code appear many times while scrolling through
your document. In fact you are seeing “links” between a quotation represented
by a bar and the code, represented by its name, icon, etc.
Renaming or removing a code in the margin besides a text on real paper using
an eraser and a pencil affects only one specific occurrence of a code; all other
occurrences of the same code are untouched. The effect of the operation is
local.
With ATLAS.ti you can do the same. However, you can do additional things
that are not possible using traditional paper and pencil techniques.
By renaming or removing a code from an HU, you are affecting every
occurrence of the code throughout the entire HU. The effect is global.
Renaming the code will instantly change all the code “links” in the margin to
reflect the new name. Deleting it will remove all occurrences in the margin (and
from all other contexts in which it was engaged, like network views, families,
etc.).
To Rename A Code
Select a code in a Network View or in one of the following places: the code
drop-down list, the Code Manager, the HU Explorer or the Code Forest.
When selecting a code from a list, you can use the CODES / RENAME function
from the main menu. The Rename option is also available from the context
menu.
ATLAS.ti 7.1 USER MANUAL
THE DATA LEVEL - BASIC FUNCTIONS
204
Enter the new name and click OK.
Renaming or
replacing?
Another method to rename a code is to use In-Place-Editing. This option is
available in the Code Manager, the HU Explorer, and the margin area.
Renaming a code in-place in the margin area has two different effects. The
code can be renamed globally – affecting all occurrences - or replaced by
another code locally. This preference can be set via the Margin tab of General
Preferences dialog. (TOOLS / PREFERENCES / GENERAL PREFERENCES, TAB: MARGIN / INPLACE-ACTION).
The default option is “local replace”. If you leave it this way, you can use
the rename option of the context menu, e.g. in the margin area, to rename
a code globally. If you want to rename a code locally, use the in-placeaction.
Deleting Codes
Deleting a code removes the code from the entire HU. All references that
involve this code are removed. It also disappears from Network Views and
families that contained this code.
If you only want to remove a code from a specific quotation, you should
“unlink” the code instead (see below).
To Delete A Code
Select a code in the Code Manager, a Network View, the HU Explorer or the
Code Forest.
In the Code Manager, HU Explorer or Code Forest use the DELETE function
from the menu. In a Network View, right click on a code.
If the code has been used (e. g., is assigned to quotations, connected to other
codes, part of a super code, etc.), you are asked for confirmation before the
deletion process continues.
Furthermore, if quotations coded with this code are not used in any other
context, you are asked whether these quotations should be removed as well.
There is no “undo” function to get deleted codes back! If you are unsure
about the effects of an operation, save and/or make a backup copy of your
Hermeneutic Unit first!
Unlinking Codes
This option is the reverse function of coding. It removes the links between
codes and quotations. Unlike the delete function, neither codes nor quotations
are removed; only the association between the code and the quotation is
removed.
ATLAS.ti 7.1 USER MANUAL
THE DATA LEVEL - BASIC FUNCTIONS
205
Two methods are described in the following sections.
To Unlink Several Codes From A Quotation
This method is used to remove a number of codes linked to a specific
quotation.
Open the context menu of the desired quotation.
Choose UNLINK CODES from the context menu.
From the list of all codes connected to this quotation displayed in a pop-up
window select the codes to be unlinked and click OK.
In the margin area you can see the immediate effect of this operation: the
unlinked codes disappear.
To Unlink A Single Code From A Quotation
This method is a very direct manipulation of the association between a code
and a specific quotation using the interactive margin areas.
Switch on the margin area display.
Right-click a code in the margin area.
Choose UNLINK from the context menu. The code disappears from the margin
area. It does not disappear from other places in the margin where it has been
used.
Remember, the DELETE option removes the code for good, including all
associations with quotations, codes, memos, etc. - If you want to remove a
code from a Network View, but do not want to actually delete it, select the
option REMOVE FROM VIEW from the context menu.
Merging Codes
When developing a coding scheme, it may happen in the course of the analysis
that two or more codes essentially mean the same thing. One cause could be
the import of code lists with different names but similar meanings.
Clean up
synonymous
codes by merging
them.
ATLAS.ti offers a procedure to merge synonymous codes into one resulting
“target” code. This target code replaces the merged codes and "inherits" all of
their references, i. e., quotations, links to other codes or memos, and their
comments.
There are two ways to merge codes: a list-based method, and one that works
from within the Network Editor.
MERGING CODES USING THE LIST METHOD
Save the HU
before merging
codes.
In the Code Manager select the “target” code into which a number of other
codes are to be merged.
ATLAS.ti 7.1 USER MANUAL
THE DATA LEVEL - BASIC FUNCTIONS
206
Right-click and select MERGE CODES from the context menu (or select CODES /
MERGE CODES from the menu).
In the multiple choice window, select the codes to be merged into the
selected code.
If the code had a comment already, then information about when and what
was merged into the target code is entered into the comment field of the target
code including the comment(s) of the merged code(s).
MERGING CODES IN A NETWORK VIEW
Here the procedure works the other way around. You first select the codes that
you want to merge into another code, and then you select the target code.
Open an existing Network View.
Select the code nodes that you want to merge (hold down the Ctrl key to
select multiple code nodes)
From the network view's menu, select Nodes/Merge Codes. Some red lines
appear starting at the selected code node, ending at your mouse pointer.
Mouse the mouse pointer on top of the target code node and left click. This
starts the merging procedure. The codes you selected first disappear and
their quotations are added to the target code.
The codes merged into the resulting target node are deleted from the
Hermeneutic Unit's code database. Since merging cannot be reversed easily,
and since this procedure might affect many aspects, save the Hermeneutic
Unit before doing the merge. If you are not satisfied with the merge result,
you can reload the previously saved HU. Another more laborious way to
revert to the previous state is to split the target code.
Suggestions For Structuring The List Of Codes
A frequent question is how to add a structure to the otherwise flat code list in
ATLAS.ti.
Adding Structure Via The Order In The Code Manager
The easiest way to work with higher and lower order codes is to structure your
codes alphabetically in the Code Manager, e. g., according to the basic pattern
below:
category A_sub 1
category A_sub 2
category A_sub 3
ATLAS.ti 7.1 USER MANUAL
THE DATA LEVEL - BASIC FUNCTIONS
207
category B_sub 1
category B_sub 2
category B_sub 3
etc.
As a means to visualize the beginning of a category, you can enter a free code
that is not linked to any quotation, as shown below. Such a main category code
might initially be empty, but may proof to be quite handy during further coding
work. You may come across some data that fits the category but there is no
fitting subcode yet, or you are unsure where to put it. Then you can use the
main category code to collect these instances. Once a number of instances are
collected, you can review them and think some more about them. By reading
through or viewing/listening to a couple of examples it becomes often easier to
decide how to code it. You may decide to create a new subcode or decide that
an existing subcode fits after all.
CATEGORY A
category A_sub 1
category A_sub 2
category A_sub 3
CATEGORY B
category B_sub 1
category B_sub 2
category B_sub 3
A further possibility is to sort codes by numbers (or numbers and letters):
1 CATEGORY A
11_A_sub 1
12_A_sub 2
13_A_sub 3
2 CATEGORY B
21_B_sub 1
22_B_sub 2
23_B_sub 3
etc.
The sorting order is: (1) special characters (* + ' # - _ : . ; , etc.), (2)
numbers, and (3) letters. Therefore, it is NOT a good idea to use prefixes
like 1, 1.1. , 1.1.1 , 2, 2.1, 2.1.2 etc.. Such a numbering scheme will
necessarily wreak havoc with your intended sorting order (“10” will be
sorted before “2”). When using numerals , always use “01”, “02”, “03”,
or and so on for sorting to be on the safe side.
ATLAS.ti 7.1 USER MANUAL
THE DATA LEVEL - BASIC FUNCTIONS
208
The Quick Tour project, stage II, shows a structured code list achieved by using
alphabetically sorted prefixes. You can access this project in ATLAS.ti via the
HELP menu.
Figure 181: Example of a structured code list
All terms preceding a colon (:) indicate the main category name; the terms
following the underscore or colon constitute subcodes. Other projects may
require additional sublevels. But don't overdo it!
As main category code and subcode names may contain more than one word,
an empty space is not sufficient to separate the two levels of coding. Therefore
it is best to use one the of special characters that you find on your keyboard to
visually separate levels of coding.
Retrieving Coded Quotations
There are different ways to retrieve coded segments: Quotations for a single
code or a combination of codes, quotations displayed in the context of their
primary documents, or quotations sent to a report. The simplest “retrieval” is
by activating a code in the Code Manager with a double-click.
ATLAS.ti 7.1 USER MANUAL
THE DATA LEVEL - BASIC FUNCTIONS
209
Activating A Quotation For A Code
Quotations are
activated
differently in
context,
depending on the
media type.
A straightforward method is to display quotations in context: textual and
graphical quotations will be selected in the document when activated. A
multimedia quotation begins to play when selected.
When you select a code in the code drop-down list or double-click an item in
the Code Manager, the following happens--depending on how many
quotations are coded to that code:
IF THERE IS ONLY ONE QUOTATION
If there is only one quotation for the selected code, it will be activated
immediately.
IF THERE ARE MORE QUOTATIONS
Use the next and previous button in the Code Manager to browse through all
quotations for a selected code.
If more than one quotation is associated with the code, they are offered in a
pop-up list. Selecting one of the quotations activates and displays it in context.
Figure 182: Simple retrieval
Create A Report For Coded Quotations
As an alternative to the contextual display of quotations, you can get different
reports of the quotations for a selected code. Reports are displayed in a text
editor and can be printed or saved.
To create a quotation report:
Select a code, for instance in the Code Manager.
From the main menu, select CODES / OUTPUT / QUOTATIONS FOR SELECTED CODE.
When selecting a code in the Code Manager choose OUTPUT / QUOTATIONS FOR
SELECTED CODE. Select the option QUOTATION LIST if you only want a list of the
quotations’ names. This report is useful for non-textual data where the
quotations do not contain textual content.
ATLAS.ti 7.1 USER MANUAL
THE DATA LEVEL - BASIC FUNCTIONS
210
If a comment has been written for any of the quotations, you will be asked
whether you also want to include the comments in the report.
Next, you have the option to send the report to an editor, printer, save it to
disk (option: File), or to save it and run the file in the standard RTF
application - usually Word or Wordpad – (option: File & Run).
Figure 183: Output options
For more report options, check out the XML Explorer, more specifically the
section “Working with Style Sheets“ on page 399.
Reports On Quotations For Code Combinations
Use the Query
Tool for complex
retrievals of
quotations.
To retrieve quotations or generate reports for combinations of codes use the
Query Tool. For more information see “Query Tool“ on page 258.
Other Places To Activate Quotations
Quotations for a code can be activated from the margin area and any browser
displaying codes:
The Margin Area displays codes (and other objects) associated with quotations.
Clicking on a code in the margin area selects the associated quotation in the
primary document pane.
By activating objects in the HU Explorer (see “The HU Explorer” on page 368)
quotations are displayed in context similar to the object manager.
The Network Editor (see “The Network Editor ” on page 312) also offers access
to associated quotations via a node’s context menu.
In the Query Tool (page 270) you can activate quotations in the result pane of
the query tool window. Similarly you can activate quotations in the Cooccurence Tools that result from a co-occurence query (page 291).
ATLAS.ti 7.1 USER MANUAL
THE DATA LEVEL - BASIC FUNCTIONS
211
Text Search & Auto Coding
The Text Search Tool is used to search within primary texts for the occurrence
of specific text strings that match a designated string or pattern.
The Text Search Tool offers three distinct methods entitled Standard Search,
Category Search and GREP Search to scan primary texts for specified text
patterns. The functionality of the Text Search Tool is also fully integrated into
the Auto-Coding Tool (see “The Auto-Coding Tool” on page 219).
The search mode is automatically determined by the kind of search string
entered. Regular Expression search (GREP), however, must be explicitly
selected. If you need to know what GREP stands for and what GREP searches
are, a detailed explanation is provided at “GREP Search” on page 215.
The Text Search Tool
To Open The Text Search Tool
Load a primary text.
Click this button
to activate text
search
Short-cut: Ctrl-F
Figure 184: Text search tool
Either click the text search button in the PD toolbar, select EDIT / SEARCH from
the main menu, or use the key combination CTRL-F.
If the document is in Edit mode, Ctrl-F opens a Windows standard text
search. Use the menu option or the search button instead.
Initially, the status bar displays the current search mode (in the figure above:
Standard Search Mode). During a search activity, this is the place where you
should look for warnings and messages.
Not all options are available for every type of search. For instance, backward
and case sensitive searches are not available for Category Search (see below).
ATLAS.ti 7.1 USER MANUAL
THE DATA LEVEL - BASIC FUNCTIONS
212
A text search always starts from the current position of the text cursor in the
currently selected primary text. When the end of this document is reached, you
are asked if the search should continue through the rest of the primary text
documents.
Standard Search Mode
Use the standard search mode when you want to find exact, specified strings of
characters. Word boundaries are not recognized in this mode. Hence, searching
for "the" would also find instances like "bother," "there," and "theater."
Searches that recognize word boundaries are available with the Category
Search or by using appropriate GREP patterns.
TO START A STANDARD SEARCH
Open the Text Search tool.
Enter a string into the entry field. The search string should contain the special
“pipe” character "|" as this initiates the Category Search.
Uncheck GREP mode.
Set Case Sensitive as needed.
Start the search by clicking the Next or Previous button.
Two search options are available in standard search mode to control the search.
CASE SENSITIVE
Check the CASE SENSITIVE box if you want characters to match the searched text
exactly. If CASE SENSITIVE is selected, you will not find "Love" when you search
for "love".
GREP MODE
Checking the GREP box enables GREP mode. If unchecked, the Search Tool is
in "standard" mode. You may use the standard wildcard * character even
without GREP. More discussion on GREP searches is provided at “GREP
Search” on page 215.
Category Search
The Category Search method combines two powerful techniques.
Parallel search is a sophisticated method that handles textual variations. You
may specify a number of patterns that scan the text simultaneously. Secondly,
search expressions (“search swarms”) can be stored as a search category and
later reused. Besides being short and handy, a further advantage of categories
is that their contents can be modified later without changing a single character
in other expressions using this category.
ATLAS.ti 7.1 USER MANUAL
THE DATA LEVEL - BASIC FUNCTIONS
Categories are
reusable, named
search swarms.
213
Categories allow abstraction from the search string itself and permit easy re-use
of complex expressions in later searches. With the simultaneous use of
wildcards, a search request using a search swarm might look as follows:
*caus*|why|*efore|since.
The individual elements of the search swarm are delimited by the vertical bar
character “|”. The bar can be read as a (Boolean) "OR." The search defined
above yields text passages including any of the following strings: "because,"
"causes," "causation," "before," and "therefore," "why," and "since."
DEFINING CATEGORIES
Search swarms that have proven useful can be assigned names (search
categories) in ATLAS.ti to facilitate re-use. For example,
CAUSE := *caus* | why | *efore | since
defines CAUSE as a placeholder for the original search swarm.
Therefore, instead of retyping lengthy search strings, the user may later simply
type the search category "$CAUSE" into the entry field. The dollar sign is a
special character that indicates that the content of the CAUSE category is to be
used for the search and not the string "CAUSE" itself. Therefore do not use the
$ sign to start a category name.
Categories can be mixed with ordinary strings to build complex search requests
such as: until|$CAUSE|when
Do not mistake search categories for codes. Search categories are shortcuts
for complex search procedures, while codes are concepts representing some
level of interpretation. However, when using search categories extensively
and building hierarchies of search categories, such a "para-taxonomy”
might stimulate the construction of a matching network of codes.
Create hierarchies
of search swarms
by embedding
existing
categories.
HIERARCHIES OF SEARCH CATEGORIES
As categories may be elements of other categories, recursive search trees of
arbitrary depth may be defined.
$EMOTION
Categories
$POSEMO
$NEGEMO
$LOVE
$ANGER
love|loving|beloved|lover|
Search Swarm
Figure 185: Hierarchy of search categories
The definition for the taxonomy above is as follows:
EMOTION := $POSEMO|$NEGEMO
ATLAS.ti 7.1 USER MANUAL
THE DATA LEVEL - BASIC FUNCTIONS
214
POSEMO := $LOVE|etc.
NEGEMO := $ANGER
LOVE = love|loving|beloved|lover
Such category structures are efficient tools to exploit the literal properties of the
textual materials you use in your research. Of course, this tool does not find
relevant information beyond the characters specified in the search.
HOW TO USE CATEGORY SEARCH
Open the Text Search tool.
Figure 186: Selecting an existing search category in the Text
Search tool
Enter a new search swarm or select an existing category from the library of
search swarms by clicking on the drop down button at the right of the entry
field.
Click Next.
List of example
search categories
in the standard
search library.
When using Category Search, some of the controls become disabled. Category
Search cannot be combined with GREP mode, can never be case sensitive, and
the Previous button cannot be used.
TO DEFINE A NEW CATEGORY
Open the Text Search tool.
Enter a new definition into the entry field using the following syntax:
CATEGORY NAME:= <string or $category>|<string or
$category>| etc.
When defining a new category do not prefix its name with a “$”.
As soon as you press the NEXT button, a new category is created and a search
for the first occurrence starts. This category is now available to you for the
current work session. If the new category should be available in the future, you
need to save it to the search library.
ATLAS.ti 7.1 USER MANUAL
THE DATA LEVEL - BASIC FUNCTIONS
215
Click on the Options button and select SAVE CATEGORIES.
In case you do not want to create multiple search libraries, add your new
category to the existing search library with the name: srchbib.skt and save it
at the suggested location in the ATLASti folder.
MANAGING SEARCH CATEGORIES
Search categories are managed in search libraries.
Create search
libraries for
different
languages,
different topics,
different projects,
etc.
On startup, ATLAS.ti loads a default library of search categories named
srchbib.skt. You can update this library by adding new categories and removing
or modifying existing categories. It is also possible to create completely new
search libraries that better fit your requirements (different languages, domains,
etc.).
To manage categories, three options are available:
Click the OPTIONS button in the Text Search window for this menu:
Figure 187: Accessing the search library in the
text search tool
Load Categories opens a file dialog window showing existing search library files
like searchbib.skt or srchbib.skt. If you select a library in the file dialog window,
the categories from that library are added to the currently loaded categories.
Save Categories stores the currently loaded and newly created search
categories in the default library file (srchbib.skt) or a new file. If you choose a
new name, be sure to give the file the extension SKT, as in " dutch.skt".
To clear the internal database of search categories before loading new ones,
use the option Delete Category. This opens a multiple selection list window.
Choose one or more categories to be removed from the internal database of
search categories. You can use the standard Windows techniques for multiple
selections using the Ctrl, Alt, or Shift keys in combination with the left mouse
button.
GREP Search
GREP searches
are very flexible.
GREP is a well-known search tool in the UNIX world. The original GREP tool
printed each line containing the search pattern, hence the acronym GREP
(“Globally look for Regular Expression and Print).
Regular
Expressions
efficiently exploit
the syntactical
properties of the
technical device
called "text."
In ATLAS.ti, the results of a GREP search are not printed line-by-line; rather,
the text matching the search pattern is highlighted on the screen.
ATLAS.ti 7.1 USER MANUAL
THE DATA LEVEL - BASIC FUNCTIONS
216
The core of a GREP search is the inclusion of special characters in the search
string that control the matching process. GREP finds instances in your data that
match certain patterns.
The ATLAS.ti GREP search offers a subset of the Regular Expression language
used in sophisticated text search systems. It is available in all operations using
text matches: The main window, in comments, and memos, text search, the
Object Crawler, and in the Auto Coding tool.
Supported GREP Expressions
ATLAS.ti' uses the engine created by Vassili Bykov to process GREP based text
search queries.
For detailed information about regular expressions see
http://en.wikipedia.org/wiki/Regular_expression
GREP Expression
Description
^
Matches an empty string at the beginning of a line.
$
Matches an empty string at the end of a line.
.
Matches any character except a new line.
+
Matches at least one occurrence of the preceding expression
or character.
*
Matches the preceding element zero or more times. For
example, ab*c matches "ac", "abc", "abbbc", etc.
?
Matches the preceding element zero or one time. For
example, ba? matches "b" or "ba". []
[]
Matches a range or set of characters: [a-z] or [0-9] or
[aeiou]. For example: [0-9] finds all numeric characters,
while [^0-9] finds all non-numeric character
\b
Matches an empty string at a word boundary
\B
Matches an empty string not a word boundary
\<
Matches an empty string at the beginning of a word
\>
Matches an empty string at the end of a word
\
The escape character disables the special GREP functionality
of the following character. For example: \[ matches an
opening bracket.
|
OR. Enclose ORed expressions with parentheses if OR should
be restricted to certain sequences of characters or expressions
Example
The expression man|woman matches "man" and "woman".
You could also use (|wo)man to the same effect. H(a|e)llo matches
"Hello" and "Hallo". H(a|e)+llo matches “Haaaaaallo” as well as
“Heeeeeaaaaeaeaeaeaello.”
ATLAS.ti 7.1 USER MANUAL
THE DATA LEVEL - BASIC FUNCTIONS
217
And how about the (angry|lazy|stupid) (man|woman) (walk|
runn|play|fight)ing with the gr(a|e)y dog – get the idea?
GREP Expression
Description
\d
Matches any digit (equivalent to [0-9])
\D
Matches anything but a digit
\s
Matches a white-space character
\S
Matches anything but a white-space character
\w
Matches any word constituent character
\W
any character but a word constituent
These escapes are also allowed in character classes: [\w+-] means “any
character that is either a word constituent, or a plus, or a minus.”
Examples
\<\w+\> matches any whole word
\<[[:alpha:]]+\> matches whole words containing only alphanumeric
characters.
Character classes can also include the following elements:
[:alnum:]
Any alphanumeric, i.e., a word constituent, character
[:alpha:]
Any alphabetic character
[:cntrl:]
Any control character. In this version, it means any character
whose ASCII code is < 32.
[:digit:]
Any decimal digit
[:graph:]
Any graphical character. In this version, this mean any
character with the code >= 32.
[:lower:]
Any lowercase character
[:punct:]
any punctuation character
[:space:]
Any white-space character
[:upper:]
Any uppercase character
[:xdigit:]
Any hexadecimal character
Note that these elements are components of the character classes, i. e. they
have to be enclosed in an extra set of square brackets to form a valid
regular expression. A non-empty string of digits or arbitrary length would
be represented as [[:digit:]]+
ATLAS.ti 7.1 USER MANUAL
THE DATA LEVEL - BASIC FUNCTIONS
218
Examples Of GREP Searches
In the following, a few search examples are presented showing the matching
GREP expression in the column on the right.
Examples
Find text (of arbitrary length) enclosed within brackets.
Note that the brackets have to be escaped with "\" as
they are themselves control characters
GREP expression
\[.*\]
Find all years between 2001 and 2004:
200[1-4]
Find all numbers with 2 digits at the end of a line or
paragraph:
\d\d$
Find all "Meyer"s - spelled in four different ways:
M[ae][iy]er
Find all lines (paragraphs) starting with one arbitrary
letter followed by a colon.
^.[:]
If you search for a "d" following the colon you will
have to use the Escape character: ^.\:d Otherwise, the
letter “d” would be interpreted as a digit.
To Start A GREP Search
Open the Text Search tool.
Enter a search pattern (Figure 337shows an example).
The search
expression
entered in the
text search
window to the
right finds all 3digit numbers
with the last digit
being a 7, 8, or 9.
This can be a
useful search to
find certain social
security numbers
or other personal
identification
numbers.
Check the Use GREP box.
Figure 188: Search expression dialog
Click on the Previous or Next button.
The Case Sensitive option may be used in combination with a GREP search.
ATLAS.ti 7.1 USER MANUAL
THE DATA LEVEL - BASIC FUNCTIONS
219
The Auto-Coding Tool
The Auto-Coding tool finds text passages, selects a specified amount of text (e.
g., the exact match, or spread to the surrounding word, sentence, or
paragraph), and then codes the passages with a previously selected code.
Auto-coding is useful when coding structural information like speaker turns in
group interviews, or other sections that can easily be identified by a text search.
Auto-coding allows you to quickly collect ideas that belong to a certain concept
on the basis of words or patterns found in the text.
Concepts
The Auto-Coding Dialog
Auto-Coding =
Text Search +
Automatic
Segmentation +
Coding
The Auto-Coding tool combines the Text Search tool with an automatic
segmentation and code assignment mechanism.
To open the Auto-Coding Dialog, select CODES / CODING / ~AUTO CODING from
the main menu.
Figure 189: Auto Coding Dialog window
Note the NEW CODE button, which allows you to create codes on the fly for the
auto-coding procedure.
The New Code
button allows you
to create codes
on the fly.
Based on the GREP search expression shown in the above figure, all
occurrences of string Speaker 1: located at the beginning of a paragraph in all
textual Pds are found. Next, the whole speaker unit (which could contain one
ore more paragraphs) will be selected before a quotation is created and the
code “Speaker 1” will be assigned.
ATLAS.ti 7.1 USER MANUAL
THE DATA LEVEL - BASIC FUNCTIONS
220
The option CONFIRM ALWAYS is deactivated as the search is unambiguous and is
likely to yield the desired results.
Search Expression
The top part of the Auto-Coding Dialog window resembles the Text Search
tool (see “The Text Search Tool” on page 211). Search expressions can be
entered or search categories can be selected. The search mode can also be set
in a similar way as for the Text Search tool.
Scope Of Search
Scope of Search can be all textual PDs, the selected PD only, or it may be
restricted to a set of texts from a PD family. When you choose “All current
PDs,” the search starts at the beginning of the currently selected primary text.
Figure 190: Selecting the scope of search for auto coding
If "Selected PD" is chosen, the auto-coding process starts at the current
position of the text cursor.
Segment Size
When a matched string is found, the size of the segment to be coded can be
specified as follows:
• The Exact Match only
• The Word surrounding the matched string
• The Sentence surrounding the matched string
• The matched string expanded to paragraph boundaries (Single Hard Return).
• The matched string expanded to one or more paragraphs up to the next
blank lines (Multiple Hard Returns). This option is useful if you have
information that should be regarded as one unit, but is separated in multiple
paragraphs.
• All Text of the PD containing a match.
When transcribing, enter a blank line between speaker turns if you are
going to to use the auto-coding tool for coding speaker units.
ATLAS.ti 7.1 USER MANUAL
THE DATA LEVEL - BASIC FUNCTIONS
221
Test Your Search Expression
Test search
patterns with the
Text Search tool
first.
The Auto-Coding tool creates a new quotation for every matched text passage
that is not yet a quotation. A potentially large number of inadequate
quotations could be produced by an imprecise search.
For this reason, you should always test a search pattern by using the Text
Search tool first (see “The Text Search Tool” on page 211) or select the
Confirm option and click Skip. This test will give an indication if the final search
will yield meaningful results. The advantage of testing with the Text Search tool
is that no quotations are created.
Another option is to auto code into a new code. If you later find out that the
search did not yield good results, you can delete the code and all created
quotations with two mouse clicks and try a different search.
How To Auto-Code
Auto-coding can be fully automatic or semi-automatic. The sections below will
clarify the difference and will show the advantages of each method.
Fully Automatic Coding
Select the PD you want to code using the auto-coding procedure. If you only
want to auto-code the current text, load the PD in question. If you want to
auto-code all texts, load the first PD and position the cursor at the beginning
of the document.
To open the Auto-Coding tool, choose CODES / CODING / ~ AUTO CODING from
the main menu.
If no code is selected, select a code from the drop-down list at the top of the
Auto-Coding tool.
Enter a new search string or choose an existing search category.
Specify the search scope, e. g. "Selected PD"
Specify the segment size.
Start the process by clicking START.
Semi-Automatic Coding
As it is not always desirable to let the program decide whether or not to code a
given text passage, you can control the process by checking "Confirm always."
Specific confirmation from the user on each new code will then be requested.
An example for the usage of semi-automatic coding would be to code for the
concept “distress.” Indications that a person might be distressed could be
words like nervousness, tension, unease, edginess, etc. In order to capture this,
you would do the following:
ATLAS.ti 7.1 USER MANUAL
THE DATA LEVEL - BASIC FUNCTIONS
222
Create a code with the name Distress.
Open the Auto-Coding tool.
Select the appropriate code.
In the search entry field define a new category by entering:
DISTRESS:= nervous|tens|uneas|edg|....etc.
The OR operator in this example is marked in red for visibility only. The
search term in ATLAS.ti does not show colors or formatting.
Depending on your data set, select a suitable scope of search (current PD, all
PDs, or a specific PD family).
Select the segment size to be coded, e. g. sentence.
Check Confirm Always and click on the START button.
Every time the program finds a piece of text that matches your search
category, it stops the search and highlights the text it has found. You can
then read the surrounding context and decide whether the text passage
really has something to do with distress. If it does, click CODE IT, otherwise
click SKIP IT. The program continues to search for the next match.
You can uncheck the CONFIRM ALWAYS box at any time and let ATLAS.ti scan
through the rest of your texts without prompting for further confirmation.
Brushing-up Results After Auto-Coding
Since no automatic search can guarantee 100% meaningful results, the
quotations created and assigned to the selected code during auto-coding
should be screened and modified if needed.
CHECKING AND MODIFYING QUOTATIONS
Close the Auto-Coding tool.
Open both the Code Manager and the Quotation Manager.
Select the code you just used for auto-coding.
In the Quotation Manager, set the quotation filter to "Selected Code".
Click the Created column header to find all recently created quotations at the
top of the list.
Browse through the quotations assigned to this code by using the NEXT and
PREVIOUS buttons in the Quotation Manager.
Modify or delete misaligned or inappropriate quotations. See “Modifying
Textual and PDF Quotations” on page 171.
ATLAS.ti 7.1 USER MANUAL
THE DATA LEVEL - BASIC FUNCTIONS
223
Preparing Documents Optimized For Auto-Coding
The following instructions are useful for preparing transcriptions of focus group
sessions, questionnaires, or interviews. Such data usually contains different
speakers’ sections. The hints given here also apply for other documents that
include sections you wish to identify for auto-coding.
It would be tedious to code speaker or section turns manually. Two things are
needed: A good “marker” for which to search and, once the marker is found, a
reliable identification of the unit (sentence, paragraph) to be coded.
Insert easily identifiable markup in the text to let the auto-coding pattern
matcher do this for you. For proper markup, a little knowledge regarding the
auto-coder’s search procedure is helpful. In combination with a few formatting
rules, documents can be created that can readily support auto-coding quite a
bit.
For the auto-coding tool to yield useful results, it is necessary to properly
structure the source text using unique identifiers.
Simple examples are:
• P: or <Peter>for a respondent with the name Peter
• 07-01-11letter for a letter written on the first of July 2011.
The identifier should be used exclusively to mark passages in the text that
indeed relate to the person or object identified. The plain word Peter will likely
also occur elsewhere in the text (for instance, when another person is referring
to Peter). The markup "P:" or <Peter> however, is unlikely to occur elsewhere .
In order for the Auto-Coding tool to select a complete speaker section, a
section delimiter is needed. As discussed above, a speaker or section turn will
start with the speaker’s identifier markup. The end of a section is best marked
by an empty line. By doing this, you can still use single hard returns to segment
a speaker section into paragraphs.
When auto-coding such a document, you would choose MULTI HARD RETURNS for
extending the matched text.
Using <Peter> as the search pattern would then yield a quotation including
everything from <Peter> up to the empty line:
ATLAS.ti 7.1 USER MANUAL
THE DATA LEVEL - BASIC FUNCTIONS
224
Figure 191: Example transcript
ATLAS.ti 7.1 USER MANUAL
FAMILY LIFE
225
Family Life
Just as codes describe sets of quotations, families cluster Primary Documents,
Codes, and Memos. One important objective is to manage large amounts of
objects by classifying them into subsets, e. g., all theoretical codes, all PDs from
respondents of a certain age group or location, all memos related to a theme,
etc.
Purpose Of Creating And Working With Families
In the following, the role of families as variables, super families and for
controlling the HU merge procedure are introduced.
While families are used to classify a group of objects, the objects they classify
can be members of more than one family.
Unlike Network Views, which can contain objects of different types as nodes,
families can only contain one type of object. For example, a code can never be
a member of a memo family.
Partitioning objects into families reduces the number of "chunks" requiring the
researcher's attention. Families are often used for filtering (see “Sorting and
Filtering” on page 378), and when formulating queries in the Query Tool (see
“Creating a Query with the Query Tool” on page 267). The side panels in the
managers offer a convenient way to create them and to set them as local and
global filters (see “The Manager Side Panel “ on page 52.
Example: When conducting an interview study with respondents from various
backgrounds and locations, PD families can be created to classify the
respondents into:
• Female / Male
• Location A, Location B, Location C
• Age Group 1 (20-30), Age Group 2 (31-40), Age Group 3 (41-50)
• Blue-collar worker, White-collar worker, Management, etc.
Families make effective user-defined filters. For example, you can filter PDs to
only view female respondents.
In the Query Tool, PD families can be used to restrict the scope of the search.
For example, you can ask for all quotations coded by Code_A and Code_B that
occur in documents of white-collar female respondents from location B.
ATLAS.ti 7.1 USER MANUAL
FAMILY LIFE
226
The PD-Family table function provides a convenient way to import and export
variables (see below for a detailed explanation).
Code families can be used to loosely group codes that belong together. You
can use them to sort, filter and organize your codes in the Code Manager via
the side panel.
Other than in Network Views where specific relationships between codes need
to be defined, in code families it is not necessary to specify the ways in which
codes relate to each other.
Use memo families to sort, filter, and organize your memos.
Super Families
Super Families are combination of other families (including other Super
Families). You can build complex families incrementally from existing families
using a set of powerful Boolean operators. From a technical perspective Super
Families function just like Super Codes (see “Super Codes” on page 273). They
can either be created in the super family tool or in the side panels of Managers
(see “Creating Super Families as Global Filters“ on page 58.
Using Families When Merging Hermeneutic Units
A special application of families is used to specify the sets of objects to be
excluded in the process of merging Hermeneutic Units (see “Merging
Hermeneutic Units” on page 154).
Common Procedures
Although the handling of families and their members is identical, their usage
differs between types of families. In the following, the general aspects of and
procedures for working with families are described. Thereafter, a description of
specific characteristics of the different family types follows.
All procedures for displaying, editing, and creating families are found in the
menus of their object type (i. e., under the Documents, Codes, and Memos
menus).
Families can be created in both the Family Manager and the side panels of
the respective Managers (see “The Manager Side Panel “ on page 52. The
Family Manager offers a few more options than the side panel. The side
panels are however better integrated into the regular work-flow. Thus, for
daily regular activities you are likely to use the side panels, for more
selective operations the Family Managers.
ATLAS.ti 7.1 USER MANUAL
FAMILY LIFE
227
The Family Manager
Using the Family Manager you can create, edit, and delete families. You can
add and remove items (‘family members’), write comments concerning a
particular family, or set a family as filter.
Figure 192: Primary Document Family Manager
Family Managers and the procedures described in the following are the same
for all family types.
Components Of The Family Manager
The Family Manager’s main pane lists all families for the specific object type.
• The window displays the name, (member) size, author, and creation and
modification dates (not currently visible). The columns can be used to sort
the families according to these criteria by clicking the column header.
• The left list below the family list displays the “family members” already
assigned.
• The two buttons between the list panes are for assigning or removing items
from the selected family.
• The right list displays all items not currently assigned to the selected family.
• The comment area contains an optional description for the family.
To Open A Family Manager
Select FAMILIES / OPEN FAMILY MANAGER from the DOCUMENTS, CODES, or MEMOS
menu.
ATLAS.ti 7.1 USER MANUAL
FAMILY LIFE
228
The FAMILIES submenu is available from the Documents, Codes and Memos
menu.
The Family Manager is also available by clicking the Family button in the
corresponding Object Manager (see left).
Creating Families
Before using a family, it must first be created in the Family Manager.
Open the Family Manager for PDs, codes, or memos.
Click the button CREATE A NEW ITEM or select the menu option FAMILIES / NEW
FAMILY.
Enter a name when prompted and click OK. If you enter the name of an
already existing family, you will hear an error sound. A message pops up
letting you know that the entered name is not accepted.
Now you can add members and write a preliminary comment describing the
family.
The number of items in a family is displayed behind the family's name in
parentheses.
Adding Members
After a family is created, adding members is often the next logical step.
However, the assignment and removal of items can be done at any time during
the life cycle of a family. To add new items to a family:
Select a family. If you have just created the family, it is already selected.
Select one or more items in the list pane on the right hand side.
Click the Add Items button to make the selected items members of the
selected family (see Figure 193).
If you want to add one item at a time, you can simply double-click an item.
Figure 193: Adding members to a family
Watch the member list being populated with the items you have just added.
ATLAS.ti 7.1 USER MANUAL
FAMILY LIFE
229
Another way to add members is to drag them from an Object Manager, the
HU Explorer, or the margin area into the member’s pane.
Removing Members
Removing members is not possible in the side panels.
Open the Family Manager for the relevant object type.
Select a family.
Select one or more items in the list pane for members.
Click the Remove Items button to remove the selected items from the
selected family. The items are only deleted from this family and not from the
system.
If you want to remove one item at a time, you can simply double-click on
each item.
If you delete objects that belong to a family somewhere else, they will be
removed automatically from all their hosting families.
Assigning Families To Objects
The option EDIT FAMILIES / ASSIGN FAMILIES is another way of adding members to a
family. This option allows you to easily assign suitable attributes to objects
either selected in the Family Assigner or an Object Manager.
Assigning Families To Objects In The Family Assigner
Open the Family Assigner: .../ FAMILIES / ASSIGN FAMILIES.
Select an object (in the example below, it is a primary document) in the top
pane and then the appropriate families in the lower right hand side.
Click the Add Items button to assign the families to the selected object.
ATLAS.ti 7.1 USER MANUAL
FAMILY LIFE
230
Figure 194: Assign families to objects in the Family Assigner
Assigning Families To Objects In Object Managers
Select any number of objects in an Object Manager by holding down the
Ctrl-key.
Right click on one of the selected items and select Assign Families, or choose
…/ FAMILIES / ASSIGN FAMILIES from the menu.
From the list of families that opens, select one or more families to which the
selected objects are to be assigned.
Click OK.
Creating Families From Selected Items
Select any number of items in an Object Manager by holding down the Ctrlkey.
Right click on one of the selected items and select FAMILIES / NEW FROM SELECTED
ITEMS.
Enter a name for the new family and click OK.
Accessing Quotations
To access the quotations related to the objects included in the family, double
click on a family while holding the Ctrl-key.
ATLAS.ti 7.1 USER MANUAL
FAMILY LIFE
231
Writing A Comment For A Family
The family comment can be used to describe why and for what purpose a
family was created. This is especially useful when families are treated as
attributes.
Creating Or Editing A Family Comment
Open the Family Manager for the relevant object type.
Select a family.
In the text pane at the bottom of the window, write or edit a comment.
Alternatively, you can open a full-fledged editor by clicking the Comment
button in the toolbar.
Using Families As Filters
Access The Filter Options Via The Main Menu
One added value of families is that you can use them as filters. For example, if
you have created a code family including only ‘Abstract’ codes, you can use
this family as a filter to reduce the total number of codes displayed in the dropdown list in the Code Manager and the margin area.
Filter Items Using The Family Manager
Open the Family Manager.
Double-click a family. Watch how the display in the Object Manger and the
margin area changes to display only items that are members of the selected
family.
ATLAS.ti 7.1 USER MANUAL
FAMILY LIFE
232
Figure 195: Double clicking on a family in the family manager activates a filter
If a family is activated as a filter, the family icon is replaced by the filter icon. In
addition, the background color of the affected lists changes. The active filter is
also indicated in the filter field of the status bar in the Object Manager.
Figure 196: Effect of a code filter in the margin area
To take the filter out double-click on the family again, or select TOOLS / RESET
ALL FILTERS from the main menu. A third option is to double-click on the filter
field in the Object Manager while holding down the Ctrl-key.
Filter settings also affect network views. See “About this ManualWorking
with Filters in Network Views“ on page 333.
ATLAS.ti 7.1 USER MANUAL
FAMILY LIFE
233
Removing Families
Open the Family Manager for the relevant object type.
Select the family to be removed.
Click the Delete button or select menu option FAMILIES / DELETE FAMILY.
Removing a family does not remove any of the contained items.
ATLAS.ti 7.1 USER MANUAL
WORKING WITH VARIABLES: PRIMARY DOCUMENT FAMILIES
234
Working With Variables: Primary
Document Families
Along with sharing all the characteristics of code and memo families, PD
families have some additional characteristics.
PD families as
variables can be
used in queries
and SPSS jobs.
PD Families can be used to define the scope of a query when used as global
attributes supplementing codes. For instance, if the PD families "female" and
"age group 1 (21-30)" were assigned to a number of interviews, one can then
formulate queries like: "Show me all quotations from interviews with females
between the ages 21 to 30 coded with "coping" or "power." For a step-bystep instruction, see “Restricting Code Queries to Sub Groups ” on page 278.
In SPSS jobs, PD families are a way to aggregate some of the data (see “How
SPSS Export Handles Families” on page 411).
Use PD-Family
tables to assign
PDs and variables
at the same time.
PD-Family tables are an efficient means to create families and to assign PDs to
their respective families. You can also use them to assign PDs and to generate
variables in one step.
PD-Family Table
PD-Family Tables can be exported or imported as tab-delimited (XLS) or as
comma/semicolon separated value (CSV) files. All three formats can be read by
Excel™ as well as OpenOffice Calc.
Below you see an example of an exported file. The coloring has been added for
readability. Below each column header and content is explained.
ATLAS.ti 7.1 USER MANUAL
WORKING WITH VARIABLES: PRIMARY DOCUMENT FAMILIES
235
Figure 197: An Exported PD Family Table (some formatting added)
Documents: The PD sequence number.
Name: The name of the PD.
All following columns: Primary document families.
PD families following the syntax 'variable label::attribute value' are converted
in Excel into one variable with the column header '#variable label'. The
attribute values are entered into the cells. For instance, the two PD families
'Gender::male' and 'Gender::female' are converted into the variable #Gender
and the two values male and female. This is further explained below (“Type of
Variables”).
Type Of Variables
Within ATLAS.ti, all families, when interpreted as variables, are dichotomous
because an item may or may not belong to a specific family, thus it I encoded
with either 0 or 1 / applies or does not apply.
Figure 198: By default PD families are like dichotomous variables
ATLAS.ti 7.1 USER MANUAL
WORKING WITH VARIABLES: PRIMARY DOCUMENT FAMILIES
236
By following a simple naming convention, PD families can be turned into
nominal and categorical variables for the use outside of ATLAS.ti in statistical
and other database applications.
Let's assume that your respondents come from four different locations. To
represent this in ATLAS.ti, you need to create four PD families, one for each
location. Exporting these for families as PD-Family table to Excel, you get a
table as shown above containing one variable per family with the values 0 or 1.
If you prefer just one variable for location rather than four, you need to follow
the naming convention “Variable Name::Variable Value” when creating your
PD families:
Location::Berlin
Location::London
Location::New York
Location::Tokyo
When exporting the PD-Family table, the result will be as follows:
Figure 199: PD family table with a
nominal variable for location
The table shows one variable for Location and the respective values as string:
Berlin, London, New York and Tokyo. Note that the variable name is
prefixed with a hash sign (#). This is the syntax that needs to be used when
preparing a table for import (see below). The hash sign indicates to ATLAS.ti
that this variable needs to be turned into multiple families.
Super Families In PD Family Tables
Super Families (see page 280) are treated like standard families. If you do not
change the default name suggested by ATLAS.ti when creating super families,
then they are prefixed by an asterisk (*). In the table below you see two super
families combining the families for age group 1 and 2 with the family female.
ATLAS.ti 7.1 USER MANUAL
WORKING WITH VARIABLES: PRIMARY DOCUMENT FAMILIES
237
Figure 200: Display of PD Superfamilies in PD-Family tables
Do not assign a PD to more than one family with the same variable name
(e. g., both to Location::Berlin and Location::New York).
ATLAS.ti allows this, as it treats every family as a separate dichotomous
variable. However, when converted into a categorical variable “Location” in
the process of creating a PD-Family table, such multiple assignments could
create problems.
Preparing And Importing A PD-Family Table
Create the following columns when manually preparing a PD-Family table for
import from a spreadsheet application such as Excel:
First column: Use ‘Documents’ as the header and a PD number in subsequent
rows.
Second column: Use header “Name” and enter a name for the PD in each row.
The next one or two columns: As already mentioned above, the document path
is stored twofold when a table is created by ATLAS.ti: The actual path at the
time of export (column Path) and the path at the time of the assignment of the
document to the HU (column: @Origin). The latter can also contain special
path components (<HUPATH>, <TBPATH>) that will be correctly resolved
when imported into ATLAS.ti.
When reading a table into ATLAS.ti, the Path column has more or less
descriptive character as the @Origin is always preferred. Therefore the Path
column can be omitted when creating a table manually.
If neither the Path nor the @Origin column is defined, the name of the
document is used as file reference in combination with the special <HUPATH>.
In order to be able to access the data, you need to store the HU file and the
documents in on common folder.
All following columns: Enter variable names and values, i. e. the document
families into the subsequent columns. Novels
ATLAS.ti 7.1 USER MANUAL
WORKING WITH VARIABLES: PRIMARY DOCUMENT FAMILIES
238
Categorical variables: For all categorical variables, use a hash (#) as the lead
character, as in: #Profession, #Gender, etc. Enter the values as string.
Missing values: Missing values are indicated by a zero (0) and used for
documents not assigned to any family.
If a field name or value contains characters resembling the separator for
categorical variables, you need to enclose the name or value with quotation
marks.
If the HUPATH setup (as the easiest and most flexible project setup) suits your
needs, then an Excel table ready for import could look like this:
Figure 201: An Excel table ready for import as PD-Family table
You simply enter the consecutive numbers for PDs, the document names and
the variables.
Save the table as native Excel tab-delimited xls/xlsx file or in csv format.
Open ATLAS.ti.
From the main menu, select DOCUMENTS / IMPORT / IMPORT/EXPORT / IMPORT PDFAMILY TABLE. This option is also available from the Documents / Miscellaneous
menu.
If you are importing into a new HU, a dialog opens, asking you to save the
HU before proceeding. This is needed to be able to access “HU follower”
documents using the special <HUPATH>:
Save the HU into the same folder where the documents are stored (unless
you have entered an @Origin column with user defined path references).
Next a file dialog opens. If you are importing into an existing HU, the
standard file dialog window opens immediately. Select the prepared xls/xlsx
or csv file and click OK to start the import procedure.
If you import a native Excel file (tab delimited with the extension xls), the
families are imported immediately. If you select an Excel compatible file format
like csv, select the field delimiter: comma, semicolon, or tab.
Once the import is finished a message pops up informing you about the
number of families that have been created.
ATLAS.ti 7.1 USER MANUAL
WORKING WITH VARIABLES: PRIMARY DOCUMENT FAMILIES
239
Figure 202: HU file created based on importing a PD-Family table
Importing the above table, results in the following HU:
Five PDs with the names case 1 to case 5 were created, and they access their
source document via the HUPATH. This means you need to store the HU file +
the five Word documents in rich text format in a common folder as shown
below.
Figure 203: File Management for creating an HU via importing a PD-Family table
If the PDs do not yet exist in the HU, new PDs are created and are assigned to
the HU.
Adding new PDs: If your HU already contains PDs, you can add more PDs by
importing a PD Family table. However, you must be sure that the new PDs are
numbered consecutively. If your HU already contains P1 to P10, the numbers
of the additional PDs in the documents column need to start at P11. If the
document number and path reference do not match an existing reference, then
this document is ignored and not assigned as a PD.
Based on the above example table, PD Family Manager shows the following
families after importing the table:
ATLAS.ti 7.1 USER MANUAL
WORKING WITH VARIABLES: PRIMARY DOCUMENT FAMILIES
240
Figure 204: Created PD families after import
Exporting A PD-Family Table
If the documents have already been assigned, exporting a PD-Family table is
quite handy as a first step in preparing a table for import. This way ATLAS.ti
creates the columns documents, Name, Path and @Origin for you and you do
not have to retype the file names. The table can be exported even if no family
has yet been created.
If you have
named your
variable families
using a different
separator, change
the separator
when prompted
Select DOCUMENTS / IMPORT/EXPORT / EXPORT PD-FAMILY TABLE from the main
menu. This option is also available in the PD Family Manager from the
Families menu or the context menu.
You are prompted for a separator value. Click OK if you use the default value
“::”. If you use a different value, change it accordingly.
Next, select the output format, e. g. xls, and click OK.
Finally, specify the output target as usual (see “Output Destinations” on
page 385 for details). For example, select FILE & RUN for the table to be
opened in Excel or OpenOffice Calc immediately
Code Families
Code families in
the ATLAS.ti
framework are
simply named sets
of codes
In ATLAS.ti, the term “code family” is used to sort codes into named sets or
groups. For example, if you have four categories that are types of actors you
ATLAS.ti 7.1 USER MANUAL
WORKING WITH VARIABLES: PRIMARY DOCUMENT FAMILIES
241
can group them into a code family. Four members of the “actors” family might
be friends, parents, siblings, and partner.
Creating Code Families From Network Views
This procedure assumes some acquaintance with the network view function
(see “The Network Editor ” on page 312). Creating a code family from a
Network View’s code nodes might be useful when you need to print all
quotations referenced by the codes in the Network View or to filter all codes
contained in a Network View.
Open a Network View.
From the main menu in the Network Editor, select SPECIALS / GENERATE FAMILY.
You are prompted for a name. The offered default name is the name of the
Network View. Accept the name or type in a new name and click OK.
Code Families Add Analytic Power In Queries
Code families can be used with codes to construct queries using the Query
Tool. Families are interpreted in queries as if all its contained codes were
combined using the Boolean operator OR. For example, a code family
containing the four codes water, fire, air, and earth is interpreted in a query as
‘water OR fire OR air OR earth’.
Furthermore Code Families can be used as filters in combination with the Cooccurence Tools. They are quite effective in focusing your attention to just the
subset of data you are interested in. The Co-occurence Tools are often used
when you want to relate two code categories or two group of codes to each
other. Rather then running a query that contains all codes, you create a code
family that just contains the codes that you are interested in, set it as filter (e. g.
CODES / FILTER / FAMILIES →) and than run the Co-occurence Tree or Table Explorer
(see page 291).
A third option is to reduce the number of codes displayed in a Codes-PrimaryDocuments-Table (see page 302) by setting a Code Family as filter. This is
often combined with setting a PD Family as filter as well. This way, you export
just the data you want to focus on, instead of producing a large Excel table that
contains all documents and all codes.
PD And Code Families In SPSS Jobs
In addition to being used within ATLAS.ti, PD families as well as code families
are used when creating SPSS jobs. Both PD and Code Families are a way to
aggregate data in SPSS (see “SPSS Export” on page 405 for further detail).
ATLAS.ti 7.1 USER MANUAL
WORKING WITH VARIABLES: PRIMARY DOCUMENT FAMILIES
242
Memo Families
Memo families are useful for sorting and filtering your written reflections about
the project. Memos can be separated by type such as theoretical or linguistic
(see “Working with Memos“ on page 243).
The procedures for creating and handling memo families resemble those for
code families.
ATLAS.ti 7.1 USER MANUAL
WORKING WITH MEMOS
243
Working With Memos
Possible uses for
memos:
To take
methodological
notes
As a "bulletin
board" in team
projects
As a project
planning device.
As a primary
document
To create code
lists
Writing memos is an important task in every phase of the qualitative analysis
process. The ideas captured in memos are often the “pieces of a puzzle” that
are later put together in the phase of report writing. Theory-building, often
associated with building networks, also can involve the use of memos.
Memos are explanatory and descriptive texts that may be associated with other
"objects" like quotations, codes, or other memos. Memos can also "stand
alone" – simply as part of an HU. They can contain methodological notes; they
can be used as a bulletin board to exchange information between team
members; you can use them to write notes about the analytical process,
keeping a journal of to-dos. Memos may also serve as a repository for symbols,
text templates, and embedded objects that you may want to insert into PDs or
other memos.
Memos can also be assigned as primary documents, if you want to code them
(see page 247 below).
Difference Between Memos And Codes
Code names are (or should be) succinct, dense descriptors for concepts
emerging during the stage of closely studying the data. They often reduce
complex findings to crisp placeholders and/or theoretically relevant concepts.
Beginners often stuff lengthy treatises into a code name, blurring the distinction
between codes, comments, and memos and thereby mistaking codes for their
more appropriate siblings.
If you find yourself using more than a few words as code word, consider using
quotations or the code comment instead.
Like codes, memos have names. These names, or titles, are used for displaying
memos in browsers, and help to find specific memos. Just like code names, a
memo’s title should be short and concise. Don’t confuse the name with its
content!
How Memos And Comments Differ
A comment is
always a part of
another object; a
memo is an object
by itself.
Memos are very similar to comments in that both are intended to hold lengthy
texts, as opposed to codes that are simply naming a concept. Comments
exclusively belong to one entity. For example, the PD comment is part of the
primary document.
Comments are not displayed in browsers separately from the object to which
they are attached. Memos can be associated with more than one object and
ATLAS.ti 7.1 USER MANUAL
WORKING WITH MEMOS
244
have an additional type attribute, e. g., theoretical, methodological,
commentary, etc. They can also be free-standing, unlike comments.
Memo Content
Memos may use plain-text as well as Unicode or Rich Text. The latter allows
extended formatting and offers the option to insert pictures, tables etc. You
can also include local file names like file://notation.
The Memo Editor
For displaying and editing memos, a modified text editor is used. It is opened
via the Memo Manager’s toolbar for an existing, selected memo or when
creating a new memo.
Figure 205: The memo editor
Below the toolbar, the editor includes a title and memo type field. The default
title assigned to a newly created memo is: “ME – today’s date”. The title and
the default type “Commentary” can be changed by overwriting the default
title or by selecting a different memo type.
Various options are available. You can change the default memo title and
manage available memo types. You can also be prompted for a title when
creating a new memo. For details see “Memo Preferences” on page 248.
After having typed or changed something in the memo editor and before
closing the editor, save the contents if you want to keep it. Click on the Save
button or select MEMO / SAVE from the editor’s menu.
Create A Free Memo
In the Memo Manager, click the CREATE NEW button or select CREATE FREE MEMO
from the HUEditor’s MEMOS menu.
A new memo with the default memo title is created. The memo editor opens
(default setting).
Change the memo title according to your needs and begin to type the
memo.
ATLAS.ti 7.1 USER MANUAL
WORKING WITH MEMOS
245
Save the memo content before moving on to do something else by clicking
on the Accept button, or select MEMO / SAVE or click Ctrl+S. If you forget to
save it, you are reminded by the program to do so before closing the editor.
Attaching Memos To Data Segments
The procedure to create and associate a memo with a data segment or an
existing quotation is similar to the coding procedures described above (see
“General Coding Procedure” on page 188).
Create A Memo For A Data Segment
Select the part of the primary document for which you want to write a
memo.
Click the memo button in the primary document toolbar.
If the selected data segment does not resemble an existing quotation, a new
quotation is created and the memo is attached. An editor opens and you can
start to type.
Figure 206: Attaching a memo to a data segment
Adapt the automatically generated memo type and title according to your
needs.
You can customize the default values used for memo title and type via
TOOLS /PREFERENCES / GENERAL PREFERENCES, TAB: MEMOS.
Attach A Memo To A Data Segment
Select the part of the primary document to which you want to attach the
memo.
Select the part of the primary document to which you want to attach the
memo.
ATLAS.ti 7.1 USER MANUAL
WORKING WITH MEMOS
246
Select a memo in the Memo Manager and drag and drop the memo to the
highlighted data segment.
If the highlighted segment was not already a quotation, ATLAS.ti creates a
new quotation and attaches the memo.
Attach A Memo To Multiple Quotations
One option is to drag a number of quotations from the Quotation Manager
onto a memo in the Memo Manager. By using the Quotation Manager, one
can comfortably browse and review display quotations before attaching them
to the memo.
Another option is to select from a list of quotations:
In the Memo Manager, select a memo.
Choose menu option LINK MEMO TO: / QUOTATIONS from the context menu or
the Memos menu.
A window pops up showing all quotations that are currently not linked to this
memo. Select the quotations to be associated with this memo. Click OK.
As a third option you can connect a memo and quotations visually by using the
Network Editor (see “To link more than two nodes” on page 321).
Memo Types
Memos can be organized, sorted and filtered by the type attribute. Several
standard memo types are offered by ATLAS.ti (currently commentary,
method and theory). You can add new types or modify existing ones. Memo
types may either have a global or local scope. Global types are available in all
HUs; local memo types are known only for the HU for which they have been
defined.
Memo types are displayed and can be sorted in the Memo Manager’s details
view in an extra Type column.
Create A Local Memo Type
When creating a new memo, simply overwrite the default memo type
displayed in the memo editor’s type field with a new type. After saving the
memo, this new type may also be used for other memos inside this specific HU.
Add Or Remove Global Memo Types
Open the General Preferences dialog and select the
MEMOS
tab.
In section ‘Global Memo Types’ enter a new memo type in the entry field
and click the ADD button.
ATLAS.ti 7.1 USER MANUAL
WORKING WITH MEMOS
247
Figure 207: Adding new memo
types
To remove a global memo type, select a memo type from the list and click
REMOVE.
Click APPLY and close General Preferences.
The default memo type is ‘Commentary’ unless you have set a different default
in the dialog. This default type is used for newly created memos. To change the
default type, select another memo type and tick the box ‘use as default type’.
Make A Local Type Global
Choose the menu option MISCELLANEOUS / MAKE TYPE GLOBAL from the context
menu or from the MEMOS main menu to make all types of the selected memos
global.
Using Memos As PDs
Memos can be assigned as primary documents. How you implement this option
in your work depends on the nature of your project, your creativity, and
methodological considerations.
Select a memo in the Memo Manager.
Select the menu option MISCELLANEOUS / USE AS PRIMARY DOC from the context
menu or the Memos menu. Or, drag the memo into the PD Manager.
Consequences Of Using Memos As PD
Assigning a memo as primary document has two immediate consequences:
• If you want to edit the memo’s content, you need to edit the primary
document. Once a memo has been assigned as a PD, you can no longer edit
the memo in the Memo Manager. The reason is that, as a PD’s data source,
the memo may be referenced from quotations. Only the PD editing
technology guarantees the necessary synchronization after content changes.
• All editing in the primary document also affects the memo. The reason for
this is that the data source for the Primary Document IS the memo.
ATLAS.ti 7.1 USER MANUAL
WORKING WITH MEMOS
248
The ‘PDs’ column in the Memo Manager indicates whether a memo is used as
primary document. The number displayed indicates the number of PDs using
the memo as a data source. A dash (-) indicates that the memo is not used as a
PD.
Figure 208: Memo used as PD
Miscellaneous Memo Goodies
Memo Preferences
You may specify a number of settings for memos via TOOLS / PREFERENCES /
GENERAL PREFERENCES, Tab: MEMOS, or click on the preferences button in the main
tool bar.
Dragging A Memo To Another Hermeneutic Unit
You can drag memos between HUs. This transfers the memo (name, body,
type), but none of its referenced quotations, codes, etc., are migrated along.
Using Memos To Create A Code List
Using a “pseudo” memo allows you to bulk-create a large number of free
codes:
Create a new memo.
Type a list of codes with one code per line, or copy and paste an existing list
from an application like Word.
Save the memo.
From the MISCELLANEOUS menu, choose the option CREATE CODES
MEMO.
FROM
SELECTED
Codes in the memo’s code list that already exist are prefixed with three
exclamation marks. If such prefixed codes already exist, they are ignored.
Drag & Drop Text To Create A Memo
While dropping text into the text pane of the Memo Manager or the memo
editor inserts the dropped text at the drop position.
ATLAS.ti 7.1 USER MANUAL
WORKING WITH MEMOS
249
Margin Drag & Drop
Margin
Drag & Drop can
be toggled on
and off via
General
Preferences
“Advanced Drag
& Drop”
All objects populating the margin area (i. e., “margin objects”) support drag &
drop. The bar visualize quotations segmenting the document, and - depending
on the context - the objects attached to the bars represent themselves or the
link with the quotation.
The effect of a drag & drop operation depends on the objects that are involved
as drag sources (those that are dragged) and targets (those onto which objects
are dropped).
A large variety of objects from the margin area can be dropped into the margin
area. Furthermore, objects can also be dragged from other object managers
and browsers. Objects can be dragged from the margin into other windows
and even into “foreign” applications like Word™. In the latter case, the
ATLAS.ti objects lose their ATLAS.ti specific “objectness” but at least they
render into something useful, e. g., a formatted title and rich text comment.
Move Linked Objects
When an object (e. g., a code, memo, or hyperlink) is dropped on a quotation
bar, a new link is created between the object and the quotation represented by
the bar. In the figure below, the code ‘historic context’ is unlinked from its
original quotation (silver bar) and linked to the quotation of the target bar.
Replacing a code:
In the margin
drag a code from
one quotation
onto another
code and the
target code is
replaced.
Figure 209: Moving linked objects
Replace Linked Objects
When a margin object is dropped onto another margin object it is replaced. It
combines the operation described above with the replacement of the droppedon object. Three operations are accomplished at the same time: the object is
removed from its original quotation, it is linked to the target quotation, and it
replaces the object it was dropped on (the latter is unlinked from its quotation).
ATLAS.ti 7.1 USER MANUAL
WORKING WITH MEMOS
250
Copy Linked Objects
To copy linked
objects: hold
down the Ctrl-key
and drag a
margin object (e.
g., a code) onto
another quotation
bar.
An object in the margin is unlinked from its original quotation when it is
dropped onto another quotation bar or onto another margin object. To keep
the object from unlinking from its original place, hold down the CTRL-key
when dropping. This resembles dragging objects from managers and browsers
into the margin area, which does not change existing links.
Linking Quotations
Dragging a quotation bar onto another quotation bar creates a new hyperlink
between the two (see “Creating Hyperlinks in Margin Area” on page 359).
Merging Quotations
By holding down the CTRL-key you can merge the quotations. The following
messages pops up:
Figure 210: Merging quotations
Click YES, if you want that the new quotations encompassed the length of both
of the quotations.
Click No, if you want the dragged quotation to be deleted, thus merged into
the target quotation.
ATLAS.ti 7.1 USER MANUAL
DATA ANALYSIS AND THEORY-BUILDING TOOLS
251
Data Analysis And Theory-Building
Tools
In the first part of this section, you find a description of exploratory and
advanced analysis tools. These are: The word cruncher, the query tool, the cooccurrence tools, the code-primary-documents table, super codes and super
families.
Visualization and theory-building tools encompass predominantly the various
network view functions and ATLAS.ti's powerful hypertext/linking facilities.
Analysis Tools
Word Cruncher: Creates a word frequency count for textual primary
documents (see page 253).
Query Tool: Finds quotations based on a combination of codes like: “Show me
all quotations where both Code A and Code B have been applied.” Such
queries can also be combined with variables in form of PD families. Thus, you
can restrict a query to a certain sub groups of your documents: “Show me all
quotations where both Code A and Code B have been applied, but only for
female respondents between the age of 21 and 30” (see page 258).
Co-occurrence tools: Different from the query tool, where the results are
quotations, you can use the two co-ocurrence tools to find codes. The tree
explorer list all codes on the first level of the tree and if there are more codes
that have been applied to the same or overlapping quotations, then you can
open the tree branches to see those codes. If you open the tree further, the
associated quotations are shown. The second tool, the table explorer, shows a
cross-tabulation of codes and within the cells a frequency count of how often
each pair of codes co-occurs. The cells also provide access to the data behind
them (see page 290).
Codes-Primary-Documents-Table: This table is a cross-tabulation of codes by
primary documents. It shows how often a code has been applied to a
document. Aggregate counts based on code families and PD families are also
possible. (see pag302 302).
ATLAS.ti 7.1 USER MANUAL
DATA ANALYSIS AND THEORY-BUILDING TOOLS
252
Super Codes are saved queries. They can be reused, e. g. after more coding has
been done or after coding has been modified. They can also be used as part of
other query, thus, you can build complex queries step by step (see page 273).
Super Families: Like super codes, super families are saved queries based on
families. The purpose is to create families on an aggregate level. For instance, if
you have your base families for age groups, gender and location, you can
create super families that reflect a combination of these base families like all
females from age group 1 living in city X (see page 280).
Intercoder-Reliability: To assess intercoder reliability for data coded in
ATLAS.ti., you can use the web based tool CAT to calculate Cohen's kappa and
Cronbach's α (alpha) On page 304 the functions the tool provides are
explained and you find references for further resources on how to prepare
ATLAS.ti data for upload.
Tools For Visualization And Theory Building
The first steps of theory building of course already take place much earlier,
often already during coding. Ideas are developed further during the process of
querying the data. By asking specific questions, you gain more and more
insights and start to see how things are related. Memo writing is an essential
accompanying activity as well. T
The network view function offers further possibilities to explore your data and
to visualize your ideas and findings. In a network view editor you can link all
objects to each other. Code-code and quotation-quotation links can also be
named and commented. Further a number of graphical elements like colored
links, the line width, the node or background color can be set. Image
documents can be used as thumbnails (see page 307).
Another function discussed below is the creation of hypertext. This is a network
based on quotations, thus you work on the data rather than on the more
abstract coding level. Through hypertext, the original sequentiality of your data
is de-linearized, broken down into pieces that are then reconnected, making it
possible to traverse from one piece of data to another piece of data regardless
of their original positions (see page 352).
ATLAS.ti 7.1 USER MANUAL
DATA ANALYSIS AND THEORY-BUILDING TOOLS
253
The Word Cruncher
This feature offers word “crunching” capabilities for a simple quantitative
content analysis. It creates a list of word frequency counts for the selected or all
(currently filtered) textual PDs. A stop and go list and a list of ignorable
characters can be used to control the analysis. Further you can create a word
cloud for the selected documents, or for all documents:
Creating A Word Count Table
From the main menu, select ANALYSIS / WORD CRUNCHER or click the main
toolbar’s Word Cruncher button.
A property dialog opens offering a number of options that affect the
procedure:
Figure 211: Setting properties to start a word frequency count
You may specify a number of properties before starting the frequency count.
ATLAS.ti 7.1 USER MANUAL
DATA ANALYSIS AND THEORY-BUILDING TOOLS
254
Include Selected PD only: Select the scope of the count to be all textual
documents or the selected one only.
Built-in Tool: The built-in tool is a simple list window. In addition to the
frequency count, size and percentage for each word is shown. The built-in tool
can only be used for a selected PD.
Excel: Select this option if you want to export the word count to Excel.
Word Cloud: Select this option to create a word cloud.
Specify content for Excel table: In the next section you can specify the type of
content to be included in the Excel table.
Text normalization:
Ignore case: If checked, upper and lowercase letters are ignored: Hello, HELLO,
and hello are not counted separately.
Use legacy word recognition: Starting with version 7.0.84, a new way of word
recognition has been introduced that improves word recognition for Asian
languages. However, the improved recognition pattern slows down the word
count. If you were satisfied with the older pattern, click this option to increase
speed.
Remove from text before counting: The characters specified in this field will be
removed from the source before it is counted. Example: including " eliminates
the difference between "Hello" and Hello.Enter special characters that should
be not be counted.
Use a stop list to exclude words from the count. Instead of enumerating every
variant of a word, you can specify patterns. You can create powerful stop lists
for different languages, different topics, and different levels of detail.
Deactivate the option “Exclude words” to turn the stop list into a go list. This
means, only those words that are in the stop list are counted and all other
words are ignored.
The Stop And Go List
Click on the button EDIT LIST if you want to modify it. The first lines starting with
a semi colon contain an explanation of terms that can be used. All lines starting
with a semi colon are not included in the frequency count.
ATLAS.ti 7.1 USER MANUAL
DATA ANALYSIS AND THEORY-BUILDING TOOLS
255
Figure 212: Exception list editor
The terms to be excluded or included can be combined with regular
expressions. See below the list of regular expressions that can be used:
Expression
Effect
\<.\>
excludes words consisting of a single character
/d+
excludes numbers of any length
-+
excludes strings of hyphens of arbitrary size
_+
excludes strings of underscores
0+
exclude sequences of zeros
It is no longer necessary to enter the words to be excluded / included in
capital letters. The instruction in the default list still says that all entries must
be in capital letters. The reason for this is that we cannot simply exchange
the default file as long-time users of ATLAS.ti may already have customized
their stop lists. Exchanging the default text file would overwrite all userdefined modifications.
Word Cruncher Output
The figure below shows the result when using the built-in tool for a single PD.
ATLAS.ti 7.1 USER MANUAL
DATA ANALYSIS AND THEORY-BUILDING TOOLS
256
Figure 213: Word Cruncher output when using the internal tool
If you select the Excel output option, a message pops up informing you that
the Excel file can now be opened and where it is stored. Of course, you need to
have Excel installed to be able to see the result.
Figure 214: Status window information you about word
crunch results
ATLAS.ti 7.1 USER MANUAL
DATA ANALYSIS AND THEORY-BUILDING TOOLS
257
Figure 215: Word frequency count displayed in Excel
Use MS Excel™ functionality like sorting by highest to lowest frequency for
further exploration.
Word Cloud
The word cloud output looks as follows:
Figure 216: Word frequency cloud for P3
Fading fades out the less frequent words.
With the slider Limit, you can select how often a word should occur to be
displayed in the list.
Right-click on a word and select REMOVE FROM CLOUD ONLY if you no longer want
the word to be displayed in the current view.
If you do no longer want the word to be counted in all following runs, select
the option: EXCLUDE SELECTED WORD. In stop list mode, this means that the word is
added to the stop list. In Go List mode, the word is removed from the Go List.
ATLAS.ti 7.1 USER MANUAL
DATA ANALYSIS AND THEORY-BUILDING TOOLS
258
Switch the sort order by name, weight or word size by clicking on the suitable
tab.
The word cloud can also be created by right clicking on a document in the
Primary Document Manager. Select WORD CLOUD from the context menu.
Query Tool
You need the
Query Tool for
queries using
more than a
single code.
The Query Tool is used for retrieving quotations using the codes they were
associated with during the process of coding. This is different from a text
search: To search for occurrences of text that match a specified pattern or
string, you have to use the search function or the Object Crawler (see “Text
Search” on page 211 and “The Object Crawler” on page 366).
The simplest retrieval of this kind (“search for quotations with codes”) is what
you frequently do with the Code Manager: double-clicking on a code retrieves
all its quotations. This may already be regarded as a query, although it is a
simple one. The Query Tool is more complex in that it can be used to create
and process queries that include combinations of codes.
A query is a search expression built from operands (codes and code families)
and operators (e. g. NOT, AND, OR, etc.) that define the conditions that a
quotation must meet to be retrieved (e. g., all quotations coded with both
codes A and B).
By selecting codes or code families and operators, a query can be built
incrementally which is instantaneously evaluated and displayed as a list of
quotations. This incremental building of complex search queries gives you an
exploratory approach toward even the most complex queries.
The Query Tool Window
The Query Tool is launched by clicking the Query Tool button (see left), or by
choosing ANALYSIS / QUERY TOOL from the HU Editor's main menu.
ATLAS.ti 7.1 USER MANUAL
DATA ANALYSIS AND THEORY-BUILDING TOOLS
259
Figure 217: The Query Tool window
The Query Tool has the following main components:
[1] The operator toolbar, located near the left margin of the window.
[2] The code-family pane in the upper left lists code-families to be used in
queries.
[3] The codes pane below the code-family pane contains all current codes (set
filters do apply).
[4] The term-stack pane in the upper right displays the stack of all expressions
entered in the current query. If more than one entry is visible, there are
arguments still waiting to be used in the query. The topmost entry is the
current query.
[5] The current query is also displayed in the feedback pane directly below the
term-stack pane. Here a different notation is used, one that uses parentheses
and resembles the calculator style of entering queries.
[6] The result of the query is displayed in the results list located in the lower
right of the window.
Above the term-stack pane are several buttons for manipulating the stack:
swapping (S) or duplicating terms (P), clearing the stack (C), etc.
Close to the results list are two buttons for removing unwanted hits and
creating a report.
In figure 214 you see three other buttons highlighted in green. A super code is
a saved query (see Super Codes on page 273 for further detail). You need the
adjacency operator settings if you want to search for codes near to each other
(see Adjacency Operators on page 266). Behind the Scope button you find
another important feature. When you click on the Scope button, a second
window opens showing the PD families (see page 225) you have created.
ATLAS.ti 7.1 USER MANUAL
DATA ANALYSIS AND THEORY-BUILDING TOOLS
260
These are often variables like age, gender, education, profession, location, time
intervals etc. The scope function allows you to combine a code query with
variables. For instance you can ask for all quotations where you have applied
code A and code B, but only for females between the ages of 21 to 30.
Operands
Basic Operands
Two sorts of basic or atomic operands may be used in a query: Codes and code
families.
A code represents a set of quotations, while a code family yields the quotations
of all the codes that its members have. In other words, a family is interpreted as
its member codes connected by the Boolean operator OR. Selecting a code
family F1 which contains five codes C1-C5 is equivalent to the query: "C1 OR
C2 OR C3 OR C4 OR C5".
Complex Operands
"Operand" does not only apply to basic descriptors. An operand can be any
expression that itself is used as an argument. An expression "A AND B" may be
used in a more complex query as an operand: "NOT(A AND B)", "(A AND B)
OR (C AND NOT D)", etc.
All types of operands can be freely mixed in a query using any of the operators
described below.
Operators
Three sets of operators are available. They are located within the toolbar at the
left edge of the Query Tool.
Boolean operators allow combinations of keywords according to set operations.
They are the most common operators used in information retrieval systems.
Semantic operators exploit the network structures that were built from the
codes.
Proximity operators are used to analyze the spatial relations (e. g., distance,
embeddedness, overlapping, co-occurrence) between coded data segments.
You can display a short help message for each operator by right clicking on
its corresponding button in the toolbar.
Boolean Operators
Four Boolean operators are available with the Query Tool: OR, XOR, AND, and
NOT.
ATLAS.ti 7.1 USER MANUAL
DATA ANALYSIS AND THEORY-BUILDING TOOLS
261
OR, XOR, and AND are binary operators which need exactly two operands as
input. NOT needs only one operand. However, as stated above, the operands
themselves may be of arbitrary complexity. Codes, code families, or arbitrary
expressions can be used as operands: "(A OR B) AND (NOT C AND D)".
OR
The OR operator retrieves all data segments (i. e.,
quotations) that are coded with any of the codes used in
the expression. Example: "All quotations coded with 'Earth'
OR 'Fire'". An example of a more complex formulation
based on a combination of queries is: "All quotations
coded with 'Earth' OR coded by both 'Fire AND Water'."
XOR
The OR operator does not really match the everyday usage
of "OR." Its meaning is "At least one of…," including the
case where ALL conditions match. The XOR operator, in
contrast, asks that "EXACTLY one of…" the conditions
must meet. It translates into everyday "either-or."
Example: "All quotations coded with EITHER 'Earth' OR
'Fire' (but not with both)."
AND
The AND operator finds quotations that match ALL the
conditions specified in the query. This means you have
applied two or more codes to the same quotation.
Example: "All quotations coded with 'Earth' AND 'Fire'."
The AND operator is very selective and often produces an
empty result set. "Precision" of this operator is high, but
the "recall" is rather low. It produces best results when
combined with less restrictive operators or when the overall
number of the available text segments is large.
NOT
The NOT operator tests for the absence of a condition.
Technically, it subtracts the findings of the non-negated
term from all data segments available. Given 120
quotations in the HU and 12 quotations assigned to code
"Fire," the query "NOT Fire" retrieves 108 quotations those which are not coded with "Fire." Of course, the
operator can be used with an arbitrary expression as in the
argument "NOT (Earth OR Fire)" which is the equivalent
of “neither Earth nor Fire.”
The OR operator has the potential to generate a HUGE number of hits. It
has high "recall" (a lot is retrieved), but low "precision" (many of the
retrieved quotations may not make sense).
Venn diagrams are descriptive schemes for illustrating the different set
operations associated with Boolean operators.
ATLAS.ti 7.1 USER MANUAL
DATA ANALYSIS AND THEORY-BUILDING TOOLS
262
A or B
not (A or B)
A xor B
Q1
Q4
A
B
Q3
Q5
Q2
A and not B A and B not A and B
Figure 218: Boolean queries depicted as Venn diagrams
The rectangle encloses the set of all retrievable quotations, e. g. the "document
universe." The two circles represent two codes A and B. Q1 to Q5 are
quotations coded with A, B, or none (Q5).
Semantic Operators
The Semantic Operator buttons
The operators in this section exploit connected codes resulting from previous
theory-building work. While Boolean-based queries are extensional and simply
enumerate the elements of combined sets (e. g., LOVE or KINDNESS), semantic
operators are intentional, as they already capture some meaning expressed in
appropriately linked concepts (e. g., SUB(POSITIVE ATTITUDES)).
SUB
The SUB (or DOWN) operator traverses the network from
higher to lower concepts, collecting all quotations from any
of the sub codes. Only "transitive" relations between the
codes are processed (see “Relations“on page 310; all
others are types ignored. When building a terminology
from your codes, use the ISA relation for sub-term links.
Example: "All quotations coded with Magic or any
(immediate or indirect) sub-term of Magic". Like the OR
operator in the set of Boolean operators, the SUB may
produce large result sets. However, unlike the OR operator,
because you make use of a theory using SUB, the
"precision" is much better (i. e., you get only what you
expect). Of course, if your network contains dubious
connections ("computer ISA intelligent entity"), the quality
of your retrieval will decline.
UP
The UP operator looks at all directly linked codes and their
quotations on the next higher level.. Unlike the SUB
operator, it does not recursively traverse the structure.
Only the next level is considered.
ATLAS.ti 7.1 USER MANUAL
DATA ANALYSIS AND THEORY-BUILDING TOOLS
263
SIBlings
The SIBlings operator finds all quotations that are
connected to the selected code or any other descendants
of its parents. Example: "All quotations coded with Love or
any other Positive Attitude (here: kindness).”
Figure 219: A hierarchy of concepts suitable for semantic retrieval
With such a network of codes the following queries would make sense (Q1 to
Q8 = quotations):
SUB (Positive Attitude) => {Q1, Q2, Q3, Q4, Q5}
SUB (Negative Attitude} => {Q6, Q7, Q8}
SUB (Attitude) => {Q1, Q2, Q3, Q4, Q5, Q6, Q7, Q8}.
Proximity Operators
The Proximity Operator buttons
Proximity describes the spatial relation between quotations. Quotations can be
embedded in one another, one may follow another, etc. The operators in this
section exploit these relationships. They require two operands as their
arguments. They differ from the other operators in one important aspect:
proximity operators are non-commutative. This property makes their usage a
little more difficult to learn.
Non-commutativity requires a certain input sequence for the operands. While
"A OR B" is equal to "B OR A", this does not hold for any of the proximity
operators: "A FOLLOWS B" is not equal to "B FOLLOWS A". When building a
query, always enter the expressions in the order in which they appear in their
natural language manifestation.
ATLAS.ti 7.1 USER MANUAL
DATA ANALYSIS AND THEORY-BUILDING TOOLS
Because of noncommutativity,
every proximity
operator comes in
two versions.
264
Another important characteristic for these operators is the specification of the
operand for which you want the quotations retrieved. "A WITHIN B" specifies
the constraint, but you must also specify if you want the quotations for the As
or the Bs. This is done implicitly by the sequence. The code (or term) that is
entered first is the one in which you are interested. If B’s quotations are
requested, you have to enter "B ENCLOSES A" using the query language
described below.
EMBEDDING OPERATORS
The embedding operators describe quotations that are contained in one
another and that are coded with certain codes.
WITHIN
A WITHIN B retrieves all quotations coded with A that are
contained within data segments coded with B.
ENCLOSES
A ENCLOSES B retrieves all quotations coded with A that
contain quotations coded with B.
OVERLAP OPERATORS
The overlap operators describe quotations that overlap one another.
OVERLAPPED_BY
A OVERLAPPED_BY B retrieves all quotations coded with A
that are overlapped by quotations coded with B.
OVERLAPS
A OVERLAPS B retrieves all quotations coded with A that
overlap quotations coded with B.
ATLAS.ti 7.1 USER MANUAL
DATA ANALYSIS AND THEORY-BUILDING TOOLS
265
Figure 220: Visualizing the spatial relations between segments
If you want to retrieve all segments for “reason suspected: behavioral clues”
related to the code “murderer_description”, you would need to click:
“reason suspected: behavioral clues”, “murderer_description”, WITHIN
If you enter: “murderer_description”,“reason suspected: behavioral clues”,
WITHIN, the query tool would not deliver any results for the data segments
shown in figure 220.
If you enter , “murderer_description”, “reason suspected: behavioral clues”
ENCLOSES, then the query tool retrieves the larger segment
“murderer_description” that does contain the behavioral clue. But then you
need to read more than you need if you are only interested in the behavioral
clues.
If you are interested in the code “alibi” as reasons for having released a suspect
in relation to the description of the murderer, then you click: “reason released:
alibi”, “murderer_description” overlaps.
If you want to find out about the name of the suspect related to behavioral
clues, you enter “name of suspect”, “reason suspected: behavioral clues”
WITHIN.
From the above example we have learned that a) you begin with the codes
whose content you are most interested in, and b) you first enter the codes and
then you select an operator. See is explained in more detail below in the section
“The Query Language“.
Often when interested in the relation between two or more codes, you don't
really care whether something overlaps or is overlapped by, or is within or
encloses. It this is the case, you simply use the Co-occuRE operator, which is a
combination of WITHIN, ENCLOSES, OVERLAPS, OVERLAPPED BY and AND.
Nonetheless these very specific operators are also very useful for specific type
of data. Think of video data where it might be important wether action A was
already going on before action B started or vice versa. Or if you have coded
longer section in your data like biographical time periods in a persons life and
then did some more fine-grained coding within these time periods. Then the
WITHIN operator comes in handy. The same applies when working with precoded survey data. ATLAS.ti pre-codes your questions, then you do some
further coding. This enables you to ask for instance for all quotations coded
with “topic x” WITHIN question 5.
ATLAS.ti 7.1 USER MANUAL
DATA ANALYSIS AND THEORY-BUILDING TOOLS
266
ADJACENCY OPERATORS
The distance operators describe a sequence of disjoint quotations. The
maximum distance may be specified. Possible base units are characters and
paragraphs for text, milliseconds for audio files, frames for video data and
pixels for images.
FOLLOWS
A FOLLOWS B retrieves all quotations coded with A
that follow quotations coded with B.
PRECEDES
A PRECEDES B retrieves all quotations coded with A
followed by quotations coded with B.
ADJACENCY SETTINGS
To set the distance, click on the “Adjacency Operator Settings” button. Then
select a base unit and specify the maximum distance.
Figure 221: Adjacency operator settings
THE CO-OCCURRENCE OPERATOR
Co-occurrence is essentially a short-cut for a combination of all the basic
proximity operators except FOLLOWS and PRECEDES.
A CO-OCCURRING WITH B: Find all quotations that co-occur with B (in
whatever way).
The procedures used for calculating co-occurrence for two codes is also
used in the Network Editor when importing co-occurring codes into a
network view. See “Import Co-occurring Codes” on page 332.
ATLAS.ti 7.1 USER MANUAL
DATA ANALYSIS AND THEORY-BUILDING TOOLS
267
The Query Language
Queries are built step-by-step from operands and operators using the principle
of Reversed Polish Notation (RPN). This sounds complicated, but it is actually
quite easy. See for example:
http://en.wikipedia.org/wiki/Reverse_Polish_notation
RPN, invented by Polish mathematician Lukasiewicz, does not require
parentheses to control the priority of operators, nor does it require any other
characters like commas, periods, etc. Every click produces a meaningful result
and it is impossible to create syntactically wrong queries.
Operands First, Operators Next
The most important point to understand about RPN is the order in which
operands and operators of a search expression are entered. Using RPN,
operands (codes, code families) are entered first, followed by one or more
operators. This is an unusual method for most of us who are familiar with
notations where operators are placed between the operands, as in "3 + 5".
Most calculators use this type of notation, also called "infix" notation.
Infix notation:
good for reading.
Postfix notation:
good for clicking.
Two aspects must be distinguished: how we read expressions and how we
formulate them with a "point and click" language. The infix notation is usually
easier to read, but the "postfix" notation is far easier to use when creating
queries using mouse-controlled direct manipulation user interfaces like
Windows.
An Arithmetic Example
Here are some simple arithmetic examples using an RPN calculator:
Arithmetic expression
RPN expression
Example 1: 3 + 4
34+
Example 2: 3 + (4 * 5)
4 5 *3 +
Example 3: (3 + 4) * 5
34+5*
No parentheses are needed in expressions using RPN notation. The
precedence of the operators is controlled solely by the order in which
operands and operators are entered.
Creating A Query With The Query Tool
The result of any
query is a set of
quotations.
The retrieval of quotations with the Query Tool differs from the arithmetic
example above by the result in which we are interested.
We are really not interested in the operands (codes, code families) themselves,
but in the set of quotations that is the result of evaluating an operand. By
ATLAS.ti 7.1 USER MANUAL
DATA ANALYSIS AND THEORY-BUILDING TOOLS
268
formulating a query “A OR B,” this is what we really mean: “Quotations
coded with code A OR quotations coded with B.” Therefore, entering the
operand code “X” displays the quotation names which were coded with “X” in
the results list. Next, you can either view the resulting quotations in context
within the primary document, or generate a report that contains the full lenght
quotations with or without their comments.
Build complex
queries
incrementally
with immediate
feedback after
each step.
A Boolean Query
The example below uses the HU “Children & Happiness Stage II” Please load
and display this HU while reading the following. You can access the samples
file via HELP / QUICK TOUR
Our sample query, using Boolean operators, is this: “Find all quotations coded
with either code “children: = level of happiness” or code “children: unrelated
to happiness”.
Open the Query Tool by clicking on the binoculars button in the main
toolbar.
Double-click on the code “children: = level of happiness”. The Query Tool
displays the following entries:
Figure 222: Clicking a Boolean Query: Step 1
The term stack and feedback pane now display the code “children: = level of
happiness”. The results pane lists all quotations for this code.
Double-click on the code “children: unrelated to happiness”.
ATLAS.ti 7.1 USER MANUAL
DATA ANALYSIS AND THEORY-BUILDING TOOLS
269
Figure 223: Clicking a Boolean Query: Step 2
Now there are two entries in the term stack, the codes “children: = level of
happiness” and “children: unrelated to happiness” The feedback pane displays
the active query: code “children: unrelated to happiness”. And in the result
pane you can immediately see the thirteen quotations coded with this code.
With two operands on the term stack, we can combine them with an
appropriate operator. The intention was to retrieve all quotations that contain
information about an alibi or lack of evidence as reasons to release a suspect.
Click on the OR operator (see left) to combine the two expressions from the
stack.
ATLAS.ti 7.1 USER MANUAL
DATA ANALYSIS AND THEORY-BUILDING TOOLS
270
Figure 224: Clicking a Boolean Query: Step 3
The term stack now contains only one term, OR(“children: = level of
happiness”,”children: unrelated to happiness”), i. e. the combination of the
two codes. This term can be used as an operand to further extend the query, e.
g. to negate the expression or add some more codes to it. But we will stop here
for now.
The feedback pane displays the query in infix notation, as we would have
entered it into a regular calculator (“children: = level of happiness | “children:
unrelated to happiness”). The results pane lists 31 quotations.
You can look at the quotations in the context of the document by clicking on a
quotation in the list, or you can create a report (see “Output of Query Results“
below).
Output Of Query Results
Viewing Results In Context
Make sure that the Query Tool does not completely obstruct the area where
PDs are displayed.
Click on a quotation in the results pane.
The quotation is highlighted in the primary document pane:
ATLAS.ti 7.1 USER MANUAL
DATA ANALYSIS AND THEORY-BUILDING TOOLS
271
Figure 225: Viewing results in context
Creating A Report
To print all hits found by a query, click the PRINTER button to the right of
the results list.
Figure 226: Output options
Select one of the following report options:
• LIST: Print a list of all quotations in a compact format showing only the
quotation names.
• LIST – INCLUDE COMMENTS: Same as LIST but includes the quotations’ comments if
any.
• FULL CONTENT: Output the complete text of the quotations (works for texttype quotations only, obviously).
• FULL CONTENT – NO META: Output the complete text of the quotations and
specify the kind of information that is included in the output. You may for
example exclude the meta information for each quotation.
• FULL CONTENT – INCLUDE COMMENTS: Same as FULL CONTENT but includes the
quotations’ comments if any.
Then, choose whether the output should be displayed in a text editor, saved to
disk, or printed (see also “Output Destinations“ on page 385).
ATLAS.ti 7.1 USER MANUAL
DATA ANALYSIS AND THEORY-BUILDING TOOLS
272
Figure 227: Select output destination
Cleaning Up The Hit List
Before creating a report of all the quotations found by the query, you have the
option to remove entries from the hit list. You can remove unwanted hits from
the list using the erase button right next to the printer button. You could, of
course, reformulate your query to improve the precision.
This is how you clean up the hit list:
Select an unwanted quotation in the hit list.
Click the ERASE button (see left).
Another Example Using A Proximity Operator
If not already open, select HELP / QUICK TOUR / LOAD “CHILDREN & HAPPINESS STAGE
II” to open the sample file.
For example, we can take a look at the code “def happiness: fulfillment”
(respondents who define happiness as fulfillment) and inspect whether the
responses are different dependent on whether someone has children or not.
Double-click on the family “def happiness: fulfillment”.
Double-click on the code “#fam: has children”. T
Select the COOCCUR operator.
The results for this query are shown in the result pane. The number of results is
shown in the bottom left corner of the window. To display the results in
context, click on each quotation.
ATLAS.ti 7.1 USER MANUAL
DATA ANALYSIS AND THEORY-BUILDING TOOLS
273
Figure 228: Query tool window
To create an output of these results, click on the printer button.
Let’s now compare whether we get different results if we select respondents
who do not have children:
Click on the button C (CLEAR) at the top of the query tool.
Double-click on the family “def happiness: fulfillment”.
Double-click on the code “#fam: no children”.
Select the COOCCUR operator.
The result pane shows 1 quotation.
Super Codes
"Intelligent"
Super Codes
compute their
quotations “on
demand”.
Super Codes are a convenient way to store queries. Super Codes are very
similar in look and feel to normal codes, with one important difference: instead
of “hardwired” connections to quotations, Super Codes store a query to
compute their virtual references whenever needed.
They “automatically” change their behavior during the course of theory
building. If you have a Super Code based on a query like
(Code A | Code B) COOCCUR Code C
and you add or delete quotations linked to either Code A, B or C, then the
quotations linked to the super code will automatically be adjusted.
Super Codes can be clicked on in the code list like any other code and they will
display their quotations in an identical way.
Normal codes in comparisons are “hard-wired” to their quotations.
ATLAS.ti 7.1 USER MANUAL
DATA ANALYSIS AND THEORY-BUILDING TOOLS
274
Figure 229: Codes are hard-wired to their quotations
Figure 230: Super codes are linked to quotations via a query
Super codes are displayed in the Code Manager just like regular codes and can
be recognized either by a red text color or by their red symbol, if images are
switched on in the Views menu. The list of quotations associated with the
Super Code can be displayed with a double-click, just as for any other code.
Frequencies (density) are only indicated if you activated it, e. g. with a doubleclick in the Code Manager. If you start a new session, an asterisk (*) replaces
the frequency count. The reason for this is that a Super Code is dynamic and its
density/frequency count changes as soon as you modify any of the codes
contained in the query of the Super Code. For the same reason, Super Codes
are not displayed in the margin area. There is the possibility to create a regular
code from a Super Code (see “Snapshot Codes” on page 277).
Super Codes can be used in code families, Network Views, and, last but not
least, as powerful operands in queries, allowing you to incrementally build
complex queries.
ATLAS.ti 7.1 USER MANUAL
DATA ANALYSIS AND THEORY-BUILDING TOOLS
275
Creating Super Codes
To create a Super Code, you must have already constructed a query using the
Query Tool which is displayed in the term stack. Note that because Super
Codes are “intentional,” you can also create a valid and useful Super Code
with an empty results list (which might well change in a later stage of your
analysis).
Click the "Super-Code" button in the query tool between the feedback pane
and the result pane.
Figure 231: Location of super code button in the query tool
Enter a name for the new Super Code or accept the default name created
from the query expression. Click OK.
Figure 232: Display of super codes in the Code Manager
The newly created Super Code immediately appears in the list of codes and can
be used for new queries (and Super Codes) right away. Its icon and code name
are red.
You can access and edit the query later (see “Editing a super code Query“ on
page 276, but the notation that is used in the edit query window is not so easy
to understand. Therefore it is advisable that you enter the query into the
comment field of the super code. You can copy and paste it from the feedback
pane into the comment field.
ATLAS.ti 7.1 USER MANUAL
DATA ANALYSIS AND THEORY-BUILDING TOOLS
276
Creating Super Codes In The Code Manager
You can also create super codes using an OR combination in the Code
Manager:
Select multiple codes in the Code Manager.
Select the menu option CODES / MISCELLANEOUS / CREATE SUPER CODE.
Enter a name for the super code and click OK.
Editing A Super Code Query
If you want to edit the query a super code is based upon, highlight the super
code in the Code Manager and select MISCELLANEOUS / EDIT QUERY from the
menu.
Figure 233: Editing a super code
Click on the Help button for instructions.
Auto-Optimization Of Super Code Queries
In order to take into account quotations that were manually removed from the
hit list in the result pane of the Query Tool, the system must modified the
query before a Super Code is created. Otherwise it would display the full set
retrieved by the original query. To accomplish this task, a “suppressor” code is
created, which refers to the quotations removed from the hit list.
Example: The original query “All quotations coded with “Code A” OR “Code
B”) yields 4 quotations 1:1, 1:2, 1:3 and 3:1. From the hit list, quotation 1:1
ATLAS.ti 7.1 USER MANUAL
DATA ANALYSIS AND THEORY-BUILDING TOOLS
277
and 1:3 are removed. The query is now modified by creating a new
“suppressor” code **Q1 referencing 1:1 and 1:3. The original query is
modified as follows:
(Code A OR Code B) AND NOT (**Q1)
And returns exactly what you want: quotations 1:2 and 3:1.
Both the Super Code's and the suppressor code's automatically created
comment reflect their mutual dependency.
A suppressor code cannot be deleted before the referring Super Code is
deleted.
What You Cannot Do With Super Codes
As Super Codes are not directly associated with quotations, certain restrictions
apply.
Super codes
cannot used for
manual coding.
Coding: The most important constraint is that you cannot associate them with
quotations directly. Therefore, Super Codes are not presented when doing
"code by list," and drag & drop onto data selections is prohibited.
Merging: Code Merge operations including Super Codes are also not possible.
Prevent Cycles: If you created a Super Code whose query contains a reference
to a code family, you cannot assign this Super Code to the code family later.
This would create a cyclic structure and is therefore disallowed.
Snapshot Codes
A Snapshot Code is a normal code that records the current state of a Super
Code by way of “hard-wired” links to the derived quotations. By creating a
snapshot from time to time, you can analyze the development of a Super Code.
Unlike the Super Code, a code created by the snapshot is displayed in the
margin area and can be used for further coding. The default snapshot code
names are suffixed with [SN<number>].
How To Create A Snapshot Code
Select a Super Code in the Code Manager.
From the CODES / MISCELLANEOUS menu, select option CREATE SNAPSHOT.
The newly create code appears in the Code Manager. The code icon turns
yellow, the characters of the code name appear in black and the post-fix
[SN1 + a consecutive number] is added to the name. The frequency count is
permanently displayed as the snapshot code is no longer dynamic.
ATLAS.ti 7.1 USER MANUAL
DATA ANALYSIS AND THEORY-BUILDING TOOLS
278
Figure 234: A super code and its snapshot
Restricting Code Queries To Sub Groups
You can specify the documents that are to be considered in a query. By default,
the query's "document universe" is all PDs currently filtered in the HU Editor.
Clicking Scope opens another window that shows the PDs in the lower left
pane and the PD families in the upper left. As PD families can be looked at as
nominal variables, it is easy to preselect "all interviews with male interviewees
aged between twenty and thirty from small towns.
A restricted set of operators is offered (note that only Boolean operators make
sense here) and can be used to construct scope selection queries in much the
same way as the query itself.
Figure 235: Restricting a search to a sub group of data
Figure 235 above shows a simply query for the code family “reasons for having
kids”.
The scope is set to the PD family “gender::male”. This means that the result
pane is filtered only displaying quotations from male respondents. This results
in 7 quotations, which can be seen at the bottom left of the query tool
window.
ATLAS.ti 7.1 USER MANUAL
DATA ANALYSIS AND THEORY-BUILDING TOOLS
279
Double-clicking on the PD Family “gender::female” in turn yields 10
quotations. Further comparisons could be by educational level, marital status,
whether someone is a parent or not, etc.
For the results always look at the result pane of the query tool window. The
bottom pane of the Scope of Query window shows all quotations from the
selected document group. In mathematical terms, the result pane in the query
tool window shows the intersection between the code query and all quotations
from a particular document group.
You can also combine a number of PD families or individual PDs using Boolean
operators in the Scope of Query Window, or by creating Super PD families (see
“Combining group of documents to restrict searches“ below or “Creating
Super Families as Global Filters“ on page 58.
A scope is not stored as part of a Super Code's query specification. When
you process the query of a Super Code later, the complete data base is
queried by default.
Combining Group Of Documents To Restrict Searches
A combination of document families like all females in age group II (31-40)
from New York is clicked in the same way as you click a code query. You first
select two or more PD families and then you select one or more operaators:
Create a query.
Click on the Scope button.
To create the above described subgroup, you would double click on the three
families: female, age group II and City::New York. Then you click on the
AND operator twice.
ATLAS.ti 7.1 USER MANUAL
DATA ANALYSIS AND THEORY-BUILDING TOOLS
280
Figure 236: Combining document families to set the scope
If you need certain combinations of document families more often, then you
can create so called Super Families. How this works is described in the next
section.
Super Families
Just like Super
Codes, Super
Families recalculate their
members “on
demand.”
Super Families follow the same underlying logic as Super Codes (cf. “Super
Codes” on page 273). They are constructed by combining families or already
existing super families.
Their members are determined dynamically whenever you activate a Super
Family. Super families can be created based on primary document families,
code families and memo families. Below an example is shown for primary
document families. Creating super code or super memo families works in the
same way.
Using Super Families
Example
You are working in the Customer Department of an airline and have been
given the task to analyze customer complaints. As basis for your analysis, you
ATLAS.ti 7.1 USER MANUAL
DATA ANALYSIS AND THEORY-BUILDING TOOLS
281
have a set of documents dealing with customer complaints about domestic
flights and a set of documents dealing with customer complaints about
international flights. Your company is particularly interested in differences
between domestic and international flights and differences between business
and leisure travelers. Important factors to analyze might be gender, level of
income, and frequent-flyer status.
The matrix below is based on the four customer groups:
Domestic Flights
International Flights
Business traveler
Business traveler
Leisure traveler
Leisure traveler
To represent these four groups in ATLAS.ti, you create primary document
families. Next, you code the data. For example, you may use codes such as
“punctuality,” “general service,” “in-flight services,” and “human interaction”
to describe complaints customers had.
After coding, you can use the query tool in combination with the scope
function to find out how the four groups differ in terms of their complaint
behavior.
Open the Query Tool.
Double-click on the code containing the information you are interested in,
e.g., complaints about ‘in-flight services.’
Click Scope to restrict the search to a specific sub groups of your data, e. g.
business travelers on domestic flights:
Double-click on the PD family ‘Domestic Flights’ and on the PD family
‘Business Traveler’ and combine them using the AND operator.
The result pane of the Query Tool now displays all quotations related to
complaints about in-flight services from business travelers on domestic
flights.
In order to compare the four groups in regard to different types of complaints,
the steps above need to be repeated.
Having frequently used combinations of families available as Super Families
eases such tasks considerably. Below, a step-by-step instruction on how to
create Super Families is provided.
How To Create A Super Family
An easy way to create super families is via the side panels in the managers. This
has been explained in detail in the section “Creating Super Families as Global
Filters“ on page 58. However, here only the operators AND and OR can be
used to create super families. The super family tool (see Figure 237), offers a
few more options.
Open a Family Manager and click the Super Family button (see left), or select
FAMILIES / OPEN SUPER FAMILY TOOL from the menu.
The Super Family Tool opens:
ATLAS.ti 7.1 USER MANUAL
DATA ANALYSIS AND THEORY-BUILDING TOOLS
282
Figure 237: Super Family Tool for Primary Document Families
The Super Family Tool is like a reduced Query Tool (see “Query Tool” on page
258 for details). In the left pane, the available families are listed. For our
example above, there are four regular families. The panes on the right-hand
side (from top to bottom: the term stack pane, the feedback pane and the
result pane) display information once you begin to create a combination of
families. The buttons above the stack pane are described in the context of the
Query Tool (see “Stack Management” on page 287).
To create a Super Family combining two families (such as “domestic flights”
and “business traveler”), do the following:
Double-click on family ‘Domestic flight’. It is displayed in the stack pane.
Double-click on the family ‘Business travelers’. It is “pushed” on top of the
stack. Now you have two families on the stack that can be combined with
one of the operators.
In order to create a group of all business travelers on domestic flights, click
the AND operator. This operator “fetches” the two families from the stack
and creates the combined expression.
The stack now contains the query expression in prefix notation, the feedback
pane shows the infix notation of the query, which is better to read and
understand. The resulting items are displayed in the results pane.
ATLAS.ti 7.1 USER MANUAL
DATA ANALYSIS AND THEORY-BUILDING TOOLS
283
Figure 238: Creating a super family
In the results pane, those members of the families are listed (either PDs,
codes, or memos) that match the current query.
Click the SUPER FAMILY button to store the query as a Super family.
You are prompted for a name. Accept the default or enter a new name, for
instance “Business travelers on domestic flights”.
The new Super Family is displayed in the family browser with a red version of
the family icon. If icons are turned off, the list entry is colored red.
Possible Family Combinations
You can combine families in numerous and complex ways to form Super
Families. In the following section, some common combinations are presented.
Once you are familiar with the tool, you can venture out and try out more
complex combinations.
For the following descriptions of the four operators, looking at the Venn
diagram (see “Semantic Operators“) may be helpful.
The Super Family tool offers four operators that can be used to combine
families. The four operators are also known as Boolean operators: OR, XOR,
AND, and NOT.
ATLAS.ti 7.1 USER MANUAL
DATA ANALYSIS AND THEORY-BUILDING TOOLS
284
Combining two families with the OR operator yields those items that are
members of one or both families. Combining two families with the AND
operator yields only those members belonging to both families.
Combining two families using the XOR operator yields all members belonging
to any of the families less those that are in both families.
The NOT operator inverts an existing family. By negating a family female, you
could simply create a Super Family that, presumably, includes all males. The
NOT operator, as well as all other operators, does not only work on families
but also on Super Families or in arbitrary partial queries as in “NOT (A OR B)”.
Combining Families Using Boolean Operators
Combining families to build Super Families is essentially the same as
formulating code- and code family-based queries in the ATLAS.ti Query Tool.
The sequence of entering a query to create a Super Family is as follows: First,
select all families that you want to combine, and then select the operator(s):
Intended Query
What to click
Display in query feedback
pane
Members family A or
family B (or both)
Family A, Family B, OR (“Family A” | “Family
B”)
Members that
exclusively belong to
either family A or
family B
Family A, Family B,
XOR
(“Family A” || “Family
B”)
Members that belong
to both family A and
family B
Family A, Family B,
AND
(“Family A” & “Family
B”)
Members that do not
belong to family A
Family A, NOT
NOT “Family A”
Combining More Than Two Families
In order to combine more than two families, you can use a simple query to
build upon, or you can click it as one sequence. For the beginner, it is
recommended to build up to a more complex query step-by-step.
CREATING A COMPLEX QUERY STEP-BY-STEP
Let’s assume you want to create a Super Family containing all female
respondents under the age of 25, living in New York. This means you want to
generate a Super Family based on the overlap of the three families
gernder::female, age group::under 25, and residence::New York. We start by
combing the first two families “female” and “under 25”. If you had such
families, you would:
Double-click family “gender::female”.
Double-click family “age group::under 25”.
Select operator AND.
ATLAS.ti 7.1 USER MANUAL
DATA ANALYSIS AND THEORY-BUILDING TOOLS
285
The stack pane and the query pane now contain the following terms:
Figure 239: First step in building a more complex query step-by-step
The display in the query feedback pane matches more or less the way we
would express the query in everyday language. In the figure above, one item is
displayed in the stack, namely the query we just entered. We can now
incrementally build a more complex query from this query.
Double-click on the family “residence::New York”. This pushes the family
onto the stack, which now contains two items ready to be combined.
You can use the Happiness Stage II sample project to create your own
combinations based on the PD families that were imported with the survey
data. For example, you can try to create a super family that contains all
male respondents that have children and are married. This combination
applies to two respondents, P14 and P17.
Figure 240: Clicking a more complex query - step 2
The feedback pane always displays the item that is on top of the stack. The
topmost item on the stack has either been entered or is the result of applying an
operator.
ATLAS.ti 7.1 USER MANUAL
DATA ANALYSIS AND THEORY-BUILDING TOOLS
286
To yield all documents that match all three requirements: female, under 25,
and from New York, click the AND operator again.
The stack and query feedback pane now looks as follows:
Figure 241: Clicking a more complex query - step 3
If these are all the attributes that you want to combine, click on the Super
Family button. If you want to combine a fourth or fifth attribute, continue as
described above.
CREATING A COMPLEX QUERY AS A SEQUENCE
When creating a complex query in one sequence, the rule is to select all
families first, followed by the appropriate number and type of operators. Using
the same example as above, the sequence would be as follows:
Double-click on the family “gender::female.”
Double-click on the family “age group::under 25.”
Double-click on the family “residence:New York.”
Select the operator AND.
Select the operator AND again.
Further examples:
If you add the NOT operator to the above query, you have create a family
combination not containing female respondents, under the age of 25, living in
New York.
As an exercise: how would you create a family combination yielding males over
25 not living in New York?
Solution: Combine families “gender::female”, “age group::under 25” and
“residence::New York” using the OR operator, then negate using NOT. The
ATLAS.ti 7.1 USER MANUAL
DATA ANALYSIS AND THEORY-BUILDING TOOLS
287
resulting query looks like this: NOT ("gender::female" | ("age group:: under
25" | "residence:: New York"))
Another option is to click the sequence:
age group:: under 25
residence:: New York
OR
NOT
gender::male
AND
The resulting query looks like this: (NOT ("residence:: New York" | "age
group:: under 25") & "gender::male")
Create A Snapshot From A Super Family
Snapshots are
“hard-wired”
versions of super
families.
A snapshot creates a “hardwired” standard family containing the items derived
from a Super Family as its members.
Example: By creating a snapshot from Super Code family Chemistry, a new
(standard) family is created which includes all codes that the Super Family has
as its members at this time. While a Super Family reflects any changes in regard
to the members of any of its combined families, a snapshot will not change.
This is identical to creating snapshot from Super Codes.
Snapshots are a means to audit the process of your analysis. By comparing
Super Families with previous snapshots, you can see how and in which
direction your thoughts have developed.
To create a snapshot family, select a super family in a family manager. Then
select the menu option MISCELLANEOUS / CREATE SNAPSHOT.
By default the post-fix (SN + a consecutive number] is added to the name.
Figure 242: Super family and its snapshot
Additional Query Tool Functions
Stack Management
Several functions are available in pocket calculator style as a series of buttons.
Other functions can be activated by context menus opened in one of the list
panes.
ATLAS.ti 7.1 USER MANUAL
DATA ANALYSIS AND THEORY-BUILDING TOOLS
288
Figure 243: Query tool stack functions
Clear the complete term stack of expressions.
Swaps the two top elements of the stack. Use if you mix up the input order.
"Push" a copy of the topmost element onto the stack (in other words:
duplicate it). This is a useful feature if you need to replicate a complex
expression.
If you created new coding that affect the current query while the Query Tool is
open, you have to click RECALC to reprocess the query.
UNDO removes the topmost entry from the stack. This is convenient if you
clicked on the wrong code.
Redo pushes the last removed entry back onto the stack.
The functions above are also available from the context menu of the term
stack pane.
More Functions
Context Menus
Several context menus are available in the various panes of the Query Tool that
complement the functions available via the buttons. Most items in the context
menus serve an informational need.
The code family pane's context menu has a single command: Display Codes.
Figure 244: Context menu of the code family pane
Select to view the member codes of the selected code family.
The code pane's menu offers information about the selected code neighbors,
the term (i. e., query) if it is a Super Code, embedding, embedded and cooccurring codes.
ATLAS.ti 7.1 USER MANUAL
DATA ANALYSIS AND THEORY-BUILDING TOOLS
289
Figure 245: Context menu of the codes pane
The context menu for the term stack pane resembles the stack function buttons
described above.
Figure 246: Context menu of the term stack pane
The results pane’s menu offers information about the neighbors (codes, other
quotations, memos), embedding, embedded, or co-occurring codes of a
selected "hit." A further option offers the possibility to remove the selected hit
from the results list, to create a report or to create a PD family based on all PDs
included in the results.
ATLAS.ti 7.1 USER MANUAL
DATA ANALYSIS AND THEORY-BUILDING TOOLS
290
Figure 247: Context menu of the results pane
The last option is very useful in the search of patterns and typologies in your
data. It is also of good service when working with images as in a lot of cases
the image itself is the unit of analysis.
Co-occurrence Tools
The Cooccurrence Explorer allows to ask a different type of questions. Using
this tool, you can ask ATLAS.ti to show you all codes that co-occur across all of
your primary documents. The result is a cross-tabulation of all codes.
As compared to the Query Tool where the user has to determine and select
codes or code families and the appropriate operator, the Co-occurrence
Explorer by default looks for all codes that co-occur in the margin area
combining the operators WITHIN, ENCLOSES, OVERLAPS, OVERLAPPED BY
and AND.
Instead of cross-tabulating all project codes, it is often more meaningful to
apply filters for certain codes and documents in order to concentrate on a more
specific set of concepts. The output of the Cooccurrence Explorer can be
displayed in a tree view or as a data matrix. Below you see an example for
both.
How To Open The Co-occurrence Tools
Select ANALYSIS / CODE COOCCURRENCE TREE or CODE COOCCURRENCE TABLE.
The Co-occurrence Tree Explorer
When running the tree explorer, you only see the root objects when it opens.
Open the branches by clicking on the + sign to see the the cooccuring codes
on the first level and the associated quotations on the second level.
ATLAS.ti 7.1 USER MANUAL
DATA ANALYSIS AND THEORY-BUILDING TOOLS
291
Figure 248: Expanding to code and quotation level in the tree explorer
The same option is available for primary documents. If you expand the branch
for Primary Docs, you can see which codes have been applied to this PD.
Further, you can expand to the quotation level to look at the material coded
there.
In the above example, you can immediately see all answers given by female
blog writers about their thoughts why having children means less happiness.
In the section “Explaining frequency count and number of quotations listed“
on page 293 it is explained how to interpret the listed quotations. If you want a
count of the number of quotations that co-occur, you need to run the table
explorer (see below).
The Co-occurrence Table Explorer
The Co-occurrence Table Explorer in comparison to the Tree Explorer shows
the frequencies of co-occurrence in form of a matrix similar to a correlation
matrix that you may know from statistical software.
To produce such a table, select Analysis / CODE COOCCURRENCE TABLE.
Next you need to select the codes for the column and for the rows as shown
in Figure 249:
ATLAS.ti 7.1 USER MANUAL
DATA ANALYSIS AND THEORY-BUILDING TOOLS
292
Figure 249: Selecting row and column codes
The results are displayed immediately:
Figure 250: Results of a cooccurence query
Double-click on a cell, then the list of coded quotations opens. In case of
overlaps, the list shows two quotations for one cooccurence. This is further
explained in the section “Explaining frequency count and number of
quotations listed“ on page 293.
ATLAS.ti 7.1 USER MANUAL
DATA ANALYSIS AND THEORY-BUILDING TOOLS
293
Figure 251: Viewing the co-occurring quotations
Click on an entry to see the quotation displayed in context.
The entry n/a (= not applicable) indicates that the pair of codes does not
co-occur anywhere in the data material .
Explaining Frequency Count And Number Of Quotations Listed
The co-occurrence frequency does not count single quotations it counts cooccurrence „events“. If a single quotation is coded by two codes, this would
count as a single co-occurrence. In case of overlap, thus when each of the two
quotations is coded by one of the codes, this also counts as a single cooccurrence. In the cell drop down list you will find both quotations. The drop
down list will display an ordered list of all quotations for all co-occurrence
events for the pair of codes. In the following an example is shown an
explained:
Figure 252: Explaining the relation between frequency of coocccurence and number of quotations
ATLAS.ti 7.1 USER MANUAL
DATA ANALYSIS AND THEORY-BUILDING TOOLS
294
Quotation 3:248 and quotation 3:250 coded with “reasons fro nhc: being
there for otehrs” and “#fam: don't have children cooccur. Quotation 3:244
codes the entire blog, quotation 3:250 only a sentence within the post (see
figure 280 below). Thus, there are tow quotations, but only one co-occurrences
that are counted for the frequency count.
Toolbar
Figure 253: The Codes Co-occurrence Table toolbar
Cell Colors
Coloring helps in detecting co-occurrences. The following options are provided:
You can choose among three colors for the table cells: blue, red and green.
Figure 254: Set colors for table
cells
To select a different color, click on the color button in the tool bar.
All cells showing that a co-occurance exist are colored with the selected color
or none at all (see Figure 264). Different color intensities are used to indicate
the strength of the association. The higher the frequency, the lighter the color.
Figure 255: Three alternative colors and their shades
ATLAS.ti 7.1 USER MANUAL
DATA ANALYSIS AND THEORY-BUILDING TOOLS
295
Passive View
If you just want to get feeling for potential patters in your data, try the passive
view, which is a detached image that only shows colors.
Figure 256: Example of a passive overview as an aid to detect pattern
Data Export
RTF (QUALITATIVE)
You can either export a list of the co-occuring codes, or the list including
quotation IDs and names in form of an rtf file. The the full content of the
quotations cannot be exported as this potentially results in very large outputs.
To export the list of co-occuring codes, select CODES / OUTPUT / COOCCURRING
CODES.
Next you are asked whether to include the quotation lists (= ID plus name of
the quotation.
Next, select the output destination (Editor, File, Printer).
ATLAS.ti 7.1 USER MANUAL
DATA ANALYSIS AND THEORY-BUILDING TOOLS
296
Figure 257: List of cooccuring codes in rtf format
EXCEL (QUANTITATIVE)
You can either export the frequency counts of the c-coefficient. If the ccoefficient is activated, then the coefficient is included in the output; if not, the
Excel table shows the frequency of cooccurrence.
To create an Excel table of either the frequency counts of the c-coefficients,
click in the Excel button in the tool bar.
As output select destination File & Run.
Save the file and wait for Excel (OpenOffice Calc) to be opened. Confirm the
conversion of the data.
Clustering Quotations
If you want to count embedded quotations as only one count (compare
“Embedding Operators“ on page 264), select the Cluster Quotations button in
the tool bar (see left).
C-Coefficient
In addition to the frequency count a so called c-coefficient can be displayed.
You can display or hide it (see button to the left). The c-coefficient indicates
ATLAS.ti 7.1 USER MANUAL
Figure 258: Co-occurrence Table displaying c-coefficients
DATA ANALYSIS AND THEORY-BUILDING TOOLS
297
the strength of the relation between two codes similar to a correlation
coefficient.
The calculation of the c-coefficient is based on approaches borrowed from
quantitative content analysis (see Garcia, 2006). Thus, interpreting such a
coefficient is only meaningful with a sizable data set and not for an interview
study with 10 respondents. Given the possibility to work with survey data to
analyze open-ended questions, it however is a valuable addition to the other
more qualitative oriented analysis tools that ATLAS.ti provides.
The c-coefficient should vary between 0: codes do not co-occur, and 1: these
two codes co-occur wherever they are used. It is calculated as follows:
c := n12/(n1 + n2) – n12
n12 = co-occurrence frequency of two codes c1 and c2, whereby n1 and n2
are their occurrence frequency
What you may experience is the following:
• Out of range. The C-index exceeds the 0 - 1 range it is supposed to stay
with.
• Colored circles. Cells can have additional visual cues, e. g., a red, yellow or
orange circle.
OUT OF RANGE
The c-index (structurally resembling the Tanimoto and Jaquard Coefficient,
which are similarity measures) assumes separate non-overlapping text entities.
Only then can we expect a correct range of values.
However, ATLAS.ti’s quotations may overlap to any degree. Overlaps would
only then bear no problem if there wasn't any „coding redundancy“ (the ones
you can eliminate using the Coding Analyzer, see page 374 for further detail).
Let's look at a few scenarios.
Case 1: Two differently coded quotations overlap, we assume no more
quotations available. Let P1 be a textual document, q1 and q2 be quotations
and a,b be codes. q1 is coded with a, q2 is coded with b.
Figure 259: Out of range example 1
Using the formula: c := n_ab/(n_a + n_b) – n_ab, we get:
n_ab = 1 one co-occurrence of a and b
n_a = 1, n_b = 1 a and b each code exactly one quotation.
c = 1/(1 + 1) – 1 = 1
ATLAS.ti 7.1 USER MANUAL
DATA ANALYSIS AND THEORY-BUILDING TOOLS
298
Such a scenario results in the maximum co-occurrence of 1 !
Case 2: q1 is coded with both codes a and b, the overlapping quotation q2 is
coded with b.
Figure 260: Out of range example 2
n_ab = 2. q1 alone counts for a co-occurrence event and the overlapping
q1*q2 for another.
n_a = 1, n_b = 2
c = 2/(1 + 2) – 2 = 2!!
This results in a value of twice the allowed maximum. Thus, the C index is not
appropriate to correctly represent co-occurrence in redundantly overlapping
texts. If the c-coefficient exceeds 1, you need to do some cleaning up and
eliminate the redundant codes. ATLAS.ti currently does not correct such
redundancies automatically.
Correcting the redundant overlaps, could for example look like this:
Figure 261: Out of range example 2 normalized
We get three quotations. q1' coded with a and b, q1*2 coded with a and b,
q2' coded with b:
n_ab = 2, n_a = 2, n_b = 3
c = 2/(2 + 3) – 2 = 2/3 = 0.67
The result is within the allowed range and it correctly takes into account that of
the three possible co-occurrence events only two apply.
To detect and correct redundant coding, select TOOLS / CODINGS ANALYZER. See
page 374.
COLOR INDICATORS
In order not to present a misleading image, all cells displaying an out-of-range
number (> 1) are colored in yellow.
ATLAS.ti 7.1 USER MANUAL
DATA ANALYSIS AND THEORY-BUILDING TOOLS
299
Figure 262: Examples of yellow and red circle markers
Circles with different colors are painted into a cell's upper right corner when
certain conditions apply.
Red circle: When the c-index exceeds 1 (see “Out of range“ on page 297). In
addition to the red circle, the entire cell is highlighted in yellow.
Yellow circle: An inherent issue with the C-index and similar measures is that it
is distorted by code frequencies that differ too much. In such cases the
coefficient tends to be much smaller than the potential significance of the
cooccurrence. For instance, if you had coded 100 quotations with code
"depression" and 10 with "mother" and you had 5 co-occurrences:
n_dep = 100, n_mother = 10, n_dep-mother = 5
c = 5/(100 + 10) - 5 = 5/105 = 0.048
A c index of only 0.048 may slip your eye easily, although code "mother"
appears in 50% of all its applications with code "depression". Looking from
code "depression" only 5% cooccurr with code "mother".
If the ratio between the codes frequencies exceeds a certain threshold
(currently 5 but will be user definable in the future) the yellow light goes on in
the cell. So whenever a cell shows the yellow marker it should invite you to
look into the co-occurrences of this cell despite a low c-index.
When the mouse hovers over a cell with a yellow mark, a pop-up displays
the ratio of the two codes.
Orange Circle: The orange circle is simply a mixture of the red and yellow
conditions.
Preference Settings
The preference settings allow you to set the column and row header width and
to set the code colors as header background.
ATLAS.ti 7.1 USER MANUAL
DATA ANALYSIS AND THEORY-BUILDING TOOLS
300
Figure 263: Code Cooccurence Table settings
The following table shows how you can alternate the look of the table by
changing the settings:
Figure 264: Settings: No color for table cell; use code color as header background
An Example Query
Let’s take a look at the code-code matrix using the Happiness sample project. A
special code family as been prepared for this exercise that helps us to gain an
overview of the responses regarding the question why or why not having
children voiced by parents and non-parents. The family contains the two
attribute codes (#fam: has children and #fam: no children) plus all sub codes of
the two categories “reasons for having children” and “reasons for not having
children”.
First, set a family as filter to reduce the list of codes to select from:
From the main menu select: CODES / FILTER / FAMILIES: “for Quick Tour:
Coocurrence Example”. Or set this family as global filter in the side panel of
the Code Manager (Ctrl+Shift+Click).
ATLAS.ti 7.1 USER MANUAL
DATA ANALYSIS AND THEORY-BUILDING TOOLS
301
After setting a filter, all effected fields are shown in a pale yellow color.
Figure 265: Setting a code family as filter
From the main menu select ANALYSIS / CODE COOCCURRENCE TABLE.
Next you need to select which codes should be displayed in the rows and
which ones in the columns (see Figure 249):
Select the #fam: don't have children / have children and the blog entry codes
as columns and all other codes as rows.
Figure 266: Results of the example cooccurence query
The results of this analysis have been visualized in the two network view
“Reasons for having children” and “Reasons for not having children”. See
“Network Views“ on page 307 for further detail.
ATLAS.ti 7.1 USER MANUAL
DATA ANALYSIS AND THEORY-BUILDING TOOLS
302
Application
The two Co-occurrence Tools are very useful for many kinds of analysis. But
not all options make sense for all type of data. If you have a smaller data set
like a typical interview study with 10 to 20 respondents, then taking a look at
the frequency count for exploratory purposes is likely to provide some new
ideas and you may gain new insights. The c-coefficient is useful when working
with larger amounts of cases and structured data like open-ended questions
from surveys. If you use the c-index, pay attention to the additional colored
hints. As your data base is qualitative, the c-coefficient is not the same as for
instance a Pearson correlation coefficient and therefore also no p-values are
provided.
In any case, co-occurrence measures need to be clearly understood, not only
for the mechanical but also for semantic issues involved in their meaningful
interpretation (e. g., mixed application of codes with different level like broader
and sub terms). Furthermore, you need to be aware of the artifacts enforced by
a table approach like being reduced to a pairwise comparison. Higher order cooccurrences which would take more than two codes into account need more
elaborate methods.
References: Garcia (2004) http://www.miislita.com/semantics/c-index-1.html
Codes-Primary Documents Cross-Tabulation
Even though a bit hidden, a further analysis tool with an emphasis on
quantitative output is the CODES-PRIMARY-DOCUMENTS-TABLE. You find this option
under the ANALYSIS menu and under CODES / OUTPUT.
The table is available as internal report within ATLAS.ti in text format, or can be
exported to Excel. The internal report displays all PDs as columns and the codes
as rows.
The table contains either a frequency count for each code or code family per
document or document family, or a word count of the coded segments per
code and primary document.
A useful application is a comparison across different groups of documents for a
particular category of codes. Thus, you are likely to create such a table if you
have a certain research question in your mind. This will guide you to create the
code and PD families you need to construct your query.
Example Query
Based on the Happiness Stage II project that can be accessed via the Help /
Quick Tour menu, we can compare statements that express either a positive or
negative effect of parenting across different groups. For this purpose two code
ATLAS.ti 7.1 USER MANUAL
DATA ANALYSIS AND THEORY-BUILDING TOOLS
303
families grouping all codes about positive and negative parenting effects have
been created.
To open the tool, select ANALYSIS / CODES-PRIMARY DOCUMENTS TABLE from the
main menu.
Figure 267: Setting options for the Codes-Primary-Documents-Table
Select these two code families “Effects of parenting: positive” and “Effects of
parenting: negative” from the list. Either double-click on the items to move
them into the selection list, or click on the button with the arrows pointing to
the right.
•
•
•
•
•
Select the following documents and document families and move them into
the selection list:
P3: Belkin's parenting blog discussion
P5, the New York magazin blog discussion
survey respondents with children
survey respondents without children
survey respondents that answered the question about happiness with either:
“children bring happiness” or “children bring fulfillment”
On the right hand side of the window, set the options as shown in Error:
Reference source not found: Count: Quotation / Orientation: Codes –
Rows / Send report to: Excel.
Click on the button Create Report.
Before the table opens in Excel, you will be asked to convert the exported
results. Confirm the message.
ATLAS.ti 7.1 USER MANUAL
Figure 268: Formatted Excel output of a codes-primary-documents-table
DATA ANALYSIS AND THEORY-BUILDING TOOLS
304
Across all groups, we find more negative than positive statements.
Output Options
You can set the following output options:
To include the calculation of the row and column totals.
To include header information that provides information when the table was
created, by whom (currently logged in user), and which items where selected.
The table cells can either show the quotation count or word count per code or
code family.
You can decide whether the codes should appear in the rows or in the columns
of the table.
The report can be displayed in a simple text editor or in Excel. The text editor is
only suitable for small tables. The Web Browser option is not yet available in
Version 7.0.
Calculating Inter-Coder Reliability Using CAT
Some programs offer rudimentary forms of inter-coder reliability calculation
as an internal tool, but we have found CAT, a free external tool, to be an
excellent addition to ATLAS.ti. Being that it is free, very easy to use, closely
integrated with the ATLAS.ti data format and sports powerful functionality,
we rely on it as a useful add-on rather than reinvent the wheel.
The Coding Analysis Toolkit is a web based add-on tool to ATLAS.ti that allows
you to calculate inter-coder reliability for ATLAS.ti coded data.
You can access the tool via the following web site: http://cat.ucsur.pitt.edu/.
To use the tool, you need to register and create a user account. Privacy issues
are explained on the website. If you don't want to use CAT via their official
website, you can host your own version of CAT from the project source code.
CAT offers the following analysis options to compare the coding of two coders:
ATLAS.ti 7.1 USER MANUAL
DATA ANALYSIS AND THEORY-BUILDING TOOLS
305
Figure 269: CAT: Analysis options
The standard comparison allows you to either calculate a Kappa value or
Krippendorff's alpha. The Code-by-Code comparison shows you the data
content and thus offers a qualitative means of comparing coded data by
coders. The third options allows a comparison based on families.
Standard Comparison
Once the data is uploaded the tool for the standard comparison looks as
follows:
Figure 270: CAT comparison tool for calculating inter-coder reliability
Below you see an excerpt of a comparison results. The results show a perfect
match as two identical HUs only differing by author were merged.
ATLAS.ti 7.1 USER MANUAL
DATA ANALYSIS AND THEORY-BUILDING TOOLS
306
Figure 271: Result of an inter-coder comparison
Validation
In a less than perfect world, the coders will probably not agree one hundred
percent. Therefore CAT offers a validation function where the coders involved
can look at each coded segments, or only at those segments where the
agreement was unsatisfactory. This way, coders can discuss the results and
come to a better common understanding of what a a particular code means
Figure 272: Validation process: Checking for differences
and how it should be applied.
Further Resources
You find detailed tutorials on the CAT website:
• Quick start guide: http://cat.ucsur.pitt.edu/CAT_quickstart_final.pdf
• Instructions for preparing ATLAS.ti data for upload:
http://cat.ucsur.pitt.edu/uploadInstructions.aspx
• Video tutorial for preparing ATLAS.ti for upload:
http://www.screencast.com/users/stustu12/folders/Default/media/ffea5d5
4-2487-4535-9f79-71421910ec14
ATLAS.ti 7.1 USER MANUAL
DATA ANALYSIS AND THEORY-BUILDING TOOLS
307
Network Views
The word "network" is an ubiquitous and powerful metaphor found in many
different fields of research and application. Flow charts in project planning, text
graphs in hypertext systems, cognitive models of memory and knowledge
representation (semantic networks) are all networks that serve to represent
complex information by intuitively accessible graphic means. One of the most
attractive properties of graphs is their intuitive graphical presentation, mostly in
form of two-dimensional layouts of labeled nodes and links.
Figure 273: Example of an ATLAS.ti network view
In contrast with linear, sequential representations (e. g., text), presentations of
knowledge in networks resemble more closely the way human memory and
thought is structured. Cognitive "load" in handling complex relationships is
reduced with the aid of spatial representation techniques. ATLAS.ti uses
networks to help represent and explore conceptual structures. Networks add a
heuristic "right brain" approach to qualitative analysis.
Networks are
more than just
graphics!
Along with using networks for "mind mapping" and the visual design of
theoretical models, you can exploit the structural properties of code-networks
to enhance the retrieval of quotations. Using networks for retrieval purposes is
a well known technique in information retrieval. In that domain, a structured
sets of keywords is usually referred to as a thesaurus. This usage of networks
for semantic retrieval will be described at “Semantic Operators” on page 262 in
more detail.
Nodes And Links
The term “network” is formally defined within graph theory, a branch of
discrete mathematics. A network is defined as a set of nodes (or "vertices")
ATLAS.ti 7.1 USER MANUAL
DATA ANALYSIS AND THEORY-BUILDING TOOLS
308
and links. A node in a network may be linked to an arbitrary number of other
nodes.
The number of links for any one node is called its degree; e. g., a node with a
degree of zero is not linked at all. Another simple formal property of a network
is its order: the number of its nodes. You may make practical use of the degree
of nodes by using it as a sorting criterion in the codes list window. The column
‘Density’ in the Code Manager represents the degree of a code.
Directed And Non-Directed Links
Links are usually drawn as lines between the connected nodes in graphical
presentations of networks. Furthermore, a link between two nodes may be
directed or not. A directed connection is drawn with an arrow. With directed
links, source and target nodes must be distinguished. The source node is where
the link starts and the target node is where it ends: the destination to which the
arrow points. The terms connection and link are synonymous.
Figure 274: Examples of directed and non-directed links
Links are created either implicitly (e. g., when coding a quotation, the
quotation is "linked" to a code), or explicitly by the user. The latter option is
described in detail in this chapter.
Strictly speaking, code-quotation associations (“codings”) also form a network:
ATLAS.ti 7.1 USER MANUAL
DATA ANALYSIS AND THEORY-BUILDING TOOLS
309
Figure 275: Code-quotations links
But you cannot name these links, the code is simply associated with a quotation
through the act of coding. In a network view you can visualize these links. In
ATLAS.ti all unnamed links are referred to as weak links, all named links are
referred to as strong links.
Strong And Weak Links
Strong links – or “first class” links – are links based on relations. Strong links are
entities by themselves, with names, authors, comments, and other properties. A
strong link is only a link between a code and another code or a quote and
another quote.
Weak links are links that do not have individual properties, e. g., the links
between quotations and codes, between codes and memos, between a family
and its members.
Network Vs. Network View
The difference between a ‘Network’ and a ‘Network View’ is an important
distinction that is necessary to understand the way networks are handled within
ATLAS.ti.
An ATLAS.ti network is the set of all objects and their links inside the
Hermeneutic Unit (HU). It exists independently of any display-oriented
characteristics (layout, color, line width, etc.). It is the logical structure of the
HU's objects. It exists even before the first Network View is created.
Network View =
logical structure +
visual layout
A Network View is typically only a subset of this global structure of nodes and
links combined with an individual layout of nodes. It is like viewing the same
thing, i. e., the network, from different angles and with different pieces visible.
ATLAS.ti 7.1 USER MANUAL
DATA ANALYSIS AND THEORY-BUILDING TOOLS
310
Node Types
The user can manipulate and display almost all objects within the HU as nodes
in a network view: quotations, codes, code families, memos, memo families,
other network views, primary documents (PDs), and PD families. The following
discussion applies to all nodes regardless of their type.
See “Node Types” on page 313 further details.
Relations
ATLAS.ti allows you to establish named links to more clearly express the nature
of the relationships between concepts. With named links, you may express a
sentence like "a broken leg causes pain" by two nodes (the source node
"broken leg" and the target node "pain") connected with a named link
("causes" or "is-cause-of").
A default set of
relations is
provided. You
may define your
own.
The name of a link is displayed in the Network Editor as a label attached to the
link midway between the two connected nodes. Six pre-set relations - or link
types - are available in ATLAS.ti. These standard relations can be substituted,
modified, or supplemented by user-defined relations. The default relations are
listed in the table below. C1 and C2 are source and target nodes, respectively.
Relation
Label 1
Label 2
Width
Color
Formal Attribute
Layout Direction
C1 is-associated-with C2
==
R
1
Black
Symmetric
C1 is-part-of C2
[]
G
1
Black
Transitive
C1 is-cause-of C2
=>
N
1
Black
Transitive
C1 contradicts C2
<>
A
1
Black
Symmetric
C1 is-a C2
Isa
0
2
Black
Transitive
1
Black
Symmetric
1
Black
Asymmetric
C1 noname C2
C1 is-property-of C2
*}
P
Some of these characteristics directly affect the display of links, while others
affect processing (e. g., search routines, automatic layout). A link between
concepts is displayed in a Network Editor by a line with the relation’s label. You
can choose from three different labels (label 1, label 2 and the name used for
the menu when selecting a relation).
The “formal attribute” affects both the display and processing capabilities of a
relation. For example: All asymmetric relations are symbolized in the Network
Editor with an arrow pointing toward the target code. Symmetric relations are
displayed with an arrow at both ends.
A typical transitive relation is the is-cause-of relation: if C1 is-cause-of C2 and
C2 is-cause-of C3, it follows that C1 is-cause-of C3. Transitive relations also
enable the "semantic retrieval" (see “Semantic Operators” on page 262.
ATLAS.ti 7.1 USER MANUAL
DATA ANALYSIS AND THEORY-BUILDING TOOLS
311
The following properties are user-definable: the two labels and the menu text,
which can be used as alternative display options, the width and color of the line
linking two nodes, whether a link is directed or non-directed, and the preferred
layout direction. The preferred layout direction affects the layout of a network
when ATLAS.ti automatically arranges the nodes. See “Layout Procedures” on
page 337.
Link Vs. Relation
Relations are like
"styles" in a word
processor.
Changing the
style will change
all occurrences of
its usage, in this
case: the links
It is important to understand the difference between a relation (or a link type)
and the link itself: There is only one "is part of" relation, but potentially many
links using it. In the Network View below, the relation "consequence" is used
only once, while the relation “strategy” is used four times.
Another way to think of links and relations is to view links as instances of
relations. Links are well informed about the characteristics of relations, which
define their styles. If a characteristic of a relation is changed (e. g., line width,
color, symbol), these changes are propagated to all links using it.
Figure 276: Four links using two relations, “strategy” and
“consequence”
The Role Of Relations
It is useful to understand the role that relations play in the construction of a
theory. The concepts (codes) that are linked using relations represent aspects of
the problem domain under investigation. On the other hand, the relations used
to link these domain concepts are part of the methodology used to analyze the
phenomena. As important epistemological tools they constitute the main
questions that guide the development of a model or a theory.
Define your own
“epistemological
primitives.”
The "Grounded Theory" method of Glaser & Strauss uses relations like "isphenomenon, "is-context-of,” "is-consequence-of,” "is-condition-for,” "isstrategy-for," etc., to relate concepts found during the data-oriented open
coding phase.
In the analysis of argumentation structures, other relations are more suitable: e.
g., "is evidence of,” "is contradictory to,” "warrants," etc. A medical expert
ATLAS.ti 7.1 USER MANUAL
DATA ANALYSIS AND THEORY-BUILDING TOOLS
312
attempting to capture diagnostic knowledge would use, e. g., "is-symptomof,” and "is medication for.”
The Network Editor
The Network
Editor lets you
visually connect
codes and other
objects to create
semantic
networks or
hypertext webs.
The Network Editor offers an intuitive and powerful method to create and
manipulate network structures. It favors a direct manipulation technique: You
can literally "grab" codes, quotations, memos, or other objects using your
cursor and move them around the screen as well as draw and cut links between
them.
The following describes various methods available for creating and editing
Network Views.
Network View Characteristics
Network Views have certain important characteristics:
• Several different Network Views on the same network are possible.
• Network Views can be given names under which they are stored and
accessed inside the HU.
• Network Views can be commented.
• Network Views are displayed and edited in the Network Editor.
• Network Views allow individual layout of the nodes.
• As a node, a single object can be a member of any number of Network
Views, just like a code can be an element of more than one code family.
• An object, e. g., a specific code, can only appear once in any Network View.
Network Views allow for a flexible but logically consistent display of the
network of objects, so there are a few constraints to keep in mind:
If code A is linked to code B using the relation “is associated with”, then every
Network View that contains code A and code B will necessarily include the
relation“is associated with” between the two. Furthermore, as only one link
can exist between any two nodes at any given time, no Network View will
display any other relation between those two nodes.
If however, you want to link code A and B differently in a different network
view, then you need to work with “dummy or modifier codes”. These are
empty codes, i. e. you have not used them for coding, but you need them to
modify a relation.
ATLAS.ti 7.1 USER MANUAL
DATA ANALYSIS AND THEORY-BUILDING TOOLS
313
Figure 277: Using modifier codes for case-based network views
Node Types
The following object classes can be displayed and edited as nodes within the
Network Editor. The display characteristics of the nodes can be altered in a
variety of ways.
Codes As Nodes
Codes are probably the most prominent objects in ATLAS.ti networks. They
provide the main ingredients for models and theories.
Memos As Nodes
Memos in networks are often an important supplement to code networks.
Several theoretical memos can be imported into a network to map out their
relationship. The visual layout provides comfortable territory for moving from
memo to memo to read and contemplate each individually and the
relationship(s) between them.
When dragging a piece of text from a "drag-enabled" application (like MS
Word™) into a Network Editor, the text becomes a memo with an
automatically assigned title. The title can be renamed later.
Primary Documents As Nodes
PDs as nodes are useful sometimes, but in the presence of quotations may
clutter the view by myriad links. However, PDs as nodes make a nice graphical
content table for graphical primary documents. When selecting the option
DISPLAY/FULL IMAGE FOR PDS, "thumbnail" images of the PDs are displayed. This
option only affects graphical Pds.
Windows Explorer are used as standard icons for PD nodes (indicating the file
of the document):
ATLAS.ti 7.1 USER MANUAL
DATA ANALYSIS AND THEORY-BUILDING TOOLS
314
Figure 278: exampels
of PD node icons
Quotations As Nodes
Quotations and codes have one thing in common that is not true for the other
objects. They can link to each other (quotations to quotations and code to
codes) with fully qualified "first class" links using relations.
The inclusion of quotations in a Network View supports the construction and
inspection of hyperlink structures.
Figure 279: Display of quotations based on its
media format
Textual quotations can be included in a Network View by simply dragging a
piece of text from the PD.
ATLAS.ti 7.1 USER MANUAL
DATA ANALYSIS AND THEORY-BUILDING TOOLS
315
Families As Nodes
Families are a useful device to group codes, memos, or PDs that belong to one
concept. Instead of displaying all of the codes belonging to the concept, the
Code Family may be displayed.
Figure 280: Families as nodes
The links between families and their members are depicted by a dotted red line.
Network Views As Nodes
The node icon and label for network views:
Figure 281: Network view as node
Network Views as nodes allow the inclusion of Network Views in other
Network Views. The Network View’s context menu offers the option to open
the View in a separate Network Editor. This is also available via double-click
with Ctrl pressed.
Basic Network View Procedures
Creating Network Views
Two methods for creating Network Views are available. The first one creates an
empty Network View into which objects are imported in sequential steps. The
other method creates a Network View from a selected object and its neighbors.
ATLAS.ti 7.1 USER MANUAL
DATA ANALYSIS AND THEORY-BUILDING TOOLS
316
TO CREATE A NEW NETWORK VIEW
Select NETWORKS / NEW NETWORK VIEW from the HU editor's main menu or from
the drop down list offered by the Network button in the main toolbar.
Enter a name for the new Network View. A Network Editor opens.
Import nodes with any of the methods described in the section “ Nodes“
below.
TO OPEN A NETWORK VIEW ON AN OBJECT
A Network View for an object is created with a selected object and its
neighbors. Proceed as follows:
Open an Object Manager (e. g., the Code Manager), or the HU Explorer, or
righ click on an object in the margin area.
Select one or more objects with a left mouse click.
In Object Managers, you can click the network button. For an object selected
in the HU Explorer, select OPEN NETWORK VIEW from the context menu
A Network Editor opens with the selected object and its neighbors.
If multiple objects are selected, their neighbors are not automatically
included in the network view. You can import their neighbors in a
subsequent step.
The nodes are initially placed using the semantic layout procedure, but can be
rearranged manually.
More nodes can be added to this Network View using different techniques (see
“ Nodes” on page 316 for details).
Each time a network is opened on a selected object, a new Network View is
created. There is no need to save it, as you can easily display it at any time
following the steps above. If you rearrange the nodes and want to preserve
the new layout, or if you add or remove nodes, then you need to save it
explicitly (NETWORK / SAVE AS). Saved Network Views can be selected from
the pick list or the Network View Manager.
Adding Nodes To A Network View
There are several options available for including objects in a Network View.
VIA DRAG & DROP
From Object Managers, the HU Explorer or the margin area: You can add
nodes by dragging objects from Object Managers, the Network View Manager,
the Family Manager, the margin, or the HU Explorer into the Network Editor.
ATLAS.ti 7.1 USER MANUAL
DATA ANALYSIS AND THEORY-BUILDING TOOLS
317
Drag & drop gives you better control of the initial position of the imported
nodes.
Open the Network View to which you want new objects imported.
Open the manager(s) for objects (code list, memo list, etc.) that you want to
import into a Network View.
Select the node(s) you want to import into the Network View.
Drag the selected objects into the Network Editor.
Drag selections of a primary text: This method creates nodes from textual
quotations or new selections of text.
Open the PD that contains the text that you want to import into a Network
View.
Make a selection within the PD or select an existing quotation.
Drag the selected text into the Network Editor.
Release the mouse button at the position you want the new node to be
placed. If the selection was not already a quotation, a new quotation is
created and the quotation node is displayed.
Text dragged
from an editor or
other applications
becomes a memo.
Text dragged
from the PD pane
becomes a
quotation.
Drag text from other ATLAS.ti editors or other applications: This method allows
you to drag text from drag & drop-compliant applications like an ATLAS.ti
comment field or Word™ into a Network View Editor. Such text is converted
into a new memo and displayed as a node.
Open the application from which you want to drag selections of text into a
Network View Editor.
Mark the piece of text within the (other) application.
Move the mouse pointer over the selected text. The pointer changes its
appearance.
Hold down the left mouse button and drag the selected text into the
Network View Editor.
Release the mouse button at the position you want the new node to be
placed with its upper left corner. A new memo node is created and displayed.
VIA THE IMPORT NODES DIALOG
The Import Nodes window offers access to all available node types. The list
pane offers a context menu to select or deselect all displayed objects.
Choose NODES / IMPORT NODES from the Network Editor's menu. A window
opens, offering objects to be imported. Only objects that are not already
members of the present view are listed.
First, select the type of node you want listed in the list pane from the nodetype drop-down list.
ATLAS.ti 7.1 USER MANUAL
DATA ANALYSIS AND THEORY-BUILDING TOOLS
318
Figure 282: Import nodes window
Select the objects to be imported into the Network View.
Click Import.
The imported objects are placed along the upper left corner of the Network
Editor. You can either distribute them manually by moving each node with the
mouse, or you can place them automatically by (mis-)using the option LAYOUT /
SEMANTIC LAYOUT.
Selecting Nodes And Links
Selecting nodes is an important first step for all subsequent operations targeted
at individual objects within a Network View. Such operations have their
corresponding menu commands in the main menu of the Network Editor.
TO SELECT A SINGLE NODE
Move the mouse pointer over the node and left click.
All previously selected nodes are deselected.
TO SELECT MULTIPLE NODES - METHOD 1
Hold down the CTRL key on your keyboard.
Select a node as described above.
Repeat steps 1 and 2 for every node to be selected.
TO SELECT MULTIPLE NODES - METHOD 2 ("MARQUEE SELECTION"):
This method is very efficient if the nodes to be selected fit into an imaginary
rectangle.
Move the mouse pointer above and left to one of the nodes to be selected.
Hold down the left mouse button and drag the mouse pointer down and
right to cover all nodes to be selected with the selection marquee.
ATLAS.ti 7.1 USER MANUAL
DATA ANALYSIS AND THEORY-BUILDING TOOLS
319
Release the mouse button.
Linking Nodes
The links between nodes in a network are real connections between the
objects. Therefore, creating and removing links should not be regarded as
solely "cosmetic" operations. Links make permanent changes to the HU.
There are several ways to link nodes:
LINKING VIA DRAG & DROP
Select a node. A red dot appears on the top left corner of the node. Click on
the red dot with with the left mouse button and drag the mouse pointer to
the node that you want to link.
Figure 283: Linking nodes
Release the left mouse button on top of the node.
If you link codes to codes or quotations to quotations, a list of relation opens
consisting of the default relations plus the relations of the currently open
projects.
Figure 284: List of standard relations
ATLAS.ti 7.1 USER MANUAL
DATA ANALYSIS AND THEORY-BUILDING TOOLS
320
Figure 285: Selecting a relation to link two
code nodes
Select one of these relations. Now the two nodes are linked.
Figure 286: Two linked code nodes
The two nodes are now linked to each other. In case of a first-class link
between two codes or between two quotations, the relation name is displayed
either within the link line, above the line (rotated) or within a box.
To set the display options, select DISPLAY / LINK DISPLAY from the Network
Editor's menu.
Figure 287: Link Display options
TO LINK TWO NODES USING THE TOOLBAR ICON
Select a node in a network view and click on the Link button in the toolbar
(see left).
ATLAS.ti 7.1 USER MANUAL
DATA ANALYSIS AND THEORY-BUILDING TOOLS
321
A black line appears. Move the end on top of another node and left click.
If you link two codes to each other or two quotations, then a list of relations
pops up. Select one of the offered relations via a left click.
TO LINK TWO NODES USING MOUSE AND KEYBOARD
A quick way to
link two nodes.
Place the mouse pointer over the source node.
Hold down the SHIFT key on your keyboard.
Hold down the left mouse button and drag the mouse pointer to the target
node.
Release the left mouse button and the SHIFT key.
Select a relation (applies to code-code and quote-quote links only).
TO LINK MORE THAN TWO NODES
If more than one source node is to be linked with a target node, use the
following method.
Select the source nodes (see” To select multiple nodes - method 1“ on page
318).
Choose LINKS / LINK NODES from the Network Editor's main menu, or click on
the Link button in the toolbar.
Move the mouse pointer with the black lines to the target node and click the
left mouse button.
In case of code-code and quotation-quotations links, you are prompted to
select a common relation that applies to all links. You can modify the
relations later, if needed.
TO LINK CODE NODES USING THE LIST METHOD
Besides using the Network Editor for creating links between codes, you can also
use the "CODES / LINK CODE TO" option available from the main menu or the
code context menu.
Select the target code (i.e., the general, broader concept) in the Code
Manager.
Select CODES / LINK CODE TO: / CODES from the main menu.
Select the source code(s) from the multiple-choice list.
Select a relation that links the selected codes with the target code. If needed,
the relation can be modified.
An immediate effect of linking can be noticed when the Code Manager is
open: the ‘density’ counter for all linked codes is updated.
As a reminder, Density counts all direct links to other codes. For instance, if six
source codes are linked to one target code, the target code is incremented by
6; each source code is incremented by one.
ATLAS.ti 7.1 USER MANUAL
DATA ANALYSIS AND THEORY-BUILDING TOOLS
322
Using CODES / LINK CODE TO: From the HU Editor’s main menu, memos and
quotations may also be linked to codes. Memos can also be linked to other
memos, quotations, or codes via the menu option MEMO / LINK MEMO TO.
However, no specific relation can be selected to link memos to other
objects.
TO CREATE CODE-CODE AND QUOTATION-QUOTATION LINKS USING
THE OBJECT MANAGER
Codes and quotations can also be linked in the Code / Quotation Manager via
drag & drop.
Identify the target item in the Object Manager’s list pane.
Select one or more source items in the Object Manager’s list pane and drag
them to the target item in the same pane.
Select a relation from the list of relations.
Figure 288: Creating a Code-Code link in the Code Manager
This option is only available for codes and quotations in the Code and
Quotation Managers.
Selecting A Link
Only “first class” links can be selected. First class or “strong” links can only
exist between quotations or between codes. Selecting links is similar to
selecting nodes.
Move the mouse pointer onto the label of the link to be selected.
The mouse pointer changes its appearance.
Click the left mouse button.
ATLAS.ti 7.1 USER MANUAL
DATA ANALYSIS AND THEORY-BUILDING TOOLS
323
The selected link label will be displayed inverted. All previously selected
nodes/links are deselected.
Selecting links is a convenient way to cut or flip multiple links (see “Cutting
Links” on page 323).
Deselecting Nodes And Links
To deselect a selected node or link: Hold down the CTRL key on your keyboard.
Click on a selected node or link.
To deselect all nodes and links: Move the mouse cursor over the Network
Editor's background. Double-click the left mouse button.
Cutting Links
Several approaches to disconnecting previously linked nodes are available.
The first method works for all types of links and is useful when many nodes
linked to one other node are to be disconnected:
Select one or more nodes whose connections to another node are to be
removed.
Choose LINKS / CUT LINKS from the Network Editor's menu or click on the Cut
Links button in the toolbar.
Move the mouse pointer with the "rubber bands" to the target node.
Click the left mouse button
Alternatively:
Click on one or more link labels.
Choose LINKS / CUT LINKS from the Network Editor's menu or click on the Cut
Links button in the toolbar.
Or:
Move the mouse pointer over a link label.
Right click and choose CUT LINK from the context menu.
The latter two methods work on "first class" links only: code-code or quotequote ("hyper") links.
Modifying Links
The type of a link (e. g., its Relation) can be changed in the Network Editor.
Right click on a link label and select CHANGE RELATION from the context menu.
The relation menu pops up. Select a different relation.
ATLAS.ti 7.1 USER MANUAL
DATA ANALYSIS AND THEORY-BUILDING TOOLS
324
A very efficient way to manipulate first class links is offered by the Link
Managers (see “Link Management” on page 340).
Selecting Neighbors
Neighbors are the nodes linked directly to a node. Using this procedure
repeatedly selects a complete “connected graph”, which is a partial Network
View where every node has a path (either a direct link or via intermediate
nodes) to each other node.
To select neighbor nodes:
Select the initial nodes.
Choose NODES / SELECT NEIGHBORS from the Network Editor's menu, or press
CTRL-N on the keyboard.
To mark a complete connected sub-network, repeat the previous step until
all nodes within the partial Network View are highlighted.
Selecting Or Deselecting All Nodes
To select all nodes or deselect all selected nodes, select NODES / DE-SELECT ALL
NODES from the Network Editor’s main menu or press Ctrl-A on the keyboard.
INVERTING THE CURRENT SELECTION
To invert the current selection, press Ctrl-I or select NODES / INVERSE SELECTION
from the Network Editor’s main menu. This will select all unselected nodes and
deselect all previously selected.
Moving Nodes
By moving nodes to different positions, you can modify an initial layout created
by the automatic layout procedure.
For precision placement of nodes, use the node alignment options from the
network editor's tool bar, or Select LAYOUT / ALIGN:
ATLAS.ti 7.1 USER MANUAL
DATA ANALYSIS AND THEORY-BUILDING TOOLS
325
Figure 289: network view alignment tools
Do not forget to save the Network View (and the HU itself at the end of the
session) if you want to make the new layout permanent.
TO MOVE A SINGLE NODE
Move the mouse pointer onto the node to be selected.
Hold down the left mouse button.
Drag the selected node to its new position.
TO MOVE MULTIPLE NODES
Create a multiple selection of nodes as described above.
Hold down the CTRL-key and drag the selected nodes to their new position.
TO MOVE NODES WITH THE ARROW KEYS
Select one or more nodes using the selection methods described at “Selecting
Nodes and Links” on page 318.
Use the arrow keys in combination with the CTRL key to move the node(s) 1
pixel at a time in all four directions.
Ctrl-Z - Undo
node placements
To undo an erroneous placement, select NODES / UNDO POSITIONING or the key
combination CTRL+Z.
ATLAS.ti 7.1 USER MANUAL
DATA ANALYSIS AND THEORY-BUILDING TOOLS
326
Removing And Deleting Nodes From Network Views
‘Removing
Nodes’ will not
delete the objects
they represent!
The option
‘Delete Node,’
however, does!!
Removing nodes from the view simply takes the nodes out of a Network View.
The nodes remain in the HU. Removed nodes can be “re-imported” at any
time using the node import functions described previously. However, deleting
nodes results in the deletion of the objects they represent from the entire HU—
erasing codes, quotations, etc.! Be cautious when deleting nodes!
TO REMOVE NODES FROM A NETWORK VIEW
Select the nodes to be excluded from the view.
From the Network Editor’s main menu, choose NODES / REMOVE NODES FROM
VIEW or press Ctrl-Del on the keyboard. If you only want to exclude a single
node, you may also choose this option from the node’s context menu.
TO DELETE NODES FROM A NETWORK VIEW
Select the nodes to be deleted permanently from your HU.
From the Network Editor’s main menu, choose NODES / DELETE NODE.
Confirm the deletion process as it is a critical action. Deleting a node from a
network view means that you permanently delete this object from your HU!
This can be useful, when you have been adding new objects to a network
view for exploratory purposes. Use this option with care.
For this operation, no undo option is available. The only way to undo a false
deletion is to close the HU without saving it and to open the most recent
version or backup.
If you only want to exclude nodes from a Network View, do not select
DELETE NODE from the node’s context menu or DELETE ENTITIES from the main
menu. Select the REMOVE FROM VIEW option.
Node And Link Actions
Commands affecting selected codes or links are available via their respective
context menus. In addition, as described below, type-specific procedures are
activated when double-clicking a node.
ACTIONS VIA CONTEXT MENUS
All nodes and
links have context
menus.
Context menus can be activated on nodes and links. Dependent on the type of
the node or link selected, these menus will offer specialized options from which
to choose.
When the mouse pointer is over a node or a link, related information is
displayed in the status window of the Network Editor.
ATLAS.ti 7.1 USER MANUAL
DATA ANALYSIS AND THEORY-BUILDING TOOLS
327
Figure 290: The status bar displays information
about a node when moving with the mouse over
it
To open a context menu, move the mouse-pointer onto a node or link and click
the right mouse button.
Figure 291: Context menus
TO EXECUTE NODE ACTIONS PER DOUBLE-CLICK
Position the mouse pointer over a node.
Double-click the left mouse button
The table below describes the specific actions launched for the different node
types.
If a comment or a memo’s text pops up, you can click inside the pop-up
window to open a text editor.
Node Type
Double-Click Action
Codes
Displays the code comment (definition).
Memos
Displays the content of the memo.
ATLAS.ti 7.1 USER MANUAL
DATA ANALYSIS AND THEORY-BUILDING TOOLS
328
Quotations
Displays the full text of the quotation.
Primary Documents
Displays the comment for the PD.
Families
Displays the description/comment for the family.
Network Views
Displays the description/comment for the Network
View.
Hold down the Ctrl key to open this Network View in
another Network Editor
Saving A Network View
All links that you create are saved as soon as you save the HU file. You only
need to save a network view, if you want to preserve the layout, i. e. the way
you have arranged the nodes within the editor. If you do not save a particular
view, you can always open up a network view on an object again and ATLAS.ti
will arrange the objects according to the default or user-defined layout
directions. For first-class relations, the user can defined preferred layout
directions (see the section on the “The Relation Editors“ on page 342.
To save a specific layout you have created, select the menu option NETWORK /
SAVE AS.
Enter a name for the network view and click ok.
Accessing And Opening Existing Network Views
You can access saved network views via the network button that you find in
the top left corner of the HU editor underneath the main menu, or via the
Network View Manager, or via the navigation pane (see page 33).
VIA THE MAIN TOOL BAR
Figure 292: Opening an existing network view via the main
tool bar
Click on the network button in the main tool bar:
ATLAS.ti 7.1 USER MANUAL
DATA ANALYSIS AND THEORY-BUILDING TOOLS
329
Select a network and left-click to open it.
VIA THE NETWORK VIEW MANAGER
Select NETWORKS / NETWORK VIEW MANAGER.
Similar to the primary document manager, the network view manage also
offers a Tiles view with various preview sizes
Select VIEW / TILES and then VIEW / PREVIEW SIZE: JUMBO. Or try out other sizes.
Figure 293: Preview images of network views in the Network View Manager
In the network view manager you can enter a comment for each network to
describe it.
VIA THE NAVIGATION PANE
Open the navigation pane and select the network view tab:
Also here you have the option to display preview images:
ATLAS.ti 7.1 USER MANUAL
DATA ANALYSIS AND THEORY-BUILDING TOOLS
330
Figure 294: Accessing network views via the
navigation pane
Right-click and select Show Preview:
Figure 295: Preview images of network views in navigation pane
ATLAS.ti 7.1 USER MANUAL
DATA ANALYSIS AND THEORY-BUILDING TOOLS
331
Analytic Functions
IMPORT NODE NEIGHBORS
This method imports all direct neighbors of the selected nodes into the
Network View. This option is also available from the node's context menu.
Importing direct neighbors allows you to construct a connected Network View
step-by-step. (In a connected graph, there is always a direct or indirect path
between any two nodes.)
To import neighbors of selected nodes:
Figure 296: Import Neighbors sub menu
Select the node(s) whose neighbors are to be included in the Network View.
Right-click and select IMPORT NEIGHBORS from the context menu.
Import neighbors
can be undone.
Shortcut: CtrlShift-Z.
If you have mistakenly imported the wrong or too many node neighbors,
select NODES /UNDO IMPORT NEIGHBORS from the menu, or press the key
combination Ctrl-Shift-Z.
Import common Neighbors imports all directly linked objects. All other options
let you specifically select which objects you want to import. Below the options
for the various objects types are listed:
Quotations
• Import common Neighbors
• Import Codes
• Import Memos
• Import Hyperlinks
Documents / Codes / Memos
• Import common Neighbors
• Import Codes
• Import Memos
• Import Quotations
• Import Families
Families
• Import Neighbors (i.e. family members)
ATLAS.ti 7.1 USER MANUAL
DATA ANALYSIS AND THEORY-BUILDING TOOLS
332
CREATING CASE-BASED NETWORK VIEWS
Importing a document's codes neighbors allows to create case-based network
views. You can ask questions like: Which of the codes have been applied in
which document (and where do they not occur). ATLAS.ti automatically draws
light gray lines between codes and the primary documents.
The network view “Hyperlink web looking at sources of happiness” in the
Happiness Stage II sample project provides an example.
Figure 297: Example of a case-based network view
What can be seen is that statements that support the view that one is
personally responsible for one's own happiness are mainly coming from the
blogs (P3 and P5). They contradict the view that relationships might be a
source of happiness as well, which however is supported by scientific evidence
(P10).
Another example provided by the sample project is the network view “Survey
results for having / not having children by gender”.
IMPORT CO-OCCURRING CODES
For code nodes, there is a special import feature that exploits the spatial
relations of different codings. A code co-occurs with another if it has been used
to code quotations that are in close proximity: embedded, overlapping, or if
two or more codes are applied to the same quotation.
The proximity of coding applied to a text can also be exploited via the Query
Tool’s “co-occurrence” proximity operator. However, while the Query Tool
yields quotations for explicitly specified codes, the import function brings in
only the codes.
To import co-occurring codes:
ATLAS.ti 7.1 USER MANUAL
DATA ANALYSIS AND THEORY-BUILDING TOOLS
333
Select one or more codes in the Network Editor.
Choose NODES / IMPORT CO-OCCURRING CODES from the Network Editor’s menu.
Working With Filters In Network Views
In ATLAS.ti 7, filter settings do have an effect on network views. In previous
versions if you used the import cooccuring code options, all cooccuring codes
were imported. This resulted in pretty pictures but most often not in
meaningful results. Being able to work with filters turns the network function
into a powerful analytic tool.
Let's take a look at an example again based on the Happiness Stage II project:
To find out what people who have children and those who do not have
children think about sources of happiness, do the following:
Add the code “#fam: have children” to a new network view.
Set the code family “Sources of happiness” as global filter (see “Setting a
Global Filter“ on page 57)In the network view right-click on the inserted code and select the option
IMPORT COCCOURING.
Now only the “Sources of happiness” codes are imported. The links that you
see between the codes have previously been created manually.
Repeat the steps with the super code #fam: don't have children” and compare
the outcome. To create the network view shown in Figure 299, two separate
network views have been created at first. After the related codes were linked,
all codes were added to one network view.
Figure 298: Differences between parents and non-parents with regard to their views on sources of
happiness
ATLAS.ti 7.1 USER MANUAL
DATA ANALYSIS AND THEORY-BUILDING TOOLS
334
Use Global Filters To Fade-Out Objects
If you set a global filter and click on the filter icon in the Network View editor,
all objects that are not included in the filter are faded out. This is best
demonstrated by way of example in the figures below:
Figure 299: The full network view without active filter
ATLAS.ti 7.1 USER MANUAL
DATA ANALYSIS AND THEORY-BUILDING TOOLS
335
Figure 300: PD family filter is set: All quotations that are not from 2008 are faded out
In Figure 300 above the filter is set to the PD family “time period 2008” and
thus only those quotations are shown that occur in primary documents from
2008. All other quotations are faded out.
In Figure 301 below, the reverse is true. You see all quotations from documents
included in the PD family “time period 2009” and all other quotations are
faded out.
Figure 301: PD family filter is set: All quotations that are not from 2009 are faded out
ATLAS.ti 7.1 USER MANUAL
DATA ANALYSIS AND THEORY-BUILDING TOOLS
336
If you set other filters, e.g. a code family, then all but the codes of that family
are grayed out. This works for all filters in the same way.
Create Families From Network Views
You can create code, PD or memo families based on the nodes included in a
network view.
Select the nodes that you want to include in the family (see “Selecting Nodes
and Links“ on page 318).
From the network editor's menu, select the option SPECIALS / GENERATE FAMILY
and then the respective object type (code, memo or PD family).
Enter a name for the family and click OK.
Create Network Views From Code Families
It is also possible to create network views based on code families. A new code
will be created from the code family name and all member codes will be linked
via ISA relations.
Open the Code Family Manager.
Select a family and then the menu option FAMILIES / CREATE NETWORK.
A pop-up message informs you that a new code will be created and that all
member codes will be linked via ISA relations. Confirm this message.
Accept the default name for the new code or enter a new one and click Ok.
The newly created network view opens.
Figure 302: A network view created from a code family
ATLAS.ti 7.1 USER MANUAL
DATA ANALYSIS AND THEORY-BUILDING TOOLS
337
Layout Procedures
Two methods are available for the automatic placement of nodes.
Semantic Layout
Shortcut: CTRL-L
Places the nodes within the window using the semantic layout algorithm. This
algorithm tries to place the nodes into optimal positions using an invisible
matrix of default positions. It tries to place the nodes with the highest
connectivity into center positions.
By recursively applying the same method to the rest of the nodes using
neighboring positions of the first node placed, the algorithm tries to avoid
overlapping nodes and too many crossing links. However, calculating an
optimal solution is not possible in a reasonable amount of time.
The user can exert some control on this algorithm via the preferred layout
direction of the relations used for the links, e. g., links using the “is-a” relation
go from bottom to top, if possible. You can change the layout direction
manually using the Relation Editor (see “The Relation Editor” on page 342 for
details).
Figure 303: Before and after applying Semantic Layout to a Network View
The results of the automatic layout procedure are typically quite usable and
provide at least a good starting point for subsequent manual refinement of
nodes' placement. If you are not happy with the layout produced, you can
revert to the previous placement by using UNDO POSITIONING (Ctrl-Z).
Topological Layout
Ctrl-Z - Undo
node placements
This special layout procedure tries to create a linear list of nodes positioned
from the upper left to the lower right. This sequence is the result of a depth
first traversal of the graph. The algorithm tries to resolve as many constraints
between any two nodes so that a node with the least dependencies is made the
first node positioned in the upper left corner, and the node with the most
dependencies on other nodes is positioned in the lower right corner of the
Network Editor.
ATLAS.ti 7.1 USER MANUAL
DATA ANALYSIS AND THEORY-BUILDING TOOLS
338
Figure 304: A set of activities with local constraints
In the example above, the dependencies between several activities necessary to
get dressed are described by local constraints between the nodes. From these
local constraints, a global solution is generated: One correct way to get
dressed. The "is-cause-of " relation was used to describe constraints. The only
condition a relation must meet is that it has the "transitive" attribute.
You can restrict the topological layout option to just codes by holding down
the CTRL key when selecting the topological layout option; if you want to
restrict it to quotations only, hold down the CTRL+SHIFT key.
Figure 305: Topological sort always results in a linear, diagonal
placement of the nodes
Such algorithms are typically in use in project management software. You can
use a directed relation like "before" to represent time dependencies between
ATLAS.ti 7.1 USER MANUAL
DATA ANALYSIS AND THEORY-BUILDING TOOLS
339
events ("socks before shoes,” "shirt before tie,” "marriage before divorce")
and then compute a possible sequence of events.
Creating Output
Several output options are available for Network Views. The range is from
printing the layout (via copying to the clipboard in a variety of formats both
textual and graphical) and by saving a Network View to a file.
Printing Networks
Before printing a Network View the first time, you may prefer to set some
general options (include title, print border, etc.) (SPECIALS / PREFERENCES / PRINTING).
You can either print the entirety or part of a Network View.
Open the Network View and arrange all nodes to be printed.
If you want to print a selection of nodes only, select these nodes (for multiple
selection, hold down the Ctrl key).
Choose NETWORK / PRINT NETWORK VIEW from the Network Editor's menu.
In the Printer dialog window that opens, check "Selection" to print selected
nodes only.
If the size of the network view determined by the node layout exceeds a single
page, depending on current printer settings, scaling or multi-page print will be
offered as a choice.
Make your choice and the network view will be printed.
Network Views For Other Applications
COPY TO CLIPBOARD
The menu option NETWORK / COPY TO CLIPBOARD copies the network view to the
Windows clipboard. From the clipboard it can be included in Word or other
“foreign” documents. The Network View (all nodes or selected nodes only) is
copied to the clipboard in a variety of formats:
A textual description of the contained nodes (a node synopsis)
An Windows Enhanced Metafile for high quality graphics to be used in
reports. Depending on the processing capabilities of the target application,
results may sometimes be less than optimal.
A bitmap file that has more accurate layout and fonts, but less quality when
printed.
In other applications (Word, PowerPoint, etc) a selection or all of these formats
are offered via PASTE SPECIAL.
ATLAS.ti 7.1 USER MANUAL
DATA ANALYSIS AND THEORY-BUILDING TOOLS
340
SAVE NETWORK VIEW AS GRAPHIC FILE
You can save your Network View as a graphic file. You can insert this file into
reports, Word, PowerPoint, etc. Choose NETWORK / SAVE AS GRAPHICS FILE .
This function does not save the network as a reusable structure for import
to other HUs. To accomplish this, visit chapter “To export the code
network” on page 350.
When exporting your project in html format (see page 416), network views
by default need to be embedded in emf format. If you want to use a
different format, you can change the entry in the raw html file and choose
any other of the above listed formats.
Link Management
The Code-Link and the Hyper-Link Managers (see page 362) offer a very
efficient way to review and edit first class links (code-code links and quotationquotation link, also referred to as hyperlinks).
Links can be edited, flipped, and removed, and a Network Editor can be
opened on selected links, e. g., all nodes affected. A comment can be viewed
and edited for the selected link. Last but not least, and typical for all Object
Managers, links can be sorted by criteria such as the target or source object,
the relation used, etc.
Changes made to the links are immediately displayed in any Network Editor
that currently display the links.
The XML Explorer offers a number reports to export overviews and lists of the
links you have created (see “Working with Style Sheets“ on page 399.
The Link Managers
The two figures below show a Code Link Manager and a Network View
opened on two selected links. In the left figure the two links are selected and
Flip Link from the context menu is selected. The right figure displays the effect.
ATLAS.ti 7.1 USER MANUAL
DATA ANALYSIS AND THEORY-BUILDING TOOLS
341
Figure 306: Flipping two links in the Code-Link Manager
The search field allows you to search for a word or string of characters in the
source, relation and target column.
Via the tool bar you can open an editor to write a comment for a link, open a
network on one or more selected links, open the suited relation editor, deleted
one or more selected links or change the view option.
Figure 307: Link-Manager tool bar
ATLAS.ti 7.1 USER MANUAL
DATA ANALYSIS AND THEORY-BUILDING TOOLS
342
The Relation Editors
The two Relation Editors, one for code-code relations and one for hyperlinks
(quotation-quotation relations) allows the creation, display, and editing of
relations. Explicit relations can only be used when connecting codes to codes or
quotations to quotations. Connections between codes and quotations, memos
and quotations, memos and codes, and families and their members cannot be
named and specified by the user.
The relations editors already include a set of default relations. You can modify
these entries at any time, translate them to your language, change the labels or
the menu text, modify the line color, etc.
Figure 308: The Code-Code and the Hyperlink Relation Editors
Cosmetic and descriptive as well as structural aspects of relations can be edited
with the Relation Editor.
Cosmetics
Cosmetic aspects include the label used when displaying links in a Network
Editor; the menu text displayed when creating a connection; and the width,
solidity, and color of the line connecting the nodes linked with this relation.
Preferred Layout Direction
A more sophisticated “cosmetic” property is the preferred layout direction. By
using this relation characteristic, the user can assert some control on the
ATLAS.ti 7.1 USER MANUAL
DATA ANALYSIS AND THEORY-BUILDING TOOLS
343
automatic layout algorithm. Indeed, this option justifies the name “semantic
layout.”
Formal Property
The formal property associated with a relation has a cosmetic effect and it
controls the “procedural semantics” of the semantic operators in the Query
Tool. When you want to utilize the semantic operators (SUB, UP, SIB),
transitive relations need to be used.
Comment
As with all entities in ATLAS.ti, a comment can be attached to a relation. The
text entered as a relation comment is displayed within a Network Editor after
opening a context menu on a link, or when selecting DISPLAY RELATION.
Bear in mind that a comment written for a relation is different from a comment
written for a link. The comment for a relation is of a global nature and defines
the relation type: e. g., what is meant by the relation “is associated with.” A
link using this relation connects two specific codes. When writing a comment
for this link, the meaning is local and explains why two codes were connected
using this relation.
How To Edit Relations
The Relation Editor is available from the main menu NETWORK, or can be
launched from the Network Editor’s LINKS menu.
You can change the properties of relations. If these relations are already in use
by the currently loaded HU, changes will be stored along with the HU when
saving it.
Open the Relation Editor: NETWORKS / EDIT RELATIONS and select whether you
want to open the code-code or the hyperlinks relation editor.
In the list of relations, click on the relation to be edited.
Change any of the values.
Click on Apply.
If you open the Relation Editor from within a Network Editor, all changes are
“broadcast” to the editor and you see the changes in the display of the
affected links.
When opening the Relation Editor from the main menu, all but the
preferred layout direction settings are realized immediately in all currently
open Network Editors.
ATLAS.ti 7.1 USER MANUAL
DATA ANALYSIS AND THEORY-BUILDING TOOLS
344
How To Create New Relations
User-defined relations are only available for code-code or quotationquotation links. All other links use "hard-wired" relations (like the ones
between quotations and codes).
New relations are stored together with the HU in which they are used. When
starting ATLAS.ti, the default relations as defined in the file default.rel are
loaded. This file is located in the user system folder that can conveniently be
accessed via TOOLS / EXPLORER / USER SYSTEM FOLDER. When creating new relations,
it is suggested that you save these relations to the default.rel file. If desired,
different REL files can be created and loaded.
New relations can be created when linking codes or quotations, or
independently of any linking activity. In both cases, entries are created with the
Relation Editor.
Figure 309: Relations
When linking codes or quotations, select the option OPEN RELATION EDITOR
instead of one of the offered relations. Or, select NETWORKS / RELATION EDITOR
from the main menu.
In the Relation Editor, select the menu option EDIT / NEW RELATION.
Enter a short unique ID for the relation you want to create. The default are
capital letters, but it is not necessary to use capital letters. Just remember that
each relation needs a unique ID. Based on this information, ATLAS.ti ensures
that none of the relation is overwritten by any other relation.
Next, enter a label 1, a label 2, and a menu label.
ATLAS.ti 7.1 USER MANUAL
DATA ANALYSIS AND THEORY-BUILDING TOOLS
345
Figure 310: Display options for links in network views
In the Network Editor, you have three options to display the name of the
relation (see Figure 310). As a view option, you can either display label 1, label
2, or the menu label. If there is sufficient space in the network, you can select
to display the menu label, which is usually longer. Choose an abbreviation for
labels 1 and 2 as a display option when space is limited.
Choose a symbol for label 1, a short word for label 2 and a longer name for
the menu label. Or: enter nothing for label 1, an English language name for
label 2, and a label in your native language for the menu label.
The menu label equals the menu text. The text entered in the field ‘Menu
Label’ is used in the relation menu and as a label. In addition, the menu text is
also used when outputting networked codes in the form of quasi sentences
(CODES / OUTPUT / CODE HIERARCHY or CODE NEIGHBORS).
Next select the line style (width, color, solid or dashed).
If you wish, you can specify the preferred layout direction that is used to
automatically draw the picture when opening a Network View on an object.
The final attribute to enter is the "formal property" of the relation:
"transitive," "symmetric," or "asymmetric."
A transitive relation is a directed link like “is part of”, “ is reason for”, “is a”.
Both symmetric and asymmetric relations are non-directed links. An example of
a symmetric link is “is associated with”; “contradicts” is an example for an
asymmetric link.
Optionally, you can describe the newly created relation in the text pane at
the bottom of the Relation Editor.
In order to save the new relation, select FILE / SAVE from the Relation Editor
menu. A file dialog window opens. The suggested file name is default.rel.
It is recommended to use this file as your standard repository for relations. It is
possible to create different sets of relations by entering a new file name (see
Managing Relations“ below).
Create sets of
relations that
reflect your
methodology
Managing Relations
Using the Relation Editor, different sets of relations can be created and stored
in separate files (using FILE / SAVE RELATIONS). For instance, you could have a set
ATLAS.ti 7.1 USER MANUAL
DATA ANALYSIS AND THEORY-BUILDING TOOLS
346
of relations related to argumentation theory, or a set based on Grounded
Theory relations. When starting ATLAS.ti, the default relation set is loaded (i.
e., the file default.rel).
If you have created a new set and stored it in a new REL file, you need to load
it after starting ATLAS.ti. To do so, open the Relation Editor and choose FILE /
LOAD RELATIONS. This adds the new relation set to the already loaded default set.
If you want to delete relations from the default set, or from any newly created
set, select a relation in the Relation Editor and choose the menu option FILE /
DELETE RELATION. When you have removed all unwanted relations and want to
make the changes permanent, you need to save the set (select FILE / SAVE
RELATIONS).
Cosmetics - Network Display Properties
There are numerous options available to alter the appearance of nodes, links,
and even the background.
However, all settings created using the Display menu of Network Editor are lost
after closing the editor. If you want to change colors and fonts globally for all
Network Views, you need to change these settings under NETWORKS / PREFERENCES.
Colors
You can set the Network Editor's background and the color of nodes. Choose
DISPLAY / SET COLORS (or click on the color circle in the tool bar) and then one of
the options from the submenu. You are offered a standard color chooser dialog
from which to pick a color.
Figure 311: Set Colors sub menu
If you have colored your codes, you can display these colors either as node
label or as node color in a network view. To do so, click on the color circle in
the tool bar and select the appropriate option:
If you have used a dark color to color a code, then use the “High Contrast”
option to display the node label in white.
ATLAS.ti 7.1 USER MANUAL
DATA ANALYSIS AND THEORY-BUILDING TOOLS
347
Figure 312: Low and high contrast label display
The option Color by Denisity & Groundedness visualizes the coding and
modeling state of the codes. This mode affects code nodes only. Code nodes
are automatically assigned a color according to their groundedness and density.
Groundedness of a code (i. e., the number of associated quotations) increases
the yellow part of the node color (note “name of suspect” in the figure below).
Density (i. e., the number of links to other codes) increases the blue part
(“name of suspect: Cohen” is the winner in the figure below). In the Code
Manager, high-density codes are indicated in red, high frequency codes in blue.
This makes codes that are heavily or seldom used for coding or model building
easily identifiable.
This AUTO-COLOR-MODE has also an effect in the Code Manager in Details view:
Figure 313: Auto-color mode
The bars for groundedness and density are colored according to their
frequency.
You can also activated the the auto-color option under the Views menu in
the Code Manager.
Fonts
The font used for nodes and links can be set independently choosing DISPLAY /
SET FONTS from the Network Editor’s main menu.
ATLAS.ti 7.1 USER MANUAL
DATA ANALYSIS AND THEORY-BUILDING TOOLS
348
Display Of Nodes
Nodes can be displayed either in a flat or 3D-view, with rounded borders, with
or without borders, and a gradient shading.
To select any of the four options, click on the Display button shown below.
Figure 314: Display options for nodes
Resizing Nodes
Nodes can be individually resized.
Just left-click on a node and drag the node box into the desired position.
Node And Link Appearance
Under the Display menu of the Network Editor you find a large variety of
options to alter the display characteristics of nodes and links. Some of these
options affect all nodes regardless of their type. Other options change the
display of certain node types only.
NODE ICON
The node type icon can be switched on and off for all nodes by selecting the
menu option DISPLAY / USE NODE BITMAPS, or by pressing the key combination
CTRL-ALT-B. The small image used as a node icon increases the distinctiveness of
the nodes, especially when a mixture of node types exists in a Network View.
Nonetheless, when space runs low, you may prefer to switch off the icons.
A node can be displayed with a “3D” border, or with a drop shadow. To switch
between the 3D and the shadowed view, select the menu option DISPLAY /
DISPLAY NODES 3D or press the key combination CTRL-3.
NODE VERBOSITY
You have several options to control the amount of information displayed in a
node. Quotes can be displayed with just their ID or with the complete selection
of text they represent.
ATLAS.ti 7.1 USER MANUAL
DATA ANALYSIS AND THEORY-BUILDING TOOLS
349
Figure 315: Sub menu Quotation Verbosity
Of course, to decide which level of verbosity makes sense, you need to
examine how many nodes populate the Network View and the overall size of
the text.
To change the verbosity of quotes, select the menu option DISPLAY /
QUOTATION VERBOSITY.
Miscellaneous Network Procedures
Theory Transfer
Theory transfer
supports a
deductive
approach to
analyzing
qualitative data
and the
application of
"proven" theories
to other domains.
By "Theory Transfer" we mean the re-use of codes, relations, and code
networks produced in one project in subsequent projects.
Two different strategies are supported:
The re-use of a "flat" (unstructured) list of codes including names, code
definitions, author, date of creation and modification in other HUs.
The transfer of rich representations of codes (including the connections
between codes).
“FLAT” CODE MIGRATION
The first strategy--using unstructured code lists--includes the output of all or a
selection of codes from one HU into a file and the later import of this code file
into another HU. Step-by-step instruction is provided elsewhere (see
“Transferring Codes from Other Projects” on page 202).
The method of flat code migration is useful when working in teams and when a
code list is first developed on one computer. This way, other team members
can easily import the agreed upon list of codes into their HUs. Other potential
applications for this function include testing reliability, or starting deductive
structural theory work from scratch. When testing for reliability, a given code
base can be used on the same material by different authors.
SEMANTIC NETWORK MIGRATION
This method transfers a relatively complete "theory" into a new project. Like
the flat code migration method described above, two steps are necessary. First,
the network of codes needs to be exported and saved as an external file.
Second, this file is imported into a new HU (or an existing HU).
ATLAS.ti 7.1 USER MANUAL
DATA ANALYSIS AND THEORY-BUILDING TOOLS
350
TO EXPORT THE CODE NETWORK
Load the HU that contains the "theory" you want to migrate.
If needed set the code filter to contain only those codes to be processed in
the next step.
Choose PROJECT / EXPORT / CODE NETWORK from the HU Editor's main menu.
Enter a name for network file. By default, the name of the HU with the
extension NET is offered.
The file contains a textual description, which can be processed by the import
step described in the following directions.
TO IMPORT A CODE NETWORK
Load the HU into which the network of codes shall be imported.
Choose PROJECT / IMPORT /CODE NETWORK from the HU Editor's main menu.
Select a network file (extension .NET).
CONFLICT RESOLUTION
When importing networks into an HU that already contains networked codes,
the following internal strategy is applied to avoid conflicts: Existing codes and
links are not modified, inconsistent links are not created (e. g. direct cycles).
CLEANING UP
While the situation of importing homonyms is controlled by the conflict
resolution strategy, the system cannot automatically handle unwanted
synonyms. Especially when importing codes and networks created by others
into a non-empty HU, such synonyms (e. g., "man" and "mankind") might
clutter the name space of codes. You can clean up by merging the synonyms
(see “Merging Codes” on page 205).
SCALED THEORY TRANSFER
Clean up
synonymous
codes using the
Code Merge
procedure. The
essentials of
merging codes
have already been
described
elsewhere (see
“Merging Codes”
on page 205).
Besides the two strategies described above, you can use the HU merge
procedure to gain more control over what components are to be transferred.
Code lists with "rich" representations of codes can be extracted from a given
"theory template" HU; Network Views, memos, and/or PDs may be included.
This method also has the advantage that it is a "one-pass" procedure and there
is no need to create extra files containing the codes or networks to be
transferred. Unlike the Semantic Network Migration method described above,
it also allows you to assert more control over how conflicts with existing codes
and links are to be resolved.
For details please refer to “Merging Hermeneutic Units” on page 154.
MERGING CODES USING THE NETWORK EDITOR
Below we describe how merging codes can be accomplished in a Network
Editor.
ATLAS.ti 7.1 USER MANUAL
DATA ANALYSIS AND THEORY-BUILDING TOOLS
351
The figures below illustrate that the merging of two or more codes is not a
trivial task, because all of their references, links, and comments need to be
transferred to the target code in a consistent manner.
Using the network method is the "inverse" procedure of the list method
described earlier (see “Merging Codes Using the List Method” on page
205). Using the list method, you select the target code first. Then you
choose the codes to be merged. Merging codes in a network editor is the
inverse. You select the codes to be merged first and then you select the
target code.
TO MERGE CODES USING THE NETWORK EDITOR
Open or create the Network View that contains the codes to be merged.
Here: “effects of parenting: more stress / more burden / more expenses /
more work”. They should be merged into a more general code named:
“effects of parenting: more.... (neg)”.
Select all "source" codes to be merged into one target code. Make sure that
the target node is already visible in the Network Editor.
Choose NODES / MERGE CODES from the Network Editor's main menu.
Figure 316: Merging codes in a network view editor
Move the mouse to the target node and click the left mouse button.
After the merge: The four selected codes have been merged into the target
code"effects of parenting: more... (neg)".
The target node "inherits" all the references, i. e., quotations, links to other
codes and memos, and comments, into the incorporated node(s).
ATLAS.ti 7.1 USER MANUAL
DATA ANALYSIS AND THEORY-BUILDING TOOLS
352
Network Views As Graphical Tables Of Contents
If you use graphical PDs, you can use Network Views to display "thumbnails"
(small-sized copies) of these PDs. See for example Figure 297.
Create a new Network View by choosing NETWORKS / NEW NETWORK VIEW from
the HU Editor's main menu.
Change the size
of the thumbnail
images
Import some graphical PDs (see “ Nodes” on page 316).
From the Network Editor menu, choose DISPLAY / FULL IMAGE FOR PDS.
Rearrange the nodes in the Network View and save the network view.
You can configure the size of the thumbnails:
In the network view editor, select SPECIALS / PREFERENCES, tab: Nodes. The
standard width is set to 200.
Figure 317: Preference settings for thumbnail PDs
Change the width and click Apply. Close the Network Preferences window.
Hypertext
A network with text (or other media) as nodes is often referred to as a
hypertext. The original sequential text is de-linearized, broken down into pieces
that are then reconnected, making it possible to traverse from one piece of
data to another piece of data regardless of their original positions.
The procedures described so far have focused on the creation of code
networks. Direct linking of data-segments (quotations) to other data-segments
offers similar flexibility in choosing and defining relations. Almost all of the
editing functions described for code networks can also be used when
connecting two or more quotations.
Code-code and quote-quote links are the only types of network
connections that allow you to assign a name to the connection that appears
on the line or arrow that runs between the objects.
ATLAS.ti 7.1 USER MANUAL
DATA ANALYSIS AND THEORY-BUILDING TOOLS
353
Representing The “Rhetoric Of Text”
While a code offers fast access to sets of data segments, it defines only a
simple relation between them, namely equivalence.
Hyperlinks, which directly relate data segments, express more differentiated
relationships between quotations: contradiction, support, illustration, etc.
Figure 318: Hypertext captures the
macrostructure of a text
No code is needed to connect quotation Q1 with one that it contradicts (Q2).
Cross-references between text passages are very common even in conventional
media like books - just think of religious and juridical texts, literature, journals
etc. Footnotes and endnotes are another common deviation from the pure
linearity of sequential text. However, in conventional media, not much
navigational support is provided for "traversing" between the pieces of data
that reference each other.
Today's largest
hypertext system:
the World Wide
Web
Computer-related hypertext applications include, for example, online help
systems that display operational information in suitable small chunks (compared
to lengthy printed information), but with a considerable amount of linkage to
other pieces of information. A well-known hypermedia structure is the World
Wide Web with its textual, graphical and other multimedia information
distributed world-wide.
Benefits Of Hypertext
What are the advantages of direct connections between text segments,
compared to the traditional procedures of qualitative text analysis?
What Codes Cannot Do
Maybe we should ask a different question first: How can you express that
statement X in text A contradicts statement Y in text B, or how can you retrieve
all contradictory statements of a specific utterance if all you have is codes and
their associations with the data?
Pure classification
is not always
adequate
The "code & retrieve" paradigm, which is so prevalent for many systems
supporting the qualitative researcher, is not adequate for certain types of
ATLAS.ti 7.1 USER MANUAL
DATA ANALYSIS AND THEORY-BUILDING TOOLS
354
analysis. In formal terms, attaching codes to chunks of data creates named sets
of segments with almost no internal structure. This is not to say that
partitioning lots of text segments into sets is not useful. On the contrary,
classification leads to manageable amounts of segments that later can be
retrieved with the help of the attached code words. But this may not be the
only way you want to look at your data.
Hypertext makes
text-text relations
explicit
The concept of hypertext introduces explicit relations between passages. These
links have to be built manually and result from an intellectual effort. The system
cannot decide for you that segment x is in contradiction to segment y. But after
the work of establishing the links, you can make semantically richer retrievals:
"Show statements contrary to statement x." Hypertext allows you to create
different paths through the data you are analyzing. For example, you may
create a time line different from the strict sequence of the original text.
Graphical Hyperlink Maps
ATLAS.ti incorporates procedures for creating and browsing hypertext
structures. It allows for two or more quotations being connected using named
relations. Further, you can create graphical maps (using Network Views) to
make parts of your hyperspace accessible in a comfortable way. Hyperlinks may
connect quotations (textual, graphical, multimedia) across documents (intertextual links) or may link segments within the same primary document (intratextual links). The natural boundary for hyperlinks, like all structures in
ATLAS.ti, is the Hermeneutic Unit.
The hypertext Network View to the right displays quotations in maximum
"verbosity" set to "full text." Other node types can also be included in the
Network View, like the memo in the upper left corner.
ATLAS.ti 7.1 USER MANUAL
DATA ANALYSIS AND THEORY-BUILDING TOOLS
355
Figure 319: A network of quotations
General Procedures
STAR OR CHAIN CONNECTIONS
A hyperlink chain
connects
quotations
sequentially
When linking quotations, you have the option to create a “chain”, a “star” or
a combination of both. Below, a chain and star connection are illustrated.
Figure 320: A hyperlink chain
When creating this chain, the quotation 2:3 served as a source quotation and
was linked to the target quotation 3:5. In order to continue the chain, the
target quotation 3,5 became the source quotation and was linked to the new
target quotation 8:7..
A hyperlink star connects many quotations from one source quotation:
ATLAS.ti 7.1 USER MANUAL
DATA ANALYSIS AND THEORY-BUILDING TOOLS
356
Figure 321: A hyperlink start
When creating a star, there is one source quotation and multiple target
quotations. In the above example, the source quotation is 8:6, which is linked
to five target quotations via a number of different relations.
Hyperlinks In The Quotation Manager
In list views,
linked quotations
are prefixed with
angle brackets.
All hyper-linked quotations can easily be recognized in the Quotation Manager.
All source quotations are marked with an opening angle bracket <, all target
quotations with a closing bracket >. If a quotation is both, source and target (as
the case when creating chains), then both brackets are used as prefix <>.
Figure 322: List of linked quotations
ATLAS.ti 7.1 USER MANUAL
DATA ANALYSIS AND THEORY-BUILDING TOOLS
357
Hyperlinks In The Margin Area
The margin is an
optimal work
space for
navigating
hyperlinks
When working with hyperlinks, it is advisable to set the margin display options
as follows:
Figure 323: Display of hyperlinks in the margin area
To open this context menu, right click on a blank space in the margin area.
Creating Hyperlinks
ATLAS.ti offers a variety of options for creating and traversing hypertext links.
Similar to the linking of codes, you may create hyperlinks in a the Network
View editor (see “Linking Nodes“ on page 319). In addition, hypertext links
can be created "in context", or via Drag & Drag in the Quotation Manager and
in the margin area.
Creating Hyperlinks Using The Context Menu
TO CREATE A CHAIN:
Select a data segment as source or an already existing quotation.
Right click on the selection or the quotation and select the option CREATE LINK
SOURCE from the context menu. Alternatively, you can click on the Source
Anchor button in the primary document toolbar.
Select a target segment or an existing quotation as target, right click and
select the option CREATE LINK TARGET from the context menu. Alternatively, you
can click on the Source Anchor button in the primary document toolbar.
If you select a data segment as source or target that was not yet a
quotation, ATLAS.ti automatically creates a quotation from it.
A list of relation pops up. Select a relation to link the two selected quotations.
If none of the existing relations fit, create a new relation by selecting OPEN
RELATION EDITOR (see “How to create new relations“ on page 344).
ATLAS.ti 7.1 USER MANUAL
DATA ANALYSIS AND THEORY-BUILDING TOOLS
358
Figure 324: Select a relation to link
the source with the target quotation
Next, select the option CHAIN: ….. to link a next data segment to the current
target quotation.
Figure 325: Select "Chain: Set target x:x as source" to link
another quotation to the current target quotation
Select QUIT LINKING to end the chain.
TO CREATE A STAR:
Proceed as explained above “To create a chain:“, but select the option Star:
Leave x:x as source. Then the next quotation is linked to the current source
quotation. For your information, the quotation IDs for the current source and
target quotations are listed in the menu.
Creating Hyperlinks In The Quotation Manager
This method can be applied to connect one or more existing quotations to one
target quotation.
• Select one or more source quotations in the Quotation Manager (multiple
selections can be done in the standard way).
• Hold down the left mouse button and drag the quotation(s) to a target
quotation in the Quotation Manager.
ATLAS.ti 7.1 USER MANUAL
DATA ANALYSIS AND THEORY-BUILDING TOOLS
359
• Release the left mouse button. The Relation menu opens and you can
specify the relation to be used for the hyperlinks.
• The new hyperlinks are then created.
Figure 326: Select quotations, drag and click target quotation in the Quotation Manager
Creating Hyperlinks In Margin Area
Like the method described above, creating hyperlinks in the margin area is best
suitable for connecting two quotations that are in close proximity to each
other.
Select a quotation bar in the margin area.
Hold down the left mouse button and drag the bar onto another quotation
bar.
Release the left mouse button. The Relation menu opens. Select a relation.
The linking procedure ends here.
Dropping a bar onto another quotation displayed alongside a bar, replaces
the existing hyperlink.
Utilizing The Multi-Document View For Hyperlinking
The multi-document view makes it easy to set hyperlinks.
Load two documents side-by-side.
Left click a quotation bar in the active region, drag the mouse to a quotation
bar in the same or a neighboring region, release the left mouse button and
select a relation (see Figure 327 below).
ATLAS.ti 7.1 USER MANUAL
DATA ANALYSIS AND THEORY-BUILDING TOOLS
360
Figure 327: Creating hyperlinks across regions
If you double-click on a hyperlink, a window pops up providing information on
the linked quotation and you can click inside to visit this quotation. Or use the
short-cut Ctrl + double-click to immediately jump to the linked quotation.
ATLAS.ti loads the document containing the linked quotation into the
neighboring region and you can view the linked segments side-by-side (see
also “Traversing Hyperlinks“ on page 361.
Modifying Hyperlinks
There are two place to modify existing hyperlinks, the Network Editor and the
Hyperlink Manager (see “Link Management” on page 340).
TO MODIFY LINKS IN THE NETWORK EDITOR
Open a network view on a hyperlinked quotation (e. g., by right clicking on a
quotation and then selecting the option OPEN NETWORK VIEW from the context
menu).
In the Network Editor, right click on a link label and select CHANGE RELATION
from the context menu.
The relation menu pops up. Select a different relation.
Defining New Hyperlink Relations
The procedure for defining or editing hypertext relations is equivalent to the
methods described for editing code-code relations. You may either define a
new relation by choosing the bottom option from the list of relations when
actually creating a link, or you may use a hyper-links relation editor, that is
ATLAS.ti 7.1 USER MANUAL
DATA ANALYSIS AND THEORY-BUILDING TOOLS
361
identical to the code-code relations editor (see “How to create new relations“
on page 344). Newly defined or edited relations must also be saved to disk.
Traversing Hyperlinks
Media-type quotations can be distinguished easily by their icons. These icons
may be used in the margin area, the Object Manager, the HU Explorer, the
Crawler, and in Network Views. The figure below shows the media types of
hyperlinked quotations in the margin. From top to bottom these are: text,
video, audio, image and Google Earth hyperlinks.
Figure 328: Media types for hyperlinks
TO TRAVERSE HYPERTEXT LINKS USING THE MARGIN AREA
The margin area
permits a very
intuitive traversal
of hyper links.
Switch on the margin area.
If needed, open up the properties context menu in the margin area and
select OBJECT TYPES / HYPER-LINKS.
Double-click a hyperlink displayed in the margin. The quotation to the left of
the margin area is highlighted and a pop-up window displays the hyperlink's
contents.
Figure 329: Traversing hyperlinks
ATLAS.ti 7.1 USER MANUAL
DATA ANALYSIS AND THEORY-BUILDING TOOLS
362
To display the hyperlink in context, click into the pop-up window. Clicking
outside the pop-up window cancels the process.
You can also use the short-cut Ctrl + double-click to immediately jump to
the linked quotation.
Useful Options For Hyperlinks And Quotations In The Network
View Editor
To move to the text of a quotation that appears in a network, right click over
the quotation node and choose DISPLAY IN CONTEXT. You are moved to the section
of the Primary Document where the quotation resides.
TO IMPORT THE NEIGHBORS OF A QUOTATION
Remove all
recently imported
objects with
CTRL+SHIFT+Z
The Network Editor lets you import the neighbors of selected nodes by
choosing IMPORT NEIGHBORS from the Network Editor's NODE menu (see
description in section “Import Node Neighbors” on page 331). Importing the
neighbors of a quotation, that is part of a hypertext, not only retrieves linked
objects of type "quotations" but also yields all codes, memos and other
quotations directly connected to it.
To reduce clutter by only importing neighbors that are quotations, and not
codes, memos or documents, hold down the CTRL key when selecting the
option from the Network Editor's menu. If you want the neighbors of only
one quotation imported, open the context menu of this quotation and
choose IMPORT NEIGHBORS.
The Hyper-Link Manager
The Hyper-Link Manager works exactly like the Code-Link Manager, only that
it is populated by hyperlinks.
ATLAS.ti 7.1 USER MANUAL
DATA ANALYSIS AND THEORY-BUILDING TOOLS
363
Figure 330: Hyperlink Manager
When double clicking a link a pop-up menu is shown. You can choose to
display the source or target quotation. The content of the linked quotation is
then shown in a pale yellow window. If you click into this window, the linked
quotation is shown in context.
Use the XML Explorer to create a report of your hyperlinks (see “Working
with Style Sheets“ on page 399.
CREATING NEW RELATIONS FOR HYPERLINKS
The Relation Editor has already been discussed in the context of code-code
links (see “The Relation Editors“ on page 342). The relation editor window for
hyperlinks looks the same and can be handled in the same way as the relation
editor for code-code relations. It only displays a different set of relations. To
open it, select NETWORKS / EDIT RELEATIONS / HYPERLINK RELATIONS from the main
menu.
Editing Hyperlink Comments
Use the margin
area to display
and edit link
comments.
The links between quotations use fully qualified relations, like the links between
codes and unlike the simple association between a code and a quotation. As
“first-class” objects, these links can be assigned a dedicated comment.
Such a comment could explain why quotation A has been linked to quotation
B. Link comments can be accessed, displayed and edited from three locations:
the margin area, the Hyperlink Manager and the Network Editor.
The margin area has the advantage that it is readily available during scrolling
through the primary documents. The Network Editor method offers a visual
approach to accomplishing this goal. Create a network view of the hypertext
nodes to facilitate this process.
ATLAS.ti 7.1 USER MANUAL
DATA ANALYSIS AND THEORY-BUILDING TOOLS
364
TO EDIT A HYPERTEXT LINK COMMENT USING THE MARGIN AREA
Switch the margin area on. If not already selected, open up the properties
context menu in the margin area and select OBJECT TYPES / HYPERLINKS.
Pop-up the context menu for a hyper link displayed in the margin. The
quotation inside the primary document pane is highlighted at the same time.
Choose EDIT LINK COMMENT.
Figure 331: Commenting on a link
TO EDIT A HYPERTEXT LINK COMMENT USING THE HYPERLINK MANAGER
Open the Hyperlink Manager via NETWORKS / HYPER-LINK MANAGER from the HU
Editor’s main menu.
Select a hyperlink.
Edit the comment in text pane below the link list, or open a text editor by
clicking the Editor button.
ATLAS.ti 7.1 USER MANUAL
DATA ANALYSIS AND THEORY-BUILDING TOOLS
365
Figure 332: Writing, viewing or editing a hyperlink comment in the Hyperlink Manager
TO EDIT A HYPERTEXT LINK COMMENT USING THE NETWORK EDITOR
Open a Network Editor on a quotation establishing one end of the hypertext
link.
Move the mouse pointer onto the link between two quotations and open the
context menu with a right mouse button click.
Choose EDIT COMMENT.
Figure 333: Editing a hyperlink comment in a network view editor
ATLAS.ti 7.1 USER MANUAL
SPECIAL TOOLS
366
Special Tools
In this chapter a collection of miscellaneous tools is presented that do not fit
well under any of the other categories. Included are tools for performing word
searches in all objects and fields, for exploring the components of a HU in a
hierarchically manner, and for removing redundantly coded quotations.
The Object Crawler
Use the Object Crawler to search for text and patterns in HUs, PDs, and all
other entities that make up an HU. The search can be restricted to certain
facets, like name, author, date, comments, and content. Regular expressions
(GREP) as well as Category Search can be used as search expressions (see
“GREP Search” on page 215 and “Category Search” on page 212).
Unlike the Text Search tool, the Object Crawler can search through all objects
and fields that contain text. The Text Search tool only searches primary text
documents. However, it finds all occurrences of the entered search term(s) and
highlights a match at its original location. The Object Crawler stops at the first
occurrence in an object and highlights the hit in the results pane of the Object
Crawler window.
How To Use The Crawler
A Crawler search is a three-step procedure starting with entering a query and
specifying the scope (e. g., name, comment, etc), and then selecting the object
classes to be included in the search and, as the third step, displaying the results.
From the main menu, select TOOLS / OBJECT CRAWLER, or click the Object
Crawler button in the main toolbar.
The Object Crawler dialog starts with a page to enter the query and specify the
scope:
ATLAS.ti 7.1 USER MANUAL
SPECIAL TOOLS
367
Figure 334: First step in defining a query in the Object Crawler
Enter a query. Regular expressions and search swarms can be used (see
“GREP Search” on page 215 and “Category Search” on page 212)
Select the fields that should be search, the so called Search Scope.
Click the Select Objects tab to proceed to the next step:
Figure 335: Step 2: Select the objects to be searched
Select the objects to be included in the search. Clicking All objects checks all
other check boxes.
Proceed with the next and last step by clicking the Display Results tab.
All objects for which a corresponding match has been found are displayed in
the upper list pane. The Field column displays the object type in which the
match appeared. The selected hit – a PD - in the figure below had its match
within the content of the PD. The hit itself is emphasized by red-colored font
and with angle brackets for easy detection.
ATLAS.ti 7.1 USER MANUAL
SPECIAL TOOLS
368
Figure 336: The Object Crawler's result pane
The results list can indeed be used like an Object Manager in a variety of ways:
Double-clicking a hit in the results list activates the object. For instance, doubleclicking a quotation displays it in context in the PD pane.
The list is also drag & drop capable: you can drag objects from the list into a
Network Editor or into a Text Editor.
The HU Explorer
Although the structures that can be created with ATLAS.ti are not necessarily
restricted to hierarchical trees, the ATLAS.ti HU Explorer provides a hierarchical
view of the HU and all of the objects that it references. All objects can be
viewed in the Object Explorer. More specific views are provided by the Code
Tree, The Code Forest and the Cooccurence Explorer.
Main purpose of the HU Explorer is to serve as a hierarchical content table,
which may be used to navigate between the different parts of the HU. Unlike
the “pure” Object Managers that display only one type of object, the HU
Explorer allows an integrated and structured display of all heterogeneous
objects that make up an HU. These are PDs, quotations, codes, memos,
families, and networks. The display, though, is not strictly hierarchical. You will
notice some redundancy when expanding the tree view. For instance,
quotations are listed under each PD. As PDs can also be members of PD
families, their quotations appear there as well.
The HU Explorer can be launched by clicking on the HU Explorer button in
the main toolbar or by selecting TOOLS / HU EXPLORER from the main menu.
You can select among four options:
ATLAS.ti 7.1 USER MANUAL
SPECIAL TOOLS
369
Figure 337: HU Explorer options
The Code Forest and Code Tree (see page 374) are sub views of the Object
Explorer and thus are not explained in the same detail. Both allow drag-anddrop coding. See “Using the HU Explorer for Coding“ on page 372.
As the code tree provides a hierarchical view of one code only, the Code
Tree can only be opened if a code is selected.
You find more detail on the Coocurence Explorer in the section “The Cooccurrence Tree Explorer“ on page 290.
The Object Explorer
The upper pane displays the tree-structured contents of the HU. The text pane
below displays the comment that is associated with the activated object.
The root object of the tree is, of course, the HU itself. The direct branches from
this root are: Primary Docs, Codes, Memos, Primary Doc Families, Code
Families, Memo Families, and Network Views.
Figure 338: The Object Explorer
ATLAS.ti 7.1 USER MANUAL
SPECIAL TOOLS
370
Expanding And Collapsing Branches
You can expand and collapse the branches of the HU Explorer tree. If a branch
can be expanded, a plus sign is displayed to the left of the object, unless this is
switched off via VIEWS / HAS BUTTONS. Expanded branches are indicated by a
minus sign. You can expand or collapse a branch with a mouse click on the plus
or minus sign. Below a partly expanded branch for a network view is shown.
Figure 339: Partly expanded branches for a network view
Expanding the Primary Docs branch displays the PDs; expanding this branch
displays quotations, expanding those displays codes, memos, and other
associated quotations.
Expanding the Codes branch displays all codes and their connections to other
codes. Following the code names, the semantic relation connecting the code
with its parent code is shown.
Each code appears at least once. This means that all codes are listed directly
under the “Codes” branch, but may also appear further down in the hierarchy
if they are connected to other codes. The order in the hierarchy is determined
by the kind of relation you have used. If a directed, i. e. a transitive relation like
the <is part of> relation was applied, codes are displayed hierarchically: the
target code becomes the higher order code and the source code(s) the lower
order code(s).
ATLAS.ti 7.1 USER MANUAL
SPECIAL TOOLS
371
Figure 340: Display of codes that are linked via transitive relations
When using symmetric relations, the codes appear in at least two places since
the direction/causal relation cannot be determined.
Figure 341: Display of codes that are linked via symmetric or asymmetric relations
Associated memos (if applicable) are displayed under the code branch.
Expanding Super Codes allows access to the various parts of a query. Below
you can see the expanded branch for the Super Code “name of suspect: Cohen
– Reasons for being suspected” (see figure 342). When double-clicking on the
entry Co-occur, the two codes that are part of the query are displayed. Clicking
the plus sign to expand the tree shows all associated codes: the six codes that
were linked to the code *name of suspect: Cohen” and the eight member
codes of the code family “Reason for being suspected”.
Figure 342: Display of super codes
Expanding the Memos branch displays all memos and then the memos
associated with other memos. On the next level, all associated codes are
shown.
When expanding the Family branches, on the first level all existing families are
shown. On the next level, all members are displayed. Below the members, all
objects that are usually associated with the type of object can be expanded (i.
e., as described above: quotations underneath PDs, codes connected to other
codes, and so on).
ATLAS.ti 7.1 USER MANUAL
SPECIAL TOOLS
372
In case you have created Super Families, the operators used to build up the
super families are also shown. When clicking on an operator, only the
corresponding family members are shown, as explained above for Super Codes.
Expanding the Network Views branch shows the existing networks on the first
level, and all objects contained in the Network Views on the next level. On the
levels below, the usual elements as described above for the Primary Docs,
Codes, and Memos branches can be made visible.
All codes displayed in the HU Explorer can be used for drag & drop coding.
PDs, codes, and memos can be dragged into family managers and assigned
to families.
Double-click Actions
Double-clicking the entries launches the respective Object Managers. These are
the Object Managers for PDs, codes, and memos; the Family Managers for
PDs, codes, and memo families; and the Network View Manager for Network
Views.
When double-clicking on a PD, its comment is displayed.
When double-clicking on a quotation, it is highlighted in context.
When double-clicking on a code, a list of quotations pops up. If only one
quotation is associated with the code, it is highlighted in context.
When double-clicking on a memo, its content is displayed.
Using The HU Explorer For Coding
Drag & drop coding works from within the Object, Code and Tree Explorer. In
the Object Explorer, you can use the codes under the Codes tree or under the
Code Families tree. This way you can utilize the structure you have created via
code-code relations (see page 319, or via code families (see page 240).
Renaming Objects
All objects, excluding the top-level entries like the name of the HU, the
container entries “Primary Docs”, “Codes”, “Memos”, etc., can be renamed
using the “in-place” technique. This technique is also used by Windows
Explorer and other Windows file dialog boxes to rename files and directories.
Context Menus Of Objects
Each object in the HU Explorer has a context menu. These menus can be
accessed in the usual manner with a right mouse click. This selects the object, if
ATLAS.ti 7.1 USER MANUAL
SPECIAL TOOLS
373
not already selected, and opens the context menu, which offers a few selected
Figure 343: Context menu of network views in the HU Explorer
object-specific operations.
HU: Review a short information and statistics about your project. Edit the HU's
comment or create / install a copy bundle file (see “Copy Bundle – Migrating
and Backing Up Projects“ on page 129).
PDs / Codes / Memos: Open the object manager or expand to the respective
object level.
PDs / Codes / Memos: Open the object manager or expand to the respective
object level.
PD, Code, Memo Families: Open the family manager to expand to the family
or member level.
Network Views: Open the network view manager or expand to the network or
node level.
Displaying And Editing Comments
To edit an object’s comment,
Select an object and edit the comment that appears in the text pane.
Save changes by opening the context menu inside the text area and choose
ACCEPT.
The View Menu
The items offered by the View menu let you change the font (useful before
capturing screen shots for presentations), the display of object-specific items,
the length of the tree indentation, the presence of the collapse/expand
buttons, the display of the object's icons, and the comment area (Zoom List).
You can also disable the in-place editing capability.
ATLAS.ti 7.1 USER MANUAL
SPECIAL TOOLS
374
Figure 344: View menu
Code Trees & Forests
Special HU Explorers can be invoked to display codes only. You can open them
via the HU Explorer button in the main menu (see Error: Reference source not
found on page Error: Reference source not found), or via the following menus:
Select a code, e. g., in the Code Manager.
From the CODES / MISCELLANEOUS menu, choose CODE TREE.
To display all root codes with their trees and branches,
Select a code.
Choose CODES / MISCELLANEOUS / CODE FOREST.
The rules and procedures described above for codes in the Object Explorer
apply here as well (see “The Object Explorer” on page 368).
Codes displayed in code trees and forests can be used for drag & drop coding.
This is a preferred alternative for users who like to work with hierarchicallyordered coding schemes.
Redundant Coding Analyzer
This procedure identifies overlapping or embedded quotations that are
associated with the same code. Such “codings” -- possibly indicating
redundancy -- can result from normal coding but may occur unnoticed during a
merge procedure.
You might not need or want to correct redundant codings, but these
occurrences may be indicative of methodological issues in your analysis.
The Redundant Coding Analyzer Screen
The Coding Analyzer finds codes with redundant codings and offers
appropriate procedures.
ATLAS.ti 7.1 USER MANUAL
SPECIAL TOOLS
375
To open the tool, select TOOLS / REDUNDANT CODING ANALYZER from the HU editor's
main menu.
Figure 345: The Redundant Coding Analyzer
The upper pane displays a list of codes referencing overlapping quotations.
Clicking on a code displays the conflicting quotations pair wise. Double-clicking
on a listed quotation displays it in context.
The upper pane lists all codes for which redundant codings were found. The
Redundancy column displays the number of pairs of redundant quotations
found for the codes. If you select one of the codes, the redundant quotations
are listed in pairs in the two lower panes. Double-clicking on the listed
quotations displays and highlights them in context. Because of this, you can
check them in context and decide how to proceed.
The figure below illustrates a typical redundant coding:
ATLAS.ti 7.1 USER MANUAL
SPECIAL TOOLS
376
Figure 346: A typical redundant coding
Three procedures to handle a redundant coding are offered:
Unlink detaches the selected code from the quotation selected in one of the
quotation panes. This method is the least “destructive” of the available
options.
Remove deletes the selected quotation.
Merge melts the quotation in the right pane into the quotation selected in the
left pane. All references to and from the merged quotation is "inherited" by
the other. If the two quotations overlap, the resulting quotation includes all
data from both quotations.
Both quotation panes have a “Connectivity” column that shows the number of
connections (to codes, quotations, and memos) for the selected quotation. The
connectivity counter provides an additional clue about the next step. A
quotation with less connections might be less painful to remove.
If you see a quotation listed more than once in one of the quotation list panes,
it means that three or more quotations are involved in a redundant coding. You
will notice, that merging one pair of quotations may have the effect that other
pairs are removed from the list as well, as the redundancy assertion does not
hold any longer for the remaining pairs of quotations for this code.
Unlinking, Removing Or Merging A Redundantly Coded
Quotation
• Select a code in the upper pane. All pairs of redundantly coded quotations
are then displayed in the two lower panes.
• Double-click on the quotations of a pair to inspect them in context.
• Decide whether you want to unlink or remove one of the two quotations, or
whether you want to merge them.
• To unlink a quotation click the UNLINK button below the appropriate list pane.
The effect and alternative procedures of unlinking codes is described in
further detail in “Unlinking Codes” on page 204.
ATLAS.ti 7.1 USER MANUAL
SPECIAL TOOLS
377
• To remove a quotation click the REMOVE button below the appropriate list
pane.
• To merge the pair of quotations, click the MERGE button.
• Note that the quotations removed by this procedure cease to exist inside the
Hermeneutic Unit.
ATLAS.ti 7.1 USER MANUAL
SORTING AND FILTERING
378
Sorting And Filtering
The main strengths of a computer clearly lie in sorting and retrieving data. For
such techniques to be deployed successfully, however, the data itself must have
attributes by which it can be meaningfully ordered and filtered. A variety of
attributes can be used for filtering and sorting data. Many entities within an HU
can be filtered, for example, primary documents, codes, memos, and
quotations.
Sorting and filtering primary documents, codes, memos, and quotations can
help you gain deeper insight into your data.
Sorting and filtering can be accessed via the HU editor's menu or the Object
Managers’ menus. The columns in the Object Managers’ report views may also be
used for sorting. Some options for sorting and filtering are common to all objects,
while others are dependent on the object’s type.
Sorting
Sorting is available via the Object Managers’ columns and the main menus of
the HU Editor and the Managers.
Sorting In Object Managers
Click the header
to sort the items.
Click again to
reverse the sort.
Sorting is conveniently available in all Object Managers via the list headers
while in details view: clicking on a header “button” sorts the list in either
ascending or descending order.
ATLAS.ti 7.1 USER MANUAL
SORTING AND FILTERING
379
Figure 347: Sorting via the columns in object managers
The column used for sorting is displayed in a darker shade. The sort direction is
visualized by an arrow in the header. In four field of the status bar, the sort
criterion is displayed.
A double-click on the status bar’s sort field refreshes the current sort. This is a
useful option because newly added objects are appended to the end of the list
regardless of their correct position in the sorted sequence.
Sorting Via The Menus
The Sort menu option is available in the object menus of the HU Editor
(Documents, Quotations, Codes, and Memos) and from the corresponding
Manager’s menu.
Figure 348: Sort menu for documents
The figure below shows the Sort menu for documents with the current sort
criterion set to ID (which is also the default):
ATLAS.ti 7.1 USER MANUAL
SORTING AND FILTERING
380
In Object Managers, the currently selected sort criterion is also displayed in the
status bar. After new items are added to the list, refresh the sort with a doubleclick on the status pane’s sort field.
Overview Of Sort Options
The following describes the sort options in more detail. Default sort order: D =
descending, A = ascending.
Sort criterion
Entity type
Description
Sort order
Name
PDs, quotes,
codes, memos
Entity name (string)
A
Author
PDs, quotes,
codes, memos
Author’s name (string)
A
Created
PDs, quotes,
codes, memos
Creation date - or date of
assignment for PDs. (date/time)
D
Modified
PDs, quotes,
codes, memos
Modification date (date/time)
D
Density
quotes, codes,
memos
Quotes, codes: number of links to
objects of the same type
A
Memos: number of links to all
associated objects (i. e., quotes,
codes, and other memos)
Grounded
codes, memos
Number of associated quotations.
A
ID
PDs, quotes
The system generated ID
(number)
A
Size
quotes, memos
Quotations: number of
lines/paragraphs
Memos: size
of text
A
Media
PDs
Media type (i. e., audio, image,
rich text, text, video)
A
Quotations
PDs
Number of quotations for the
primary document.
D
Usable
PDs
Usability of the primary document
D
Origin
PDs
Origin of data source
(alphabetically)
A
Location
PDs
Redirected path (if used)
A
Start
Quotes
The quotations’ start position
A
Type
Memos
Memo type (string)
A
PDs
Memos
Number of PDs using the memo
as their data source (if any).
A
Families
PDs, codes,
memos
By families in alphabetic order
A
ATLAS.ti 7.1 USER MANUAL
SORTING AND FILTERING
381
Filtering
The status bar of all Object Managers displays the current filter and sort
setting. The default filter criterion is "All".
Figure 349: Indication of filter setting and sort order in the status bar of object managers
It is possible to combine filtering and sorting (e. g., all "free" codes sorted by
the time of their creation).
The filter options are available in the object menus of the HU Editor
(Documents, Quotations, Codes, and Memos) and from the corresponding
Manager’s menu. The filter field in the status bar offers a few additional
options like reversing or removing the filter. When a filter is active, the
background color of the affected lists and Object Managers changes.
The figure below shows the Filter menu for codes with the current filter set to
All (which is also the default):
Figure 350: Available filters for codes
After setting a filter, the background color of the affected Object Manager and
drop-down list changes. You can modify this color by changing the QuickInfo
color via Windows display preferences. In the figure below, the filter is set to
abstract codes and the QuickInfo color is set to a darker yellow (under
Windows preferences). The default color is pale yellow and depending on your
computer screen, it may be difficult to see.
ATLAS.ti 7.1 USER MANUAL
SORTING AND FILTERING
382
Figure 351: Code Manager with active filter
Filters affect a
number of
procedures
Most operations (e. g., display, printing, export) on sets of objects include
only the currently filtered set. For this reason, if a filter was set for
quotations, the output of “all” quotations would be restricted to the
quotations currently present in the Quotation Manager. Network Views are
not affected by filter settings and display all objects at all times. The margin
area shows only the filtered objects.
An overview of all filter options for all object types is provided below.
Overview Of Filter Options
Option
Entity type
Description incrementally with
immediate feedback after
All
PDs, quotes, codes,
memos
All objects are displayed (filter off)
Pattern
PDs, quotes, codes,
memos
Objects matching the entered search
pattern
Only today’s
PDs, quotes, codes,
memos
Objects created today
Only mine
PDs, quotes, codes,
memos
Objects created by the current user
Co-Authors
PDs, quotes, codes,
memos
Objects created by any of the selected
co-authors
Families
PDs, quotes, codes,
memos
Objects belonging to a family
Free
PDs, quotes, codes,
memos
Objects that do no reference any
other objects
ATLAS.ti 7.1 USER MANUAL
SORTING AND FILTERING
383
Commented
PDs, quotes, codes
Objects bearing a comment
Selected PD
quotes, codes, memos
Objects referring or belonging to the
currently selected primary document
PD-Memo
PDs
Memo used as primary document data
sources
Text
PDs
Textual primary documents (plain and
Rich Text)
Rich Text (file)
PDs
RTF encoded primary documents
Graphic
PDs
Graphical primary documents
Audio
PDs
Audio primary documents
Video
PDs
Video primary documents
Uses Mapping
PDs
Redirected primary documents
Renamed
Quotes
Renamed quotations
Hyper-linked
Quotes
Quotations linked to other quotations
Selected code
PD, Quotes
Quotations coded with the currently
selected code
Abstract codes
Codes
Codes without quotations. Less
selective than "Free"
Current
quotation
Codes
Filters the list of codes and displays
only those linked to the selected
quotation(s)
Super
Codes
Super codes
Types
Memos
Memos of a certain type
Pattern Searches As Filter
Enter a GREP pattern to filter all objects with names matching this pattern.
For example, if you have used names prefixed with “ATT:” for all codes
handling “attitudes”, the pattern “^ATT:” would filter all those codes (the
caret character ^ anchors the search at the beginning of the name).
Enter “\[.*\]” to filter all items containing arbitrary text in brackets.
An overview of the available GREP expressions is listed in the section “GREP
Search” on page 215.
To Reverse A Filter
Choosing Toggle Filter from the menu or double-clicking the filter field reverses
the filter. The tilde symbol ~ indicates a negated filter in the status bar.
By reversing the codes filter ‘Abstract,’ you can display all codes that are not
‘Abstract’. These are all codes that do have quotations associated with them. In
the filter field you see the entry '~Abstract'.
ATLAS.ti 7.1 USER MANUAL
SORTING AND FILTERING
384
Figure 352: Negate a filter by double clicking on the status bar
To Remove Or Reset Filters
Press CTRL and
double-click the
filter field to
remove a filter.
To deactivate a filter
either select FILTER: ALL from the menu, or
double-click on the filter field while holding down the Ctrl-key, or
select TOOLS / RESET
ALL
FILTERS from the main menu.
Filter By Families In The Family Managers
When double-clicking a family in any of the Family Managers, the
corresponding objects are filtered to the members of the selected family.
Double-click again to remove the filter.
Setting Local And Global Filters In The Managers' Side Panel
This option is described in the section “The Manager Side Panel “ on page 52.
ATLAS.ti 7.1 USER MANUAL
GENERATING OUTPUT
385
Generating Output
This chapter provides an overview of all output options that are available within
ATLAS.ti. In addition, some general procedures common to most output
functions are explained.
ATLAS.ti offers numerous options to create output and reports. Most output is
textual, but numeric or graphical output is also available where applicable
(Network Editor). Typical textual reports include sorted and filtered lists of
objects, like code, memos, families and quotations. Comments can often be
included when needed.
For textual primary documents a near what-you-see-is-what-you-get
(WYSIWYG) output is available, including the annotations populating the
margin area.
Output options are available from the menus of the tools, e. g., the HU Editor’s
menus, the Object Manager’s and HU Explorer’s menus. Some tools offer an
output button, either as the only option (e. g., the Query Tool) or in addition to
the menus (Code Manager).
The target of an output is not necessarily restricted to the printer. Many of the
text-related report procedures allow output to be directed to a text editor, the
printer, or a file.
Other kinds of output are not necessarily intended to be printed directly but are
to be processed by other applications, like the SPSS export option, several Excel
compatible outputs, and HTML and XML export. You can find those
procedures in chapter “Export & Import” on page 405.
Output Destinations
When creating textual output or when creating text-based exports, the
following dialog is usually displayed in the course of the process:
You can send output to:
ATLAS.ti 7.1 USER MANUAL
GENERATING OUTPUT
386
Figure 353: Common output
options
Editor: The output will be displayed within a text editor. This option is useful if
modifications are needed before actually sending it to the printer or if you are
unsure about the size of the result.
Printer : If you select this option, the output will be printed (the printer dialog
window opens where you may select the desired print options).
File: If you select this option, the output will be saved to a file (a save file dialog
opens).
File & Run: If you select the last option the file dialog window opens. After it
has been saved, the file will be opened by the application registered for its
extension. (e. g., a CSV or xls file will be opened in Excel™).
Report Layout
Common Header
When creating textual reports, a common header precedes the list of objects (e.
g., all codes or all quotations for a selected code).
The header includes information about the kind of report (“All current
quotations”), the HU (name and file path), the current user, the date and time
of the creation of the report and the current filter if any.
ATLAS.ti 7.1 USER MANUAL
GENERATING OUTPUT
387
Figure 354: Report header information
Sorts & Filters
Many list reports are affected by the currently active filter for the reported
objects. For instance, if the primary document’s filter is set to a specific family,
creating a report of “All” quotations yields only those quotations for primary
documents within that specific family.
Figure 355: Output of hyper-linked quotations
ATLAS.ti 7.1 USER MANUAL
GENERATING OUTPUT
388
The figure above shows the report generated after setting the the quotation
filter to “Hyper-linked.” The quotation filter is displayed in the header.
Restricting Output To Selected Objects
Output options for selected objects available from the HU Editor’s menus are
restricted to a single object. For example, you can print one code at a time.
Output options within the Object Manager allow you to select multiple objects
and output each of them at the same time. For example, you can highlight
three codes within the Code Manager and create a report that contains
quotations coded to each of the three codes. Another option to restrict output
is to work with filters. See “Sorting and Filtering” on page 378.
Creating Output For The Main Objects
Under the main menu for each of the four main object types (primary
documents, quotations, codes and memos) you can find an output submenu.
The corresponding object managers contain equivalent output menus.
However, output options within object managers allow for the selection of
specific items (e. g., a subset of codes rather than all codes) to be included in
the output.
The output options for the four main object types are explained in detail below.
The (Primary) Documents Output Sub Menu
The output sub menu for primary documents
List
Generates a list of all primary documents in the HU. If any of the PDs have a
comment you are asked if these are to be printed as well.
Hierarchy
Prints the selected PD’s quotation numbers and their codes and memos in a
hierarchical manner.
Quotations
Prints all quotations belonging to the selected primary document.
Print With Margin
The Print with Margin option creates a WYSIWYG printout of coded texts
(What You See Is What You Get). It also prints texts with their paragraph
numbers. If you direct it to a PDF printer, a PDF document is created.
ATLAS.ti 7.1 USER MANUAL
GENERATING OUTPUT
389
Print with Margin is currently only available for textual primary documents.
The appearance of the printed text can be controlled in three places:
• Via the PD Printing tab in the General Preferences dialog (see below
“Setting PD Printing Preferences“).
• By the current display settings in the HU Editor. The printout resembles the
screen display at the time of creating the output. The margin or the
numbering is only included if currently displayed. Only those margin objects
are included that were selected to be displayed in the margin. By moving the
splitter bar the ratio between document and margin area can be controlled.
To change the type of objects that are displayed and they appearance, e. g.
font size, right click on a white space in the margin area to open the context
menu.
• The printing dialog under FILE / PRINTER SETUP. Switching to landscape for
densely populated margins may improve results. Choose to print the one or
more primary documents or a selected text passage only.
SETTING PD PRINTING PREFERENCES
Depending on the size and layout of your document, the number of objects in
the margin and the fonts used in the document, adjustments may become
necessary. To set PD Printing preferences, select the main menu option TOOLS /
GENERAL PREFERENCES.
TO PRINT A PRIMARY DOCUMENT WITH MARGIN
Load the primary document.
If you do not want to print the entire PD, highlight the section that you want
to print. If you want to print several PDs, select those you want to print in
the PD Manager.
Switch the wrap mode to Printer via EDIT / WORD WRAP / FOR PRINTER. Although
printer wrap is enabled anyway when starting the print, it is advisable to
select this wrapping mode in the first place to better judge the expected
layout and avoid surprises.
The printed page is divided into “columns” for the numbering, the actual
text and the margin area. Specify the ratio between the space reserved for
the text and the margin by moving the splitter bar to an appropriate position.
It might take some experimentation to arrive at optimal results for your
printer.
Select DOCUMENTS / OUTPUT / PRINT WITH MARGIN from the main menu. If you
print several PDs, select out OUTPUT / PRINT WITH MARGIN OPTION from the PD
Manager's output menu.
Print selected
parts of a
document.
The printer dialog opens. If you have made a selection (e. g., manually or by
activating a quotation) and want to restrict the output to this part of the
document, check option “Print Selection” before clicking the Print button. If
you want to create a PDF document, select a PDF writer as printer.
Our WYSIWYG of annotated documents has its limits. For instance, if you have
coded the document quite densely, with lots of overlapping quotations and
ATLAS.ti 7.1 USER MANUAL
GENERATING OUTPUT
390
many memos and hyper-links, color is recommended for best visual
discrimination.
The Quotations Output Sub Menu
Selected Quotation
Prints the selected quotation. In the Quotation Manager, all selected
quotations are printed.
All Quotations
Prints all current quotations. If any of the quotations have a comment you are
asked if these are to be included in the printout.
All Quotations (List)
Prints all current quotations in a compact format including only the quotations
ID and display name. This is a suitable option for audio, video, image and
GoogleEarth documents, when you have renamed the quotations to serve as
title.
By default, the quotation name has only 30 characters. You can increase it in
the General Preferences Window in the field: List name size for quotes. If you
do this after the quotations have already been created, you need to update all
names via the option QUOTATIONS / MISCELLANEOUS / UPDATE NAMES.
Figure 356: Quotation list output
ATLAS.ti 7.1 USER MANUAL
GENERATING OUTPUT
391
Speak Quotation
Lean back, close your eyes, and let ATLAS.ti read the quotation to you.
(Currently this works only for English language text.)
The Codes Output Sub Menu
Quotations For Selected Code
Prints all quotations for the selected code(s). When quotations are exported,
headers for individual quotations include references to other codes (and
memos) that are linked to those quotations. This is also true for other output
options including quotations.
Quotation List
Prints a compact list of all quotations for the selected code (appearance as in
'All Quotation (list)').
Include Sub Terms
Prints all quotations for the selected code, including all quotations connected to
any of the codes that are transitively linked to this code. This resembles a
Query Tool created term using the SUB operator (see page 262 and page 322).
Query Tool
Opens the Query Tool (see page 258for details).
Code List
Prints a list of codes according to the current sort setting.
Code Hierarchy
Prints the hierarchy of codes as indented text. The hierarchy is not created
automatically by ATLAS.ti. It is based on the type of links between codes as
defined by the analyst (see “To create code-code and quotation-quotation links
using the Object Manager“ on page 322.
ATLAS.ti 7.1 USER MANUAL
GENERATING OUTPUT
392
Figure 357: Code hierarchy based on the links created between codes
Codes Neighbors
Similar to codes hierarchy but restricted to one hierarchy level. Prints all current
codes with only their immediate code neighbors.
Codes-Primary-Documents-Table Sub Menu
Prints frequency counts (number of quotations or sum of all words of the
quotations) in form of a table: all current codes (x-axis) by primary documents
(y-axis). You may also export the table to Excel for further processing or more
flexible reporting. This option is explained in detail in page “Codes-Primary
Documents Cross-Tabulation“ on page 302.
Quotation References
Prints a list of codes including the boundaries of their quotations. Code
comments can be included.
All Codes With Quotations
Prints all codes with a full report of their quotations. A table based output can
be created using an XML style sheet (see page 399 below).
ATLAS.ti 7.1 USER MANUAL
GENERATING OUTPUT
393
Codes With Comments (Code Book)
Generates an output of all codes with comments including creation and
modification date, membership in families and number of quotations
referenced by each code. An alternative option is to use the XML Explorer to
create a code book, see page 399.
Co-occuring Codes
Outputs the results of the Co-occurence Explorer in rtf format (see page 295).
You can choose to include the quotation list or to output only the list of cooccurring codes.
The Output Dialog (in The Code Manager)
When clicking the Code Manager output button (see left), a dialog opens to
allow you to select the characteristics of your output.
Figure 358: Code Output Dialog Window
Additional choices not available as menu options are the exclusion or inclusion
of header information and link comments.
ONE-LINER ONLY corresponds to menu option ‘Quotation List’.
TRAVERSE LINKS is the same as menu option ‘Include Subterms’.
Reports For Code Combinations Via The Query Tool
When clicking on the printer button in the query tool, you can print the list of
quotations resulting from your selected combinations of codes and code
families, either in full length or in list format. Before creating the output,
selected quotations can be excluded (see “Output” on page 270).
ATLAS.ti 7.1 USER MANUAL
GENERATING OUTPUT
394
Figure 359: Quotation output excluding meta information
A space and paper saving output is the “no meta” option:
Figure 360: Output using No Meta: Save space and paper
A source reference is provided, if you select this option, but it only uses one
line. It is displayed at the end of every quotation:
The Memos Output Sub Menu
List Of Memos
Prints a list of the current memos. You are given the option of output with or
without the memo text.
ATLAS.ti 7.1 USER MANUAL
GENERATING OUTPUT
395
Selected Memo(s)
Prints the selected memo(s).
Selected Memo With Quotations
Prints a selected memo including all referenced quotation(s).
Speak Memo
Lean back, close your eyes and let ATLAS.ti read the selected memo for your.
Currently this works only for English language text.
Family Output
When clicking the output button in any of the three family managers, a report
is created with information associated with the selected family: name,
comment, list of members.
When desired, a report of all quotations that are associated with any of the
members of the family is included.
Output For Co-occurence Tools
See quantitative results of the Co-occurrence Table Explorer, i. e. frequency of
co-occurence of the c-coeffient, can be exported as Excel compatible file. To do
this, you find an Excel export button in the tool bar of the Co-occurrence Table
Explorer (see page 296).
The qualitative results, i. e. the quotation IDs and names of the co-occurring
codes can be exported as an rtf file. You find this option under CODES / OUTPUT /
CO-OCCURING CODES.
Output For Network Views
Network Views can be saved as either Windows Bitmap (bmp) or enhanced
meta (emf) file. In a network view editor select the option NETWORK / SAVE AS
GRAPHIC FILE.
A second option is to copy the entire or only parts of the network to the
clipboard and then paste it into another application. When pasting, you need
to select the “paste special” option in order to paste the network view as
image. If you select just the “paste” option, the network view is pasted in text
form. This is the equivalent to the code hierarchy output (see page 391 above).
Creating Reports With The XML Converter
XML, the eXtensible Markup Language is a powerful standard for information
exchange between applications and has been used by ATLAS.ti since release
ATLAS.ti 7.1 USER MANUAL
GENERATING OUTPUT
396
4.2. XML is increasingly used in any information technology related domains:
the mobile phone web “language” WAP, transcripts created by open source
transcription tool Transcriber, and Microsoft Office all use or are based on
XML.
In case you don’t know what XML is, the short explanation is that XML, similar
to HTML, is a document markup language.
XML concentrates on structuring information. Structured information contains
both content (actual words, pictures, etc.) plus typically some indication of
what role that content plays (for example, text content inside a "heading" has
a different meaning from content in a "footnote", content in a "figure
caption" differs from content in a "database table", etc.).
Almost all documents have some structure, and a markup language is a
mechanism to identify this structure in a document. The XML specification
defines a standard way to add markup to documents.
OpenQD
XML
Figure 361: XML is a universal data interchange
format, allowing programs to exchange data
If you create an XML output file, it can be read by other applications that
support XML. One main advantage is that the application can define
autonomously and completely detached from any display information
contained in the document what parts of the structure are to be displayed and
what the display should look like. This is commonly achieved with the help of
so-called style sheets.
Style sheets are a way of prescribing how the content of your XML source file
should be rendered. This can range from very simple layout commands (“show
all elements of type X in red”) to quite complex programming logic (“create an
entire website in which each element of type X displays its sub-content on a
single page, along with navigation, layout, interactive elements”).
ATLAS.ti already comes with a number of such style sheets for you to use, but
also to explore and potentially to expand on by copying and extending their
functionality for your specific purposes. Once you understand the principle, you
will see what an enormously powerful and flexible tool has been put at your
disposal with these little programs. All style sheets are written in XSLT, a special
language designed for transforming XML content and maintained by the World
Wide Web Consortium (“W3C”).
See also: http://www.atlasti.com/xml.html
ATLAS.ti 7.1 USER MANUAL
GENERATING OUTPUT
397
XML Vs. HTML: A Little Tech Talk
XML is short for eXtensible Markup Language. This is already quite a useful
description when you compare it to its "competitor" or predecessor, HTML,
short for HyperText Markup Language.
The crucial term is "extensible", NOT "extended". HTML was intended to
allow documents and information of considerable complexity to be exchanged
across different technologies, operating systems, browsers, etc. It was also
meant as a language which describes the logical structure of documents.
If you look at HTML code (right-click and select "View Source" when browsing
any web page), you will have a hard time identifying content in the chaotic
"noise" produced by tags representing tables, frames, buttons, rulers, fonts,
images, indentation, etc.
Both HTML and XML are descendants of a much more powerful (and less
comprehensible) language, SGML, the Standard Generalized Markup
Language. What XML shares with the latter is that you can define your own
new languages, something HTML does not allow for. While HTML is a
prescribed language itself, XML is a meta-language for defining new
languages.
HTML has no clear separation of content and presentation. With a fixed set of
tags there is no way to clearly mark-up document content in a meaningful
manner.
If you have ever seen the source code of a HTML coded web page, you can
easily recognize two of the main characteristics of XML which makes them
distinct from HTML:
The presence of tags (e. g., <MEMO>, <SPEECH TURN>) which are not
available in the fixed set of HTML tags (where new tags would be either
proprietary or at least deviations from the standards). The tags used in an
XML file represent YOUR data without invalidating any standards! Below, a
raw XML file is shown.
The absence of presentation (display, layout) related information (tables,
fonts, images, rulers, etc)
Below you can see an XML version of an interview section with some added
information:
<Trans version="1" trans_method="LING22" version_date="990120"
audio_filename="au.wav" xml:lang="DE">
<Speakers>
<Speaker id="I" name="Interviewer"/>
<Speaker id="B" name="Herr Schultz" dialect="bavarian"/>
</Speakers>
<Turn speaker="I" tape_pos="2010">
Ja.
</Turn>
<Turn speaker="B" tape_pos="2314">
Wars doch eigentlich, ja da wars doch
glaub ich erst ein oder zwei Tage, oder
vielleicht einen Tag.
</Turn>
</Trans>
ATLAS.ti 7.1 USER MANUAL
GENERATING OUTPUT
398
If you interested to learn more about XML, there are countless sources online.
Style Sheets
The real power of the XML standard is unleashed by applying so-called "style
sheets." In fact, an entire style language, the eXtensible Style Language (XSL,
or, more specifically, XSLT) can be leveraged to create useful little programs
and even full-blown applications on the basis of raw XML-structured data.
You do not need to know or have to learn the XSLT language to use the
XML Converter with the provided style sheets. However, such knowledge is
useful if you wish to create your own reports, browsers, and converters.
A Hermeneutic Unit exported to XML can be converted into a wide variety of
other representations by using style sheets. Individual reports, conversions into
other programs’ input formats or creating ‘clickable’ viewer versions of your
HUs are among the options available.
The default XML folder (browse conveniently via TOOLS / EXPLORER / XML FOLDER)
hosts some examples of such style sheets waiting to be explored, or modified
to suit your own needs or tastes. The XML converter can be viewed as a kind
of plug-in interface for user written "programs" or macros.
The ATLAS.ti XML Converter is a convenient tool for user-created reports,
converters and viewers. It displays all XML and XSL files located in the default
XML folder.
If you change the default XML folder under TOOLS / PREFERENCES / GENERAL
PREFERENCES / PATHS and want to continue to use the provided style sheet
samples, you need to copy the content of the default XML folder to the
new location.
Requirements
ATLAS.ti’s XML Converter requires Microsoft’s MSXML v.3 XML parser to be
installed. In turn, MSXML requires the Internet Explorer 6 or later to be
installed.
Although Microsoft's Internet Explorer 6 (or higher) must be installed on
your system, it is not required to be your default web browser!
If you have Windows XP as your operating system, you should already be well
equipped. However, it is recommended that you download the most recent
version of the parser from the Microsoft web site (run the Check MSXML
option below).
ATLAS.ti 7.1 USER MANUAL
GENERATING OUTPUT
399
To check for the version of MSXML installed on your computer, run TOOLS /
XML / XML CONVERTER from the main menu, or click the globe button in the
main toolbar.
Checking MSXML Compatibility
If you receive an error message, you need to check if you have a compliant
version of MSXML installed:
From the main menu, select HELP / MORE RESOURCES / CHECK MSXML.
A list of installed MSXML modules will be displayed including their
compatibility with ATLAS.ti. If none of the modules is compatible, follow the
link to the offered download site to get a compliant version of MSXML.
Working With Style Sheets
ATLAS.ti offers a number of reports via flexible XML/XSLT style sheets. If you
are skilled in XSLT, you can create any output you like based on the raw XML
file of your ATLAS.ti project.
To create a raw XML file, click on the XML button in the tool bar and then
select the option EXPORT HU TO XML.
For all others, we have put together a selection of useful reports. Click on the
XML button, or select PROJECT / EXPORT / XML EXPLORER.
The Explorer divides the available style sheets into three groups: Reports,
Viewers, and Programming/Demos:
•
Reports offer a number of predefined reports sorted by Codes,
Families, Memos, Network Views, Primary Documents and Quotations.
•
Viewers include style sheets that offer various display forms for the
HU.
•
Programming /Demos provide style sheets that may inspire and help
you to write additional style sheets on your own to create just the
report you want.
ATLAS.ti 7.1 USER MANUAL
GENERATING OUTPUT
400
Figure 362: XML Explorer
The following predefined reports are available:
Figure 363: Available Reports
If you click on a report, a short description is provided in the comment field at
the bottom of the XML Explorer window.
ATLAS.ti 7.1 USER MANUAL
GENERATING OUTPUT
401
How To Create A Report
Select one of the reports and double-click.
A window opens offering the following three export options:
Figure 364: XML export options
Select the amount of content you need for the report.
The last option (also include quotations contents (as plain text)) exports the full
content of the HU. This is however not always needed. For exporting a code
book, for instance, you only need to export the code names and comments.
Therefore, selecting the first export option:Do not include Primary Documents
is sufficient.
If you are unsure how much information you need, you are on the save side
selecting the third export option (Also include quotations contents). It may just
take a bit longer (than necessary) to create the report.
The output is displayed in your web browser (Internet Explorer by default;
results may vary in different browsers).
To create a Code Book:
Double click on the report: Codes: Code Book.
Select the first export option: Do not include Primary Documents.
Then wait for your browser to open (see Figure 365).
ATLAS.ti 7.1 USER MANUAL
GENERATING OUTPUT
402
Figure 365: Code book report
You can copy and paste this table from Internet Explorer into a MS Word
document or other applications and, if desired, add some further
formatting.
To output all coded segments by codes plus comments:
If you want to output all quotations sorted by codes, select Quotations: by
Code – Report of all Coded Quotations by Code (plus Comments)
You need to be aware that this potentially may result in large outputs, as you
cannot apply filters. Nonetheless, this output is frequently used and asked for,
e. g. as a means to add transparency to the analysis process and to make
outcomes available to third parties.
Select the third export option: Also include Quotations contents (in plain
text).
The result is a list of tables, one for each code, displaying the code name and its
definition/comment in the first row and all quotations underneath.
ATLAS.ti 7.1 USER MANUAL
GENERATING OUTPUT
403
You can only output textual information. For image, geodata, or multimedia
quotations only a reference is provided.
Figure 366: Report: Quotations by Code
When exporting quotations from PDF documents, you may have to correct the
formatting in Word and delete unnecessary hard returns. The original layout is
of course lost as the table only contains plain text. As mentioned above, you
can simply copy and paste the table(s) from the Explorer to a word processing
program and edit them there.
Creating And Modifying Style Sheets
If you are familiar with writing XSLT style sheets, use the supplied examples in
the section Programming/Demos as a point of departure for your explorations.
Check our Web site, http://www.atlasti.com for additional information on
ATLAS.ti's XML support, as well as for an emerging repository of useful style
sheets and dedicated service providers who specialize in creating custom
applications, interfaces, and conversions on the basis of ATLAS.ti’s XML / XSLT
capabilities.
Let's take a look at some of the examples for manipulating raw XML data that
come with the program. The following sample was created by exporting the
Jack the Ripper sample HU to XML. Below you see some excerpts of the raw
XML file:
ATLAS.ti 7.1 USER MANUAL
GENERATING OUTPUT
404
Figure 367: Excerpt of a raw XML file
Three different style sheets were independently applied to this XML file using
the XML converter to generate completely different representations from the
same source.
It is important to notice that these representations work independently of
ATLAS.ti. That is, they "live" exclusively in your Web browser. This adds a
huge new repertoire of applications to your tool chest, since you can modify
the supplied style sheets to your hearts content and even create your own style
sheets to suit your unique and very specific needs.
The following assumes some knowledge about XML and XSLT. XSLT styles
sheets are XML conforming text files. As such, they can be edited with a simple
text editor.
Conventions
You will note that the XML Converter displays more than just the file name of
the style sheets it found in the XML folder. This additional information is part of
the style sheets themselves. The atlas description node within the atlas:data
namespace contains this self description. Style sheets that do not use this
header are not displayed in the converter.
Style sheets are stored in the ATLAS.ti XML folder, which you can
conveniently locate via the main menu option TOOLS / EXPLORER / XML FOLDER.
ATLAS.ti 7.1 USER MANUAL
EXPORT & IMPORT
405
Export & Import
This chapter describes procedures to export/import data and structures
between ATLAS.ti and other software. The export procedures introduced in this
chapter are not always clearly distinguishable from the chapter “Generating
Output” on page 385. While the output options are generally display and print
oriented, export of the HU or parts thereof allows for analysis of data and
structures created with ATLAS.ti within other software packages.
SPSS Export
ATLAS.ti is intended primarily for supporting qualitative reasoning processes.
On the other hand, especially with large amounts of data, it is sometimes
useful to analyze the data in a quantitative manner using statistical approaches.
ATLAS.ti provides an export function to permit further processing of the syntax
file by SPSS®, the Statistical Package for the Social Sciences.
Cases & Variables
The case for
cases.
The basic components for statistics are cases and variables. The SPSS export
function in ATLAS.ti treats codes as variables and data segments (quotations)
as "cases."
In contrast to the dichotomous treatment of codes within ATLAS.ti, you can
use codes as ordinal or otherwise scaled variables in SPSS jobs by using a
specific code-naming convention.
ATLAS.ti exports
quotations as
cases. You can
use SPSS features
to use primary
documents as
cases.
The notion of a "case" here is rather fine-grained and differs from the common
understanding of this term. Usually cases in qualitative research refer to
persons, interviews, or documents. We chose to treat the smallest unit as a case
for the output to SPSS, to ensure that no data is lost during export. Broader
information, e. g., which primary document a quotation belongs to, is coded
into the variable PD (primary document).
ATLAS.ti 7.1 USER MANUAL
EXPORT & IMPORT
406
SPSS Syntax File
The output of the SPSS generator is a complete SPSS syntax file containing
variable definitions, optionally the data matrix and some default jobs
statements:
VAR LABELS are taken from code and code family names.
VALUE LABELS for variables created from codes are:
YES (1) - code is assigned
NO (0) - code is not assigned
Every "case" is not only described by the codes, but also by information about
position (primary document, start and end position), author, media type and
date of creation.
There are two variables for the start position (SY and SX) and two variables for
the end position (EY and EX) for a quotation. Depending on the media type,
they are used for different start and end coordinates.
SY (start)
SX (start)
EY (end)
EX (end)
paragraph
Column character,
quotation based
paragraph
Column character,
quotation based
page
Character count, page
based
page
Character count, page
based
Audio
---
milliseconds
---
milliseconds
Video
---
milliseconds
---
milliseconds
Text (rich text)
PDF
Image
Geo
SX and SY indicate the position of the upper left
hand corner of the image
---
---
EX and EY indicate the position of the lower
right hand corner of the image
---
---
Code and primary document families are handled using COMPUTE statements.
If applicable super codes can turn into non-dichotomous variables.
The SPSS syntax output created with ATLAS.ti is plain ASCII and can be edited
before storing it as a file for further processing with SPSS. Below you see an
example syntax file:
TITLE 'ATLAS.ti - Children & Happiness stage II'.
* SPSS Syntax file generated by ATLAS.ti 7.0.83.
* SPSS Generator Version 3.2
* Date: xxxx.
DATA LIST RECORDS=3
/1 CASENO (F6.0) PD (F6.0) QU (F6.0) SY (F8.0) SX (F8.0)
EY (F8.0) EX (F8.0) TI (F10.0)
/2 K1 to K77 1-77
ATLAS.ti 7.1 USER MANUAL
EXPORT & IMPORT
407
/3 K78 to K138 1-61
VARIABLE LABELS PD 'Primary Doc'
/QU 'Q-Index'
/SY 'Start x-Pos'
/SX 'Start y-Pos'
/EY 'End x-Pos'
/EX 'End y-Pos'
/TI 'Creation Date'
/K1 '#fam: 1 child'
/K2 '#fam: 2 children'
/K3 '#fam: 3 or more children'
…
…
…
/K136 'study design: demand for a qualitative study'
/K137 'study design: measuring happiness'
/K138 'study design: understanding empirical studies'.
VALUE LABELS K1 to K138 1 'YES' 0 'NO'.
* Represent code families as computed variables.
COMPUTE KF1 = K26 + K27 + K28 + K29 + K37 + K38 + K39 + K40 + K41 +
K42 + K43 + K44 + K45.
COMPUTE KF2 = K37 + K38 + K39 + K40 + K41 + K42 + K44 + K45 + K66 +
K67 + K68 + K69 + K70.
…
…
COMPUTE KF32 = K66 + K67 + K68 + K69 + K70.
COMPUTE KF33 = K58 + K59 + K60.
FORMATS KF1 (F2) KF10 (F1) KF11 (F2) KF12 (F1) KF13 (F1) KF14 (F1) KF15 (F1)
KF16 (F1) KF17 (F1) KF18 (F1) KF19 (F1) KF2 (F2) KF20 (F1) KF21 (F2) KF22 (F2)
KF23 (F1) KF24 (F2) KF25 (F2) KF26 (F1) KF27 (F2) KF28 (F2) KF29 (F1) KF3 (F2)
KF30 (F1) KF31 (F1) KF32 (F1) KF33 (F1) KF4 (F2) KF5 (F2) KF6 (F2) KF7 (F1) KF8
(F1) KF9 (F1).
VARIABLE LABELS KF1 'KF_*Children + Effects of parenting'.
VARIABLE LABELS KF2 'KF_*Effects of parenting + The BUT group [SN 1]'.
…
…
VARIABLE LABELS KF31 'KF_Survey Items'.
VARIABLE LABELS KF32 'KF_The BUT group'.
VARIABLE LABELS KF33 'KF_What children give'.
ATLAS.ti 7.1 USER MANUAL
EXPORT & IMPORT
408
* Represent primary document families as IF variables.
* Using ALL primary document families.
* PF1 *About happiness.
COMPUTE PF1 = 0.
IF (PD = 6 or PD = 7 or PD = 8 or PD = 9 or PD = 10) PF1
= 1.
* PF2 *blogs.
COMPUTE PF2 = 0.
IF (PD = 2 or PD = 3 or PD = 4 or PD = 5) PF2 = 1.
* PF3 *research report and comments.
COMPUTE PF3 = 0.
IF (PD = 1 or PD = 2 or PD = 4) PF3 = 1.
* PF4 blog discussion.
COMPUTE PF4 = 0.
IF (PD = 3 or PD = 5) PF4 = 1.
* PF5 education::highschool.
COMPUTE PF5 = 0.
…
…
…
FORMATS PF1, PF2, PF3, PF4, PF5, PF6, PF7, PF8, PF9,
PF10, PF11, PF12, PF13, PF14, PF15, PF16, PF17, PF18,
PF19, PF20, PF21, PF22, PF23 (F1).
VARIABLE
VARIABLE
VARIABLE
VARIABLE
VARIABLE
…
…
…
LABELS
LABELS
LABELS
LABELS
LABELS
PF1
PF2
PF3
PF4
PF5
'PF_*About happiness'.
'PF_*blogs'.
'PF_*research report and comments'.
'PF_blog discussion'.
'PF_education::highschool'.
* Document type declaration.
IF (PD = 31 or PD = 16
or PD = 33 or PD = 22
or PD = 19 or PD =
or PD = 11 or PD = 4
or PD = 17 or PD =
23 or PD = 2 or PD =
12 or PD = 7 or PD
26 or PD = 34 or PD
= 10 or PD = 27 or
or PD = 28 or PD = 14 or PD = 21
3 or PD = 13 or PD = 25 or PD = 5
30 or PD = 29 or PD = 24 or PD =
= 20 or PD = 32 or PD = 18 or PD =
PD = 15) MediaType = 1.
IF (PD = 1) MediaType = 2.
IF (PD = 6) MediaType = 3.
IF (PD = 36 or PD = 37 or PD = 38 or PD = 9 or PD = 8 or
PD = 35) MediaType =
4.
ATLAS.ti 7.1 USER MANUAL
EXPORT & IMPORT
409
STRING Media (A8).
RECODE MediaType (1="richtext") (2="pdf") (3="video")
(4="graphic") into
Media.
VARIABLE LABELS
VARIABLE LABELS
MediaType 'Media Type (Numeric)'.
Media 'Media Type (String)'.
BEGIN DATA.
000001000001000001000000010000149900000001000017103500709
236
000000000000000000000000001000000000000000000000000000000
00000000000000000000
000000000000000000000000000000000000000000000000000000000
0000
000002000001000002000000010000508900000001000052743500709
296
000000000000000000001000000000000000000000000000000000000
00000000000000000000
000000000000000000000100000000000000000000000000000000000
0000
000003000001000003000000010000527700000001000054343500709
304
…
…
…
END DATA.
Scaled Vs. Dichotomous Codes
Within ATLAS.ti, a code is always dichotomous, because it either refers to a
given quotation ("1") or it does not ("0"). Each case (= quotation) can, in
respect to the codes, be described as a vector of 0's and 1's. The concept of
scaled codes/variables requires a special syntax.
The dimension or scale along which an evaluation is to take place is partitioned
into the number of different values required. Assuming that five degrees of fear
are to be distinguished in a given analysis, five codes must be created:
degree
degree
degree
degree
degree
of
of
of
of
of
fear
fear
fear
fear
fear
%1
%2
%3
%4
%5
A special naming convention is necessary to let ATLAS.ti identify variable codes
from dichotomous codes.
ATLAS.ti 7.1 USER MANUAL
EXPORT & IMPORT
410
Naming Convention For Scaled Codes
Each code name is followed by at least one blank and the %-character (you
may choose an alternative lead character for the value part through the SPSS
initial screen) followed immediately by a value.
This notation allows the system to construct one variable from a group of codes
(as in the example given above). The new ordinal variable "degree of fear" has
as many distinct values as the number of codes the user defined according to
the convention. In SPSS syntax the transformation of the data could be
expressed as follows:
if (degree of fear %1 eq 1) degree of fear=1
if (degree of fear %2 eq 1) degree of fear=2
if (degree of fear %3 eq 1) degree of fear=3 etc.
You are not restricted to numerical values; anything that follows the special
symbol is interpreted as a value. The width reserved in the Data List statement
of the syntax file is the maximum width of the largest of all values collected for
a variable code:
Name %Christine
Name %Thomas
Name %Hal
The variable code "Name" will have three values: "Christine," "Thomas" and
"Hal." The width reserved in the data list statement will be 9, determined by
the maximum width value "Christine."
Use comments for
an explanation of
scaled code’s
values
A comment linked to such codes could be used as an explanation of the values
to instruct researchers in coding the material.
Keep in mind that ordinal codes only have meaning in the context of being
used by SPSS. Within ATLAS.ti, the differently valued codes are treated like
every other code: dichotomously.
Figure 368: Example of a scaled variable
Check ‘The Sample.hpr6’ for an application of an ordinal code. You find the file
in the samples folder, which you can access via TOOLS / EXPLORER / SAMPLES FOLDER.
The name of the code is Horror, split into Horror %1 to Horror %5.
Do not assign
mutually exclusive
codes to the same
quotation!
Do not assign more than one scaled variable value (e. g., fear %1 and fear %2)
to the same quotation. Although ATLAS.ti permits an arbitrary number of
codes to be attached to a quotation, this would not make much sense with
mutually exclusive values of scaled variables. If you do so, the SPSS generator
will simply ignore additional values after processing the first one it finds for a
given quotation. Since it cannot be guaranteed which value will be detected
first, this will most likely produce unpredictable results in the SPSS job
generated.
ATLAS.ti 7.1 USER MANUAL
EXPORT & IMPORT
411
How SPSS Export Handles Families
Treatment Of Code Families
Code families in SPSS jobs simply count the occurrences of assignments of any
of its contained codes for the current case (=quotation) using COMPUTE
statements. Below an example for computing a code family variable is
provided:
COMPUTE KF1 = K10 + K11 + K12 + K13 + K14 + K15.
VARIABLE LABELS KF1 'KF_Investigation'.
Scaled codes are ignored in the computation of code family variables.
Treatment Of Primary Document Families
Each case (= quotation) has its primary document index automatically
generated by the SPSS export function. The value of a quotation that is part of
a primary document that is a member of a primary document family will be
computed as a "1" or "0." In the SPSS syntax file the PD family variable is
computed as follows:
* PF1 Description of Victims.
COMPUTE PF1 = 0.
IF (PD = 5 or PD = 6 or PD = 8 or PD = 9 or PD = 10) PF1
= 1.
VARIABLE LABELS PF1 'PF_Description of Victims'.
Missing Values
Missing values are only computed for scaled variables. A sequence of blanks
(depending on the format width of the variable) is inserted in the data matrix
for any missing value.
Creating SPSS Output
From the HU editor's main menu select PROJECT / EXPORT TO / SPSS JOB.
The Send Output to: dialog window opens. Select a target location.
Next, the SPSS Job Generation Window opens:
ATLAS.ti 7.1 USER MANUAL
EXPORT & IMPORT
412
Figure 369: Property window for SPSS job
Use separate file: When checked, the data matrix is written to a separate file.
This is mandatory if the size of the matrix exceeds a certain size. SPSS cannot
handle large data sets within a syntax file. For regular size projects, leave this
option unchecked.
Specify the name of the data set. This name is used as the file name and as the
FILE reference from the DATA LIST section. You only need to enter a name
here if you generate separate data files.
“Create a fresh data file during next run” can be unchecked if the data has not
changed since it was last created. This may save some processing time.
Include quotation's author. Check if you want to export an additional variable
that indicates the author for each quotation. This is for example useful if you
want to use SPSS to calculate inter-coder reliability.
The value separator is % by default, but can be changed to something else. See
“Scaled vs. Dichotomous Codes“.
Create task section. Enable this option if you want templates for procedures
included at the end of the syntax file.
Create SAVE OUTFILE instruction. Enable this option if you want SPSS to save
the data as *.sav file after running the syntax file..
Specify all desired properties and then click OK.
The output is generated and sent to the selected target location. When directed
to a text editor, you can edit the job statements and other parts of the syntax
file before proceeding. If file separation is selected, two files – the SPSS job file
and the data file - are created simultaneously.
ATLAS.ti 7.1 USER MANUAL
EXPORT & IMPORT
413
You can directly RUN the result if SPSS is installed on your computer and the
SPS extension has been associated with SPSS.
Figure 370: Data matrix in SPSS after running the syntax file
Figure 371: Variable View
Export & Import Using XML
Codes, memos, or entire HUs can be exported into the XML format. Exporting
codes and memos as XML files allows you to transfer all or only selected codes
or memos between HUs using the import function. (If you are looking to merge
complete HUs, check the section on “Merging Hermeneutic Units” on page
154).
Exporting the entire HU in XML opens up numerous possibilities for individual
reports and conversion for other applications.
Exporting And Importing Codes In XML
Exporting Codes
The code’s name, author, creation and modification date, as well as the query
for super codes and their respective comments are included in the export
format. However, no links to quotations or other objects are included. You can
export all codes, or selected codes, or all codes that pass the current filter.
To export all codes (or all filtered codes),
Choose CODES / IMPORT/EXPORT / EXPORT ALL CODES (XML) from the main menu.
In the output target dialog select FILE. Confirm the default name, or enter a
new file name, and save the file to disk
ATLAS.ti 7.1 USER MANUAL
EXPORT & IMPORT
414
To export a list of selected codes,
Open the Code Manager and select one or more codes.
Choose CODES / IMPORT/EXPORT / EXPORT CODE (XML) from the main menu
In the output target dialog select FILE. Confirm the default name, or enter a
new file name, and save the file to disk.
Importing Codes
When you import codes in XML format, additional information like the date of
creation and modification, the author and code comments (in plain text only)
are also imported.
This is how you do it:
Select CODES / IMPORT/EXPORT /IMPORT CODES (XML) from the main menu.
A file dialog window opens. Select the XML file that you previously created
and click the OPEN button.
The code list including all comments is immediately imported and displayed in
the Code Manager. If conflicts occur, you receive a warning and have the
option to overwrite only the code for which a conflict was detected, or all
codes.
Figure 372: Options to resolve conficts when importing XML codes
Exporting And Importing Memos In XML
Exporting Memos
You can export selected memos or all memos.
To export all memos,
Choose MEMOS / IMPORT/EXPORT / EXPORT ALL MEMOS (XML) from the main
menu.
ATLAS.ti 7.1 USER MANUAL
EXPORT & IMPORT
415
In the output target dialog select File. Confirm the default name, or enter a
new file name, and save the file to disk.
To export one or more selected memos,
Open the Memo Manager and select one or more memo(s).
Choose MEMOS / IMPORT/EXPORT / EXPORT MEMO (XML) from the main menu.
Select FILE as the output destination. Confirm the default name, or enter a
new file name, and save the file to disk.
Importing Memos
Select MEMOS / IMPORT/EXPORT / IMPORT MEMOS (XML) from the main menu.
A file dialog window opens. Select the XML file and click the OPEN button.
If a naming conflict occurs, you can choose to overwrite all memos, to NOT
overwrite the memo for which a conflict was detected, or to never overwrite an
existing memo.
Figure 373: Options to resolve a conflict
when importing XML memos
When using XML as an exchange format to transfer memos and codes
between HUs, or when creating XML version HUs, you will lose some
formatting of the texts contained in the memos and codes.
Exporting The Hermeneutic Unit In XML
Instead of just exporting a small selected part of your project, you can also
export the entire HU as an XML file. The ATLAS.ti XML export option for HUs
can be used for different purposes:
• For internal use in the XML converter
• For external use as a non-proprietary format, e. g. to archive data. The
qualitative data archive in Essex for example uses ATLAS.ti's XML format as
ATLAS.ti 7.1 USER MANUAL
EXPORT & IMPORT
416
blue print for their standard. See:
http://www.esds.ac.uk/qualidata/about/introduction.asp
• As a means to import data into other applications that offer an import
function like the software QDA Miner. QDA Miner offers further
quantitative analysis tools like cluster, factor and correspondence analysis
and thus for some studies it presents a very useful complement to ATLAS.ti.
To export an HU for any of the above mentioned purposes, select either the
down arrow next to the XML button in the main tool bar and then the
option EXPORT HU TO XML, or form the main menu select PROJECT / EXPORT /
EXPORT HU TO XML.
Select the amount of content that is needed (excluding primary documents,
including meta information or including full content of quotations as well).
Select the output destinatino (Editor, Printer, File, or File & Run), see
"Output Destinations" on page 385).
If you select the 'File' or 'File & Run' option, enter a file name (or accept the
default name) and select the folder where to store the XML file. If you do not
want to apply style sheets, i. e., you need the output for archiving purposes, or
want to import your project into another applicatin, you can save the resulting
XML file to any location.
If you want to apply style sheets, save the XML file in the suggested location,
the ATLAS.ti XML folder.
HTML Export
The HU to XML export and conversion utility allows an alternative and very
powerful and flexible approach to creating web pages for users willing to learn
how to “program” style sheets. Using HTML Export and specifying the layout
using the HTML generator on the other hand is simply a matter of clicking
options without any need to learn HTML.
Potential reasons for creating HTML versions of Hermeneutic Units include:
Create a web publication. Even intermediary results can be presented to other
researchers without much effort. These reports are readable without needing
ATLAS.ti on every system that has a web browser available.
Create a report. A convenient way to create a printout of (almost) all objects
contained in a Hermeneutic Unit using a web browser.
ATLAS.ti’s HTML code generation converts the Hermeneutic Unit currently
being worked with into an HTML document. The user can control the HTML
creation entirely via the HTML Preferences dialog box. Of course, the
generated code can be edited and refined with a plain text editor or specialized
HTML tools if you are knowledgeable in HTML.
ATLAS.ti 7.1 USER MANUAL
EXPORT & IMPORT
417
Exporting An HU As HTML Document
Specify all desired characteristics using the ATLAS.ti HTML setup under TOOLS
/ GENERAL PREFERENCES / HTML PREFERENCES.
Figure 374: The HTML preference window
Select PROJECT / EXPORT / HTML from the main menu.
Select FILE & RUN as the output destination to immediately open the
generated output in a web browser. Select EDITOR if you want to modify the
source before storing it.
Below you see an example of how an ATLAS.ti project in HTML format may
look like:
ATLAS.ti 7.1 USER MANUAL
EXPORT & IMPORT
418
Figure 375: Excerpts of an HTML output
ATLAS.ti 7.1 USER MANUAL
EXPORT & IMPORT
419
Special Considerations
Size Of HTML Documents
The more options you specify in the HTML Preferences dialog, the bigger your
HTML file will be. This may not be a concern if you are using the documents
in-house. However, when making such documents accessible to others via the
Internet, slow transmission rates may demand a reduced set of output options.
In-lined (= content included in the web page) primary documents may boost
the size considerably (and therefore transmission times) depending upon the
size of the documents.
Rich Text
Rich Text formatted documents cannot be included in the resulting HTML
code. All contents from rich text primary documents (including Word files),
comments or memos are converted to plain text for HTML output.
Linking Primary Documents To The HTML File
For each PD, there is an embedded file link. In order to be able to open your
primary documents via this link the the HTML file, you need to copy the
original files into the ATLAS.ti HTML folder. This folder can easily located via
the main menu option TOOLS / EXPLORER / HTML FOLDER.
Network View Images
Checking the option to include Network Views is not sufficient to display them
in an HTML document. The graphic files have to be created manually for every
network that you want to include. By default, a network view entry looks as
follows:
Figure 376: Network Views in HTML files
TO INSERT NETWORK VIEW IMAGES INTO HTML FILES
At first you need to create a graphic file of the network view. This file then
needs to be linked to the generated HTML file.
ATLAS.ti 7.1 USER MANUAL
EXPORT & IMPORT
420
Open the Network View in a Network Editor.
Set the fonts, colors, and the size of the window. Arrange the nodes as
desired.
Choose NETWORK / SAVE AS GRAPHIC FILE from the network editor’s main menu.
Network views can be saved in different formats. Choose Enhanced Metafile
(*.emf) as file format, since this is also the default format used by the HTML
generator.
Save the file, e.g. on the desktop and then copy it into the ATLAS.ti HTML
folder. The HTML folder can easily located via TOOLS / EXPLORER / HTML
FOLDER.
Open the HTML file in the Windows Explorer and go to the Network View
section, e. g. by clicking on the link in the table of contents:
Figure 377: Jumping to the network view section by
clicking on the link in the table of contents
In addition to the textual information and the network view bitmap, you see
the image of the saved network view.
Figure 378: A network view image inserted into an HTML output
ATLAS.ti 7.1 USER MANUAL
EXPORT & IMPORT
421
In other Browsers like Firefox, you can only open the network as external
image. It is not embedded.
Export And Import Of Document Attributes (PD Families)
Please refer to “PD-Family Table” on page 234 for details on how to export
and import document attributes via an Excel™ table.
Exporting A Mobile Project (iPad App)
To export your ATLAS.ti Mobile project from the iPad app to continue your
work in the desktop version (e.g., to run more sophisticated analysis, to link
various objects, or to create network views), two options are available: You can
export your project to the document directory of your iPad or to a Dropbox
account.
If you export it to the document directory, you can download the project from
iTunes to your Mac or PC.
If you upload your project to Dropbox for the first time, ATLAS.ti Mobile will
ask you to enter your access data. You can log out from your Dropbox account
any time (tap the SETTINGS button). This is necessary, for instance, if you want to
change the Dropbox account that is linked to your ATLAS.ti Mobile app.
Export A Project
Select a project and then tab the EXPORT button.
Select the destination: DOCUMENTS DIRECTORY or DROPBOX. You will see a
progress report. If you selected Dropbox as destination, the data are
uploaded to your Dropbox account (thus you need an internet connection)
and it takes a bit longer than saving the project to the iPad document folder.
ATLAS.ti 7.1 USER MANUAL
EXPORT & IMPORT
422
Accessing Your Project In The Documents Directory
To access your project via the Documents Directory, connect your iPad to
your Mac or PC. Wait for iTunes to start.
Select your IPad from the sidebar.
Select the "Apps" tab.
Scroll down to the FILE SHARING interface.
Select ATLAS.ti from the list of File Sharing applications on the left.
Select the folder with your project name and click on the SAVE AS button at the
bottom of the screen.
Figure 379: List of file sharing applications
Accessing Your Project In The Dropbox
Open your Dropbox folder and look for select the folder APPS.
Within the Apps folder you find an ATLAS.ti folder and therein a folder that
has the same name as your project.
Importing A Mobile Project To ATLAS.ti Desktop
Via The Main Menu
Double-click on the project folder that you either downloaded from iTunes,
or the one in your ATLAS.ti Dropbox folder. Inside the folder you'll now find
a folder that contains your documents plus your project file.
ATLAS.ti 7.1 USER MANUAL
EXPORT & IMPORT
423
Figure 380: Document folder and project file
Open ATLAS.ti on your computer and select PROJECT / IMPORT / IMPORT
ATLAS.TI IPAD PROJECT.
Go to the folder where your iPad project is stored and select the project file.
You may not see the file extension 'hprx' if your Windows Explorer is not set
to show file extensions.
A progress bar tells you how far the process has come along. Once finished
ATLAS.ti opens a new HU. This HU has the name of your iPad project.
Via Drag & Drop
Open ATLAS.ti on your PC and drag the iPad project file onto the title bar of
the ATLAS.ti window.
Figure 381: Importing the Mobile project to ATLAS.ti desktop via drag & drop
You do not need to create a new Hermeneutic Unit first before importing
your iPad project. ATLAS.ti will create a new HU. The default name is the
name of your iPad project.
ATLAS.ti 7.1 USER MANUAL
PREFERENCE SETTINGS
424
Preference Settings
All settings from the Preferences dialog are stored in the USER.INI file which
resides in the user’s system folder. The user’s system folder is configured during
installation of ATLAS.ti. You can access this folder any time via the main menu
TOOLS / EXPLORER / USER SYSTEM FOLDER.
Most changes made to general settings won't take effect until the next time
you access their respective functions.
To Set General Preferences
Select the main menu option TOOLS / PREFERENCES / GENERAL PREFERENCES or click the
“General Preferences” button in the main toolbar (see left).
Tab: General
ATLAS.ti 7.1 USER MANUAL
PREFERENCE SETTINGS
425
Figure 382: General Preferences window: tab General
Ring bell on errors
Turn system beeps off and on.
Be serious
Reduce the amount of humor thrown at you in the user interface.
Search with patterns (GREP)
When turned on, the text search and auto-coding functions use regular
expressions (see “GREP Search” on page 215). This setting is also controlled by
the respective checkbox in the text search and auto-code window.
Show Taskbar Tool
Displays an icon in the task bar to easily access the ATLAS.ti window manager.
Length of HU pick list
Specifies the maximum number of Hermeneutic Units that appear in the
“recently used” list at the bottom of the File menu or in the HU Browser.
List name size for quotes
By default, the display name of quotations is 30 characters. The recommended
length is between 30 and 50 characters. Note that size changes apply only to
subsequently created or modified quotations. If you want them to apply to all
existing quotations, from the main menu select QUOTATIONS / MISCELLANEOUS /
UPDATE NAMES.
Display Welcome Wizard
Displays the Welcome screen offering a few start-up options. May be changed
in the Welcome screen.
ATLAS.ti 7.1 USER MANUAL
PREFERENCE SETTINGS
426
Show Tip-Of-the-Day
Displays a tip when starting ATLAS.ti
Show Taskbar Tool
Displays an icon in the task bar to easily access the ATLAS.ti window manager.
Save manager comments silently
Select this option if modifications in the text area of Object and Family
Managers should automatically be saved when selecting another item.
Use right-to-left setting
Activates special user interface features (right text alignment, scrollbars left,
mirroring of tree and list views) for RTL languages such as Hebrew or Arabic.
Tab: HU-Editor
The settings in this section affect the appearance and behavior of the HU editor
and its "child" windows.
Figure 383: General Preferences window: tab HU Editor
Load last used HU upon start-up
When checked, the last HU closed is automatically loaded.
Open maximized
Opens the HU Editor in full screen mode.
ATLAS.ti 7.1 USER MANUAL
PREFERENCE SETTINGS
427
When opening HU load regions with recent PDs
Loads all primary documents of the last session that were loaded in one or
more regions.
Play multimedia PD when loaded
Activates immediate play of a multimedia PD when it is loaded. Display of last
used quotation is not affected by this option.
Loop media clip
By default, a media document is only played once after activating and loading
it. Activate this option to repeat the clip until stopped manually.
Enable drag & Drop rearrange in PD manager
If disabled, you cannot move the position of the primary documents in the
PDocs Manager.
Use special paths (HUPATH, TBPATH)
This option only applies to linked documents. If activated, one of the two
abstract paths (HUPATH or TBPATH) is used if applicable (path or part of the
document‘s path matches a special path). For more information on abstract
paths see the ATLAS.ti version 6 manual. In version 7, linked documents should
only be used exceptionally, and if so the HU or TBPATH are recommend.
Remember windows positions
Stores the position and size of the HU Editor and most other windows.
Auto open
Upon opening the HU editor, automatically opens the selected manager(s)
and/or Object Explorer.
Rollup Window
You can specify to roll up each window by clicking on the icon on the top left
of a window. When you then move the cursor outside the window and left
click, the main part of the window “rolls up” to save space and only the
caption remains. Under the HU Editor preferences you can set the width and
the alignment of the caption and how quickly the window should
appear/disappear.
ATLAS.ti 7.1 USER MANUAL
PREFERENCE SETTINGS
428
Tab: Margin
Figure 384: General Preferences window: tab Margin
Show margin
When checked, displays the margin area to the right of the primary document.
This option can also be changed through the VIEWS/MARGIN AREA menu item or
the corresponding tool button.
Show line numbers
Shows paragraph number pane for textual PDs.
Use images
Adds a type-related icon to the label of the margin objects.
Use Object Colors
Displays codes in user-defined colors. You can set code colors in either the
Code Manager or in a Network View editor.
Display quotation coordinates
Adds the start and end-position (paragraphs [text], [y-]coordinates [graphic]
etc.) of the quotations to the label of the margin objects.
Bracket width
Sets the width of the brackets shown for a quotation in the margin.
Use short name sized
Activate this option to display abbreviated names for the margin objects. The
character limit is chosen in the field next to this option.
ATLAS.ti 7.1 USER MANUAL
PREFERENCE SETTINGS
429
Double click toggles short name
When selecting this option, you can change back and forth between full and
short names by double clicking in the margin area.
Show margin tips
When moving with the mouse pointer over an entity in the margin area, a ‘tip’
is displayed providing information about the entity, such as its name and
comment when this option is activated.
Enable Drag & Drop
Allows drag & drop operation in the margin (like drag & drop coding, replacing
objects, moving codes, hyper-linking).
In-Place-Action
This refers to what happens when you are in-place editing a margin object.
None: No in-place-action will occur.
Global rename: The selected object will be renamed; this affects all occurrences
of this object.
Local replace: The selected object will be replaced at the current position with
an object of the same type and with a name as entered. If no object with this
name exists, it will be created (only for codes or memos).
Include
Codes, Memos and Hyperlinks may be selected separately to be displayed in
the margin area. You can also change these settings using the context menu in
the margin area.
ATLAS.ti 7.1 USER MANUAL
PREFERENCE SETTINGS
430
Tab: Fonts
Figure 385: General Preferences window: tab Fonts
Set the font characteristics for the HU Editor and other windows and controls.
Select Font theme
You can create different font themes, depending on various tasks or project
languages. If for instance you work at different computers and there is a high
resolution screen at one location, the standard font size of 8 might be too
small. If you want to present your project connecting your computer to a
Beamer, you may want to use a larger font so that your audience can read
more comfortably. If your data is in a language that uses special characters, you
need to set a font that is compatible with this language (see below: Show only
fonts compatible with:)
Figure 386: Using different font themes
In Figure 385 and Figure 386 for example you that that a theme has been
created for preparing screen shoots for this manual using Segoe UI 10, and
another theme for presentations using Segoe UI 12.
ATLAS.ti 7.1 USER MANUAL
PREFERENCE SETTINGS
431
Create new theme
Click this button to create a new them.
Delete
Click this button to delete the selected theme.
Font sample
Displays a text sample using the selected font.
Show only fonts compatible with:
You can reduce the list of available fonts to only those that are compatible with
the language of your project data.
You can select all or only some objects using common Windows selection
techniques to change the font for all selected objects at once.
Tab: Storage
The settings in this section relate to backup and file security modes.
Figure 387: General Preferences window: tab Storage
Load HU into memory completely
During a work session, an HU needs to access the HU file to load memos, etc.
If you expect this file to be unavailable at times (e.g., because of an unreliable
local network), you should check this option. However, loading times and
memory consumption are negatively affected when loading the HU completely.
ATLAS.ti 7.1 USER MANUAL
PREFERENCE SETTINGS
432
Cache primary documents
The content of primary documents will be kept available in memory for further
access once it has been loaded. (See “Content Caching” on page 79 for more
information.)
Always create backup copy when saving a HU
When saving the HU, a copy of the existing file with the added extension
‘backup’ is created in the same directory.
Figure 388: File name of backup file for HU
Save auto recovery info every … minutes
ATLAS.ti saves recovery information without any user intervention. The idea
behind such auto-backups: Should ATLAS.ti or Windows crash or in any other
way be terminated irregularly (e.g., a power failure), the amount of work lost is
only the work conducted since the last auto-backup. When exiting ATLAS.ti or
after saving the HU, the auto recovery information is removed automatically. It
is strongly recommended to keep this feature on.
Note: If you are in edit mode, the timer backup is disabled. This means if
your computer crashes while you are in edit mode, the latest recovery file is
from a time before you started the editing session.
Automatic backup path
By default, the folder “Auto Backups” in the user’s personal data folder
hierarchy is used as the repository for periodically stored recovery information.
You can change this by clicking on Browse button.
Tab: Paths
The settings of this section affect the path reference for the common ATLAS.ti
output folders:
ATLAS.ti 7.1 USER MANUAL
PREFERENCE SETTINGS
433
Figure 389: General Preferences window: tab Paths
Textbank Path
The Textbank folder is a location that is provided by ATLAS.ti as a repository
for storing your HU files, and as an optional location for storing your data files
if you work with linked rather than managed documents. See user manual
ATLAS.ti version 6 for more detail on working with linked documents.
HTML Path
Specifies the path to which HTML files are saved and where HTML support files
(e.g., style sheets) are located.
XML Path
Specifies the path to which XML output is saved and where all style sheets and
support files are located.
SPSS Path
Specifies the path to which syntax and data files related to the SPSS output are
stored.
Tab: Text-Editors
The settings of this section affect the behavior and appearance of the editors
used for displaying and writing comments and memos, and for the PD pane
when displaying text documents.
The following options can be set for the text editors and for the PD pane
independently:
ATLAS.ti 7.1 USER MANUAL
PREFERENCE SETTINGS
434
Figure 390: General Preferences window: tab Text Editors
Wrap mode active
If checked, line wrapping occurs as selected in the following option:
Wrap at margin
If wrap mode is activated, this option defines wrap in more detail. If checked,
text is wrapped at the current right border of the text pane or the HU-Editor
pane. If unchecked, wrap is calculated for the usable page width for the
currently selected printer.
Always on top
When checked, the editors will float on top of all other windows. This option
can be individually set in the editor itself.
Marker Color
You can mark selected text passages – when working on editable text – similar
to using a highlighter on paper. However, unlike the non-destructive temporary
selection and highlighting of text when displaying a quotation, this option
actually modifies the text.
Click CHANGE COLOR to select a different marker color.
Non-DBCS Language Support
The user can specify the language encoding. This becomes necessary if the
language of the document differs from the language of the Windows
installation. However, an appropriate font still needs to be chosen. For general
information on this issue consult chapter “Language Settings“ on page 64.
Use this Language: Permanently selects an appropriate code page matching the
character set used in your documents (e.g., 932 for Japanese text).
ATLAS.ti 7.1 USER MANUAL
PREFERENCE SETTINGS
435
Use Windows Language for Bar setting: Activate this option to use the
Windows language settings.
The Language bar provides a quick way to change the input language or
keyboard layout from your desktop. You usually find it minimized at the
bottom left-hand side of your task bar. However, it could also be located
elsewhere on your desktop.
Don’t Convert text: Do not use any code page other than the default code
page (0). Extracted text is considered native. This is the default setting.
Tab: PD Printing
The settings of this section affect the appearance of the document that is
printed when selecting the option DOCUMENTS/OUTPUT/PRINT WITH MARGIN.
Figure 391: General Preferences window: tab PD Printing
Print header page
If checked, creates a header info page for the primary document.
Units of measurement
You may select from inches, mm, cm, pts and picas.
Left, right, top, and bottom margin: Change the settings for the page margins.
Added offset to margin area
Adds designated amount of space between the text document and the margin
area.
ATLAS.ti 7.1 USER MANUAL
PREFERENCE SETTINGS
436
Tab: Memos
Figure 392: General Preferences window: tab Memos
Prompt for title
Allows you to enter a title manually for a newly created memo (recommended).
Auto title
Automatically generates a memo title using the given template. The template
can be edited. Several macro variables can be used in the template:
%d
inserts the current date
%D
inserts date and time
%a
inserts the current user
%h
inserts the HU’s name
Open editor on new memo
When a memo is created, a memo editor is opened.
Open editor on double-click/list quotes
Specifies the double-click behavior for memos in the Memo Manager: You can
choose either to open the editor or to list the quotations linked to a memo. The
recommendation is to deactivate this option as you have easy access to the
memo editor by clicking on the editor button in the tool bar.
Global Memo Types
Specify the default type used when creating a memo. Also allows modifying,
adding, and removing memo types. For details see “Memo Types” on page
246.
ATLAS.ti 7.1 USER MANUAL
PREFERENCE SETTINGS
437
To Set Network Preferences
Unlike settings modified using the Network Editor's menu commands, several
options can be made permanent using the network preferences dialog. Note
that most modifications are not immediately displayed in the Network Editors.
Close and reopen a Network Editor to see these changes.
For all options that were already described in the Network Editor’s menu
description, there will only be a reference.
The Network Editor preferences are activated either from the HU editor’s
NETWORKS / PREFERENCES or from the Network Editor’s SPECIALS / PREFERENCES menu.
ATLAS.ti 7.1 USER MANUAL
PREFERENCE SETTINGS
438
Tab: General
Figure 393: Network Preferences: tab General
Display nodes 3D
Display nodes as simple boxes with a 3-D border. Uncheck for a box with a
drop shadow.
Display grid
Overlays the network view with a grid to help with manual placement of
nodes. As the grid is colored light gray, you need to use a different background
color when using this feature.
Automatic redraw (default)
If disabled, the network editor will redraw its contents only when forcing a
repaint via DISPLAY / REFRESH DISPLAY (or by pressing F5). If the automatic redraw
does not work properly (i.e., certain things are not displayed correctly), press
F5.
Display node icon
Display a type specific icon for the nodes.
Draw box for link label
Switches between plain text display and boxed display of link labels.
Rotated link label
Displays labels rotated, e.g., alongside the link between two objects.
Background color
Sets the color for the network editor’s canvas.
ATLAS.ti 7.1 USER MANUAL
PREFERENCE SETTINGS
439
Node color
Sets the color for (code) nodes.
Auto color with background
If activating this option, the background color is also used in auto color mode
(which is set to white by default).
Green part
Customizes the auto color procedure.
Range min
Customizes the auto color procedure.
Max node width
The maximum horizontal size in pixels within which the node's text is
formatted.
Tab: Nodes
This page allows you to define the default settings for the display of nodes.
Figure 394: Network Preferences: tab Nodes
Codes Verbosity
Controls the length of the node name displayed for codes (and memos). You
have the option to display the name only, or the name plus comment. If
“Name plus comment” is selected, you may also define how much of the
comment should be displayed: First line, first paragraph, or the full text of the
comment (see options to the right).
ATLAS.ti 7.1 USER MANUAL
PREFERENCE SETTINGS
440
Quotation verbosity
Allows four increasing amounts of information to be displayed.
If comment is displayed
Select how much text of a comment should be displayed: first line, first
paragraph or the full text.
Full image for PDs
Displays graphical PDs as small images, also called "thumbnails.”
In addition, you can set the horizontal width in pixels for all displayed graphical
PD thumbnails.
Box for quotations / primary Documents / Memos
Display quotation, primary document and memo nodes inside a bounding box.
Tab: Fonts
Figure 395: Network Preferences: tab Fonts
You can globally specify a font for all nodes and links. In addition, you can
choose how the network title and comment should look when outputting a
network. Font changes for nodes and links are visible the next time you open a
Network View.
Tab: Printing
Network Views are printed as bitmaps. You have the following options: to
include the title and comment (info page), to draw a border around the
Network View, and to print or ignore the background color. Furthermore you
can scale the Network View down or up to fit it to the page size. The margin
settings can also be set to suit individual preferences.
ATLAS.ti 7.1 USER MANUAL
PREFERENCE SETTINGS
441
Figure 396: Network Preferences: tab Printing
Tab: Miscellaneous
When loading an HU, all relations used inside the HU are imported. This is
comparable to word processors that use styles. For relations imported by
loading another HU, the default strategy is to not overwrite already loaded
relations with the same ID (“Don’t touch existing relations”).
Example: If your standard set of relations as defined in the file default.rel
contains a relation ISA with line width 2, and the HU just loaded contains the
same relation but defined with width 1, all Network Views (of any HU loaded)
will display any ISA link with a width of 2. Furthermore, when you save any of
the HUs, their original relational definitions are exchanged with the current
ones.
ATLAS.ti 7.1 USER MANUAL
PREFERENCE SETTINGS
442
Figure 397: Network Preferences: Miscellaneous
Choosing the option “Overwrite existing relations” does the following: If a
new HU is opened, all already loaded relations that use the same ID as relations
in the newly opened HU are replaced. This changes the characteristics of the
links in the HU loaded previously. Although this is complicated , problems
rarely occur because different relations with the same name are not very
common in everyday work.
To Set HTML Preferences
A number of options can be set to customize the appearance of the generated
HTML document.
To set HTML preferences, select TOOLS / PREFERENCES / HTML PREFERENCES from
the main menu.
Tab: General
ATLAS.ti 7.1 USER MANUAL
PREFERENCE SETTINGS
443
Figure 398: HTML Preferences: tab General
Character Encoding
Controls interpretation of characters encoded with values beyond 7-bit ASCII.
The default is UTF-8. UTF-8 has become the dominant character encoding for
the World-Wide Web, accounting for more than half of all Web pages.
File extension for image links
If you want to include network views in HTML output, you need to save them
as graphic files to the ATLAS.ti HTML folder (see “General Preferences Setting
Tab: Paths“ on page 432, and “To insert Network View images into HTML
files“ on page 419.
Short Report
Only the name, author, date, and commentary of the HU become part of the
HTML document. All other setup options are disabled.
Create contents table
A list of all sections in the HTML page is created. All sections can be jumped to
from the contents table.
Include HU comment
Includes the HU’s comment in italics.
Include statistics
A short numerical summary of the main objects included in the HU is created.
Include link to project
A link is included that allows the reader of the HTML page download the HU
itself. If this link is activated, a copy bundle version of the project must be
provided and copied to the location of the HTML page.
Include author(s)
Includes the name of the HU’s author and co-authors, if any.
ATLAS.ti 7.1 USER MANUAL
PREFERENCE SETTINGS
444
Tab: Primary Docs
Figure 399: HTML Preferences: tab Primary Documents
Include Primary Docs section
Check this box if you want to include information about the PDs.
Bullets: Displays a specific icon with every PD description.
Comment: Includes the PD’s comment.
Inclusion date: Includes the date the PD was assigned to the HU.
URL Reference (Text and JPEG only): Includes a clickable link to the PD file.
Note that if the files are plain ASCII, JPEG, or of another suitable file type, PDs
can be displayed by most web browsers without additional plug-ins.
Content (Text and JPEG only): Displays the contents of the PDs within the
created HTML document itself. The same restrictions for file types apply as in
“Reference to PD”. Note that the size of the web page increases significantly
with the in-lined inclusion of PDs.
Quotations: Only the number of quotations is included.
Codes: Displays the codes used for coding the PD.
Memos: Displays memos (titles) used for the PD.
Use absolute paths for test runs
Check this option when testing the web page on your local computer. Absolute
paths to all PDs are included in the links created. Make sure to uncheck this
box when you are creating the final page to be uploaded to a web server.
When unchecked, all paths will be removed, assuming that the PD files are
then located in the same location as the web page itself. Without this option,
all PDs accessed from the web page created would have to be copied to the
HTML directory to be displayed properly when needed.
ATLAS.ti 7.1 USER MANUAL
PREFERENCE SETTINGS
445
Don’t wrap inlined text
Use the line breaks of the original text. If unchecked, line breaks are removed
in order to let the HTML browser apply dynamic wrapping.
ATLAS.ti 7.1 USER MANUAL
PREFERENCE SETTINGS
446
Tab: Codes
Figure 400: HTML Preferences: tab Codes
Include codes section
Includes information about codes.
Bullets: Displays a specific icon with every code description.
Summary: Lists all codes including the label, groundedness, and density count.
List sorted by:
• includes scrollable lists that sort the codes alphabetically
• includes scrollable lists that sort the codes by number of text references, i.e.,
groundedness.
• includes scrollable lists that sort the codes connectivity, i.e. number of code
neighbors (= density).
Full description section including comments: All codes that have comments are
listed in an extra section. The summary has links to these descriptions for all
commented codes.
ATLAS.ti 7.1 USER MANUAL
PREFERENCE SETTINGS
447
Tab: Memos
Figure 401: HTML Preferences: tab Memos
Include memos section
Includes information about memos.
Bullets: Displays the memo icon with every memo description.
Full text: Includes the complete text body.
Do not wrap lines: Keeps the line/paragraph structure of the memo intact.
ATLAS.ti 7.1 USER MANUAL
PREFERENCE SETTINGS
448
Tab: Families
Figure 402: HTML Preferences: tab Families
Include families section
Includes information about families.
Bullets: Displays the family icon with every family description.
Include (3 options):
• PD families
• code families
• memo families
ATLAS.ti 7.1 USER MANUAL
PREFERENCE SETTINGS
449
Tab: Network Views
Figure 403: HTML Preferences: tab Network Views
Include networks section
Includes information about Network Views.
Bullets: Displays a specific icon with every Network View description.
Node list: Includes a textual description of every node.
Code neighbors list: Textual description of the complete network structure in a
“thesaurus style” format: for every alphabetically listed node, displays its direct
neighbors.
Hierarchical list: Converts the network into a hierarchy. Identifies the root
objects and displays an indented “forest” of trees.
Reference to Network View graphic files: Includes links to the graphic files
created from the Network Views. These files have to be created manually. A
common file format is Windows Enhanced Metafile (emf). See “Save Network
View as Graphic File” on page 340.
Inline Network View graphic files: As above, but displays the graphic images in
the web page itself.
To Set Google Earth Preferences
To set Google Earth preferences, select TOOLS / PREFERENCES / GOOGLE EARTH
PREFERENCES from the main menu.
ATLAS.ti 7.1 USER MANUAL
PREFERENCE SETTINGS
450
Figure 404: Google Earth Preferences
Tab: General
Embed GoogleEarth within HU Editor
Toogle between embedding GE in to the HU editor or diplaying GE in a
separate window.
Timeout for starting
Increase this value if it takes a longer time for GE to start and ATLAS.ti does not
position to a camera view.
Fly-to-speed
Adjust the speed that is used to travel between two quotations.
Tab: Snapshots
Decide which tags, buttons and settings should be included when creating a GE
snapshot from a GE document.
Tab: Export
Open features after Exporting to GoogleEarth
When creating a new quotation, you need to export it to GE before you can
see it (see “Error: Reference source not found on page Error: Reference source
not found). When you activate this feature, the Tomporary Places tree is shown
showing the HU and the quotations as branches.
ATLAS.ti 7.1 USER MANUAL
PREFERENCE SETTINGS
451
Extrusion
Set the distance between the placemark icon and the ground in meter.
Snippet lines
Set the number of lines that are displayed for the quotation comment in the
Google Earth Places Panel.
Include meta data in quotation export
Decide which meta information for a quote should be transferred and displayed
in Google Earth.
Tab: Import
Import file or folder name for KML / KMZ files
Decide which default PD name should be use for your KML and KMZ files.
Import placemarks when assigning Pds
Select whether you want to import placemarks when assigning a KML or KMZ
file as primary document.
Default name for quotation
Decide which default name should be used for GE quotations: the name of the
primary document or the name of a feature, if available.
To Set PDF Preferences
To set PDF preferences, select TOOLS / PREFERENCES / PDF PREFERENCES from the
main menu.
ATLAS.ti 7.1 USER MANUAL
PREFERENCE SETTINGS
452
Figure 405: PDF Preferences
Tab: Display
Default page display mode: Choose between continuous and single page
mode.
Display text optimized for LCD screen: This smoothes text aso it displays better
on LCD screens and laptops.
Selection highlight color: When highlighting sections in a PDF document, the
color shown in the box is used as highlighting color. Select a different color by
clicking on the box.
Tab: Navigation
Open bookmarks navigator when loading a PDF doc: If you have documents
that contain bookmarks, they can be displayed in the navigation pane on the
right-hand of the HU Editor.
Expand all bookmark levels: Select to show all bookmark levels.
Figure 406: Display of bookmarks in side panel
ATLAS.ti 7.1 USER MANUAL
PREFERENCE SETTINGS
453
To Set Live Update Preferences
The default is set to check for updates when starting the software. You are
alerted if new service packs are available.
Installing service packs is only possible if the user has administrative rights to the
computer and, under Vista / Windows 7 & 8, if ATLAS.ti is explicitly run as
administrator (see below).
If a user does not have administrative rights, it is best to deactivate the automatic
check and ask your administrator from time to time to update ATLAS.ti for you.
Figure 407: Live Update Connection Settings
A three-months interval is recommended.
Tab: Automatic Update Check On Startup
Prohibit checking for updates for all users: Select if you do not want ATLAS.ti to
check for updates when starting.
Check for updates on startup (default): Every time you start ATLAS.ti, ATLAS.ti
checks whether there are new service packs available and prompts you to
update.
Tab: Proxy Settings
You can set a number of proxy settings. The default is for automatic proxy
detection, but it is also possible to enter a host number and port number
manually.
ATLAS.ti 7.1 USER MANUAL
PREFERENCE SETTINGS
454
Tab: Miscellaneous Connection Settings
Do not ping server to check connectivity: Ping is a network program that sends
short data packages ("echo requests") to a particular host and then listens to a
response. Ping also measures the round trip time of a package---the time
elapsed between when a package is sent and a response is received. Ping
enables you to find out a server IP address and determines the accessibility of
the server. If you do not want this, activate this option.
To Set The User Interface Language
Currently you can switch between the default language English and Spanish.
Other languages will follow soon, German will be next. (Star Trek fans, try out
Klingon!)
To switch from the default language to Spanish or any other language, select
TOOLS / PREFERENCES / SET USER INTERFACE LANGUAGE PREFERENCES.
Figure 408: Set User Interface Laguage
You need to restart ATLAS.ti for it to take effect. Click OK.
Figure 409: Restart ATLAS.ti after changing the user interface
language
ATLAS.ti 7.1 USER MANUAL
APPENDIX
455
Appendix
Useful Resources
The ATLAS.ti Website
http://www.atlasti.com
The ATLAS.ti website should be a regular place to visit. Here you will find
important information such as video tutorials, additional documentation of
various software features, workshop announcements, special service providers,
and announcements of recent service packs and patches.
Quick Tour
http://quicktour.atlasti.com
To get started, we recommend to work your way through the Quick Tour. In
about two hours you get an overview of the main functions and an idea on
how to conduct an analysis with ATLAS.ti. When you are ready to start your
own project, use the “Short Manual”(see below) as your continuing guide.
ATLAS.ti 7 – What's New
http://whatsnew.atlasti.com
This document is intended specifically for users who already have experience
using the previous version, ATLAS.ti 6, and who are making the switch to the
latest generation, in this case v.7.
ATLAS.ti 7.1 USER MANUAL
APPENDIX
456
Full Manual and “How To” Documents
http://manual.atlasti.com
Find information on network installation, tips and tricks and special instructions
on how to work with specific type of documents.
Video tutorials
http://tutorials.atlasti.com
If you like to learn via video tutorials, we offer a range of short videos on the
following topis: Features and Interface, Getting started on a project, Coding,
Visualizing – Working with Network Views and Hyperlinks.
Library
http://library.atlasti.com
The library contains a list of white papers by various authors (mostly ATLAS.ti
trainers and consultants) extracted from past newsletters. Submissions are
always welcome.
Knowledge Base
http://kb.atlasti.com
Search the knowledge base for immediate questions you may have related to
licenses, installation, update procedures, trouble shooting or use-related
questions. A quick search may already provide the answer without having to
dig for an answer in the full manual.
Social Media
YouTube
http://youtube.atlasti.com
You find a growing number of video tutorials on the ATLAS.ti YouTube
channel. So far videos are available in English and Spanish, other to come.
ATLAS.ti 7.1 USER MANUAL
APPENDIX
457
Facebook
http://facebook.atlasti.com
Stay updated with the latest news on product updates, special offers, new
training materials, etc. by joining us on Facebook. We are also happy to hear
from users via facebook. Stop by and let us know about your projects and
experience with ATLAS.ti!
Twitter
http://twitter.atlasti.com
Follow us on Twitter for the most essential bits of information and
announcements (version and service pack releases, special offers, training
opportunities, etc.).
Newsroom
http://newsroom.atlasti.com
The newsroom aggregates all pertinent company news conveniently on a single
platform. Press releases, articles and comments from the various ATLAS.ti
profiles on social networking sites are agglomerated in real time. In addition,
the newsroom lets you subscribe to available content via RSS so you're always
up-to-date on what's going on with ATLAS.ti.
The Help Menu
You can access a number of resources via the ATLAS.ti Help menu:
ATLAS.ti 7.1 USER MANUAL
APPENDIX
458
Figure 410: Accessing resources via the Help menu
The options provided via the More Resources sub menu may change over time
reflecting the up-to-date status on documentations available. So it may be
worthwhile to check this menu from time to time.
All options present links to internet web sites. Thus, you need to be online to
access these resources. Apart from the Coding Analyis Toolkit (CAT), all other
options are self-explanatory. Therefore, you find a brief introduction to CAT in
the section “Calculating Inter-Coder Reliability using CAT“ on page 304.
Updates and License: All options related to updating and licensing have been
subsumed here.
Figure 411: Update and License sub menu
Getting Support
http://support.atlasti.com
The easiest way to contact the Support Center is via the main menu option HELP
/ MORE RESOURCES / CONTACT SUPPORT. Or access the Support Center directly via
the above URL.
ATLAS.ti 7.1 USER MANUAL
APPENDIX
459
From the categories provided, select the appropriate option so your request can
be processed as quickly as possible.
Figure 412: List of support channels
Frequently Asked Questions
http://kb.atlasti.com
Frequently asked questions are collected in our knowledge base on our
website.
To access the site directly from ATLAS.ti, select HELP / MORE RESOURCES / VISIT
FAQ from the HU editor’s main menu. An active Internet connection is
required to access this web page.
Forum
http://forum.atlasti.com
ATLAS.ti maintains various a large forum for peer-to-peer communication, i. e.
for users to (virtually) meet, exchange experiences with the tool, share tips and
tricks, and discuss technical and methodological issues that arise with the use of
the program.
Note that the forum is not an actual support channel but a place for the
larger community to discuss issues of general interest in a publicly visible
way. If you experience technical difficulties, please contact Support (see
above). Technical advice by other users should always be used with caution
and is not always accurate. A competent diagnosis of technical problems
can only be made by our support team after examining your actual
installation.
ATLAS.ti 7.1 USER MANUAL
APPENDIX
460
Mailing List Archive
Like the forum, the mailing list is another tool for peer-to-peer discussion,
advice, and tips.
The complete mailing list archive can be conveniently accessed via HELP / MORE
RESOURCES / THE MAILINGLIST ARCHIVE.
Reporting Bugs
Most errors that occur during the operation of ATLAS.ti are displayed and
written to a special log file named ERROR.LOG. This text file is located in the
user system directory.
The contents of this file can only be interpreted by the developers of the
program and is of no use for others. If you file a bug report, you might be
asked to send a system report including this file to a specified support e-mail
address.
The error report contains the following:
• The ERROR.LOG file.
• The System Report (which you can view via HELP / TECH SUPPORT INFO / DISPLAY
SYSTEM REPORT)
• The user’s configuration file USER.INI.
• The ATLAS.ti configuration file ATLAS.INI.
• The list of files in ATLAS.ti’s program folder.
• The list of files in the user’s system folder.
The information in the package contains technical information needed for the
technical support personnel to analyze and respond to reported problems.
Except for the content of the ERROR.LOG, the system report and two INI files/
No other file content is transferred.
To send an error report, from the main menu, select HELP / TECH SUPPORT INFO /
CREATE AND MAIL REPORT.
A message informs you that the report has been created and which files it
includes. Click OK.
ATLAS.ti 7.1 USER MANUAL
APPENDIX
461
Figure 413: This message informs about about the files included in the
bundle
ATLAS.ti launches your default email client and creates a new message
addressed to an ATLAS.ti support address.
The report file (extension: “.AtlRep”) should already be attached to the mail
automatically. In cases where it isn't, please attach it manually; its exact
location is indicated in the on-screen message.
The body of the message displays additional instructions.
Always include a description of the problem in your own words along with
the report—the report file only”knows” about the state of your ATLAS.ti
installation but not the circumstances of how a problem occurred. Describe
in as much detail as necessary: What exactly were you doing when the
problem occurred, what exactly happened, can the problem be reproduced
and under what circumstances. In particular, also be sure to quote any error
messages that you may see. Our support staff needs this information and
will be happy to assist you once all the information is provided.
Make sure you have an active Internet connection and send the mail. Our
support team will usually respond in less than 24 hours.
Service Packs & Patches – Live Update
Program updates (patches and service packs) are regularly available to update
your installation. The program downloads and installs these service packs
automatically.
ATLAS.ti 7.1 USER MANUAL
APPENDIX
462
Provided you have administrative rights to your computer (note: under VISTA
and Windows 7, you need to explicitly run ATLAS.ti as administrator in addition
to being logged in with full administrator rights in Windows), ATLAS.ti checks
for new service packs upon start up (this requires an Internet connection). If a
new service pack is found, you will be informed and asked to install it.
To Run The Software As Administrator (for VISTA And
Windows 7 Users)
Right click on the program icon instead of double clicking. From the context
menu, select the option (that appears in the language of your Windows
system) RUN AS ADMINISTRATOR.
Alternatively, hold down the Ctrl+Shift key when you start ATLAS.ti.
A Windows message pops up that you need to confirm. Next, a message
generated by ATLAS.ti pops up informing you that you run the software in
administrative mode. Confirm this message as well.
Now you should have the necessary rights to install service packs (and also to
create new user accounts).
Live Update Settings
You find the settings for the live update under HELP / UPDATES
AND
LICENSE
Figure 414: Live update settings
ATLAS.ti 7.1 USER MANUAL
APPENDIX
463
You have the option to prohibit the live update for instance for settings where
users to not have administrative rights to the computer. Or if internet access is
not always available. Then it can become quite annoying if ATLAS.ti starts the
update request, just to find out after half a minute that no Internet access is
available.
You can set the proxy settings or enter an authentication if needed.
We strongly recommend that you leave automatic update checking enabled
(see Help menu). By always keeping ATLAS.ti up-to-date you avoid
problems and benefit from ongoing continuous development of new tools
and features. Also, in case you need to request assistance with a technical
problem, our support team may not be able to assist you as quickly if your
installation is severely out-of-date
Updating regularly is beneficial on all levels, so the adage “never change a
running system” we sometimes hear is--at least as far as ATLAS.ti is
concerned--a misguided superstition that will hamper you more than anything.
If it wasn't for the many (free) service packs/updates we publish for each
program generation, users would still not be able to perform a great many
tasks that they hence have come to consider essential for their work, such as
survey processing, XML stylesheets, smooth PDF, and many more. All of these
were introduced in free service packs!
Manual Installation Of Service Packs
For those rare cases where an Internet connection is not available to use the
comfortable live update procedure (usually users on highly secure networks),
there is a workaround that lets you install the service packs manually.
This is not the recommended procedure for any installation where a normal
live internet connection exists. Such users should rely on the much more
convenient Live Update process.
The manual update procedure is as follows:
Check your current version including the build number and the most recent
version.
As updates (service packs and patches) for ATLAS.ti are incremental you may
need to download a number of files to update your installation. Ask our
support to provide you will a direct link to download the appropriate files
(HELP / MORE RESOURCES / SUPPORT CENTER).
Download these files and then copy them into a special folder of your
ATLAS.ti installation so that the service pack manager will find them. You can
access the default folder via TOOLS / EXPLORER / SERVICEPACK FOLDER.
After you have downloaded, transferred the files to the ATLAS.ti computer into
the so called “Service Pack Folder”:
ATLAS.ti 7.1 USER MANUAL
APPENDIX
464
Start ATLAS.ti (if not already opened)
Launch the Service Pack Manager while holding the SHIFT key (!): HELP /
UPDATE AND LICENSE/ SERVICE PACK MANAGER.
Holding down the SHIFT key prevents the Service Pack Manager from trying to
connect to our server.
Figure 415: The Service Pack Installer window
The update file(s) (*.spk) should be displayed. Click INSTALL to proceed and
follow the instructions on your screen. If multiple updates need to be
installed, you may have to repeat the procedure.
ATLAS.ti 7.1 USER MANUAL
INDEX
465
Index
Administrator.................................................................................................................................................................................................148
Author............................................................................................................................................................................................................147
Auto Coding..................................................................................................................................................................................................219
Scope..........................................................................................................................................................................................................220
Automatic backup..........................................................................................................................................................................................128
Boolean operators..........................................................................................................................................................................................260
Co-authors.....................................................................................................................................................................................................152
Code Migration..............................................................................................................................................................................................349
Codes
Comments..........................................................................................................................................................................................195, 410
Deleting......................................................................................................................................................................................................204
Display........................................................................................................................................................................................................189
Free codes...................................................................................................................................................................................................201
Renaming...................................................................................................................................................................................................203
Coding...........................................................................................................................................................................................................187
Code-by-list................................................................................................................................................................................................193
Collaboration.................................................................................................................................................................................................147
Commutativity...............................................................................................................................................................................................263
Conceptual level.............................................................................................................................................................................................166
Copy Bundle........................................................................................................................................................................................................
Conflicts......................................................................................................................................................................................................134
Migrate.......................................................................................................................................................................................................132
Restore.......................................................................................................................................................................................................132
Paths..........................................................................................................................................................................................................133
Degree (nodes)..............................................................................................................................................................................................308
Dimension......................................................................................................................................................................................................409
Drag & Drop................................................................................................................................................................................61, 72, 76, 277
Embedded Objects...................................................................................................................................................................................66, 140
Editing........................................................................................................................................................................................................143
Epistemological primitives..............................................................................................................................................................................311
Error.log file...................................................................................................................................................................................................460
Export network..............................................................................................................................................................................................349
Extension.......................................................................................................................................................................................................262
Families..........................................................................................................................................................................................................225
Add items...................................................................................................................................................................................................228
As filters......................................................................................................................................................................................................231
Create.........................................................................................................................................................................................................228
Create from network views.........................................................................................................................................................................241
Family Manager..........................................................................................................................................................................................227
Remove......................................................................................................................................................................................................233
Filter 381
Fonts 440
Graph theory..................................................................................................................................................................................................308
Grounded Theory...................................................................................................................................................................................187, 311
Hermeneutic Unit.................................................................................................................................................................................................
Load last used...............................................................................................................................................................................................61
Save..............................................................................................................................................................................................................61
Hermeneutic Unit editor...................................................................................................................................................................................29
Hierarchical view............................................................................................................................................................................................368
HTML...................................................................................................................................................................................................................
Absolute paths............................................................................................................................................................................................444
Code lists....................................................................................................................................................................................................446
Contents table............................................................................................................................................................................................443
ATLAS.ti 7.1 USER MANUAL
INDEX
466
File size.......................................................................................................................................................................................................419
Include HPR link.........................................................................................................................................................................................443
including network views.............................................................................................................................................................................419
Inlined documents......................................................................................................................................................................................444
Inlining network views................................................................................................................................................................................449
PD reference...............................................................................................................................................................................................444
Preferences.................................................................................................................................................................................................442
Reference to network view.........................................................................................................................................................................449
Short report................................................................................................................................................................................................443
HU Editor.............................................................................................................................................................................................................
launching object manager.............................................................................................................................................................................30
Margin Area................................................................................................................................................................................................188
Status Bar......................................................................................................................................................................................................33
title bar.........................................................................................................................................................................................................30
Hyperlink..............................................................................................................................................................................................................
Defining new relations................................................................................................................................................................................360
Hypertext.......................................................................................................................................................................................................352
Creating links..............................................................................................................................................................................................357
Import network..............................................................................................................................................................................................350
Incremental Search...........................................................................................................................................................................................41
Integration.......................................................................................................................................................................................................10
Intension........................................................................................................................................................................................................262
Intensional Codes...........................................................................................................................................................................................275
Layout............................................................................................................................................................................................................337
Line/Paragraph Numbers.................................................................................................................................................................................30
Link comments...............................................................................................................................................................................................363
Margin Area...................................................................................................................................................................................205, 210, 363
Memo Editor..................................................................................................................................................................................................244
Memo families...............................................................................................................................................................................................242
Memos.................................................................................................................................................................................................................
Types..........................................................................................................................................................................................................246
Use as PDs..................................................................................................................................................................................................247
vs. Codes....................................................................................................................................................................................................243
Memos ..........................................................................................................................................................................................................243
Merge Codes.................................................................................................................................................................................................205
Merge HUs....................................................................................................................................................................................................154
Link conflict resolution................................................................................................................................................................................158
Merge Wizard.............................................................................................................................................................................................156
Report.........................................................................................................................................................................................................160
Scaled codes...............................................................................................................................................................................................159
Stock strategies...........................................................................................................................................................................................156
Strategy......................................................................................................................................................................................................155
Add.........................................................................................................................................................................................................155
Choosing.................................................................................................................................................................................................156
Ignore......................................................................................................................................................................................................155
Tuning.....................................................................................................................................................................................................157
Unify.......................................................................................................................................................................................................155
Unify PDs................................................................................................................................................................................................155
Target HU...................................................................................................................................................................................................155
Using Ignore Families..................................................................................................................................................................................155
Mind maps.....................................................................................................................................................................................................307
MSXML................................................................................................................................................................................................................
version........................................................................................................................................................................................................399
Multi-authoring..............................................................................................................................................................................................147
Named links...................................................................................................................................................................................................310
Network Editor...............................................................................................................................................................................171, 310, 312
Change Relation.........................................................................................................................................................................................323
Color...........................................................................................................................................................................................................346
Drag & Drop...............................................................................................................................................................................................368
Drag text from Word..................................................................................................................................................................................317
Edit Hyperlink.............................................................................................................................................................................................365
Fonts...........................................................................................................................................................................................................347
Import neighbors........................................................................................................................................................................................331
Link Display................................................................................................................................................................................................310
Link nodes..................................................................................................................................................................................................319
Links.................................................................................................................................................................................................................
Cut..........................................................................................................................................................................................................323
Merge Codes..............................................................................................................................................................................................350
ATLAS.ti 7.1 USER MANUAL
INDEX
467
Nodes...............................................................................................................................................................................................................
Appearance.............................................................................................................................................................................................348
Import.....................................................................................................................................................................................................316
pending changes...........................................................................................................................................................................................62
Preferences.................................................................................................................................................................................................437
save as graphic............................................................................................................................................................................................340
Traverse Hyperlinks.....................................................................................................................................................................................362
Network View Manager.........................................................................................................................................................................316, 372
Network views...............................................................................................................................................................................................309
as contents table.........................................................................................................................................................................................352
Creating......................................................................................................................................................................................................315
Networks.......................................................................................................................................................................................................307
Node types.............................................................................................................................................................................................310, 313
Nodes.............................................................................................................................................................................................................308
Object Crawler.......................................................................................................................................................................................171, 366
open..........................................................................................................................................................................................................366
Object Explorer..............................................................................................................................................................................................368
Object Managers.................................................................................................................................................................................................
Codes...........................................................................................................................................................................................................47
Primary documents.......................................................................................................................................................................................42
Quotations....................................................................................................................................................................................................45
Selecting items..............................................................................................................................................................................................40
Order (nodes)................................................................................................................................................................................................308
Parallel search................................................................................................................................................................................................212
Password........................................................................................................................................................................................................149
PD Family Table.............................................................................................................................................................................................239
Export.........................................................................................................................................................................................................240
Plain Text.......................................................................................................................................................................................................140
Preferences............................................................................................................................................................................................346, 424
Backup........................................................................................................................................................................................................431
Display........................................................................................................................................................................................................426
Fonts...........................................................................................................................................................................................................429
General.......................................................................................................................................................................................................425
HTML.........................................................................................................................................................................................................416
Printing.......................................................................................................................................................................................................435
Text Editors......................................................................................................................................................................................432p., 435
Primary document................................................................................................................................................................................................
Caching........................................................................................................................................................................................................78
Change Position............................................................................................................................................................................................76
Disconnect....................................................................................................................................................................................................86
family................................................................................................................................................................................................................
SPSS........................................................................................................................................................................................................241
Load.............................................................................................................................................................................................................77
Marking segments......................................................................................................................................................................................166
Navigation....................................................................................................................................................................................................80
Renumber.....................................................................................................................................................................................................77
Primary Document Pane..................................................................................................................................................................................30
Primary Documents..............................................................................................................................................................................................
Multimedia...................................................................................................................................................................................................68
Plain Text......................................................................................................................................................................................................67
RTF 66
saving.........................................................................................................................................................................................................140
Size Restrictions............................................................................................................................................................................................66
Supported Formats.......................................................................................................................................................................................63
Word............................................................................................................................................................................................................66
Project Maintenance............................................................................................................................................................................................
Copy Bundle...............................................................................................................................................................................................129
Project Management......................................................................................................................................................................................118
Project planning.............................................................................................................................................................................................338
Proximity Operators.......................................................................................................................................................................................263
Qualitative Analysis.........................................................................................................................................................................................9p.
Query Tool...........................................................................................................................................................................................................
Boolean operators.......................................................................................................................................................................................260
QueryTool......................................................................................................................................................................................................258
Boolean operators.............................................................................................................................................................................................
AND........................................................................................................................................................................................................261
OR...........................................................................................................................................................................................................261
Boolean query.............................................................................................................................................................................................268
ATLAS.ti 7.1 USER MANUAL
INDEX
468
Clear term stack..........................................................................................................................................................................................288
Context menus...........................................................................................................................................................................................288
Examples.....................................................................................................................................................................................................268
Operands....................................................................................................................................................................................................260
Operators...................................................................................................................................................................................................260
Print results.................................................................................................................................................................................................271
Proximity..........................................................................................................................................................................................................
Distance Operators..................................................................................................................................................................................266
Embedding Operators..............................................................................................................................................................................264
Overlap Operators...................................................................................................................................................................................264
Push............................................................................................................................................................................................................288
Query.........................................................................................................................................................................................................258
Recalc.........................................................................................................................................................................................................288
Recall & Precision........................................................................................................................................................................................261
Redo...........................................................................................................................................................................................................288
Scope..........................................................................................................................................................................................................278
Screen.........................................................................................................................................................................................................259
Semantic operators...........................................................................................................................................................................................
SIBlings....................................................................................................................................................................................................263
SUB.........................................................................................................................................................................................................262
UP...........................................................................................................................................................................................................262
Super Codes......................................................................................................................................................................................................
Creation...................................................................................................................................................................................................275
Cycle protection......................................................................................................................................................................................277
Merging...................................................................................................................................................................................................277
Suppresssor codes....................................................................................................................................................................................276
Quotations...........................................................................................................................................................................................................
Delete.........................................................................................................................................................................................................186
Graphical..........................................................................................................................................................................................................
Selecting..................................................................................................................................................................................................172
Merge during modify..................................................................................................................................................................................171
Modify........................................................................................................................................................................................................222
Retrieval......................................................................................................................................................................................................208
Redundant Codings.......................................................................................................................................................................................374
Relations........................................................................................................................................................................................................310
vs. links......................................................................................................................................................................................................311
Remove filter..................................................................................................................................................................................................384
Reverse filter..................................................................................................................................................................................................383
Roles 311
Serendipity.......................................................................................................................................................................................................10
Service Packs..................................................................................................................................................................................................461
Sorting...........................................................................................................................................................................................................378
SPSS 405
Code families..............................................................................................................................................................................................411
Missing values.............................................................................................................................................................................................411
Naming convention....................................................................................................................................................................................409
Primary document families..........................................................................................................................................................................411
Syntax file...................................................................................................................................................................................................406
Start ATLAS.ti...................................................................................................................................................................................................58
Strong and weak links....................................................................................................................................................................................309
Text search...........................................................................................................................................................................................................
Defining categories.....................................................................................................................................................................................213
Search swarm..............................................................................................................................................................................................213
Search swarm delimiter...............................................................................................................................................................................213
Text Search....................................................................................................................................................................................................211
Category search..........................................................................................................................................................................................212
GREP search................................................................................................................................................................................................215
Standard search..........................................................................................................................................................................................212
Text segments......................................................................................................................................................................................................
Semi-automatic selection............................................................................................................................................................................167
Theory import................................................................................................................................................................................................154
Theory Transfer....................................................................................................................................................................................................
scaled..........................................................................................................................................................................................................350
Thesaurus.......................................................................................................................................................................................................307
Topological Layout.........................................................................................................................................................................................337
Transitive relations.........................................................................................................................................................................................262
User management..........................................................................................................................................................................................147
Add new user..............................................................................................................................................................................................149
ATLAS.ti 7.1 USER MANUAL
INDEX
469
Remove user...............................................................................................................................................................................................150
Save user database.....................................................................................................................................................................................150
User database.............................................................................................................................................................................................153
Venn diagrams...............................................................................................................................................................................................261
Vertices..........................................................................................................................................................................................................308
VISE Principle.....................................................................................................................................................................................................9
Visualization.......................................................................................................................................................................................................9
Wallpaper........................................................................................................................................................................................................34
Within operator..............................................................................................................................................................................................264
XML
Export & Import..........................................................................................................................................................................................395
Export HU...................................................................................................................................................................................................415
Export Memos............................................................................................................................................................................................414
Folder.................................................................................................................................................................................................404, 433
Import Memos............................................................................................................................................................................................415
MSXML parser............................................................................................................................................................................................398
Transfer Codes............................................................................................................................................................................................202
Stylesheets.................................................................................................................................................................................................404
ATLAS.ti 7.1 USER MANUAL