1
152
IMAGE Processing with LabVIEW and IMAQ Vision
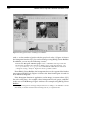
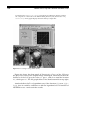
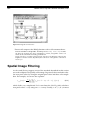
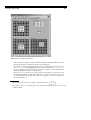
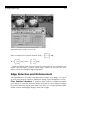
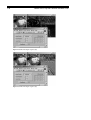
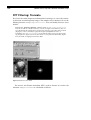
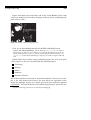
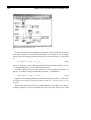
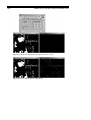
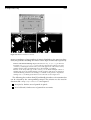
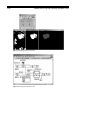
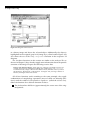
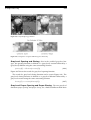
Figure 4.1. Histogram Function in IMAQ Vision Builder
with nk as the number of pixels with the gray-level value k. Figure 4.1 shows
the histogram function H(k) for our bear image using IMAQ Vision Builder.
In addition, you can try the following exercise.
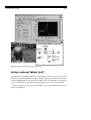
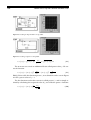
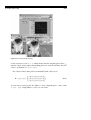
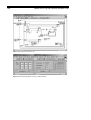
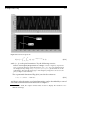
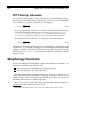
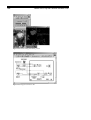
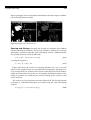
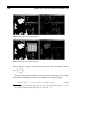
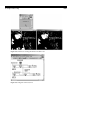
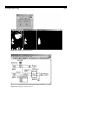
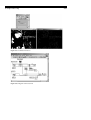
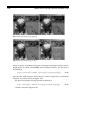
Exercise 4.1: Histogram and Histograph. Create a LabVIEW VI that provides the
functionality described above directly in IMAQ Vision, using the functions IMAQ
Histogram and IMAQ Histograph. You can find them under Motion and Vision
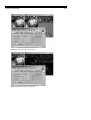
/ Image Processing / Analysis.1 Figure 4.2 shows a possible solution.
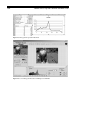
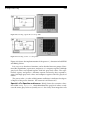
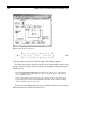
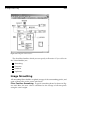
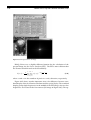
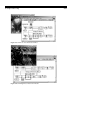
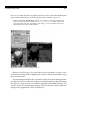
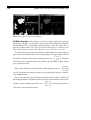
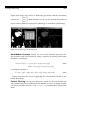
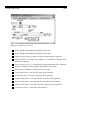
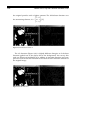
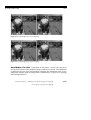
From IMAQ Vision Builder, the histogram data can be exported for further
processing into MS Excel; Figure 4.3 shows the data from Figure 4.1 and 4.2
in an MS Excel diagram.
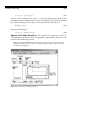
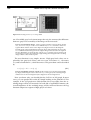
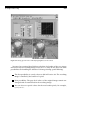
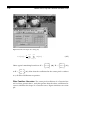
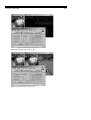
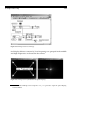
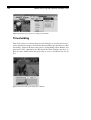
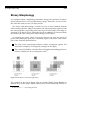
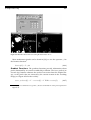
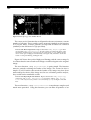
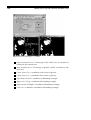
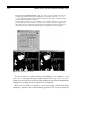
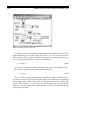
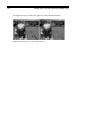
If the histogram function is applied to a color image, it returns values H(k)
for each color plane; for example, three histograms for red, green, and blue
in the case of an RGB image. Figure 4.4 shows an example using IMAQ Vision
Builder.
1
Actually, the histogram is an image analysis function according to our definition. On the
other hand, we need its results for the following sections, so I explain it here.