1
4. Image Processing
153
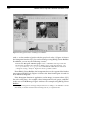
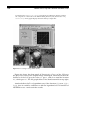
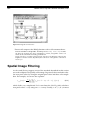
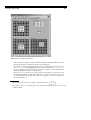
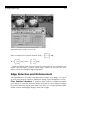
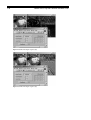
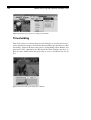
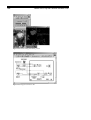
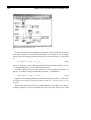
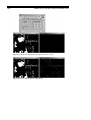
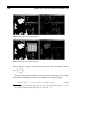
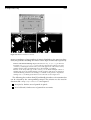
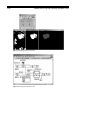
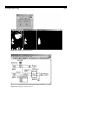
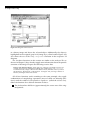
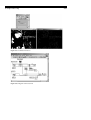
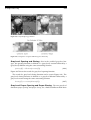
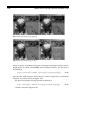
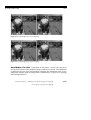
Figure 4.2. Histogram and Histograph of an Image
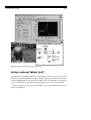
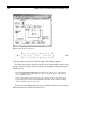
Using Look-up Tables (LuT)
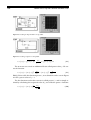
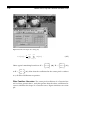
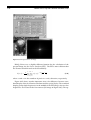
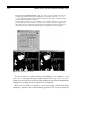
You know how to adjust brightness and contrast values of your TV set or TV
video PC card; the intention is to get a “better” image, what obviously means
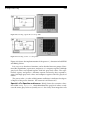
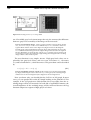
a better distribution of the gray-level values. This is achieved by a function
f (g) (g are the gray-level values), which assigns a new value to each pixel.
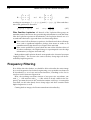
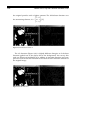
If we consider Eq. (1.1), then our function f (g) will modify the gray-level
values according to