1
User Manual
RotasPro bearing test
system
Discom GmbH, Göttingen
Translated October 2001 by Mark Roberts
Contents
Introduction
2
The Rotas-System................................................................................................................2
The program’s modular structure ..........................................................................3
Fundamentals of operation ....................................................................................3
Rotation synchronous order analysis .....................................................................4
RotasPro and bearing tests (RotasPro LP) ...........................................................................4
Information for the user: the views of RotasPro
5
The Scope-Views.................................................................................................................5
The order spectra ...................................................................................................5
The unfiltered time domain signal.........................................................................6
The filtered time domain signal.............................................................................6
Waviness ...............................................................................................................7
The cross correlation .............................................................................................8
Operating a scope ..................................................................................................8
The result-views...................................................................................................................9
The traffic light......................................................................................................9
The measurement value window .........................................................................10
The report window ..............................................................................................10
The LMH display ................................................................................................11
The online statistic views...................................................................................................11
The production count...........................................................................................12
The production statistic .......................................................................................12
The production history (chocolate bar view).......................................................13
The error messages ............................................................................................................14
MTC bit off .........................................................................................................14
Not in setup mode................................................................................................14
Unknown type .....................................................................................................14
No slip correction ................................................................................................15
Type selection and slip correction
16
Selecting a type of bearing.................................................................................................16
Computing the slip correction............................................................................................17
Automatic slip computation and correction.........................................................17
Checking the slip correction ................................................................................18
Troubleshooting — Slip correction for experts .................................................................19
Manual slip correction.........................................................................................19
Quality of the hit mark ........................................................................................20
The computation parameters ...............................................................................21
Working with the program menu
23
The menu ...........................................................................................................................23
User groups and passwords................................................................................................23
User groups..........................................................................................................23
Changing a password...........................................................................................24
The window layout ............................................................................................................24
Introduction
The Rotas-System
The Rotas acoustic measurement system is made up of a number of components
that represent not only the program itself but also the peripherals of
measurement, value computation and storage.
The central component, with which this manual is mainly concerned, is the
measurement and analysis program RotasPro.
RotasPro can be parameterised using a test procedure data base which stores
mechanical and acoustical details of the parts to be measured. Other data bases
contain tables for archiving measurement results for every tested part, and the
production counts local to every measurement stand. A overall measurement
value archive stores every detail of every measurement at every stand. A
presentation component is supplied for viewing and interpreting this archive that
can be configured freely.
The system is organised in the following way:
Test bench
control
("PLC")
ROTASDATA
bearings data
base
ROTAS
measurement
application
Test bench
Production
statistics
Measurement
data archive &
presentation
The components of the Rotas-System
The measurement program is run on a computer equipped with signal processor
cards. It consists of several modules that can be executed in parallel on these
processors. AD converters and angular momentum decoders are located on the
cards and are used to input the noise and rotational speed from the measurement
stand. Every card can record up to two rotational speeds and four acoustic
channels.
RotasPro Bearing Test System
Introduction • 2
The signal processors host the computations (e.g. order analysis), while the
application on the PC displays and evaluates the results. The program thereby
associates the measurements with the measured part's type and other information
(serial number etc.), which are supplied by the measurement stand, as well as
with the rules and limit values stored for that type in the test procedure data base.
Results are output in human readable form and forwarded to the measurement
stand control in coded form.
The program’s modular structure
The ROTAS-application is made up of a large number of modules. Every
module represents a particular processing step or a typical task. It begins with
modules for AD conversion, filters and order analysis for every channel and
continues over modules for spectral analysis, time domain signal analysis and
short period spectra, to evaluation modules, viewing modules and
communication modules. Other modules permit storing measured data,
controlling unusual periphery or exporting data to formats like Excel.
Usually a module will contain auxiliary modules (sub-modules), for instance for
transferring data or converting formats. All modules in a RotasPro or ComPass
application are organised in a tree. Every module with the exception of the
topmost module has a parent module, and every module has any number
(including zero) of child- or sub-modules. The tree is referred to as the system
configuration.
The module tree is displayed in the tree view (or system configuration window).
Every module, or, to be precise, every instance of every module, is represented
by an icon and an instance name. Often but not always the icon gives an
indication of the module type. A “Wire”-module for instance is usually
represented by an icon of a socket or a plug. If a module has child modules, a
small plus sign is situated to the left of the module’s icon. When you click the
plus sign, the child modules become visible and the plus becomes a minus. Click
the minus sign to hide the child modules.
In order to bring order to the system configuration, container modules are
included who’s sole purpose is to be parent to a group of modules that perform a
particular task together.
Should you wish to open the system configuration window after it has been
closed, you can do so by clicking “New” in the pulldown menu “File” or by
clicking the associated button in the button bar.
Fundamentals of operation
Since the complete functionality in a RotasPro application is situated in the
modules, the user can also operate the program via the modules. For reasons of
simplicity though, the most important features can also be reached from the
menu and toolbars.
Double click on the name or the icon of a module in the system tree in order to
open its dialog. If a module represents a window (e.g. curve view or report
window), double clicking will instead open that window, unless it is already
open. If such a module also houses a dialog, you can open the dialog by double
clicking with the right hand mouse button.
Certain modules (e.g. container modules or “Wire” modules) don’t need a
dialog, as there are no values to set up.
For the most important functions that you need every day, menu items and
toolbar buttons have been supplied. You usually don’t need to search for
modules in the tree at all. On top of that it is possible to set up several sets of
user permissions, so that normal users can only access a subset of menus and
buttons and cannot open the system configuration tree.
RotasPro Bearing Test System
Introduction • 3
Rotation synchronous order analysis
The measurement system ROTAS is designed for the analysis of rotating
systems like cogwheels, bearings or gear boxes. The analysis can be extended to
systems that are driven by rotating systems. Our measurement quality is mainly
built on rotation synchronous order analysis. In simple spectral analysis fixed
sample rates (often 44.1 kHz) and fixed FFT-lengths (e.g. 1024 samples) are
used to compute the spectra. By averaging the results it is possible to extract
frequency components constantly embedded in the measured sound. When
analysing a rotating system this procedure would enhance the rotational
frequency and it’s harmonics. (The sample rate needs to be more than twice the
rotational frequency.)
In rotation synchronous order analysis of a rotating system we instead choose
sample rate and FFT-length in such a way that the FFT blocks consist of exactly
one rotation (or a whole number of rotations). Supposing a part rotates at 50 Hz
and an FFT-length of 512 samples is desired, then 50 · 512 samples need to be
taken per second, which corresponds to a sample frequency of 25,6 kHz. By
averaging these rotationally synchronous blocks, all frequencies are enhanced
that are synchronous to the rotational speed or it’s harmonics, while background
noise is suppressed. If an apparatus has several parts that run at several
frequencies, then the noise signals of the parts can be separated by applying a
rotation synchronous order analysis at each of the frequencies.
RotasPro rescans the signal synchronously using the signal processors. First the
signal is split into a number of parallel channels. In each of these channels the
rescan is performed synchronous to a particular part of the rotating system. The
resulting data streams are referred to as synchronous channels. The noise from
the various parts of the system has been divided into these channels. In addition
the original signal, now called the mix channel, is kept for future computation.
Order synchronous analysis is an exact form of order analysis. The revolution
frequency in a synchronous channel is the first order of that channel. A
frequency twice as large is the second order, five times the revolution frequency
is the fifth order. The order spectrum does not represent absolute frequencies (as
in spectral analysis), it represents frequencies relative to the revolution frequency
of the synchronous channel. Interpreting the results of an order analysis is simple
because it correlates with the rotation of the part to be measured.
RotasPro and bearing tests (RotasPro LP)
During bearing tests the measurement PC communicates with the PLC-control
via a parallel interface. When measurement ends, the same interface carries the
results to the PLC.
The sensor for structure-borne sound is connected to the fixed outer race; The
rotational speed is acquired from a sensor at the spindle. Using rotationally
synchronous order analysis the acoustical signals of the inner race (synchronous
channel 1) and the roller and cage assembly (synchronous channel 2) are
separated. The program requires the geometrical data (diameter, angle, etc.) for
these computations. They are imported from the Access data base
LagerDaten.mdb.
For later statistical reference the measurement reports are stored in one data base
per batch. Grouped by types evaluation statistics and defect statistics are created
on a per month basis. All these can be extracted and viewed with external
applications (Office macros).
RotasPro Bearing Test System
Introduction • 4
Information for the user: the
views of RotasPro
The Scope-Views
RotasPro uses a particular type of window called "Scope", short for
"oscilloscope". In principle it simulates an oscilloscope, yet it offers far more
possibilities. It can be used to display curves and functions of any type, including
static and varying data.
The noise signal from the current bearing can be displayed in five scopes
simultaneously. For ergonomic reasons more than two scopes side by side are
not recommended. You can open and close the scope windows using the
following buttons on the button bar:
Waviness
Filtered time domain signals
Unfiltered time domain signals
Order spectra
Cross correlation
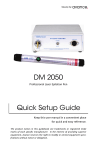
The order spectra
This scope displays the rotationally synchronous order spectrum for the inner
race (IR, green), the roller and cage assembly (TR, light blue) and the mix
channel (Mix, yellow) of the signal as processed by a high pass filter, in the
scaling common to all Rotas applications.
Simultaneously the corresponding limit curves for the inner race (IR-lim) and
roller and cage assembly (TR-lim) are displayed in red. The mix channel is not
rated. Therefore no limit curve is necessary.
Waviness on the inner race or on the rollers shows up as peaks in the
corresponding order spectrum. In the case of the rollers, the value can be read
directly from the x-axis. This is not true for the inner race. The waviness and the
orders displayed are not linearly correlated. Thus another scope (Waviness) has
been implemented, in which the order spectrum has been scaled in such a fashion
that the waviness can be read off directly.
RotasPro Bearing Test System
Information for the user: the views of RotasPro • 5
Order spectrum of a bearing with 17 shafts on the inner race
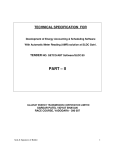
The unfiltered time domain signal
This scope shows the unfiltered time domain signal (Mix). The spindle’s base
frequency is easily made out.
Unfiltered time domain signal of a bearing with 17 shafts on the inner race
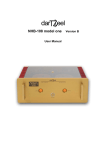
The filtered time domain signal
This scope shows the high-pass-filtered time domain signal for the inner race
(IR, green) and the roller and cage assembly (TR, light blue). Roller and cage
assembly with hit marks on the inner race or on one roller are visible as standing,
tightly localised, high peaks of the corresponding time domain signal. Should the
hit marks move through the scope instead of standing still, then either the
geometrical parameters or the slip correction are faulty. In such an event you
should check the selected type of bearing and/or recompute the slip correction.
Extreme hit marks can cross talk to the other channel. They are visible there as
fast moving peaks.
RotasPro Bearing Test System
Information for the user: the views of RotasPro • 6
Filtered time domain signal of a bearing with 17 shafts on the inner race
Waviness
The waviness of the bearing can be read directly from the x-axis only from the
scope order spectrum for the roller and cage assembly. In the case of the inner
race the correlation of the inner race order and the corresponding waviness is
non-linear and depends on the bearings geometry. Therefore the scope Waviness
shows the order spectrum for the inner race (IR, green) and the roller and cage
assembly (TR, light blue) as well as their limit curves (IR-lim and TR-lim
respectively, red) in such a way that the waviness for inner race and assembly
can be read directly from the x-axis.
The spectra are not displayed continuously, they are displayed when
measurement ends. These in particular are the spectra that are used for the rating.
The display is not modified until the next measurement is completed.
The display for the inner race shows gaps in the spectrum and the limit curve at
which the values are zero. The gaps are symmetrically grouped around even
multiples of half the number of rollers Z. While it is possible that waviness of
the inner race occurs in these intervals, no corresponding sound reaches the
sensor in such a case.
The highest relative noise ratio is reached with waviness W=Z±1, slightly less
dominant for W=Z±2, and so on. Here Z is the number of rollers in the bearing.
Waviness of a bearing with 17 shafts on the inner race
RotasPro Bearing Test System
Information for the user: the views of RotasPro • 7
The cross correlation
This scope opens and closes automatically when slip correction is being
computed, since that is the only context in which it shows curves at all. It then
displays the cross correlation of the high-pass filtered signal of inner race or
roller and cage assembly with the associated delayed signal. See the section on
slip correction for more information.
Operating a scope
A scope can display more than one curve in more than one colour and you can fit
the scaling to your needs. The curves can be edited using graphical or keyboard
input. It is possible to insert display markings and thereby monitor certain values
directly. Last but not least the curve display can be exported as a graphic so as to
be accessible from other Windows applications, or sent to a printer.
The features most frequently used and therefore covered in this manual are
scaling and printing.
Scaling
The view region is overlaid with a grey reticule, the lines are labelled from the
left and from below. The values at the lower edge represent the x-value of the
corresponding line, the values at the left edge represent the corresponding line’s
y-value. The units of measurement (e.g. seconds, volts) are displayed in two
boxes at the lower right hand corner. The lower box belongs to the x-axis, the
higher box belongs to the y-axis. For example an entry “40 mV” in the box for
the y-axis indicates that the difference between values on two adjacent horizontal
lines is 40 millivolts.
Each of the boxes for the units of measurement contains two buttons for
adjusting the scaling:
zooms in, while
zooms out.
When viewing a magnified portion of the signal, the position bars at the edge of
the display let you choose the part of the signal you wish to examine. When
viewing several curves, the labels on the axes and the scaling hold for all
displayed curves simultaneously. The position bars move all of the displayed
curves.
By pushing the A-Button
at the top left of the display, you can trigger
automatic scaling: the scaling factors are automatically chosen in such a way that
the complete curve fits the window exactly.
Pushing
saves the current scaling and position, pushing
reverts to the last
thus saved setting. If you close and later reopen a scope window, the last saved
scaling will be used, not necessarily the setting active when the window was
closed.
Many curves can be normalised in two ways (e.g. “orders with regard to this
channel” or “orders with regard to the spindles base frequency”). You can switch
between the two in the section “scaling” of the curve selection dialog box.
The curve list
The curves displayed in a scope are listed above the unit boxes, in the right hand
portion of the window, in the colours corresponding to the curve colours. When
curves are displayed on top of one another in different plains, their names in the
list are separated by a horizontal line.
RotasPro Bearing Test System
Information for the user: the views of RotasPro • 8
The print popup menu
You can open up the print menu by right clicking anywhere inside the scope
window except on the dark blue fields and the unit boxes. The popup menu
supplies the following functionality:
print automatically: Toggle yes/no whether this scope should be printed
automatically.
print now: This scope is printed immediately; no other dialog pops up.
absolute x-axis: same meaning as in the curve selection dialog.
autoscale: same meaning as the autoscale-button in the scope window.
You can also print the scope from the print menu item in the file pulldown menu.
The standard printer select dialog will appear, in which you can select the printer
and the paper formats. These settings remain active and will be used when you
next select print now or when the next automatic printing takes place.
Print comment
A scope window’s printout contains text comments: date, time and the names of
the window and the curves are inserted automatically. For some windows the
remaining comments will also be filled in automatically, for others the user can
enter three text comments herself which will then appear on the printout. The
texts are entered into text fields in the print comment dialog.
The dialog only appears if the text comments haven’t been generated
automatically.
Freeze display
Another button at the lower right of the scope window is the photo camera:
Click this button to halt the display. You now have time to consider the data
displayed and maybe print the contents of the window. By clicking the camera
once more, updating of the curves resumes.
The result-views
The measurement results from the currently measured bearing are displayed on
the screen in four separate views: the traffic light, the measurement value
window, the report window and the LMH display. These result views, like the
scope views, can be opened and closed using the buttons on the button bar.
LMH display
Report window
Traffic light
Measurement value window
The traffic light
The traffic light displays the overall result of the measurement. Green stands for
“bearing is ok”, yellow for “bearing is not ok” while a red light symbolises a
system error. A system error can be the absence of the rotational speed signal or
an unusually low noise level, which both could indicate a missing sensor or a
defunct cable.
RotasPro Bearing Test System
Information for the user: the views of RotasPro • 9
“ok”
“not ok”
“system error”
The measurement value window
This window displays all non-spectral measurement values (e.g. Crest, RMS)
that enter the rating. It includes the name of the value (including the synchronous
channel from which the measurement was taken, i.e. IR, TR or Mix), the value
itself (is), the limit (limit) and, where available, the unit of measurement.
The first column contains
icons symbolising the result
for a single value. The green
icon appears when the
measured value lies below
the limit, the red icon
indicates the limit was
exceeded. The rpm check
plays a role by itself, as the
rotational speed is compared
against an upper limit and a
lower limit. Only when one
of these limits is crossed
does it appear in the list.
The window displays new values whenever a measurement ends. If you open the
window at some other time in the measurement cycle, it will contain no values.
The limits displayed pertain to the last rating made.
The report window
The report window shows a summary of the measurement. The headline shows
part data like type, job number, date of measurement and overall result. There
follows a list of all defects located. The text should be self explanatory.
RotasPro Bearing Test System
Information for the user: the views of RotasPro • 10
Then comes a list of measured values. Which values are to be listed is taken
from the bearing data base. Typically all values from the measurement value
window and all bands, including the low, medium and high bands, will be
displayed.
You can print the report by right clicking anywhere in the window and selecting
print now from the popup dialog.
The LMH display
The LMH display was designed to allow bar diagrams to be made of the low,
medium and high bands. The L, M and H values are a part of the meaurement
report and are also available from the report window. But the LMH display is not
limited to displaying the L, M and H bands. On the contrary, it can display any
subset of the values in the measurement protocol, though the more values are
displayed, the less room is left for every single bar of the diagram. In addition to
the bars, the corresponding numerical measurement values are included in the
display.
You can assign an individual colour and scaling to every bar, and the chart can
be set to vertical or horizontal.
The subset of the measurement values to be displayed, as well as the bar colours
and scalings, will be set up by your system administrator or in cooperation with
Discom. The normal user can only call up or close the window as a whole, and
change its position and size.
The online statistic views
All measured values and all rated defects in the report are sorted by job number
and written to a statistic data base after every measurement. Thereby a detailed
offline evaluation becomes possible.
In addition RotasPro supplies three online statistical displays that allow the user
to register the current state of the production at a glimpse. Like the scope and
result views, the online statistical displays can be opened and closed using
buttons on the button bar.
RotasPro Bearing Test System
Information for the user: the views of RotasPro • 11
Production count
Production statistic
Production history (chocolate bar view)
The production count
The production data base contains one
production counter each for the current period,
every month, and every year. The bearings ok
and the bearings not ok are counted and the
defects are classified by ten categories. All
values are stored associated with the type of
bearing.
The current period is delimited by clicking the
“Reset” button. Starting from one such click
counting continues until the “Reset” button is
clicked again. Typically you might choose the
current shift or the current job number as the
current period.
It is possible to configure the counters in such a
way that they are automatically restarted at predefined times, for instance at the start of a new
shift.
The counters for the current period are updated
on the fly. To view the counters for another
period, select that period from the list and click
“Print”. The values will be entered into the
report window, from where they can be printed
to paper.
The production statistic
This view shows the distribution of defects over ten defect classes for the current
period. Should more than one defect be detected in one bearing, only the defect
of highest priority will enter the statistic in order not to distort the result.
RotasPro Bearing Test System
Information for the user: the views of RotasPro • 12
Note that the percentages of the defect classes apply to the sum of all defects.
The sum of all defect percentages is therefore 100%.
The production history (chocolate bar view)
The chocolate bar view gives the user a prompt overview of the state of the
current production. The results of the latest measurements are displayed in the
following way: the result of the current measurement is shown in the first
column as green and red circles. A column of only green circles symbolises a
measurement that was ok in all categories; a defect in one category is indicated
by a single red circle on the corresponding line.
The columns of rectangular symbols (the chocolate pieces) represent past
measurements. Whenever a measurement locates a defect, all chocolates move
one position to the right, the rightmost column is consumed. The new
measurement is inserted at the left.
Since as a rule there should be far more bearings measured ok than measured not
ok, not every success is entered as an all green column to this view. Instead only
every twentieth or one hundredth positive measurement is inserted into the
chocolate bar view. Every all green column is a placeholder for a large number
of good bearings. The exact number can be set by your system administrator.
Implications for the user:
RotasPro Bearing Test System
Information for the user: the views of RotasPro • 13
•
If all chocolates are green or if only occasional reds are sprinkled
over the view, the production process is inside normal parameters.
•
If all or almost all chocolates on one line are red, there is a serious
flaw in the production that needs to be eliminated.
For some defect classes (waviness and hit marks) the red chocolates will contain
numerical values that more closely describe the defect.
In addition to the chocolates this view displays the current production count in
the headline. The values are taken directly from the production data base and are
therefore identical with the values displayed there.
The error messages
MTC bit off
RotasPro communicates with the measurement stand’s PLC via a parallel
interface with eight outgoing bits and eight incoming bits. The connection is
monitored using a control bit that is required to be high during measurement. If
the bit is found to be low, the following message pops op on the screen:
In such an event you will need to check the connection with the PLC and the
PLC’s state.
This message cannot be removed manually. It disappears as soon as the control
bit goes high. While the message is on screen no measurements will be
performed, not even if the start bit is set by the PLC.
Not in setup mode
To avoid accidental switching of type, it is prohibited to change the type in any
PLC mode but the setup mode. When the PLC is in the correct mode, a control
bit is set. If you attempt to alter the type while the PLC is not in setup mode you
will receive the following message on the screen:
If appropriate, switch to setup mode and reselect the new type.
This message can also not be removed manually. For reasons of security it
remains on screen until the corresponding control bit is set by the PLC.
Unknown type
Before RotasPro can analyse a particular type, that type needs to have been
entered into the bearings data base. If you select a type unknown to RotasPro or
if there are problems loading the data base, the following message pops up on
your screen:
In such an event you need to check your spelling and ensure that the selected
type is indeed set up in the data base.
This message disappears when a known type is selected. Until then no
measurements will be undertaken.
RotasPro Bearing Test System
Information for the user: the views of RotasPro • 14
No slip correction
If no correction parameters for slip have been computed for the selected type, the
following message pops up on the screen:
If appropriate insert a bearing with hit marks on the inner race and start up the
computation of the slip correction for the inner race.
If the slip correction for the rollers has also not been computed, the same
message will reappear, this time pertaining to the channel SK2. Insert a bearing
with hit marks on one roller and start up the computation of the slip correction
for the rollers.
This message also can not be removed manually. It can only be removed by
completing the computation of the slip corrections.
RotasPro Bearing Test System
Information for the user: the views of RotasPro • 15
Type selection and slip
correction
Selecting a type of bearing
Before a type can be analysed with RotasPro, it needs to be setup in the bearings
data base. The bearing parameters including the limit values are organised solely
within the data base. (The parameters for slip correction form the only exception.
See the next section.)
Before you can select a type that has been set up in the data base, the
measurement stand’s PLC needs to be switched to setup mode. You can then
open the type selection dialog by clicking the first button on the button bar:
Type selection dialog
In the dialog box either select the type from the list under Type or enter it
explicitly with the keyboard. Then enter the job number under Statistics ID. If
no job number is available, enter an arbitrary identifier. It will be used to save
the measurement values in the data base.
Click OK.
RotasPro Bearing Test System
Type selection and slip correction • 16
You can verify that the type has been selected correctly by checking that the type
and job number are displayed in the status bar. If they are, you can safely begin
with your measurements or, as may be, compute the slip correction.
When RotasPro is terminated, it stores the last type and job number entered. It
reloads them at the next startup.
The two most frequent problems when selecting a new type are:
•
The PLC is not in setup mode.
•
The type entered was not set up in the data base.
See also the appropriate sections of this manual on related error messages.
Computing the slip correction
Although the values for geometry and angles of a bearing type stored in the
bearings data base are stated exactly, this is not sufficient for creating
rotationally synchronous sampling. Theoretical values for rotational speed of the
inner race, as measured against the rollers and cage, differ from the measured
values due to deviations from the geometry data and due to slip. Since geometric
deviation and slip in this respect have the same effect, we will refer to the
problem as slip, although we have both causes of the variation in mind.
The discrepancy is adjusted for by computing a slip correction of two sample
bearings.
The two sample bearings need to be prepared in such a way that they show
heavy hit marks. One should feature a hit mark on the inner race, the other on
one roller.
Automatic slip computation and correction
Before the parameters for slip correction can be computed, the correct type of
bearing needs to be selected within RotasPro. Then insert the two specially
prepared bearings after one another and let the appropriate slip be computed.
Slip correction inner race (SK1)
Slip correction rollers (SK2)
Cross correlation
RotasPro Bearing Test System
Type selection and slip correction • 17
Clicking on the first of the slip correction
buttons opens the dialog shown to the right
and the scope cross correlation.
Click Begin calculation as soon as the
bearing with the hit mark on the inner race
has started rotating. Slip will be computed
automatically in several iterations. The slip
remaining is displayed after every step and
added to the overall slip.
After the last cycle this dialog and the scope
cross correlation will disappear
automatically. The newly computed slip
correction parameters are instantly stored to
disk.
Proceed in the same manner to compute the
slip of the rollers.
Checking the slip correction
The hit marks should show up in the time domain signal of the appropriate
synchronous channel as peaks. The figure below shows the typical effect of a hit
mark on one of the rollers. The peaks should stay stationary within the scope for
at least one second, that is they should not move away to the left or right, or they
should move very slowly. If their motion is fast, slip correction should be
recomputed.
During the slip computation you should already check the results for plausibility.
The full slip value typically lies below 0.2% for the inner race and below 2% for
the rollers. The cross correlation is a useful tool for an exact check. Its scope is
displayed while slip is being computed. When computation begins, cross
correlation should have a distinct peak near zero. In the course of the iterations
the peak should wander closer to zero, unless it was already there. The figure
below shows a typical shot of the cross correlation window for the rollers, after
slip correction has been computed successfully.
RotasPro Bearing Test System
Type selection and slip correction • 18
Troubleshooting — Slip correction for experts
Should the automatic slip computation lead to no results or unsatisfactory
results, you should peruse the following three points in the stated order:
1.
Check that the geometry data in the data base is correct.
2.
Check the rotational speed and the quality of the hit mark.
3.
Adjust the computation parameters.
Item one is self explanatory. We will discuss items two and three in detail
shortly. First we shall explain manual slip correction: Even when all else fails,
measurements can take place if you specify the slip values by hand.
Manual slip correction
When the slip correction dialog is first opened, by pushing the corresponding
button on the button bar, all entry fields and buttons but Begin calculation and
Close are inactive. In order to work manually you need to activate all fields and
buttons. The simplest way to achieve this is to deliberately create an error
condition during automatic slip computation. In such an event the algorithm
switches to manual control.
Click Begin calculation without first inserting
a bearing. After a few seconds the error message
“Error: DSP not responding. Please check that
the bearing is rotating and that the speed signal
is ok” pops up. Dismiss the message by clicking
Ok and the dialog will take on the appearance
shown on the right. You can now insert a
bearing with a hit mark and enter a slip value in
the field Overall slip. By clicking Activate slip
you can check the effect, by clicking Write to
disk you can save the value to disk. Of course
you can click Begin calculation in order to
restart automatic slip computation if you like.
You should always start from an overall slip of zero. There should be a distinct
peak in the cross correlation function, see also the figure in section Checking
slip correction. The maximum need not lie at position zero yet, but it should be
RotasPro Bearing Test System
Type selection and slip correction • 19
close. Adjust the overall slip value iteratively while taking the following criteria
into account:
Maximum in cross correlation lies to the right of zero
= Hit mark moves leftward in time domain signal
= Overall slip value is too low
And vice versa:
Maximum in cross correlation lies to the left of zero
= Hit mark moves rightward in time domain signal
= Overall slip value is too high
Note that negative slip values are possible. Do not correct the slip value for the
inner race by more than 0.03% (up or down) per iteration, for the rollers by no
more than 0.3%. (These percentages should only be viewed as rules of thumb,
intended to give you an idea of the orders of magnitude involved.)
Quality of the hit mark
Enter manual slip correction as explained in the previous section. Enter zero as
the value for overall slip and watch the time domain signal and the cross
correlation. The hit mark should be readily visible in the time domain signal, and
the cross correlation should sport one or more distinct peaks. The y-value of the
peak must not be too low. Unfortunately it depends linearly on the calibration
factor, so no universally valid rule can be given as to what might be considered
"too low".
Find a typical example for a hit mark on the inner race below. You may compare
it with the example for the marked roller above.
Example of a hit mark on the inner race as visible in the time domain signal
RotasPro Bearing Test System
Type selection and slip correction • 20
Example of a hit mark on the inner race as visible in cross correlation
Should you see a distinct maximum in the scope cross correlation, while RotasPro, engaged in automatic slip computation, nevertheless complains that no such
maximum can be found, it is most likely that the threshold for accepting the
maximum is too large. Find out how to set this and other parameters of slip
computation in the following section.
The computation parameters
Automatic slip computation takes place in two steps:
1.
a rough estimate from the analysis of the cross correlation.
2.
a fine correction by evaluating the dynamic time warpings (DTW).
Both steps consist of several cycles; in
the course of every cycle the
remaining slip is calculated and added
to the overall slip. One parameter is
therefore the number of iterations in
both steps. More than five correlation
cycles are prohibited, while more
than three usually bring no further
improvement.
The number of DTW-cycles is
theoretically unbounded, values
between five and fifteen seem
appropriate. Make sure the process as
a whole doesn’t take too long, as the
bearings can only rotate a limited
amount of time.
There are more parameters for the correlation cycles:
The measurement time per cycle: The longer the better, but three seconds are
absolutely sufficient.
Use max and its surrounding > % of max level: it is sensible to use not only
the position of the maximum but also the area around the maximum for
computation. Distinct peaks should fall off to one fifth in their vicinity, so 20%
is a good standard value. Yet it is legitimate to go as far as 50% if the situation
makes this necessary. Base your decision on the cross correlation.
The Catch width indicates, how far from the origin the search for the maximum
is taken. It is important that the closest distinct peak is taken, this is not
RotasPro Bearing Test System
Type selection and slip correction • 21
necessarily the global maximum. The catch width is given as percentage of one
revolution, since the x-axis of the correlation represents rotations. The value
should be of the order of three to five percent.
TEST: Maximal-Corr. [ums] >: This is a lower bound for the value of the
maximum.
If the lower bound is not superseded within the catch width, or if the curve
doesn't drop below the stated percentage of the maximum within the catch width,
slip computation is aborted with a message indicating that no distinct peak was
found. You may then want to enlarge the catch width or the “use surrounding”value.
RotasPro Bearing Test System
Type selection and slip correction • 22
Working with the program menu
The menu
RotasPro uses menus sparingly. All functionality of daily usage is accessible via
the button bars: the Windows symbol bar (save, print, help), the Rotas standard
bar (available in two sizes) and the window layout button bar.
The button bars are called up and dismissed using the pulldown menu Toolbars,
the status bar can be blended in and out in the same way, user groups and
passwords are also changed using this menu, see the following sections.
The pulldown menu File offers saving program parameters (Save) and includes
the three standard menu items Printer setup, Print and Print preview.
The pulldown menu Window offers three window layouts: Cascade, Tile
horizontal, Tile vertical. Also you can select one of the open windows to be
brought to the front.
Last but not least the pulldown menu “?” offers online help.
User groups and passwords
User groups
The RotasPro-system manages three user groups, namely Maschinen-Führer,
Einrichter and Betreuer. The first has least permissions to make changes to the
program, while the last has full access.
The Maschinen-Führer has permission to switch the type of bearing and to
change the window layout. That means he can set up which views are displayed,
change the window positions and the scaling of the scope-axes. He can also reset
the production counter.
The Einrichter has all permissions of a Maschinen-Führer. On top of those, he
has permission to compute the slip correction.
The Betreuer, this can be a DISCOM employee or a RotasPro-expert in your
company, has full access. In particular he can view the system tree and thus edit
all other type-independent measurement parameters, e.g. measurement period,
internal and external measurement repetitions.
RotasPro Bearing Test System
Working with the program menu • 23
In order to enter a user group other than your
own, select Toolbars/User group. The dialog
displayed to the right will appear, using which
you can select the desired user group from the
list Group. In order to switch to a higher user
group, you need to enter a password. It may be
possible to enter one of the lower user groups
without a password.
Changing a password
Change the password of the current user group
using the dialog connected to Toolbars/change
password. Simply enter the old password and
the new password and click OK.
The window layout
The window layout includes all information concerning the selection of views to
display, the position and size of every window and the scaling of the scope-axes.
All corresponding parameters are stored in a preferences file. It is possible to
create several such files and to switch between them, thus switching between the
layouts stored within them.
Click the menu item Toolbars/User settings to call
up this button bar.
You can switch between the layouts stored on your disk using the selection box.
The result will be displayed
instantaneously.
Click the button in the button bar
User settings to call up the dialog
displayed to the right. Here it is
possible to edit the list of stored
layouts by deleting entries or
importing layouts available as files.
You can also save your current
settings under a new name.
When program execution terminates,
your layout will be stored using the layout name currently active. When
restarted, RotasPro will always restore the appearance it had at shutdown.
RotasPro Bearing Test System
Working with the program menu • 24