1
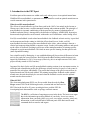
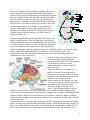
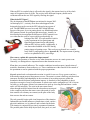
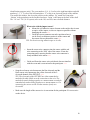
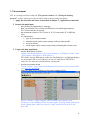
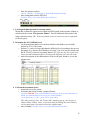
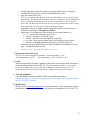
PET SPORT USER MANUAL
1
Contents
1. Introduction to the PET Sport……………………………………………………
What is real-life neurofeedback?
What is EEG?
What is the PET Sport?
Where can the PET Sport be applied?
3
3
3
5
7
2. Application of materials…………………………………………………………
Where to put the PET EEG?
Tips and tricks for using the active electrodes
Conditions for good electrode contact
Where should I place the electrodes?
What to do with the impact sensor?
8
8
8
8
9
10
3. The assessment…………………………………………………………………. 11
4. The real-life neurofeedback training…………………………………………… 14
5. Working with the PET Sport……………………………………………………
The operator window
The assessment report
Tuning the training protocol
17
17
23
23
Appendix A. Example of an Assessment Report……………………………………… 27
Appendix B. Preliminary report of the golf study.……………………………………. 35
Appendix C. Testimonial Stefan Matel……………………………………………….
43
2
1. Introduction to the PET Sport
Excellent sports achievements are within reach, only when you are in an optimal mental state.
With Real-life neurofeedback, a sportsman can train himself to reach an optimal mental state on
crucial moments in his sportscarreer.
What is real-life neurofeedback?
The effects of neurofeedback were first discovered in the 1960’s, but mainly in the last ten to
fifteen years it has become a well documented learning and treatment method. The principle of
neurofeedback is (operant) conditioning of brain processes by means of administration of
feedback on brain activity. Among others, the disorders of epilepsy, ADHD/ADD, depression,
burnout and sleep disorders can be treated -without the use of midication- with a lasting effect.
Real-life neurofeedback is task-related neurofeedback: the feedback on brain activity is provided
on the moments and in the setting in which the effects should occur. In this, real-life
neurofeedback deviates from regular neurofeedback in the clinic, where training is done in a
clinical environment sitting behind a computer screen. On-the-job learning enhances and speeds
up the effect of feedback, resulting in a decrease of the minimum number of training sessions
compared to regular neurofeedback. This leads to more specific learning for that specific task
(state dependent learning).
In a scientific study by Brainquiry, it was established that golf players show differences in brain
activity for good puts versus bad puts. Real-life neurofeedback training on this brain activity
improved performance by 20 %, on average (effectively, this is an improvement of 40% since
players already started on 50% baseline).
In general, the basis for the real-life neurofeedback training sessions is an assessment session, in
which the task-related brain profile (the differences in brain activity for good vs. bad events) is
quantified for each player individually. The profile that belongs to the good events reflects an
optimal mental state for the task at hand. The training incorporates feedback on this optimal
mental state: the task should only be executed when the feedback cues the user the optimal
mental state has been reached.
What is EEG?
The electroencephalogram (EEG) was first recorded from the scalp by Hans
Berger around 1920. In the following decades, scientists had not much use for
EEG. But in the last 40 to 50 years, neurologists have used the EEG for
investigating brain abnormalities such as epilepsy and brain tumors.
The EEG is a reflection of ongoing processes in the brain. The brain is an organ
that is the information processing module of your body. It receives sensory
information from your body (skin, eyes, nose, ears, tongue, muscles, joints, etc);
information is sent back and forth to different parts of the brain and it sends
commands back to muscles and organs.
3
The flow of information is mediated by neurons, which are the
brain cells that are specialized in transporting information by
means of tiny electrical currents that flow through them. Because
there are so many of these cells (the brain contains 100 billion
neurons) the electric field of all these tiny currents add up to
form an electric field that can be measured on the outside of the
scalp. However, even with so many active neurons, the electric
field outside the head is so small that it is very difficult to
measure. Additionally, because of the small electric field
strength, measurement of the EEG is easily distorted by other
common electric fields generated by eye-blinks, muscles,
fluorescent lamps, etc.
The brain has practically infinite possibilities for solving a vast
number of different tasks. First, different tasks are solved by a
different combination of activated brain area’s. The EEG signal
is a reflection of the collective activity of neurons in the patch of
cortex (the folded top layer of the brain which is involved in
cognitive information processing) under the electrode. Therefore, what we can conclude from a
single channel EEG measurement is the activation level of a patch of the cortex. The
measurement of the EEG with many electrodes scattered over the scalp informs about the
combinations of active brain area’s
Second, the brain can recruit the necessary
area’s sequentially by modulating the
activation level of these area’s. The sequence
of activation of brain area’s can be
monitored because we measure the EEG
signal over time.
Third, each brain area can operate in a
number of modes. The measurement of
activation level over time informs about the
strength in which the different modes of the
brain are active in different area’s.
An area cannot only be switched ‘on’ and
‘off’, but can be involved in task-execution
on different levels. The brain always
operates by rythmic oscillation of it’s
activity. This oscillation mostly occurs at
frequencies from 0-40 Hz. These EEG frequencies can be split up in frequency bands, all of
which indicate a functional mode of the brain. The strength of the oscillation in the different EEG
frequency bands is indicative of the processing level of the area. Generally, higher oscillation
frequencies indicate higher level processing, whereas lower frequencies are seen as the ‘stand-by’
modes of the brain.
If a patch of cortex is very active in a certain task, the EEG signal from this patch of cortex will
show a relativily large amount of Beta and Gamma activity, which is high frequency activity (1540 Hz ). In another task, the same patch of cortex might not be involved and is ‘turned off’: the
EEG will be dominated by slow frequencies (Theta and Alpha activity, 4-8 Hz and 8-12 Hz).
4
When an EEG is recorded what is reflected in the signal is the summed activity of the whole
range of frequencies from 0-40 Hz. The activity in the different frequency bands can be
reconstructed from the raw EEG signal by filtering the signal.
What is the PET Sport?
The development of the PET Sport was initiated in August 2005.
At Brainquiry B.V., curiosity arose about what happens in the
brain and what can be seen in the EEG when playing a game of
golf. The PET EEG was used to record EEG during different
aspects of the game. It was in putting that it was found that distinct
EEG patterns existed for good puts and missed puts. Actually, in
this intitial pilot investigation the differences in EEG patterns were
so evident that the result of a put could be predicted only by
looking at the EEG. We replicated the result in
a pilot experiment in four participants and
found that participants had an individually
different EEG success profile. Additionally, it
was shown that feedback of the EEG during
putting improved putting scores. This result was replicated in a scientific
study with 12 participants (refer to Appendix B). The improvement of putting
scores was quantified to 20%, on average.
How can we explain this spectacular improvement?
To answer this question we need to review what determines success in a static sports event.
Generally, we distinguish two important factors that determine success.
First, there are external influences. The weather conditions in outdoor sports, inperfections of
materials, disturbances from audiences, etc. These conditions are either outside of the control of
the sportsman or can be optimized with the proper preparations.
Second, optimal task evaluation and execution is crucial for success. Every sports event has a
different movement protocol that ensures success. The motoric system is build up such that it has
enormous flexibility and adaptability in the execution of movement sequences within the
boundaries that the skeleton configuration imposes. A drawback of the adaptibility is that it
introduces a margin of error for movements. A robotic arm can be configured to a 100 % hit rate
for bulls-eye in the game of darts, but command it to pick up a bowling ball and throw a strike
and it will fail miserably. The error in the movement comes
about through small deviations from the calcuted movement goal
in the complete path from the motor cortex (the patch of cortex
that controls our voluntary movements) to the parts of the body
that executes the end movement.
The task generally begins with visual inspection of the situation.
Information on external influences (obstructions, wind-, surface-,
physical conditions, etc) is gathered and evaluated in the brain.
The situation is compared to previously encountered situations.
The possible paths for the body/object (ball, dart, puck, etc) and
5
difficulties are evaluated and on the basis of past experiences an ideal path is chosen. In case of
sports that use an object (like a putter or darts) the ideal path of the object is translated in an ideal
movement path of the body. In the motor cortex, the ideal path to the goal of the movement is
translated into motor commands. The brain sends these commands to the actuators. These
commands are translated into muscle movements. Information about the configuration of joints
and muscle tension is constantly send to the brain. The brain compares this information (the
actual path) to the desired path of the actuators. An evaluation of the differences between actual
and desired path (the error) is made and adjusted motor commands are sent to the actuators.
From before initiation of movement, this is an ongoing cycle of events until the movement is
completed.
In this process, errors are accumulated in:
• information on external influences;
• the choice of the ideal path to the goal;
• the timing of sending the correct motor commands;
• information on joint configuration and muscle tension;
• the translation of motor commands to muscle tension.
Minimization of the error can be achieved by:
• acquisition of experience in evaluation of the situation;
• repeated training of the task-related motor processes;
• optimization of intrinsic brain processes.
The last optimization factor has been the turf of sports psychologists, who would aim for an
optimal general mental well-being, hoping that this would bring sportsmen in an optimal mental
state for performance. Also, some sports psychologists introduced the use of peak performance
neurofeedback in sports. This implies increasing Alpha activity in clinical sessions.
This has the following shortcomings:
• clinical session, not relevant contextually;
• no information on the actual brain processes associated with the task;
• disregard of individual differences;
• operant conditioning rather then classical conditioning;
• state-dependent-learning for passive condition;
• a large number of sessions is required before generalization occurs.
These drawbacks can be avoided by training the brain with the real-life neurofeedback method. In
real-life neurofeedback, it is measured how the optimal intrinsic brain processes are reflected in
the EEG. This is done by measuring the EEG during a large number of executions of the task that
is to be optimized. Additionally, the timing of the events is recorded with millisecond precision.
Through this synchronous recording, EEG activity can be linked specifically to the task:
event-related EEG. By classifying the events to be either good or bad, a distinction can be made
between EEG activity that is associated with success and EEG activity that reflects failure. The
frequency band amplitudes of all success events are aligned according to the moment of impact in
the event and are then averaged over events. The same is done for failures. From these results, a
success profile is derived. The success profile incorporates the relevant characteristics of the
6
general morphology of the the averaged frequency band amplitudes (general task-related activity)
and the specific differences between successful vs. unsuccessful events.
By measurement and feedback of the EEG in training sessions, one can train the brain to show
the optimal performance. In the training, the success profile that resulted from the analysis of the
assessment session is used to create a feedback protocol. This protocol consist of a number of
participant-specific reward and inhibit settings. These settings imply increasing or decreasing
activity in certain relevant frequency bands. These settings are implemented in the feedback by
prohibiting the execution of the event when not all preconditions (rewards and inhibits) are met.
Only if the brain generates the appropriate activity, the event may be executed. The moment
when the optimal mental state is reached is signalled by ceasing a continous NoGo feedback tone.
By repeatedly training in the feedback condition, the brain learns to recognize the moments of its
optimal state of performance. When encountered with the task in a match, brain activity will
automatically shift to the optimal mental state, because it is conditioned to do so.
Where can the PET Sport be applied?
The PET Sport can be applied in any sport with a static-concentration component where a
distinction between good and bad can be made or efficient or non-efficient behaviour.
The example of golf has been mentioned. In golf the method can not only be applied in putting,
but also in chipping. Furthermore, application of the method in putting and chipping might have
carry-over effects on the long game.
Another example of where the PET Sport is already applied is rifling. Projects that are in progress
include football (penalty shooting), snooker and pool, darts, bowling and hockey. The PET Sport
can also be applied in tennis, where one would need optimal concentration before a serve. Also,
even the return could be considered a static concentration moment.
7
2. Application of materials
Where to put the PET EEG?
o Button the PET EEG on the elastic armband and apply the band on the upper
arm which is most convenient for the application.
o Make sure the PET EEG is applied such that electrodes can be applied without
tension on the wires when moving around.
TIP: Good application of the electrodes is most easily achieved with the plug of the
PET EEG positioned towards the participants head.
Tips and tricks for using the active electrodes
For use on the skin
1. For usage on the mastoids (ground and reference) it is advisable to use the
disposable electrodes.
2. First clean the skin with an alcohol swipe. Snap the disposable electrode
on the active electrode.
3. Peel off the plastic cover and place the electrode on the skin.
4. Make sure the pre-gelled parts make full contact with the skin.
5. The electrode is ready for measurement.
For use in the hairy parts
The re-usable electrodes can be used for the hairy parts or on the skin and is
used with conductive paste.
1. Snap the re-usable electrode on the active electrode.
2. Make sure your conductive paste gets through to the scalp before placing the
re-usable electrode.
3. Place the re-usable electrode by pressing it on the conductive paste.
4. Make sure it makes full contact with the conductive paste.
5. The electrode is ready for measurement.
Conditions for good electrode contact
It is very important that the electrodes are placed correctly.
• The skin should be clean, free of cosmetics, grease, dirt or sweat.
• You can prep the skin with an alcohol swipe and/or NUprep abrasive paste.
• The disposable and/or re-usable electrodes should be correctly snapped on the active
electrodes.
• The removable plug (male sub-D) should be firmly connected on the PET®.
• Make sure excess hair is out of the way of head electrode sites.
• Make sure the wires are not tangled too much.
8
Where should I place the electrodes?
The black electrode serves as the ground electrode. The blue one is + and the yellow ones are -.
Basically you use the + and the - to tap into that part of the brain you want to get EEG from and
you use the black one (the ground) to eliminate noise.
The correct configuration is to attach the black electrode on the left or rigth side of the forehead
(or one of the mastoids), the yellow electrodes on both earlobes and the blue electrode on AFz
(middle of the forehead). Make sure wires are not in front of the face; they can be guided over the
ear. Also, make sure wires do not jerk when moving around.
The 10-20 system
The International 10-20 System of Electrode Placement is the most widely used method to
describe the location of scalp electrodes. The 10-20 system is based on the relationship between
the location of an electrode and the underlying area of cerebral cortex. Each site has a letter (to
identify the lobe) and a number or another letter to identify the hemisphere location. The letters
used are: ‘F’ - Frontal lobe, ‘T’ - Temporal lobe , ‘C’ - Central lobe , ‘P’ - Parietal lobe, ‘O’ Occipital lobe. (Note: There is no central lobe in the cerebral cortex. ‘C’ is just used for
9
identification purposes only.) The even numbers (2, 4, 6, 8) refer to the right hemisphere and odd
numbers (1, 3, 5, 7) refer to the left hemisphere. ‘Z’ refers to an electrode placed on the midline.
The smaller the number, the closer the position to the midline. ‘Fp’ stands for Front polar.
‘Nasion’ is the point between the forehead and nose. ‘Inion’ is the bump at the back of the skull.
The ‘10’ and ‘’20’ (10-20 system) refer to the 10% and 20% inter electrode distance.
What to do with the impact sensor?
• Mount the self-adhesive sensor element on the surface that is most
receptive of the impact, as close to impact as possible without
damaging the sensor.<<<
o Guide the sensor connector towards a position where it
can be fixed, such that no tension is on the sensor and
the sensor does not disturb the event.>>>
TIP. Fix the wires using adhesive tape or tie-ribs.
o Insert the sensor wire connector into the sensor with the red
wire connecting to the ‘POS’ side of the sensor. Fixate the
connecting parts, ensuring that the sensor wire connector is
firmly mounted in the sensor.<<<
o Guide and fixate the sensor wire such that it does not interfere
with the event and is convenient for the participant. >>>
o Snap the red sensor wire button onto the blue electrode and the
black sensor wire button onto the yellow electrode of the 2electrode channel of the PET EEG. >>>
TIP: The electrodes of the PET EEG are either unmarked or
marked with white labels near the connection to the wire. The
marked electrodes belong together as a measurement set and the
unmarked electrodes belong together as a measurement set. For
connecting the sensor use the set that consists of only two
electrodes.
o Make sure the length of the sensor wire is convenient for the participant. Fix excess wire
on the device.
10
3. The assessment
TIP: It is strongly advised to study the ‘The operator window’ and ‘Tuning the training
protocol’ sections and practice the procedures before starting with participants.
1. Apply the electrodes and sensor as described in chapter 2: ‘Application of materials’.
2. Instruct the participant:
o first you have an opportunity to warm-up;
o then, you will play a few series at a difficulty level at which approximately
50 % of all events are successful;
o the assessment consists of 10-12 series of 10-12 events at the 50 % difficulty
level;
o it is important to:
play in your normal routine;
minimize (head- and eye-)movements (in the pre-shot period);
try to be relaxed;
avoid impact sensor contact except when performing the relevant event.
3. Prepare the data acquisition:
o start the BioExplorer software
(double click the BioExplorer icon on your desktop or -in Windows- choose ‘Start
- All Programs - BioExplorer - BioExplorer’);
TIP: Before starting BioExplorer, make sure the BioExplorer and Mitsumi dongles
are inserted into the correct USB ports of your PC and that the PET EEG is
turned on. The status bar should indicate ‘CONNECTED’.
o open the assessment design
(choose ‘Design - Open’ from the BioExplorer menu; browse to the correct folder;
open sport_A_design.bxd);
o change the high cut-off frequency of the sensor signal to 99 Hz
(choose ‘Window - Signal Diagram’; the following screen appears; open
‘Properties’ of the ‘Bandpass Filter 10:sensor signal’ object by double-clicking the
object; change under ‘Band’ the value for ‘High’ from 60.00 Hz to 99.00 Hz;
press OK).
11
o show the operator window
(choose ‘Window - Instruments 1’ from the BioExplorer menu);
o start reading data from the PET EEG
(click the ‘Play’ icon on the BioExplorer task bar).
4. Let the participant perform a warm-up round.
Meanwhile evaluate the impact sensor signal and EEG signals in the operator window as
described in the section ‘The operator window’. Provide additional instructions to the
subject when necessary. TIP: In the assessment session it is not necessary to regard the
feedback signals.
5. Determine the 50 % difficulty level
o Let the participant choose an event from which he/she thinks to successfully
perform at 50 % of all events;
o perform 3-5 series of events and adapt the difficulty level according to the success
percentage (e.g. increase the difficulty level when 7 out of 10 puts are holed) until
the 50 % level is relatively accurately known; TIP: You can vary the events in the
series to avoid habituation effects, as long as the difficulty level stays the same.
o make a description of the characteristics of the event (goal, distance, etc) on the
scoring form.
6. Perform the assessment series:
o prepare the set-up for action;
o record the data saving it under a unique filename
(click the ‘Record’ icon on the BioExplorer task bar; browse to the directory in
which you want the data to be saved; give in the filename:
‘Participantname_A_S01’; press ‘Save’; press OK);
TIP: After pressing ‘Save’ the ‘Session Info’ window pops up: you can give in
‘Subject Name’ and/or ‘Notes’ as an extra check for linking the correct data to
correct participant. You can also leave the window empty.
o start recording (click the ‘Play’ icon on the BioExplorer task bar);
12
o cue the participant he/she can commence playing, making sure to wait appr. 6
seconds after pressing ‘Play’ before performing the first event;
o score the events for success;
TIP: It is essential for the analysis of the assessment that success scoring is done
meticulously. If somehow the outcome of an event is unknown, clearly indicate this
on the scoring form and skip to the next event. If you find out at the end of the
series that you missed an event in the success scoring, indicate this on the scoring
form and include an extra series of events in the assessment.
o meanwhile, observe the impact signals and the EEG on the screen and react to
difficulties according to ‘The operator window’;
o make a note of everything out of the ordinary in the remark column, e.g.:
??? = unsure about outcome of the event;
missed = missed an event in the series;
paused = the series was interrupted for some time;
no event = there was no sensor signal peak when the event occured;
artefact = something unusual was going on in the EEG signal, etc;
o when the participant finished the series stop recording data, making sure to wait
appr. 3 seconds after the last event
(click the ‘Stop’ icon on the BioExplorer task bar).
7. Repeat step 6 for 10-12 series;
TIP: Give in consistent different filenames ‘Participantname_A_S01’,
‘Participantname_A_S02’, …, ‘Participantname_A_S12’ for every series.
8. Finish
When enough artefact-free data is gathered, take off the sensor and the head electrodes or
let the participant do this him/herself. TIP: For the assessment analysis, unsuccessful
events are as important as successful events. Make sure the data contains over 50
successful and 50 unsuccessful events that are artefact-free and scored correctly.
9. Turn off equipment
Close BioExplorer and turn off the PET EEG or run another participant
(choose ‘BioExplorer - Exit’ from the BioExplorer menu and press the ON/OFF button of
the PET EEG for 3 seconds).
10. Mail the data
Mail the data to [email protected] to request an analysis of the assessment. Scan the
scoring form and include it in the mail or fax the form to faxnumber: 0031 84 224 55 79.
13
4. The real-life neurofeedback training
1. Discuss the assessment results with the participant.
2. Apply the electrodes as described in chapter 2 ‘Application of materials’.
TIP: In the training it is not necessary to apply the impact sensor.
3. Instruct the participant with:
o first you have an opportunity to warm-up;
o the first number of series of events are without feedback and essentially identical
to the assessment series; then, a number of feedback series are performed; this is
repeated for a second time (A-B-A-B);
o in the feedback series you will hear a continuous tone; this tone is linked to your
brain activity; if the computer detects your optimal mental state (as determined in
the assessment session), the tone will cease;
o prepare yourself for performing the event in your ordinary routine, wait for the
tone to go off and as soon this occurs initiate the event;
o the tone will be gone for two seconds; when you made the decision to initiate,
carry out the event irrespective of the possible return of the tone;
o when you are waiting for the tone to go off and this does not happen for a long
time, you should step back and prepare again;
o don’t rush; wait for a second or third cue when you are not completely ready to
perform according to your normal routine;
o it is important to:
play in your normal routine as much as possible;
minimize (head- and eye-)movements (in the pre-shot period);
try to be relaxed;
4. Prepare the data acquisition:
o start the BioExplorer software
(double click the BioExplorer icon on your desktop or -in Windows- choose ‘Start
- All Programs - BioExplorer - BioExplorer’);
TIP: Before starting BioExplorer, make sure the BioExplorer and Mitsumi dongles
are inserted into the correct USB ports of your PC and that the PET EEG is
turned on. The status bar should indicate ‘CONNECTED’.
o open the training design
(choose ‘Design - Open’ from the BioExplorer menu; browse to …; open
‘Participantname_T_design.bxd’);
o change the high cut-off frequency of the sensor signal to 249 Hz
(choose ‘Window - Signal Diagram’; open ‘Properties’ of the ‘Bandpass Filter
10:sensor signal’ object by double-clicking the object; change under ‘Band’ the
value for ‘High’ from 60.00 Hz to 249.00 Hz; press OK).
o show the operator window
(choose ‘Window - Instruments 1’ from the BioExplorer menu);
14
o for giving auditory feedback to the participant, install speakers or wireless
headphones to your PC/notebook or use your notebook speakers.
TIP: Using notebook speakers is often not (or barely) audible for the participant
when training outside.
o start reading data from the PET EEG
(click the ‘Play’ icon on the BioExplorer task bar).
5. Warm-up round
Let the participant perform a warm-up round, meanwhile evaluate the impact sensor
signal and EEG signals in the operator window as described in the section ‘The operator
window’. Provide additional instructions to the subject when necessary.
6. Start the training – step A
Perform the first No Feedback series (appr. 5 series) according to step 6 of ‘The
assessment’:
TIP: The speed of playing is different for different players. You can shorten training
sessions of slow players by performing less series.
o keep the speakers/headphones turned off;
o name the data files in a consistent meaningful manner: e.g.
‘Participantname_T01_NF_S04’’ = participantname_training#_type_series#
(T01=training 1; NF = no feedback, FB = feedback; S01 = series 4);
o on the scoring form, make a note of the event characteristics (goal, distance,
difficulty level, etc), the series name (S0…), and the type of the series (NF/FB) for
every series;
TIP: It is advised to use the same difficulty level in the first training sessions as in
the assessment session. In later training sessions, other difficulty levels can be
introduced.
o score the events for success;
TIP: go to a new column in the scoring form when switching from No Feedback to
Feedback and vice versa.
o during the No Feedback series, observe the yellow feedback signal in the operator
window and evaluate the signal: the signal should be high most of the time and
low once every 10-15 seconds for two seconds;
o if nessecary, fine-tune the reward and inhibit thresholds; refer to ‘Tuning the
training protocol’ for more information on fine-tuning reward and inhibit
thresholds;
o save the fine-tuned training design (choose ‘Design - Save as…’ from the
BioExplorer menu; give in the filename: ‘Participantname_T0…_design.bxd’;
press ‘Save’).
7. Start the training – step B
Perform the first Feedback series (appr. 5 series) according to step 6:
o switch on the feedback by turning on the speakers/ headphones;
o the differences from the No Feedback series are mainly on the side of the
participant; refer to ‘Tuning the training protocol’ for reacting on individual
difficulties in the feedback protocol;
o repeat the instructions for the participant if necessary.
15
8. Continue training
Repeat the steps 6 and 7 for a second time.
TIP: you can divert from the A-B-A-B design in later training sessions and increase the
number of series of the feedback type.
9. Finish training
When the training is fininshed, take off the head electrodes or let the participant do this
him/herself.
10. Turn off equipment
Close BioExplorer and turn off the PET EEG or run another participant (choose
‘BioExplorer - Exit’ from the BioExplorer menu and press the ON/OFF button of the PET
EEG for 3 seconds).
16
5. Working with the PET SPORT
The operator window
Good:
Bad:
17
The impact sensor signals
The white signal is the impact sensor signal
Good:
A large peak occurs in the signal every time an impact occurs.
When there is no impact the impact sensor signal is a horiziontal flat line.
The peak indicating impact is much larger as any noise (deviations from flatline
unrelated to impacts).
Bad (and how to resolve it):
1. The signal looks like a large white band rolling over the screen.
a. The signal is too noisy: check/rewire the connections.
b. The signal scale is not set properly: check the oscilloscope channel 1 scale; the
scale should be set at appr. 200 mV. Right-click the oscilloscope - choose
‘Properties’ - choose the CH1 tab - set ‘Sensitivity’ to 200m.
2. No peak is visible when an impact occurs.
a. The sensor is not connected: check/rewire the connections.
b. The sensor is applied in the wrong position: remount the sensor.
3. Peaks are visible when an impact occurs, but are as large as the noise.
a. Too much noise is on the signal, because of wire movements: fix the PET EEG
electrodes with the sensor wire to the PET EEG. Fixate the sensor end, sensor wire
on the face and the shaft. Shorten the wire by fixing it to the PET EEG.
b. The impact is too soft. If possible, try too increase impact strength by
increasing/decreasing distance.
c. The sensor is unable to pick up the impact sufficiently: remount the sensor in a
different position or try another sensor.
4. There is no white signal.
a. The PET EEG is not connected: refer to ‘The installation Manual’ and ‘FAQ’ for
more information.
The EEG signals
•
The ‘EMG LEVEL’ and ‘EEG NOISE LEVEL’ bar graphs indicate the amount of muscle
tension in the (neck) muscles of the participant and the quality of the EEG signal,
respectively. TIP: Electrical muscle activity is mainly picked up by the earlobe
electrodes. This is unwanted activity, therefore the level should remain low during
measurements.
Good:
The bars are below threshold. The threshold is at 2/5 height of the bar graph range.
Bad (and how to resolve it):
1. No threshold is visible.
18
a. The range of the bar graph is not set properly: check the range; the range should
be set at 0-50 uV. Right-click the ‘EMG LEVEL’/‘EEG NOISE LEVEL’ bar graph –
choose ‘Properties’– choose the ‘Settings’ tab – set the ‘Display Range’ to 0.0u
(left box) and 50.0u (right box).
b. The threshold is not set properly: check the threshold; the threshold should be set
at 20 uV. Right-click the ‘EMG LEVEL’/‘EEG NOISE LEVEL’ bar graph – choose
‘Properties’– choose the ‘Threshold’ tab – set the ‘Manual Targets’ to 20.0u (left
box).
2. The ‘EMG LEVEL’ bar exceeds threshold.
a. The participant has too much mucle tension: ask the participant to relax his/her
(neck) muscles.
3. The ‘EEG NOISE LEVEL’ bar exceeds threshold.
a. The connection of one or more of the head electrodes is inadequate: check the
connection and/or reapply the electrodes to the head, perhaps first preparing the
skin using NuPrep abrasive paste.
The blue signal is the EEG signal
Good:
This signal should look scribly and mostly flat. The largest events happening in the EEG
signal should be eye-blinks. TIP: Because the eye produces an electrical signal when you
blink –or otherwise move your eye- this is picked up by the blue electrode on the forehead.
This is visible in the EEG signal as a large positive peak with a duration of appr. 300 ms.
Bad (and how to resolve it):
1. The signal shows very large slow fluctuations, such that it is mostly out of range of the
oscilloscope.
a. The participant is sweating: if possible, try removing some clothing. TIP:
Perspiration on the head -even when it is not visible- can degrade the EEG signal.
The perspiration can be caused by warmth, nervousness, etc.
b. The participants is frowning his/her eye-brows: ask the participant to restrain from
frowning.
c. The participant is moving his/her head too much: ask the participant too minimize
head movements or ask the participant too avoid head movements in the pre-shot
period; pauze the session until the signal is stabile and back within range of the
oscilloscope. TIP: Especially nodding the head causes movement artefacts. TIP:
show the participant what happens to the signal when he is causing artefacts.
2. The EEG signal is contaminated by many eye-blinks.
a. The subject is blinking his/her eyes too much: ask the subject to try minimizing
eye-blinks (in the pre-shot periods), without causing irritation to the eyes. TIP:
Every person has a different manner of fluidizing their eyes. Some individuals
have to blink their eyes very often too be comfortable, e.g. lenses can cause
overactive eye-blinking. Sometimes, not much can be done about this: by
frantically trying not to blink, after a while some participants get a rebound of
excessive blinking. Often, this period can be planned to occur in the post-shot
period.
19
3. There is no blue signal.
a. The PET EEG is not connected: refer to ‘The installation Manual’ and ‘FAQ’ for
more information.
The brown, orange, green and grey signals are the Theta, Alpha, SMR and
Beta frequency bands of the EEG, respectively
TIP: Refer to ‘Introduction to the PET SPORT’ for more information on frequency bands.
Good:
The signals should look like waves, fluctuating in amplitude. From brown to grey (or
from top to bottom) the waves should be faster (their frequency should be larger).
The frequency band signals shouldn’t show too much overlap. TIP: When an eye-blink
occurs this can be seen in the (orange) Theta signal, because this is the component of the
EEG signal that represent slow activity (to which eye-blinks belong).
Bad (and how to resolve it):
1. The frequency band signals show large overlap.
a. The signal scales are not set properly: check the oscilloscope channel 3-6 scales;
the scales should be set at 50 uV min. to 200 uV max. Right-click the oscilloscope
– choose ‘Properties’ – choose one of the ‘CH3’-‘CH6’ tabs – set ‘Sensitivity’ to
200u, 100u or 50u. Repeat for all channels. TIP: The strength (amplitude) of the
EEG signal (and therefore the frequency bands) is individually different. This is
mainly caused by differences in thickness of the skull.
b. The PET EEG electrodes are not (properly) connected to the head: check the
connection of all head electrodes and the ‘EEG NOISE LEVEL’ bar graph. Refer to
the ‘EEG NOISE LEVEL’ bar graph for further actions.
2. The oscilloscope is filled with a mess of all signals.
a. The PET EEG electrodes are not (properly) connected to the head: check the
connection of all head electrodes and the ‘EEG NOISE LEVEL’ bar graph. Refer to
the ‘EEG NOISE LEVEL’ bar graph for further actions.
The graph with the rainbow colors is the EEG spectrum
TIP: A spectrum is a different representation of a signal than the usual time representation. It
shown the amount in which the different frequencies that compose a signal are present.
Good:
Low frequencies should be relatively high in amplitude: the bars on the left side (low
frequencies – theta) should be higher than on the right (high frequencies – beta).
Bad (and how to resolve it):
The ‘EEG SPECTRUM’ graph is completely filled.
a. The connection of one or more of the head electrodes is inadequate: check the
connection and/or reapply the electrodes to the head, perhaps first preparing the
skin using NuPrep abrasive paste.
b. The scale of the graph is not set properly: check the scale; the scale should be set
at appr. 20 uV. Right-click the ‘EEG SPECTRUM’ graph – choose ‘Properties’– set
‘Sensitivity’ to 50u.
20
The feedback signals
TIP: The feedback signal is of no importance in the assessment session.
TIP: Refer to ‘Introduction to the PET Sport’ for more information on feedback.
The yellow signal is the feedback signal
TIP: The feedback signal has a high value of ‘1’ when the NoGo tone is on; and has a low
value of ‘0’ when the NoGo tone is off.
Good:
The signal is high for most of the time and low once every 10-20 seconds for two seconds
consecutively.
Bad (and how to resolve it):
1. The feedback signal is high all of the time.
a. The reward and inhibit threshold settings are too stringent: lower the ‘reward’
threshold and/or highten the ‘inhibit’ threshold.
b. The ‘EMG LEVEL’ and/or ‘EEG NOISE LEVEL’ bar graphs are above threshold:
feedback is inhibited due to poor signal quality. Refer to ‘The EEG signals’ for
further actions.
c. The ‘inhibit eye-blink’ bar graph is above threshold constantly: check the EEG
signal for large fluctuations. Refer to ‘The EEG signals’ for further actions.
d. The ‘inhibit eye-blink’ bar graph rises above threshold very often: check the EEG
signal for excessive eye-blinking. Refer to ‘The EEG signals’ for further actions.
2. The feedback signal is low all of the time.
a. The reward and inhibit threshold settings are too lenient: highten the ‘reward’
threshold and/or lower the ‘inhibit’ threshold.
3. The feedback signal is switching from high to low too rapidly.
a. The reward and inhibit threshold settings are too lenient: highten the ‘reward’
threshold and/or lower the ‘inhibit’ threshold.
The ‘reward’ and ‘inhibit’ bar graphs represent the level of the targeted
frequencies
TIP: The reward and inhibit signals are determined in the assessment session and represent
the activity of the brain in the optimal mental state. This optimal mental state is reached when
the reward signal is above threshold and the inhibit signal is below threshold. The bar graphs
represent different frequencies for each individual.
Good:
The bars are within range and somewhat slowly fluctuating. The ‘reward’ bar color
turns from red to blue (pass) when exceeding threshold; the ‘inhibit’ bar color turns
from blue to red when exceeding threshold. It could be that the ‘reward’/‘inhibit’ graph
is constantly blue/red. In this case no ‘reward’/‘inhibit’ was set in the training protocol.
21
Bad (and how to resolve it):
1. No threshold is visible.
a. The range of the bar graph is not set properly: check the range; the range should
be set at 0-50 uV. Right-click the ‘reward’/‘inhibit’ bar graph - choose
‘Properties’- choose the ‘Settings’ tab - set the ‘Display Range’ to 0.0u (left box)
and 50.0u (right box).
b. The threshold is not set properly: check the threshold. Threshold settings have
been sent to you included with the design. Right-click the ‘reward’/‘inhibit’ bar
graph - choose ‘Properties’- choose the ‘Threshold’ tab - set the ‘Manual Targets’
(left box) to the correct settings. TIP: Refer to ‘Tuning the training protocol’ for
detailed information about reward and inhibit settings.
•
The ‘inhibit eye-blink’ bar graph indicates when an eye-blink occurs. TIP: The
‘inhibit eye-blink’ bar exceeds threshold when an eye-blink occurs. For some protocols,
eye-blinks can be a nuisance for the training, because they are similar signals to the
targeted signals (‘reward’ and ‘ínhibit’). This is why they are detected and the Go cue is
inhibited when an eye-blink occurs.
Good:
The bar is within range and shoots up over the threshold whenever an eye-blink occurs.
The bar color changes from blue to red when exceeding threshold.
Bad (and how to resolve it):
2. No threshold is visible.
a. The range of the bar graph is not set properly: check the range; the range should
be set at 0-200 uV. Right-click the ‘inhibit eye-blink’ bar graph – choose
‘Properties’– choose the ‘Settings’ tab – set the ‘Display Range’ to 0.0u (left box)
and 200.0u (right box).
b. The threshold is not set properly: check the threshold; the threshold should be set
at 50 uV. Right-click the ‘inhibit eye-blink’ bar graph – choose ‘Properties’– choose
the ‘Threshold’ tab – set the ‘Manual Targets’ to 50.0u (left box).
22
The Assessment Report
TIP: Refer to the appendix for an example of an Assessment Report.
After performing an assessment and requesting an analysis from Brainquiry, the results will be
communicated to you in the form of an Assessment Report. This report consists of:
• a discussion of the general appearance of the impact sensor and EEG data;
• participant-specific tips to improve the quality of the recording;
• graphs and discussion of the raw event-related EEG data;
• graphs and discussion of the raw event-related frequency band amplitude data;
• graphs and discussion of the event-locked averaged EEG data;
• graphs and discussion of the event-locked averaged frequency band data; TIP: Refer to
‘Introduction to the PET Sport’ for more information on event-locked averaging.
• an advice on reward and inhibit frequencies and threshold settings for training;
• an advice on how to handle expected participant-specific difficulties in training. TIP:
Refer to ‘Tuning the training protocol’ for more information on rewards and inhibits and
general remarks on training difficulties.
Tuning the training protocol
The training protocol is a participant-specific set of EEG characteristics that have been
pinpointed as relevant in the assessment session. Brainquiry has implemented these EEG
characteristics into the training design (‘Participantname_T_design.bxd’) you receive together
with the Assessment Report after requesting an analysis from Brainquiry.
The main constituents of the training design are a to-be-rewarded frequency band and a to-beinhibit frequency band of the EEG, shortly: ‘reward’ and ‘inhibit’. TIP: Refer to ‘Introduction to
the PET Sport for more information on the functionality of frequency bands in EEG. In the
assessment it was determined that the ‘reward’ frequencies should be elevated for optimal results.
Therefore, the ceasing of the feedback tone has been made dependent on the amplitude of the
reward frequencies. The amplitude of the reward frequencies should be above threshold for the
feedback tone to cease.
However, this is not the only precondition of the ceasing of the feedback tone. Additionally,
activity in a different frequency band should be kept low for optimal results. An inhibit is set on
these frequencies. Now, the amplitude of the inhibit frequencies should be below the threshold
and the amplitude of the reward frequencies should be above the threshold for the feedback tone
to cease.
Another precondition for the feedback tone to stop is that no eye-blink occurs at that moment.
This inhibit is applied because of the undesirable possibility of eye-blinks causing the feedback
tone to cease. The ‘inhibit eye-blink’ should therefore remain below threshold as much as
possible. Furthermore, the ceasing of the feedback tone is inhibited when there is low signal
quality (excessive EMG or a bad connection).
23
Thus, we have five precondition that should be met simultaneously for the feedback tone to stop:
• ‘EMG LEVEL’ should be below threshold;
• ‘EEG NOISE LEVEL’ should be below threshold;
• ‘inhibit eye-blink’ should be below threshold;
• ‘reward’ should be above threshold;
• ‘inhibit’ should be below threshold.
The thresholds for the ‘EMG LEVEL’ and ‘EEG NOISE LEVEL’ are preset levels of 20 uV and
usually do not pose a problem. However, when it is impossible for a participant to release muscle
tension (through relaxation) or impossible for the operator to get at a good electrode connection
(using NuPrep paste to abrase the skin) the thresholds can be set to a somewhat higher value.
Eye-movement activity is individually very different. Therefore, a individual approach in
handling eye-movement activity is necessary. Brainquiry has evaluated the eye-movement
activity of your participant in the assessment session and adapted the training design accordingly.
However, eye-movement activity can be different from the assessment in case the participant
receives feedback because the process (self-paced vs. on-command) has changed. When this
happens, the ‘inhibit eye-movement’ threshold can be changed.
TIP: It is strongly advised to contact Brainquiry if the ceasing of the feedback tone occurs most
often in combination with an eye-blink..
Also, the ‘inhibit eye-blink’ threshold will inhibit the feedback tone when the EEG signal is out
of range (large slow fluctuations). When the signal is within range of the ‘inhibit eye-blink’ but
stays above threshold continuously, the threshold can be temporarily heightened until the EEG
signal stabalizes.
TIP: Make sure that the threshold is set back to its original value, so it can serve its purpose:
inhibiting when eye-blinks occur.
Brainquiry has extracted threshold values for the reward and inhibit frequencies. These are
approximate values and might need some fine-tuning. Try to change the threshold settings, such
that the feedback is pleasant for the participant. Usually, this is the case when the feedback is
stable and predictable, ceasing every 5-15 seconds. This can be individually different, depending
on the speed and character of a player. The Assessment Report indicates the weight that is given
on a reward or inhibit. In most cases, the reward will be the most critical for success. Include this
in the fine-tuning: if the reward is most important, leave the threshold high and highten the
threshold of the inhibit and vice versa. Evaluate what percentage of the the reward/inhibit is
above/below thershold in the pre-shot period. TIP: the percentage that a signal passed the
threshold is indicated on the threshold just below the graph. Use this information in the finetuning proces.
24
Appendices
Appendix A. Example of an Assessment Report……………………………………… 27
Appendix B. Preliminary report of the golf study.……………………………………. 35
Appendix C. Testamonial Stefan Matel………………………………………………. 43
25
26
PET Sport Assessment Report
Sport: Golf
Requested from:
Client:
Assessment date:
Report date: 15-05-2006
Analysis performed by: Michiel Kleinnijenhuis
Contents
1. Data recordings
2. Raw event-related EEG data
3. Raw event-related frequency band amplitude data
4. Event-locked averaged EEG data
5. Event-locked averaged frequency band data
6. Rewards and inhibits
7. Additional training guidelines
27
1. Data recordings
Figure 1. A typical sample of the recorded data.
Sensor signal
The sensor signal contains too much noise in between events. The event marker is
difficult to distinguish from the other peaks in the sensor signal. However, the signal
shows stabilisation in the pre-shot period (no noise before impact). This makes it likely
that noise is caused by the participant moving around.
EEG signal
The quality of the EEG signal is generally good. The EEG noise level is within range
most of the time and always in range in the pre-shot period. In the pre-shot period, not
much EMG is present. The EEG shows large artefacts in the irrelevant post-impact
period. A considarable time before impact the artefacts are reduced to acceptable levels.
Generally, no artefacts occur in the second before impact. Eye-blink activity is in the
normal range and amplitude of the eye-blink activity is low. In the later (four) series A07A10 large fluctuations of the EEG signal occur, presumably because of head
movement/frowning.
28
Raw event-related EEG data
Figure 2. Raw EEG data of all events from 3 seconds before to 1 second after impact.
The first five series of events are generally good. In the last four series the EEG is
subject to fluctuations. The participant presumably changed the quiet routine he was in
and was moving his head a lot more.
Between –3 and –2 seconds a consistent abberation (presumably eye-blink) is visible.
Events [8 9 10 17 18 19 20 49 50 62 63 71 89] are artefacted and not are included in
further analysis.
29
Raw event-related frequency band amplitude data
Figure 3.
30
Event-locked averaged sensor signal and EEG data
Figure 4. Event-locked average sensor and EEG data (ERP).
The event-locked averaged sensor signal indicates correct event-locking.
In the ERP it can be seen that there is large slow fluctuation. This is caused by the
artefacts in series A07-A10.
31
Event-locked averaged frequency band data
Figure 5. Success profile. The blue trace indicates event-locked averaged
frequency band amplitude for successful events from 3 seconds before to 1
second after impact; the green trace is for unsuccessful events.
General impression:
Quieting of the EEG in the pre-impact period. Presumably a consistent eye-blink in the
interval from –2.5 to –1 s. Increased activity in all frequency bands in the post-impact
period.
32
Theta:
Lowered and stabilized theta activity from –0.5 s to 0.5 s. No relevant differences
successful vs. unsuccessful events.
Alpha:
Lowered and stabilized alpha activity from –0.8 s to 0 s. In the pre-impact period, alpha
activity is consistently higher for successful than for unsuccessful events.
SMR:
Minimally lowered SMR activity from –0.6 s to 0.2 s. SMR activity for successful events
is more stabile. Just before impact, SMR for unsuccessful events shows a decrease,
wheter SMR in successful events is stabile up to the moment of impact.
Beta:
Lowered and stabilized beta activity from –1 s to -0.2 s. From –0.2 s to impact, a strong
beta-burst occurs, which seems to be somewhat stronger in successful events.
33
Rewards and inhibits
Reward 1: 9-13 Hz
In the event-locked average frequency band amplitude data an increased alpha activity
was found for successful vs. unsuccessful events. This effect extended -to a lesser
extend- to the SMR frequencies. This was not seen at the lower frequency bound of the
alpha frequencies. Therefore, the reward frequency range should be 9-13 Hz.
The amplitude of the alpha frequency band in the pre-impact period was approximately 5
uV. Thus, the target alpha amplitude would be around 5 uV.
Inhibit 1: 4-7.5 Hz
The success profile indicated a that the pre-impact routine included a lowering of theta
activity.
Optimal performance is therefore associated with lowered theta activity. The data shows
that a theta amplitude lower than 8 uV is desirable.
Inhibit 2: 15-30 Hz
Additionally, the success profile shows that building up to an impact, beta activity
decreases before the pre-impact beta burst. It is advised to also lower the beta
frequencies in this participant. A somewhat loose threshold level of 5-6 uV can be
applied here.
34
Preliminary Report: Golf performance enhancement by
means of real-life neurofeedback training based on
personalized event-locked EEG profiles
Michiel Kleinnijenhuis 1,2, Martijn Arns
2,3
, Rien Breteler1,3 & John Rijpma 2
1
2
Radboud University Nijmegen, Nijmegen, The Netherlands
BraInquiry B.V. Research & Development, Nijmegen, The Netherlands
3
Brain Resource Company B.V. Nijmegen
Abstract
This study reports on a very promising, new method for golf performance enhancement
employing real-life neurofeedback during golf putting.
Participants (n=6) received an assessment and three real-life neurofeedback training
sessions. In the assessment, a personal event-locked EEG profile was determined for
successful vs. unsuccessful puts. Target frequency bands and amplitudes marking
optimal mindset were derived from the profile by two raters. The training sessions
consisted of four series of 80 puts in an ABAB design. The feedback in the second and
fourth series was administered in the form of a continuous NoGo tone, whereas in the
first and third series no feedback was provided. This tone was terminated only when the
participants EEG met the assessment-defined criteria. In these series, participants were
instructed to perform the put only after the NoGo tone had ceased.
From the personalized event-locked EEG profiles individual training profiles were
established. The inter-rater reliability was 91%. Individual training results show that 92%
of participants improved their putting performance in the feedback condition as
compared to the no-feedback condition. The overall percentage of successful puts was
significantly larger in the second and fourth series of training compared to the first and
third series (p=.009).
This study demonstrates that the ‘zone’ or the optimal mental state for golf putting shows
clear recognizable individual patterns. Furthermore, most subjects improved their
performance with feedback on their personal EEG profile with 10 %, on average. The
learning effects suggest that this real-life approach to neurofeedback improves learning.
In a follow-up study we will study the long term learning effects and the effects on these
golf players handicaps.
35
Methods and material
Participants
Six subjects participated in the experiment (3 female). Subjects were all amateur golf
players. Their average handicap was 12.3 (SD = 5.6).
Procedure
Assessment
All subjects first participated in an assessment session. This session was included to
determine the subjects personalized event-locked EEG profile.
A warm-up round was used to determine the subjects personalized 50 % successful
putting distance (PD50). Subjects performed series of 10 puts, which were scored as
successful/unsuccessful. After each series, the percentage of successful puts in that
series was determined. According to this percentage, subjects had to increase/decrease
their putting distance in the next series. This process was repeated until subjects scored
50 % accuracy. The distance at which this occurred first was taken as the PD50. The
PD50 was used as putting distance in the assessment of the event-locked EEG profile
and during the subsequent trainings.
In the assessment session, subjects performed eight series of 10 puts. In this session,
the subjects EEG was recorded from FPz referenced against linked earlobes while
making the puts. Additionally, the exact instant of ball impact was recorded with a
microphone that was mounted on the putter.
Training
In the neurofeedback training sessions, participants received feedback on their brain
activity. The training consisted of three separate sessions (different days) consisting of
series of 8x10 puts from their PD50 in an ABAB design. First, subjects performed a
series of puts without feedback. Then, feedback was provided for a second series. In the
third series, again, no feedback was given. The session concluded with a feedback
series.
The feedback consisted of a constant NoGo tone –delivered to the subject through
notebook speakers– that was terminated when the subject reached his or her personally
determined optimal mindset. This mindset was determined for each of the subjects
individually on the basis of their assessment session by event-locked averaging of the
EEG for successful and unsuccessful puts separately.
EEG was recorded from FPz referenced against linked earlobes during training. From
the EEG, amplitudes of the individually assessed frequency bands were extracted. The
NoGo tone terminated when all the to be rewarded amplitudes exceeded the preset
reward thresholds, while the to be inhibited amplitudes were below the preset inhibit
thresholds. Besides the individually determined rewards and inhibits, termination of the
tone was inhibited during the occurrence of excessive impedance, EMG or EEG power which, on FPz, usually indicates an eye-blink. When the tone ceased it was set to be
absent for at least 1.5 s, except when an eye-blink occurred.
The subject was instructed to:
1. If he felt ready, initiate putting when the tone was terminated.
36
2. Make the put within 1.5 s from the moment when the feedback sound ceased.
3. Carry out the put when the decision was made to do so, irrespective of the
possible return of the NoGo tone.
All puts were scored manually as being successful or unsuccessful. Also, the instant of
ball impact was recorded with a microphone mounted on the putter.
Apparatus
The assessment took place on the putting range of a golf course (Anderstein, The
Netherlands). A table was set up near the putting-hole on which recording PC’s were
placed. The experimenters were seated behind the table. The first training session also
was held outdoors. The second and third training session, however, were held indoors
on artificial grass measuring 145x400 cm. A putting cup was placed on the artificial
grass. A table holding the equipment was placed next to the grass, on the side of the
putting cup. The experimentor was seated behind the putting cup. A marker was placed
at the 50 % successful putting distance.
All EEG recordings and feedback sessions were realized using the wireless BraInquiry
2-channel PET EEG with active electrodes and BioExplorer software. The PET EEG
was attached on the subjects back on an elastic band around the chest. Wires were lead
over the subjects backs such that it minimized inconvenience and maximized freedom of
movement.
The first channel of the PET EEG was used to record EEG from FPz, referenced against
linked earlobes. The ground was placed on the left side of the forehead. Disposable
jelly-filled Ag/Ag+Cl- electrodes (Arbo electrodes, Tyco) were used for EEG recording. All
electrode sites were prepared with alcohol and Nuprep.
The instant of ball impact was recorded using a microphone (AV-JEFE TCM 160), which
was mounted on top of the putter. The microphone signal was recorded by the second
channel of the PET EEG.
Subjects used their own putter.
Data Analysis
Assessment
The EEG data from the assessment were bandpass filtered using BioReview software.
(Theta: 4-8 Hz, Alpha: 8-12 Hz, SMR: 12-15 Hz, Beta: 15-30 Hz, Alpha-1: 8-10 Hz,
Alpha-2: 10-12 Hz, Beta-1: 15-22.5 Hz and Beta-2: 22.5-30 Hz). The frequency band
amplitudes were averaged locked to the event of ball impact for successful and
unsuccessful puts separately. E.g. the EEG data of approximately 40 successful events
were aligned on the exact timing of the ball impact and then averaged over the events:
Event Related EEG.
To establish an indivualized training profile, the event-locked amplitude spectra were
printed and rated by two raters.
Neurofeedback training
Training results were averaged over subjects and subsequently evaluated in a 3x2x2
ANOVA (session x feedback x series). Additionally, post-hoc 2x2 ANOVA’s (feedback x
series) were carried out for each of the training sessions.
37
Results
Assessment
The average PD50 was found to be 149 cm (SD 30 cm) and inversely related to
handicap. Scores in the assessment indicated a correct setting of the PD50. The average
percentage of successful puts in the assessment was 48.7 % (SD = 5.1%).
Event-locked averaging of the EEG revealed a clear EEG pattern for each of the
subjects where for the successful vs. unsuccessful puts clear patterns were observed
just before ball impact. The interesting finding is that these profiles were quite different
for most of the subjects. Figure 1 shows three examples of these profiles. Table 1 shows
the obtained training settings, which were used in the subsequent training.
After rating of the profile comparison of conclusions of the raters revealed only one
minor difference in the training protocols. Therefore, the inter-rater reliability was 91%.
38
Figure 1. Event-locked EEG profiles for successful (black traces) vs. unsuccessful (red traces)
puts of three subjects. All windows show activity from 1s before ball impact to 0.5 s after ball
impact.
Subject FK shows no differentiation in the Alpha band before ball impact (upper left window).
The SMR, however, is significantly elevated before ball impact for successful puts compared to
unsuccessful puts and remains elevated after ball impact (upper right window). A similar effect is
seen in the Beta 1 band, only now quitting after ball impact (lower left window). This effect is
specific for the Beta 1 band and does not occur in the Beta 2 band as seen in the lower right
window.
Subject HG shows an increase in Alpha frequencies just before ball impact for successful puts
(left window). Also, a small effect is seen the SMR frequencies (right window).
In subject WS a very different pattern is revealed. In the Theta band, a phase shift is evident. For
the unsuccessful puts, Theta activity seems to peak too early (left window). The effect is also
seen less clearly in the Alpha band (right window).
Subjects HG and WS are representative for the subject sample, but are not reported in this study.
39
EEG power:
2-42 Hz
imp check:
48-52 Hz
EMG:
42-60 Hz
< 100
< 20
< 20
< 100
< 20
< 20
< 100
< 20
< 20
< 100
< 20
< 20
< 13
< 100
< 20
< 20
< 10
< 100
< 20
< 20
Subject
Theta
Alpha
SMR
Beta
AH
< 18
> 18
<8
< 15
AV
< 15
>6
<9
EB
< 18
FK
< 15
< 10
>8
HK
< 20
< 10
< 10
> 25
<9
IW
< 14
Alpha 1
Alpha 2
Beta 1
Beta 2
>6
> 12
> 10
<8
Table 1. Reward and inhibit threshold settings during training.
Neurofeedback training
Accuracy scores for the three training sessions are summarized in Figure 2. A 3x2x2
repeated-measures ANOVA (session x feedback x series) was performed on the
accuracy scores. The overall effect of session was found to be highly significant
(p<.000), indicating that the accuracy performance was different over sessions.
Furthermore, the accuracy in the feedback condition was significantly different from the
no-feedback condition (p=.009) demonstrating a clear effect of the feedback. No effect
of series nor interactions were found.
To investigate were these effects occurred we performed post-hoc 2x2 (feedback x
series) ANOVAs for each of the sessions individually. In session 1, no significant effects
were found. In session 2, however, a highly significant effect of feedback was found
(p<.000). Post-hoc T-tests revealed that the first series of the no-feedback condition
differed from the first series of the feedback condition (p=.005) and the second series of
the feedback condition (p=.002). No other post-hoc differences were found. The ANOVA
of the third session again revealed no significant effects.
40
Figure 2. Putting accuracy averaged over subjects. (**) indicates a significant effect.
Discussion
Previous studies have mainly focused on establishing successful profiles in sports
people based on group data (Alpha lateralization: Salazar et al, 1990; Electrocortical
slow potentials: Konttinen et al., 2000). In this study we clearly demonstrated that
different people under similar task conditions show individualized ‘success’ patterns prior
to putting a golf ball. Some subjects indeed showed increased alpha before ball impact
as the optimal mental state, as previous literature suggests (Landers et al., 1991;
Salazar et al., 1990). However, other subjects showed increased SMR-low beta (Subject
FK) was associated with the optimal mental state, where others showed a clear phase
shift in their alpha and theta activity (Subject WS), suggesting that for this latter group
timing is more crucial, rather then brain state per sé.
Furthermore, this study also demonstrated that if people are reinforced on their optimal
EEG profile they increase their putting accuracy with on average 10%, as compared to a
no-feedback condition, adding further support to the notion that these optimal brain
states are highly individual, and are really related to optimal performance.
Previous studies have suggested lateralization differences with respect to optimal
performance (Crews & Landres, 1993; Salazar et al., 1990). However, in our pilot study
we started with ECG and 2 channels EEG, but found no clear differences between the
41
two channels. The results from a single channel were so evident we decided to pursue
this path. These differences could stem from the differences in recording site. The
studies from Crews & Landers (1993) and Salazar et al. (1990) recorded alpha activity
from T3 and T4 whereas we recorded from FPz.
In this study we did not use sham feedback to control for non-specific effects, future
studies should address this. However, in previous studies investigating neurofeedback
for ADHD (Lubar et al.) and epilepsy (Sterman et al., 2000) these kind of control groups
have been used and still found there was a specific effect of feedback. Also the study by
Landers et al. (1991) showed a specific effect of neurofeedback training where
uptraining alpha increased performance and downtraining alpha decreased
performance. Hence, we suspect the obtained effects are real effects, though replication
studies and studies employing control groups should be carried out to confirm this.
References
Crews, D.J. & Landers, D.M. (1993) Electroencephalographic measures of attentional
patterns prior to golf putt. Med Sci Sports Exerc, 25 (1), 116-126.
Landers, D.M., Petruzzello, S.J., Salazar, W., Crews, D.J., Kubitz, K.A., Gannon, T.L. &
Han, M. (1991) The influence of electrocrtical biofeedback on performance in pre-elite
archers. Med Sci Sports Exerc, 23(1): 123-129.
Salazar, W., Landers, D.M., Petruzello, S.J., Han, M., Crews, D.J. & Kubitz, K.A. (1990)
Hemispheric asymmetry, cardiac response, and performance in elite archers. Res Q
Exerc Sport, 61(4) : 351-359
Konttinen, N., Landers, D.M., Lyytinen, H. (2000) Aiming routines and their
electrocortical concomitants among competitive rifle shooters. Scand J Med Sci Sports,
10(3):169-177
42
A golfer’s brain game.
On Januari 4, Brainquiry started a real-life neurofeedback training tract with Stefan Matel, a 21
year old top level golfer (handicap 0), playing for the Dutch national selection. We came into
contact with this young talent through Ton Hoogveld, psychologist of Ton Hoogveld
Consultancy, active as mental coach of top level sportsmen, among others.
Stefan Matel: “I never thought somebody could improve my putting through my
brain!”
On this first day, Stefan performed an assessment
session. The assessment consisted of 120 puts
from a distance that resulted in a success
percentage of 50 %, approximately. During the
assessment, his brain activity was recorded by
means of EEG (electro-encephalogram) using the
Brainquiry PET EEG. Additionally, for each put,
the exact moment of ball impact was registered
using a sensor that was mounted on the putter
face. Also, all puts were meticulously scored for
success.
The neurofeedback specialists at Brainquiry
analysed the recorded data. They found a specific
EEG profile for successful puts and a different
profile for unsuccessful puts. The characteristics
of the success profile reflect Stefan’s optimal
mental state for (putting) performance. The
characteristics of Stefan’s profile (fig. 1) are:
• quieted EEG activity in the pre-shot interval;
• low 4-8 Hz (Theta) activity (aspecific) in the
pre-shot interval;
• increased 8-12 Hz (Alpha) activity for
successful vs. unsuccessful puts from -0.5 s;
• increased 12-15 Hz (low Beta) activity
for successful vs. unsuccessful puts from
Figure 1. Averaged event-locked EEG activity for
-0.5 s;
successful (blue) vs. unsuccessful (green) puts in the
• increased activity after the put (8-30 Hz).
interval from 1 s before to 1 s after ball impact (0 s).
Subsequently, we trained Stefan according to the real-life neurofeedback method. In a training
session, he hit four series of 50 puts in an ABAB design, alternating NoFeedback (A/NF) series
with Feedback (B/FB) series. In the feedback series, putting was prohibited when he had not
reached his optimal mindset, as determined by the assessment (low 4-8 Hz/high 9-14 Hz
activity). Stefan heard a tone that was terminated when he reached his optimal mental state. He
was instructed to put only when he was ready to make the put himself, and when the feedback
tone terminated.
43
Stefan Matel
success percentage [%]
70.0
65.0
Stef anM T01
Stef anM T05
60.0
55.0
50.0
45.0
40.0
35.0
30.0
NF1
FB1
NF2
FB2
s e rie s
Figure 2 shows the data from
Stefan’s first (T01) and last (T05)
training session. It indicates an
improvement in his putting of 22 %
from the first series in his first
training session to his last series in
his fifth training session.
Figure 3 shows his learning curve.
It indicates how the percentage of
successful puts in Feedback series
develops over real-life
neurofeedback sessions. With
already an improvement of 15 %,
the curve is still ascending at his
current fifth session.
Figure 2. Percentage of successful puts for the four series in the
first and fifth training session.
The results of this case history show that real-life neurofeedback can really bring your
performance to a higher level. Confronted with the remarkable improvement, Stefan told us: “I
can advise everyone to give it a try! At first I thought: Is this going to help me? But if it makes
you hole one more putt in a match, that could be the one that makes the difference between losing
or winning. I've already played a few tournaments after real-life neurofeedback training an I can
say that my putting has improved a lot. I never thought somebody could improve my putting
through my brain!”.
Stefan Matel
60.0
success percentage [%]
55.0
50.0
45.0
40.0
35.0
T01
T02
T03
T04
T05
session
Figure 3. Percentage of successful puts in feedback series over training sessions.
44