1
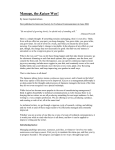
Figure 1: An incomplete Gantt chart (made with Merlin).
better to do so, so that you can enjoy the event, instead of beating yourself up for not working
on the thesis and getting behind in the planning. Planning breaks is a bit like fooling yourself,
but it works wonders. So, yes, you can plan breaks into you schedule; I would even say that
you are encouraged to do it.
Why is that so? What you have to take into account is that the ‘problem’ with research
and development projects is that you always can do more. This is in stark contrast with a
normal course module where there is a clearly delimited piece of knowledge and skills you have
to acquire, and once you know it, it’s enough. For theses, there is no upper bound, really. As a
consequence, you may end up working all the time on it. However, occasionally taking a step
back, taking a break and coming back with a fresh mind and energy helps you see things in
a new light, gets you over a lapse in motivation, or makes ‘writer’s block’ vanish. Or you can
use it as a carrot for yourself to get a less pleasant task done more quickly (‘if I complete x, I
can go to the beach for a whole weekend’), and actually enjoy the time off.
3.4
Making a schedule
We are now ready to start making a schedule, using the deliverables, milestones, main and
subtasks. There are strict deadlines for the presentations and for the deliverables you have to
hand in, but the rest is up to you to decide (in collaboration with your supervisor). In theory,
there are two ways to put actual dates to the activities: calculating forward, and calculating
backwards—the end product should be the same schedule anyway.
While it is possible to put your schedule in a MS Word or Excel sheet, this is rather inflexible
to manage, because with every little change (say, you were ill for a week), you will have to
update all of it manually. There is not only a plethora of software for scheduling, there are also
different scheduling systems. PERT (program evaluation and review techniques) and Gantt
are the most well-known ones. Figure 1 shows an (incomplete) Gantt chart. The key elements
of such a chart are:
• Break-down of activities and sub-activities (on the left)
• Milestones (noted on the left, visualised with a blue diamond on the right)
• The estimated workdays for each (sub-)activity (4th column in the left-hand pane)
7