1
Melanie 3 User Manual
MELUMBR0199
Warranty
Bio-Rad Laboratories warrants that the Melanie software shall substantially
conform, in all operational features, to Bio-Rad’s current specifications as published in Bio-Rad’s user and installation guides and that, when properly
installed, it will be free of material defects which affect system performance.The
Purchaser must notify Bio-Rad in writing, within 30 days of delivery of the software (not including delivery of any subsequent modifications to the software),
of any defect. If the software is found to be defective by Bio-Rad, Bio-Rad’s sole
obligation under this warranty is to remedy the defect in a manner consistent
with Bio-Rad’s regular business practices. For a defect which adversely affects
the performance of the software, Bio-Rad shall use its best efforts to cure such
defect as soon as reasonably practicable after receipt of Purchaser’s notice.
For minor defects, Bio-Rad shall use its best efforts to correct such minor
defects in the next release of its software. If, however, Bio-Rad is unable to cure
a major defect within 90 days of receipt of Purchaser’s notice, Purchaser shall
have the option to cancel this agreement, whereupon Bio-Rad shall refund only
the software fees paid. Liability of Bio-Rad to Purchaser, if any, for breach of
warranty, or any other claim relating to this agreement, shall be limited to the
total amount of software fees paid by purchaser to Bio-Rad. In no event shall
Bio-Rad be liable for incidental or consequential damages, loss of business or
profits, special or indirect damages of any nature whatsoever. No amendment,
waiver, or other alteration of the warranties in this agreement may be made
except by mutual agreement in writing.
Purchaser agrees that Bio-Rad’s liability arising out of contract, negligence,
strict liability in tort or warranty shall not exceed the amount of software license
fees paid by Purchaser. Under the copyright laws, this manual and the software
program contained herein may not be copied, in whole or in part, without the
prior written consent of the Swiss Institute of Bioinformatics, except in the normal use of the software or to make a backup copy. This exception does not
allow copies to be made for others, whether or not sold, but all of the materials
purchased (with all backup copies) may be sold, given or loaned to another person. Under the law, copying includes translating into another language or format. A multi-use license may be purchased to allow the software to be used on
more than one computer owned by the purchaser, including a shared disk system.
This warranty as well as the contract of purchase of the Melanie software is
governed by and construed in accordance with Swiss law and is submitted to
the exclusive jurisdiction of the Court of the Canton of Geneva, Switzerland.
Copyright
The Swiss Institute of Bioinformatics retains all ownership rights to the
Melanie software and documentation. No part of this publication may be
reproduced or transmitted in any form or by any means, electronic or
mechanical, including photocopy, recording or any information storage or
retrieval system, without permission in writing from Swiss Institute of Bioinformatics.
Copyright 1992 - 2000 Swiss Institute of Bioinformatics, Geneva, Switzerland. All rights reserved.
Copyright 1988-1999 Sam Leffler and 1991-1999 Silicon Graphics, Inc.
for the TIFF library.
Technical support
Bio-Rad provides technical support on the features of the Melanie software. The staff of Bio-Rad is receptive to your suggestions. If you have
any suggestions, problems or questions on the use of the features,
please contact your local Bio-Rad office, or in the U.S. call Bio-Rad Technical Service at 1-800-4BIORAD (1-800-424-6723). Please report any
reproducible software problems to Bio-Rad Laboratories.
Trademarks
TIFF is a trademark of Aldus Corporation. Microsoft Excel, Microsoft
Word, Microsoft Internet Explorer, Windows 95, Windows 98 and Windows NT are trademarks of Microsoft Corporation. PostScript is a trademark of Adobe Systems, Inc. Netscape Communications, Netscape and
Netscape Navigator are trademarks of Netscape Communications Corporation.
Rather than put a trademark symbol in every occurrence of other trademarked names, we state that we are using the names only in an editorial
fashion, and to the benefit of the trademark owner, with no intention of
infringement of the trademark.
CONTENTS
PART I: BASICS
1
INTRODUCTION
. . . . . . . . . . . . . . . . . . . . . . . . . . . . . . . . . . . . . .1
Hardware and software requirements . . . . . . . . . . . . . . . . . . . . . . . . . 2
Installation . . . . . . . . . . . . . . . . . . . . . . . . . . . . . . . . . . . . . . . . . . . . . . 2
Interface . . . . . . . . . . . . . . . . . . . . . . . . . . . . . . . . . . . . . . . . . . . . . . . . 4
Objects . . . . . . . . . . . . . . . . . . . . . . . . . . . . . . . . . . . . . . . . . . . . . . . . . 7
Selecting and showing objects . . . . . . . . . . . . . . . . . . . . . . . . . . . . . . 10
Features Overview . . . . . . . . . . . . . . . . . . . . . . . . . . . . . . . . . . . . . . . 11
Important Note . . . . . . . . . . . . . . . . . . . . . . . . . . . . . . . . . . . . . . . . . . 15
2
GELS . . . . . . . . . . . . . . . . . . . . . . . . . . . . . . . . . . . . . . . . . . . . . .17
Opening gels . . . . . . . . . . . . . . . . . . . . . . . . . . . . . . . . . . . . . . . . . . .
Saving gels . . . . . . . . . . . . . . . . . . . . . . . . . . . . . . . . . . . . . . . . . . . . .
Exporting gels and windows . . . . . . . . . . . . . . . . . . . . . . . . . . . . . . .
Printing gels . . . . . . . . . . . . . . . . . . . . . . . . . . . . . . . . . . . . . . . . . . . .
Loading / unloading gels . . . . . . . . . . . . . . . . . . . . . . . . . . . . . . . . . .
Closing gels and exiting Melanie . . . . . . . . . . . . . . . . . . . . . . . . . . . .
Selecting gels . . . . . . . . . . . . . . . . . . . . . . . . . . . . . . . . . . . . . . . . . . .
Displaying gels . . . . . . . . . . . . . . . . . . . . . . . . . . . . . . . . . . . . . . . . . .
Showing gels . . . . . . . . . . . . . . . . . . . . . . . . . . . . . . . . . . . . . . . . . . .
Changing the display gels order . . . . . . . . . . . . . . . . . . . . . . . . . . . . .
Stacking gels . . . . . . . . . . . . . . . . . . . . . . . . . . . . . . . . . . . . . . . . . . .
Moving gels . . . . . . . . . . . . . . . . . . . . . . . . . . . . . . . . . . . . . . . . . . . .
Zooming gels . . . . . . . . . . . . . . . . . . . . . . . . . . . . . . . . . . . . . . . . . . .
Magnifying window . . . . . . . . . . . . . . . . . . . . . . . . . . . . . . . . . . . . . . .
Melanie 3 User Manual
17
18
18
19
19
20
21
22
23
24
25
27
28
29
i
CONTENTS
Displaying grid lines . . . . . . . . . . . . . . . . . . . . . . . . . . . . . . . . . . . . . .
Aligning gels . . . . . . . . . . . . . . . . . . . . . . . . . . . . . . . . . . . . . . . . . . . .
Gray levels . . . . . . . . . . . . . . . . . . . . . . . . . . . . . . . . . . . . . . . . . . . . .
Calibrating gels . . . . . . . . . . . . . . . . . . . . . . . . . . . . . . . . . . . . . . . . . .
Setting preferences . . . . . . . . . . . . . . . . . . . . . . . . . . . . . . . . . . . . . .
Reporting on gels . . . . . . . . . . . . . . . . . . . . . . . . . . . . . . . . . . . . . . . .
3
SPOTS . . . . . . . . . . . . . . . . . . . . . . . . . . . . . . . . . . . . . . . . . . . . .39
Editing spots . . . . . . . . . . . . . . . . . . . . . . . . . . . . . . . . . . . . . . . . . . . .
Preview detection results . . . . . . . . . . . . . . . . . . . . . . . . . . . . . . . . . .
Adding / modifying spots . . . . . . . . . . . . . . . . . . . . . . . . . . . . . . . . . .
Spots quantification . . . . . . . . . . . . . . . . . . . . . . . . . . . . . . . . . . . . . .
Calibrating spots . . . . . . . . . . . . . . . . . . . . . . . . . . . . . . . . . . . . . . . . .
Showing spots . . . . . . . . . . . . . . . . . . . . . . . . . . . . . . . . . . . . . . . . . .
Selecting spots . . . . . . . . . . . . . . . . . . . . . . . . . . . . . . . . . . . . . . . . . .
Cursor information . . . . . . . . . . . . . . . . . . . . . . . . . . . . . . . . . . . . . . .
Report on Spots . . . . . . . . . . . . . . . . . . . . . . . . . . . . . . . . . . . . . . . . .
4
ANNOTATIONS
39
42
42
44
44
45
46
47
49
. . . . . . . . . . . . . . . . . . . . . . . . . . . . . . . . . . . . . .53
Pre-defined label categories . . . . . . . . . . . . . . . . . . . . . . . . . . . . . . .
Creating annotations . . . . . . . . . . . . . . . . . . . . . . . . . . . . . . . . . . . . .
Creating specific links . . . . . . . . . . . . . . . . . . . . . . . . . . . . . . . . . . . .
Modifying and deleting annotations . . . . . . . . . . . . . . . . . . . . . . . . . .
Editing annotations . . . . . . . . . . . . . . . . . . . . . . . . . . . . . . . . . . . . . . .
Selecting annotations and labels . . . . . . . . . . . . . . . . . . . . . . . . . . . .
Showing annotations and labels . . . . . . . . . . . . . . . . . . . . . . . . . . . . .
Reports On Annotations . . . . . . . . . . . . . . . . . . . . . . . . . . . . . . . . . . .
Importing labels . . . . . . . . . . . . . . . . . . . . . . . . . . . . . . . . . . . . . . . . .
5
31
31
33
36
36
37
REPORTS AND NAVIGATION
53
55
56
59
59
60
64
67
68
. . . . . . . . . . . . . . . . . . . . . . . . . . .69
Introduction . . . . . . . . . . . . . . . . . . . . . . . . . . . . . . . . . . . . . . . . . . . .
Toolbar . . . . . . . . . . . . . . . . . . . . . . . . . . . . . . . . . . . . . . . . . . . . . . . .
Saving/printing . . . . . . . . . . . . . . . . . . . . . . . . . . . . . . . . . . . . . . . . . .
Exporting data . . . . . . . . . . . . . . . . . . . . . . . . . . . . . . . . . . . . . . . . . .
Selecting objects . . . . . . . . . . . . . . . . . . . . . . . . . . . . . . . . . . . . . . . .
Navigating through data . . . . . . . . . . . . . . . . . . . . . . . . . . . . . . . . . . .
Sorting data in tables . . . . . . . . . . . . . . . . . . . . . . . . . . . . . . . . . . . . .
Organizing a table display . . . . . . . . . . . . . . . . . . . . . . . . . . . . . . . . .
69
71
71
71
72
73
74
76
PART II: DATA ANALYSIS
6
PAIRS
. . . . . . . . . . . . . . . . . . . . . . . . . . . . . . . . . . . . . . . . . . . . .79
Introduction . . . . . . . . . . . . . . . . . . . . . . . . . . . . . . . . . . . . . . . . . . . . 79
Automatic matching . . . . . . . . . . . . . . . . . . . . . . . . . . . . . . . . . . . . . . 80
ii
Melanie 3 User Manual
CONTENTS
Matching tips . . . . . . . . . . . . . . . . . . . . . . . . . . . . . . . . . . . . . . . . . . .
Showing pairs . . . . . . . . . . . . . . . . . . . . . . . . . . . . . . . . . . . . . . . . . . .
Selecting pairs . . . . . . . . . . . . . . . . . . . . . . . . . . . . . . . . . . . . . . . . . .
Reports on pairs . . . . . . . . . . . . . . . . . . . . . . . . . . . . . . . . . . . . . . . . .
7
GROUPS
. . . . . . . . . . . . . . . . . . . . . . . . . . . . . . . . . . . . . . . . . . .85
Introduction . . . . . . . . . . . . . . . . . . . . . . . . . . . . . . . . . . . . . . . . . . . .
Editing groups . . . . . . . . . . . . . . . . . . . . . . . . . . . . . . . . . . . . . . . . . .
Showing groups . . . . . . . . . . . . . . . . . . . . . . . . . . . . . . . . . . . . . . . . .
Selecting groups . . . . . . . . . . . . . . . . . . . . . . . . . . . . . . . . . . . . . . . .
Scatter plot . . . . . . . . . . . . . . . . . . . . . . . . . . . . . . . . . . . . . . . . . . . . .
Statistics for Groups . . . . . . . . . . . . . . . . . . . . . . . . . . . . . . . . . . . . . .
Histograms on groups . . . . . . . . . . . . . . . . . . . . . . . . . . . . . . . . . . . .
Reports on groups . . . . . . . . . . . . . . . . . . . . . . . . . . . . . . . . . . . . . . .
Heuristic clustering . . . . . . . . . . . . . . . . . . . . . . . . . . . . . . . . . . . . . . .
8
80
81
82
83
85
86
86
87
88
90
93
96
99
CLASSES . . . . . . . . . . . . . . . . . . . . . . . . . . . . . . . . . . . . . . . . . .101
Specifying classes . . . . . . . . . . . . . . . . . . . . . . . . . . . . . . . . . . . . . .
Overlapping measures . . . . . . . . . . . . . . . . . . . . . . . . . . . . . . . . . . .
Histograms on Classes . . . . . . . . . . . . . . . . . . . . . . . . . . . . . . . . . .
Histograms on Classes+Groups . . . . . . . . . . . . . . . . . . . . . . . . . . .
Report on Classes . . . . . . . . . . . . . . . . . . . . . . . . . . . . . . . . . . . . . .
Statistical tests . . . . . . . . . . . . . . . . . . . . . . . . . . . . . . . . . . . . . . . . .
101
102
104
105
107
108
PART III: TOOLS
9
DATABASES . . . . . . . . . . . . . . . . . . . . . . . . . . . . . . . . . . . . . . . .113
2-DE databases . . . . . . . . . . . . . . . . . . . . . . . . . . . . . . . . . . . . . . . . 113
Querying a remote database through the Internet . . . . . . . . . . . . . . 114
SWISS-2DPAGE master gels . . . . . . . . . . . . . . . . . . . . . . . . . . . . . . 115
10 CREATING IMAGES . . . . . . . . . . . . . . . . . . . . . . . . . . . . . . . . . .119
Creating synthetic gels . . . . . . . . . . . . . . . . . . . . . . . . . . . . . . . . . . .
Duplicating gels . . . . . . . . . . . . . . . . . . . . . . . . . . . . . . . . . . . . . . . .
Erasing gels . . . . . . . . . . . . . . . . . . . . . . . . . . . . . . . . . . . . . . . . . . .
Cropping gels . . . . . . . . . . . . . . . . . . . . . . . . . . . . . . . . . . . . . . . . . .
Filtering gels . . . . . . . . . . . . . . . . . . . . . . . . . . . . . . . . . . . . . . . . . . .
Flipping gels . . . . . . . . . . . . . . . . . . . . . . . . . . . . . . . . . . . . . . . . . . .
Scaling gels . . . . . . . . . . . . . . . . . . . . . . . . . . . . . . . . . . . . . . . . . . .
Rotating gels . . . . . . . . . . . . . . . . . . . . . . . . . . . . . . . . . . . . . . . . . .
Inverting grey levels . . . . . . . . . . . . . . . . . . . . . . . . . . . . . . . . . . . . .
119
121
121
121
121
124
124
124
124
Melanie 3 User Manual
iii
CONTENTS
PART IV: APPENDIXES
A
DIFFERENCES BETWEEN MELANIE II AND MELANIE 3 OR WHERE
TO FIND WHAT SEEMS TO HAVE DISAPPEARED . . . . . . . . . . . .127
B
SHORT-CUTS AND MENU STRUCTURE . . . . . . . . . . . . . . . . . . .131
Menu structure . . . . . . . . . . . . . . . . . . . . . . . . . . . . . . . . . . . . . . . . .
Gels handling . . . . . . . . . . . . . . . . . . . . . . . . . . . . . . . . . . . . . . . . . .
Spots handling
........................................
Annotations handling . . . . . . . . . . . . . . . . . . . . . . . . . . . . . . . . . . . .
Pairs handling . . . . . . . . . . . . . . . . . . . . . . . . . . . . . . . . . . . . . . . . .
132
142
143
144
144
C
KNOWN BUGS . . . . . . . . . . . . . . . . . . . . . . . . . . . . . . . . . . . . . . .145
D
REFERENCES . . . . . . . . . . . . . . . . . . . . . . . . . . . . . . . . . . . . . . .147
The Melanie project . . . . . . . . . . . . . . . . . . . . . . . . . . . . . . . . . . . . .
Two-dimensional electrophoresis (2-DE) . . . . . . . . . . . . . . . . . . . . .
2-DE databases . . . . . . . . . . . . . . . . . . . . . . . . . . . . . . . . . . . . . . . .
Proteome and ExPASy . . . . . . . . . . . . . . . . . . . . . . . . . . . . . . . . . . .
E
147
148
148
150
TECHNICAL SUPPORT . . . . . . . . . . . . . . . . . . . . . . . . . . . . . . . .153
INDEX . . . . . . . . . . . . . . . . . . . . . . . . . . . . . . . . . . . . . . . . . . . .155
CREDITS
iv
Melanie 3 User Manual
PART I
BASICS
1
INTRODUCTION
Welcome to Melanie 3, the third generation of the well known Melanie two-dimensional electrophoresis analysis software. Melanie is a complete state-of-the-art software application designed to analyze images of two-dimensional electrophoresis (2DE). It was conceived in close collaboration with biologists and proteomics scientists from Hochstrasser’s group in Geneva, to insure fast and reliable comparisons
of spots, analysis of gels, and identification of proteins. Its design and functions
address both experts and beginners needs.
Melanie has been designed to be easy to use (very intuitive user interface), nevertheless, we encourage you to read this manual in order to understand all the extensive power of this software. This manual shows you how to make the best of
Melanie and its advantages, while explaining all its functions in detail. It includes
exhaustive explanations and useful tips which will help you to analyze your gels successfully.
This manual is divided into four parts. Part I gives an overview of the Melanie software, as well as the basic procedures for analyzing 2-DE images. Part II details the
necessary steps for comparing images as well as analyzing resulting data. Part III
presents features, such as image creation and working with remote databases. Part
IV provides additional information, such as menu short-cuts and technical support.
Important points in the manual, as well as useful hints are marked by a small hand
in the margin in order to draw your attention.
Melanie 3 User Manual
1
INTRODUCTION
1
Hardware and software requirements
Melanie is a PC compatible 32-bit application that runs under the Windows 95, Windows 98 and Windows NT 4.0 environments.
We recommend 64 or even 128 MB of memory to process many gels simultaneously. The amount of memory required is mainly determined by the file size of
scanned gel images.
Installation
Insert the Melanie CD-ROM into the CD-ROM drive on your computer and the
installer will start automatically. The Melanie installation program will guide you
through a series of screens.
The installer will create a default directory tree under Program Files on your hard
disk called Bio-Rad\Melanie3 (you can select a different directory if you wish). The
main Melanie program will be placed in the Melanie 3 directory. Additional directories for storing sample images and Melanie’s settings will also be created.
Programs and files distributed with the Melanie package:
• Melanie program
• Example images
• Three images in directory Gels_Ecoli
• Same images after complete analysis in directory Analyzed_Ecoli
• Other files
• Manual files in directory Doc.
• On-line html files in directory Help.
Note about Master protein maps:
The SWISS-2DPAGE database of two-dimensional polyacrylamide gel electrophoresis (2-D PAGE) reference maps used to be freely available on the server http:/
/www.expasy.ch and distributed with the Melanie system. Since September 1998,
the Swiss Institute of Bioinformatics decided to adopt the solution chosen for the
SWISS-PROT database, namely to ask non-academic users to financially contribute to the maintenance of these databases. No license fee is charged to academic
users for non commercial use, and the master gels may be downloaded from the ftp
site
ftp://www.expasy.ch/databases/swiss-2dpage/MASTERS/.
Non-academic
users are kindly requested to contact GeneBio (http://www.genebio.com/) for the
purpose of concluding the necessary license agreements.
2
Melanie 3 User Manual
INSTALLATION
Licence hardware protection key
To run Melanie you need to install the provided hardware protection key (HASP key)
on the parallel port. Before proceeding, please turn off your computer and the
attached printer (if any). The HASP key must be attached to the parallel port on the
back of your computer. If a printer cable is attached to this port, disconnect it. After
you have attached the HASP key, you can attach the printer cable to the key itself
and restart your computer.
The installer will install the system driver that allows the Melanie software to detect
the HASP key.
Netscape Navigator® and Internet Explorer®
In order to use the on-line manual, as well as to access remote databases over
Internet, you must install the Netscape Navigator® World-Wide Web browser from
Netscape Communications Corp. or Internet Explorer from Microsoft Corporation.
Running Melanie
To run the Melanie program, double-click on the Melanie icon. You may also run the
Melanie program by double-clicking on the icon of a gel image file (Fig. 1-1). In this
way the given gel will automatically be opened upon running the program.
(a)
(b)
Figure 1-1. (a) Melanie icon. (b) Gel icon.
Upon loading the program the Melanie logo appears. Click on the logo to get rid of
it.
Melanie 3 User Manual
3
INTRODUCTION
1
Interface
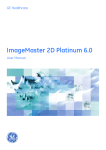
The Melanie window is divided into four main parts, shown in Fig. 1-2 and respectively called: menu bar (1), toolbar (2), gel display zone (3) and status bar (4).
5
1
6
2
7
8
9
10 11
3
4
Figure 1-2. Melanie display. (1) Menu bar (2) toolbar (3) display zone (4) status
bar (5) reference gel zone (6) hidden gels zone (7) Hand tool (8) Magnify tool
(9) Region tool (10) Spot tool and (11) Annotation tool.
Menus
Once objects have been selected, you may choose actions from the menus to be
performed on them. Move the cursor to the desired menu on the menu bar (Fig. 1-2,
item 1), hold down the mouse button. Certain menu options have sub-options, you
may choose one of them by pointing over the small arrow on the right hand side of
the option.
The following menus are provided in the melanie program (from left to right in the
menu bar):
• File - to handle whole gels and data on disk (open and close gel images,
save data, print images, import and export data).
• View - to modify the window display (fixed or variable number of cells) and
gels display (stacked, aligned, zoomed, grid lines).
• Edit - to edit (add, modify, delete) specific objects.
• Show - to show or hide specific objects.
• Select - to select specific objects.
• Analyze - to compute differences and similarities among gels (statistical
and artificial intelligence data analysis).
• Reports - to display information on selected objects and to navigate in gels
by means of the data.
4
Melanie 3 User Manual
INTERFACE
• Tools - to create new gel images from selected ones (duplicate, crop, filter
gels, create synthetic gels, flip and scale gels, as well as erase gels).
• Window - to display information and zoom windows, and to list open report
windows.
• Help - to obtain on-line help.
An index on menu items is given in Appendix Short-cuts and Menu structure on
page 131.
Contextual menu
When you click the right mouse button in Melanie’s display, a Contextual menu
appears containing the main functions to edit, show, and select objects like gels,
spots and annotations. They reproduce the same commands found in the Menu bar,
but they are quicker to access at any time (Fig. 1-3).
Contextual
menu
Figure 1-3. Contextual menu.
Shortcuts
Several menu options may be activated by keyboard shortcuts. These are indicated
at the right hand side of the corresponding menu option.
A list of shortcuts is given in Appendix Short-cuts and Menu structure on page 131.
Status bar
The status bar describes at a given moment the total number of gels, spots and
annotations that are selected (Fig. 1-2, item 4).
Note the importance of the status bar, as it allows you to know what objects are
selected, even if not all of them are visible (for example, when gels are zoomed).
Melanie 3 User Manual
5
INTRODUCTION
1
Reference gel zone and hidden gels zone
These two zones enable you to quickly change the gels visibility or choose a reference gel. The hidden gels zone enables you to hide or show your displayed gels
with just a drag-and-drop operation (Fig. 1-2, item 6). In the same way, the reference
gel zone enables you to choose the groups reference gel (Fig. 1-2, item 5). For
more details on reference gel, see Pairs and groups on page 8 and Groups on page
85.
Toolbar
Objects on screen may be displayed, manipulated or processed using the various
options from the Melanie menus or by selecting them with the tools provided in the
toolbar.
The Melanie toolbar contains 5 buttons (Fig. 1-4), the hand tool (7), the magnify tool
(8), the region tool (9), the spot tool (10) and the annotation tool (11).
7
8
9
10
11
Figure 1-4. The toolbar enlarged. (7) Hand tool (8) Magnify tool (9) Region tool
(10) Spot tool and (11) Annotation tool.
The Hand tool moves gels in order to show other parts. The Magnify tool lets you
repeatedly zoom in or out the whole gel. The Region tool is useful to select a rectangular region within a gel. The Spot tool lets you select individual spots and the
Annotation tool is used to select annotations and labels.
On-line help
The manual is also available on-line in the Melanie program. To consult it on-line:
Make sure that the Help folder is located in the same folder as the Melanie application.
Then, in the Help menu, choose User manual. An index is also available. To access
the on-line user manual and index, you must have the Netscape Navigator® WorldWide Web browser installed or Microsoft Internet Explorer®.
You may choose the table of content document from which you can read any of the
on-line manual chapters, or you can request the on-line index, then click on the
desired concept to obtain the related on-line chapter.
6
Melanie 3 User Manual
OBJECTS
Objects
A Melanie object is an entity that may be displayed and manipulated. The objects
are gels, as well as gel components such as spots, regions, annotations and labels.
Pairs, groups and classes are objects which allow for spots comparison across several gels.
Gels
A gel is a two-dimensional electrophoresis image that has been digitized and stored
on disk. Several image formats may be opened as gels, but they have to be saved
into the Melanie file format in order to keep objects such as detected spot (shapes
and values), pairs, etc. If a gel is saved with its objects into a foreign format, then the
objects will simply be part of the saved image and will have lost any structure or
value.
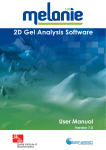
Annotations
Region
Label (category Ac)
Label (category ProteinName)
Spots
Label (category Landmark)
Label (category Pi_Mw)
Figure 1-5. Spot shapes, annotations, labels in a region.
The gel image is the raw input data to the Melanie program, from which proteins
may be detected and quantified. Gels may also be duplicated, erased, cropped, filtered, flipped or scaled. Gels may be displayed in tile mode (one gel next to the
other) or in stack mode (gels on top of each other). Gels may be aligned, that is distorted gels will be stretched pixel wise, in order to make a set of images completely
superimposable.
Regions
A region is a rectangular subpart of a gel that can be defined using the Region tool.
When a region is defined, certain actions may be limited to it (Fig. 1-5).
Melanie 3 User Manual
7
INTRODUCTION
1
Spots
Spots represent the proteins on the gel. They can be automatically detected by Melanie or manually adjusted by the user (Fig. 1-5). Each spot in a gel has an associated spot ID (a unique sequential number) automatically given when it is created.
Spots may be quantified, i.e. their optical density, area and volume are computed.
Alternatively, spots may be modeled as Gaussian functions.
Annotations
Spots or individual points (pixels) may be marked by annotations. An annotation is
defined by its position and its set of labels (Fig. 1-5). It contains relevant information
which is separated into label categories (pre-defined or user defined categories).
Melanie provides a number of pre-defined categories such as Pi_Mw, Landmarks,
Comments, Sets and ACs. The label category Pi_Mw contains the known pI and
Mw values, which are used to propagate this information to any point in a gel. The
label category Landmarks is used as a reference point for operations such as gel
alignment. The Set category is used to mark a set of spots sharing the same properties or results from analysis. User information may be saved in labels of Comment category or in any other user-defined category. The category Ac holds the
protein’s accession number (AC) taken from a user-selected database and may be
a link to Melanie’s remote database query engine. Labels may also contain direct
links to other files and Web sites.
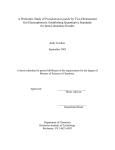
Pairs and groups
The pair is the association between two corresponding spots, i.e. it represents the
same protein in two gels. Pairs may be manually defined by the user or may be
automatically determined using Melanie’s powerful gel matching program. When
two gels are matched, the corresponding spots are paired.
Gel 2
Gel 1
S1
S2
Figure 1-6. One pair.
A group represents the same protein in several gels. When several gels have been
matched to a given reference gel, the latter provides a unique spot numbering
scheme across all gels. Each paired spot in a gel image may then be associated to
the corresponding spot ID in the reference gel. The spots in a set of gels that are
paired to one given spot in the reference gel together form a spot group. The group
is the basic element for analyzing and searching changes in protein expression
across gels.
8
Melanie 3 User Manual
OBJECTS
Variation in protein expression may be visualized and analyzed using histograms, or
through powerful statistical methods.
Reference gel
Group
S1
S4
S2
S3
Gel 2
Gel 3
Gel 4
Figure 1-7. One group.
Classes
The assembling of a number of gels, which have a common biological meaning or
common characteristics, establishes a class of gels. It corresponds to a set of gels
representing the same population. For example, gels from the same infected tissue
but from different patients belonging to one class may be compared to a class of
gels of healthy tissues from other patients.
Melanie 3 User Manual
9
INTRODUCTION
1
The definition of classes in Melanie allows statistical and meaningful considerations
about populations of gels.
Reference gel
Group
S1
S2
S6
Gel 2
Gel 6
S5
S3
Gel 3
Gel 5
S4
Gel 4
Class A
Class B
Figure 1-8. Two classes. Spots from Class A (S2, S3) may be compared to
spots from Class B (S4, S5, S6).
The analysis and visualization of differently expressed proteins through populations
of gels can be highlighted with statistical tests and several reports and histograms.
Selecting and showing objects
Melanie can manage and display a huge amount of objects, thus congesting (cluttering) your display. In this case, you may decide to display only some chosen
objects at a time, i.e. you may filter the data which you would like to work on. As a
consequence, an object may, at a given time, have any of the three statuses:
shown, hidden or selected.
For consistency, most operations in Melanie may only be applied to selected objects
on selected gels. Objects may be selected using tools from the toolbar or using certain menu options. Once selected, an object is marked in green. The green color is
always used to highlight selected objects.
As a general rule, objects may only be selected when they are visible on the screen.
For example, you may only select a spot if it is visible (see Showing spots on page
45). Nonetheless, as an exception, when you request the selection of a hidden
object, it may be momentarily displayed on the screen, but it will immediately be hidden once it is unselected again.
The Shift and Ctrl keys enable you to select more than one object.
10
Melanie 3 User Manual
FEATURES OVERVIEW
• The Shift key enables you to select consecutive objects (select the first
object, then hold the Shift key and select the second object. All objects between
the first and the second one will be selected).
• The Ctrl key enables you to select discontinuous objects. It also enables you
to select and unselect objects, i.e. to add or remove objects to or from an existing
selection (hold the Ctrl key and click on the chosen object: it will be added to the
selection. Click once more on the selected object and it will be removed from the
selection).
Note: When all objects from a certain type are hidden (like spots, annotations pairs
and groups), their manual selection is also possible. In this case, they will remain
visible by the time they are selected.
Features Overview
Melanie is a complete state-of-the-art software application designed to analyze
images of two-dimensional electrophoresis (2-DE). Melanie provides interactive as
well as automatic gel analysis. Its high flexibility and richness of the functionalities
allow Melanie to behave and respond according to your specific requirements.
Protein detection and quantification
• Automatic detection with the possibility to interactively adjust the results
(see Editing spots on page 39).
• Semi-automatic spot editing facilities (see Adding / modifying spots on page
42).
• Accurate spot quantification using either boundary contours or Gaussian
modeling (see Spots quantification on page 44).
Matching or how to find similar protein patterns across many gels
• Powerful automatic matching and editing facilities (see Automatic matching
on page 80).
• Wide variety of tools are available to monitor the accuracy and to fine-tune
effectively the detection and matching (see Quality control on page 14).
Navigation and display
• Extended navigation inside and across gels including various zooming
modes, easy moving of gels, customizable grids and overlay displays (see Gels
on page 17).
• Contextual windows help you to navigate and instantly gives you access to
related information (see Magnifying window on page 29 and Cursor information
on page 47).
• Simple procedures to select and display data subsets to work on.
Full control over what and how the information is displayed.
Melanie 3 User Manual
11
INTRODUCTION
1
• Spots marking with different colors and the choice of spot shapes display
(see Coloring spots on page 46 and Showing spots on page 45).
• Large choice of the information type to display and how the associated
labels are displayed (see Showing annotations and labels on page 64).
Comprehensive and intuitive visual comparison.
• Tile mode of displaying gels allows the user to instantly see how the proteins
are expressed through a series of gels (see Displaying gels on page 22).
• Stack mode of displaying gels gives you the possibility to track protein variations (flicking gels) (see Stacking gels on page 25).
• Transparency mode allows you to visually link spots from the front gel with
spots from the gels behind (see Displaying overlapped spots on page 27).
Reporting results
More than 20 reports (tables and graphics) are available which contain over 50 data
types.
• Intuitive quantitative filter possibilities (see Sorting data in tables on page
74).
• Fully customizable reports (see Reports and navigation on page 69 and
Report on Spots on page 49).
• Simultaneous navigation in the reports and on the gels (see Navigating
through data on page 73).
Database and Internet ready
• Seamless exchange between your own database and Melanie (see Importing labels on page 68, Selecting annotations and labels on page 60, and Saving/
printing on page 71).
• Direct database querying through Internet, such as Swiss-Prot (see Databases on page 113).
Comprehensive and unlimited annotation capabilities
• You may add any type of information in default or user definable categories
(see Pre-defined label categories on page 53 and Creating annotations on page
55).
• Fast landmarking: allows to easily define tie points in multiple gel studies
(see Pre-defined label categories on page 53).
• 2D Calibration: uses known pi/mw to calculate standards for unknown spots
and allows automatic propagation through all matched gels (see Pre-defined
label categories on page 53).
• Besides the usual categories such as calibration (pi/Mw and intensities) and
landmark, Melanie has integrated advanced new data types such as database
access number, MS spectrum, link to external data of any format located on your
disk, network or Internet. A simple click on the link displays the associate data
(text, html, spreadsheet, multimedia, …) (see Creating specific links on page 56).
12
Melanie 3 User Manual
FEATURES OVERVIEW
Analysis and protein characterization studies
The richness and robustness of the analysis tools give you access to the most
sophisticated and reliable analysis techniques.
A wide range of tools allows to efficiently and easily browse the protein expression
to extract markers by highlighting subtle changes. You can either browse the data in
comparative tables or in several graphical reports (such as Scatter, Histograms,
Plots) and pointing out the involved proteins in gels.
The intuitive interface encapsulates both the classical and innovative techniques, to
reach superior accuracy. The available tools are based on:
• Robust statistics and measures (see Statistics for Groups on page
90).
• Statistical tests (see Statistical tests on page 108).
• Automatic classification by Artificial Intelligence techniques (see Heuristic clustering on page 99).
• Powerful normalization techniques (see below).
Queries
Melanie’s versatile search engine allows to easily formulate complex queries. The
query power allows to answer your biological question, based on:
• Sophisticated textual request (see Selecting annotations and labels
on page 60).
• Qualitative and quantitative information (see Restriction of groups
selection on page 87 and Restrict spots selection on page 47).
• Protein expression change, for example by ratio or similarity (see Histograms on groups on page 93 and Reports on groups on page 96).
• MS spectrum (see Mass spectrometry on page 62).
• Analysis results and data subsets (see Combining sets of annotations
on page 63).
Normalization
The reproducibility of the 2D separation process can be perturbed by a number of
factors, including differences in sample preparation and loading, staining and image
acquisition. To accurately compare the quantity of any spot across gels, it is essential to compensate these variations.
You can analyze these variations with the scatter analysis and iron out them with
several powerful methods:
• Removal of the image scanning variation by Intensities calibration
(see Calibrating spots on page 44).
• Removal of the varying stain intensities and sample loading by relative spots quantification (see Spots quantification on page 44).
Melanie 3 User Manual
13
INTRODUCTION
1
• Removal of interference and outliers by using robust statistics (see
Statistics for Groups on page 90).
• Varying staining absorption across proteins by normalizing protein
expression change (see Comparing protein expression changes on
page 95).
• Merge of several gels from the same sample in a composite gel with
fine control over the chose proteins (see Creating synthetic gels on
page 119).
• Compensate the gel distortion introduced by variation in the protein
migration by gels alignment (see Aligning gels on page 31).
Quality control
Margins of error and validation tools allow to reach a high quality standard. The purpose of the numerous validation tools is to ensure that you don't miss any relevant
data.
Analysis and control are closely related, both focus on peculiar spots. These peculiar spots can result from a protein expression change or from an error induced by
the detection and matching process.
Margins of error:
• Scatter analysis (see Scatter plot on page 88).
• Matching score (bad pairs) (see Selecting pairs on page 82).
• All statistical measures (see Statistics for Groups on page 90 and
Statistical tests on page 108).
Validation and verification tools:
• Contrast adjustment (see Adjusting contrast on page 33).
• Report navigator and selector (see Navigating through data on page
73 ).
• Matching vectors display (see Displaying overlapped spots on page
27).
• Protein identificator overlay (see Showing groups on page 86).
• Circularity measure (see Report on Spots on page 49).
• Wide variety of graphical and comparison table.
14
Melanie 3 User Manual
IMPORTANT NOTE
Important Note
In the following chapters, all features of Melanie will be described in detail.
For each operation, the corresponding menu option is indicated in the left
margin, and the text describes how to carry out the operation after having
chosen that menu option. Sub-options for the selected menu option are indicated in bold face in the text.
Melanie 3 User Manual
15
INTRODUCTION
1
16
Melanie 3 User Manual
2
GELS
This chapter presents basic Melanie procedures such as opening, saving and closing gels, displaying gel images (such as arranging and stacking gels, changing contrast and zoom) and printing them.
Menu: File
Opening gels
File
Open
To open a gel image, click in the File menu and select the Open option. The Open
gels window will be displayed (Fig. 2-1). Hold down the Shift or Ctrl keys and, in the
Figure 2-1. The Open window allows the selection of the gels that will be
opened and loaded into Melanie.
Melanie 3 User Manual
17
GELS
2
Files column, click on each of the gel file names you want to open. Click Open. The
gels will be opened.
Melanie format
The Melanie program works with Melanie file formats, as well as with TIFF files.
Analyzed gels are saved into the Melanie release 3 file format, unless otherwise
specified by the user.
Importing foreign image formats
File
Import
Melanie allows you to import images stored in foreign image file formats, such as
TIFF (8 or 16 bits), GIF, Bio-Rad scan. Choose Images. In the Import Image dialog
box, choose one of the available formats. You may also choose the reduction factor
to be used when importing images.
Saving gels
File
File
File
Save
Revert from File
Save As
Any changes carried out on gels have to be saved in order to be stored in the gel
file. Otherwise the changes will be lost when exiting the Melanie program or when
closing the gels. Choose All Changes to save all changes performed on the
selected gels, or any of the individual saving options. For example, Save → Spots
will only save the detected spot shapes, but not other changes.
After performing changes on gels, you may revert to the saved status on disk by
choosing one of the Revert from File options in menu File. Current changes will be
lost.
The Save As command enables you to create copies of selected gels or parts of
them, if regions have been defined in gels. You may also use this command to save
files created in Melanie as earlier Melanie versions (see What happens when you
open your old Melanie files? on page 129).
Exporting gels and windows
To files
Alternatively, you may save any gel images in one of the supported foreign file formats (TIFF or BMP). In this case, gel images are exported as they appear on the
screen, i.e. with their associated components such as spots and annotations. But
the saved file will contain a flat rasterized image, without any structure.
18
Melanie 3 User Manual
PRINTING GELS
File
Export
Choose Gel to File. In the Export Image as dialog box, choose the type of the file in
the Type list and type the file name in the Name field. In the same way, you may
save Melanie display’s window in one of the supported foreign file formats. Choose
Gels Window to File. By defining a region, you can export only part of the gel.
To the clipboard
You may paste images directly to another software. Define a region in the gel then
make Gel Region to Clipboard. Activate the program to which you want to copy
your image to and paste. You may also copy and paste the whole Melanie screen. In
this case, choose Gels Window to Clipboard.
Printing gels
Melanie provides printing options. You may print selected gels or regions of gels,
one image per page, or print the whole Melanie window. The image will be printed
as it is displayed on the screen, i.e. holding objects and properties such as Spots,
Annotations, Contrast Adjustment, Alignment, Zoom, Grid, etc.
Printing selected gels
File
Print
Select some gels, then choose Gels. The selected gels will be printed in full size.
You may also print only regions of gels by defining regions on selected gels.
Printing the Melanie window
Select Gels Window. The image of the whole Melanie window is sent to the printer.
Page setup
File
Page Setup
The Page Setup command calls the standard Windows dialog where you may set
printing parameters such as printer name, paper size and orientation, etc.
Loading / unloading gels
File
Raw Image
You may control Melanie’s use of memory by loading or unloading gel images raw
pixel values. The default Unloaded mode uses less memory, but as a consequence
the real pixel values are not displayed in the Cursor Information window (Window →
Melanie 3 User Manual
19
GELS
2
Information). You may choose to keep their raw images in memory. Of course, as a
consequence, pixel values information will be displayed but more memory will be
needed too. To load raw images, select gels and choose Load.
You may also decide to free up the memory used by the loaded images by choosing
Select Gels with Loaded Image to determine those that are loaded and then
choosing Unload to finally liberate the memory.
At this point, you can decide whether or not to keep raw data from any gels opened
subsequently. In this case, select the check box in the pop-up dialog of Settings.
When using the default mode of unloaded images, Melanie will in any case automatically and implicitly load their raw images when needed, for example prior to performing the Auto-Detect Spots and Adjust Contrast operations. And immediately at
the end of this operation, Melanie will implicitly unload the raw images, thus freeing
the used memory.
Note that the chosen Display depth that is set in your computer determines the
memory used by Melanie to display gels (see the Display icon on the Control Panel
of your computer to find out more details). For example, 16 million colors require 3
times more memory than 256. So, you may also control Melanie’s performance in
managing the memory by choosing the display depth according to your needs.
Closing gels and exiting Melanie
File
File
Close
Exit
Use Close to close all selected gels. If any of the gels have not been saved since
changes were performed, Melanie lets you choose to save them before closing
them.
To exit Melanie, select Exit. Melanie lets you choose to save any unsaved gel
images before exiting.
Our mascot Barry greets you with a folklore song from Switzerland. Melanie has
been developed in Geneva, at the foot of the Swiss Alps, where the Saint Bernard
dog is at home and people sing yodel1 to communicate between moutaintops.
1. http://www.ips.k12.in.us/mskey/pods/Big_Mac_Pod/gwaltney/yodel/
The_Yodel_Course.html
20
Melanie 3 User Manual
SELECTING GELS
Menu: Select
Selecting gels
Most of Melanie’s functions can only be performed on selected gels. Gels may be
selected either by clicking on their banners or by using one of the Gels options in
menu Select. Regions of gels may also be selected using the Region tool.
To select one gel, click on the gel’s selection banner. The gel will be surrounded by
a green line indicating that is has been selected. To select more than one gel, select
the first one as described above, then hold Shift or Ctrl keys and select additional
gels.
Select
Gels
Alternatively you may select all visible gels in the Melanie window by choosing Visible, or only the aligned gels by choosing Aligned (see Aligning gels on page 31) or
just the stacked gels by choosing Stacked (see Stacking gels on page 25).
You may select specific gels by choosing their names in the list given by the By
Name command.
You may inverse an existing selection of gels by choosing Inverse Selection or
select all gels by taking All.
Gels which have spots matched with the reference gel may be selected by taking
For Groups. In the same way, Gels belonging to specific classes may be selected
by taking For Classes.
You may also select gels directly from a displayed Report on Gels (see Reports and
navigation on page 69).
The region tool
The Region tool is useful to select a rectangular region within a gel. Position the cursor at the top left position of the desired region, hold down the mouse button, then
move the cursor to the bottom right position. A rectangle will be drawn around the
region (Fig. 2-2). Release the mouse button at the desired point.
You may move the region by clicking inside the rectangle’s area and dragging it. You
may also change the rectangle’s size by dragging its corners or borders. To dese-
Melanie 3 User Manual
21
2
GELS
lect the drawn region, select the Region tool and click outside the rectangle region
or double-click inside one region.
Figure 2-2. Selected region in gel.
To select the same region on all visible gels, hold the Shift key and select the rectangular region on one of the gels. In this case, the selected regions are also calculated
proportionally to corresponding pixels.
Menu: Show
Displaying gels
Melanie provides numerous ways of displaying gels and related information on the
screen, each one with specific and helpful functions. You may display gels in tile
mode (one gel next to the other) or in stack mode (piles of gels where only the first
one is displayed). You may arrange gels as you wish (fixed or variable number of
display cells) and whenever you wish (show and hide gels). You may display numerical gel information (Cursor window) or complementary information (Zoom window,
grid lines).
Each displayed and visible gel has two special areas that indicate its name and the
operations that have been performed on them (Fig. 2-3). The gel banner (horizontal
stripe located at the top of the gel which contains its name) indicates whether or not
the gel is selected. The gel legend located in the top-left corner of a gel (yellow
background), besides indicating its name, also provides:
• The name of the class to which the current gel was assigned to,
• The name of the gel to which the current gel was aligned to,
22
Melanie 3 User Manual
SHOWING GELS
• The zoom factor of the current gel.
Gel
legend
Gel
banner
Figure 2-3. Gel banner is the gel selection area.
For example, a gel called 94-0002 with a zoom factor 4, assigned to class CLASS A
and aligned to gel ECOLI will show the following information in the yellow stripe: 940002 (CLASS A) *ECOLI* x 4.
The gel banner is used to select gels and to drag them.
Showing gels
Once you have opened a given number of gel images, you can decide which ones
you want to display and which ones you prefer to hide at a given point in time.
To hide a gel, drag it to the hidden gels zone (Fig. 1-2, number 6). To hide several
gels at a time, select the gels as described previously, and while holding the Shift
key, drag them to the hidden gels zone (Fig. 2-4).
Hidden
Gels
Visible
Gels
Figure 2-4. Hidden and visible gels.
Melanie 3 User Manual
23
GELS
2
To make a hidden gel visible on the display area, drag the selected gel from the hidden gels zone to an available cell on the screen. If you drag the hidden gel to a cell
already occupied by another gel, both gels will be stacked immediately.
Show
Gels
The Gels option in menu Show also provides the following choices to this purpose:
•
•
•
•
•
Only Selected - displays all selected gels and hides the other ones.
Hide Selected - hides all selected gels.
Show All - displays all opened gels, including the currently hidden ones.
Sorted by Name - order the cells sorted by the gel names.
Sorted by Classes - order the cells sorted by the gels’ classes names.
Menu: View
Changing the display gels order
Melanie displays gels on the screen through two options:
View
Layout Settings
• The Adaptive option retains the same number of cells on the screen as the
number of visible gels. This is Melanie’s default. To select this option, take Layout
Settings and choose Adaptive in the dialog box.
• To display visible gels with a fixed number of cells, i.e. independently of the
number of visible gels, take Layout Settings, select Number of cells and choose
the number of cells with the slider (Fig. 2-5).
Figure 2-5. Display area with fixed number of cells equal to 6.
24
Melanie 3 User Manual
STACKING GELS
To insert one gel into one specific cell on the screen, click on its banner and drag it
to the desired cell.
You may change the order in which cells are arranged on the screen. Click in the
border of the cell you want to displace and drag to another cell. The dragged cell
will be inserted at the dragged location.
Stacking gels
Very often users prefer to visually compare gel regions simultaneously, arranging
them side by side in the display, i.e. in tile mode, which is Melanie’s default mode.
But in the case where many gels are open at a time, their visible parts may be too
small. Stacking gels, i.e. displaying one gel on top of the others, thus creating a
“pile” of gels, is another way to display and compare gels. You may compare each
gel of a stack (one by one for example) against the reference gel of the stack (Fig.
2-6). Besides, the stack mode allows you to quickly permutate gels, letting you visually discern changes in protein intensity. You may stack many gels at a time and you
may also have as many stacks as you want.
Figure 2-6. Gels in tile mode and stack mode.
View
Stack
To stack two gels, select one gel and drag it onto the other gel. To stack several
gels, select the gels and drag them onto one of the cells. Alternatively, select gels
and take Selected Gels. Certain operations that can be performed on stacks let you
compare the front gel with one of the other gel in the stack, called the Stack Reference Gel. To set the reference gel of a stack, select the stacking cell and choose
Melanie 3 User Manual
25
2
GELS
Set Stack Reference. The name of the reference gel of the pile is displayed with a
blue background over the gel and the name of the first gel of the pile (the front gel) is
displayed as usual (Fig. 2-7).
Front
gel
Reference
gel of the
stack
Figure 2-7. Stacked gels. Cell on the left has 3 stacked gels. The front gel is
94-0005 (the gel in the top of the pile), 94-0002 is the second gel (the gel in the
middle of the pile) and Ecoli is the bottom gel (located in the bottom of the
pile). Cell on the right has other 3 gels stacked together.
To put a gel in front of the stack, you may either press the Page Up or Page Down
keys. You may also click on a gel’s banner or take Next or Previous. To switch from
the front gel to the reference gel of the stack, choose Front To Back, or simply CtrlF. By pressing Ctrl-F quickly several times, or the Page Up or Page Down keys, the
differences between the stacked gels can be observed visually.
To unstack the gels, select the gels and choose Unstack Selected Gels.
When many gels are stacked or hidden, their names are not entirely displayed. Click
on their banners and their names will be displayed in the front gel (respectively in
the stack or hidden pile).
Selecting stacked gels
You can select each gel from a stack individually. You may also choose to select two
or several gels in the stack and operations will be performed only on these selected
gels. To select one gel, click on its banner. To select all the gels in the pile, doubleclick in the front gel’s banner, which corresponds, on the stack, to the left most name
on the banner. You may also use the Shift or Ctrl keys to select continuous or discontinuous gels on the stack.
Moving stacked gels
Melanie provides tools to superimpose corresponding spots of stacked gels in a
simple way. In stack mode, you can move one or several gels as usual (see Moving
gels on page 27).
26
Melanie 3 User Manual
MOVING GELS
To superimpose two spots, put the cursor on the given spot in the front gel, then
hold down the mouse button. Press Ctrl-F to display the other gel. Move the cursor
to the corresponding spot and release the mouse button. The two spots will be
superimposed. Verify this by pressing Ctrl-F again.
Displaying overlapped spots
While two or more gels are stacked, visible spots from the reference gel of the stack
can be seen in transparency mode on the front gel. The spots from the reference gel
of the stack are displayed in blue below the spots from the front gel.
View
Stack
Set the reference gel of the stack, as described above (see Stacking gels on page
25). Some spots of the reference gel should be displayed. Choose Show Overlapped (Fig. 2-8). To dismiss the overlapped spots choose Hide Overlapped.
Figure 2-8. (a) Overlapped spots, spot shapes displayed (b) Overlapped spots
with pair vectors, spots filled.
When gels are in stack mode, you may also display the pairs between the reference
gel and the other gels of the stack in the form of blue vectors linking the locations of
paired spots (Fig. 2-8). Choose Show Pairs. To hide vectors, choose Hide Pairs.
Moving gels
The hand tool moves gels in order to show other parts. Pick the Hand tool in the
toolbar, put the cursor inside a gel, hold down the left mouse button and move the
mouse. The gel image will follow your movement. If you hold down the Shift key and
the mouse button simultaneously, then all visible gels will be displaced by the same
amount, once the button has been released.
By double-clicking inside a gel, all visible gels will be positioned at the same location with the same magnification.
The corresponding location from the clicked gel to the others gels is estimated by
interpolation between the two nearest common landmarks (i.e. landmarks with the
Melanie 3 User Manual
27
GELS
2
same name). When the gels have no common landmarks, they are aligned at the
same image location.
In addition to the Hand tool, Melanie provides other useful operations to move gel
images in order to show other image parts.
View
Move Gels
The Move Gels option enables you to scroll through visible parts of selected gels. To
scroll up, select Up, or alternatively hold the Ctrl key and press the Up Arrow key.
Use the respective commands to scroll down, left or right.
The Move Gels option also lets you choose to display the top left, top right, bottom
left or bottom right part of the selected gels. Just take View → Move Gels, then
choose the corresponding sub-option.
The equivalent of a double-click inside a gel may be found in Melanie’s menu. Select
one gel and take Same Location. All gels will be positioned at the same location
with the same magnification of the selected gel.
If you cannot see a gel, because it was moved outside the visible parts of the screen
while using the hand tool, then select the gel and take one of the options from View
→ Move Gels.
Zooming gels
The Magnify tool lets you repeatedly zoom in or out the whole gel. To zoom in, pick
the Magnify tool and click over the gel in the wanted region. To zoom out, click the
right mouse button (Fig. 2-9).
Zoom out
times 0.25
Zoom in
times 4
Zoom in
times 8
Figure 2-9. Zoom in and out.
28
Melanie 3 User Manual
MAGNIFYING WINDOW
To zoom in or out of all visible gels simultaneously hold down the Shift key and then
click the left or right mouse buttons respectively. After the zoom, all gels will be
moved to the same position.
View
Zoom
Alternatively, you may choose to zoom in and out by taking Zoom and selecting the
corresponding sub-option.
The minimum possible zoom factor is 1/16 times the original gel image. The maximum zoom factor is 32 times the original gel image, however the resulting images
will have a maximum size of 32’000x32’000 pixels.
Magnify glass
The Magnify glass is an alternative way to view enlarged parts of gels momentarily.
In this case, select the Magnify tool, press Ctrl and click on the region you want to
enlarge (Fig. 2-10). .
Figure 2-10. Magnify glass.
Magnifying window
Window
Zoom
Another way to enlarge parts of gels is to use the Zoom Window, which enables you
to see the region under the cursor (examples in Fig. 2-11 and 2-12). To display the
Zoom Window, choose the menu Window → Zoom. You may change the magnifi-
Melanie 3 User Manual
29
2
GELS
cation of the zoom window by pressing the + and the - buttons located at the top of
the window and you may also resize this window.
Figure 2-11. Zoom window used to enlarge the focused to region.
The zoom window displays the visible objects, like annotations and spots, as they
appear on the screen. It also displays one green rectangle indicating the visible
part, on the display area, of the pointed to gel (the gel which has the cursor).
Figure 2-12. Zoom window used to locate the focused to region on a gel
displaying spots and labels. The small rectangle indicates the visible area of
the pointed to gel.
30
Melanie 3 User Manual
DISPLAYING GRID LINES
Displaying grid lines
You may display grid lines over selected gels to indicate their dimensions in centimeters, inches or in pI and Mw units, provided that this information is available in the
annotation category Pi_Mw. The pI and Mw grid may also be displayed over gels
which don’t have this information, but have been matched against the reference gel
containing pI and Mw. In this case, the grid values will be relative to the reference
gel (Fig. 2-13).
Pi, Mw
Cm
Inch
Figure 2-13. Grid lines over gels.
View
Grid Lines
Select a gel and choose Show. In the displayed window, choose a grid unit from
centimeters, inches or pI/Mw. Also choose the number of sub-divisions, horizontal
and vertical, in the sliders.
The information displayed in square brackets in the top-right corner and in the bottom-left corner of the gel indicate the coordinates of the visible portion, in chosen
units.
To hide the grid lines of selected gels, select the gels and choose Hide.
Aligning gels
Gel alignment is a very useful technique for comparing 2-DE images that present
too many variations in protein migration. In general, while all Melanie programs may
work with unaligned gel images, alignment might prove helpful when comparing
stacked gels, or for matching distorted 2-DE gel images.
You may align two or more gels at once. You must select a reference gel, i.e. an
image the other gels will be aligned to. At least four annotations containing labels
from the category Landmarks (for the default alignment algorithm) must have been
defined and must be well distributed over the gel image (see Annotations on page
Melanie 3 User Manual
31
GELS
2
53). The other gels must contain the same landmarks, i.e. same landmark label
inside the same spot, as the alignment algorithm will try to deform the images in
order to best superimpose the landmarks (Fig. 2-14).
Figure 2-14. Gels before and after alignment. Gels are in stack mode and their
pair vectors are displayed.
Alternatively, if you align gels that have already been matched, you may choose to
use existing pairs rather than labels from the category Landmarks as reference
points.
View
Align Gels
Select all gels that have to be aligned. Choose Align. In the displayed window
choose the reference gel. The selected gels will be aligned relative to the reference
gel, so that corresponding landmarks are best superimposed.
To get back to the original images, select aligned gels, then choose Unalign. The
original images will be displayed again in place of the aligned ones.
By default, gels are aligned relative to the X and Y image axes, using a second
degree alignment function in both the X and Y axes. You may decide to align images
according to only the X or Y axis, or to use another alignment function. Choose
Other Alignment and select the desired option. First, second and third degree
functions are available, that request at least two, three and respectively four landmarks.
In the event that gels are not aligned but have common landmarks, operations such
as simultaneous gel moving, gels matching, etc. are done based on a simple interpolation between the two nearest common landmarks (i.e. landmarks with the same
name). Otherwise, when the gels are not aligned and have no landmarks, the operations are based on the same image location.
32
Melanie 3 User Manual
GRAY LEVELS
Gray levels
A 2-DE gel image is traditionally displayed as a gray level image, where gray levels
represent the gel’s optical density. You may opt to display images using pseudo colors. You may also change the way gray levels are displayed.
Adjusting contrast
Modern scanners are usually able to scan 2-DE images with 12 or even 16 bits per
pixel, that is with 4096 or 65536 gray levels, respectively. Because common screens
are only able to display 256 colors or gray levels, mapping has to be undertaken
between the 4096 or 65536 gray levels, respectively and the 256 screen gray levels.
By default, Melanie uses a linear mapping function, where the lightest point in the
image is mapped to 0 (white) and the darkest point is mapped to 255 (black). In
Fig. 2-15, the minimum and maximum gray levels (zero and 2361 respectively) are
remapped by the default linear mapping.
4
2
1
5
3
Figure 2-15. (1) Gray level distribution of selected images. (2) Mapping
transformation. (3) Minimum and maximum gray levels slider. (4) Gray level
distribution after the function transformation. (5) Bending parameter.
However, you may choose other mapping functions, e.g. in order to highlight small
light spots. Melanie lets you change the gray level mapping in two different manners.
You can define the minimum and maximum gray levels, i.e. you may look at only the
light or the dark regions of the images, or you can change the default linear mapping
function.
Melanie 3 User Manual
33
2
GELS
The Bending parameter expands or compresses the contrast range at the dark or
light ends of the range. When bending is higher than zero, the image is lighter, and it
is darker when bending is lower than zero (Fig. 2-16).
Figure 2-16. Region of a gel showing a contrast adjustment: the left image
shows the original image; the central and right images show the same gel
area after transformation by setting the bending parameter to -2 and 2
respectively.
To adjust the gels contrast, select some gels, then choose Adjust Contrast. In the
View
Adjust
Contrast window, change the minimum and maximum gray levels (respecGray Levels
tively
left
and right bar corners, item 3, Fig. 2-15) or the bending slider (item 5,
Adjust Contrast
Fig. 2-15).
Once the parameters have been changed, the resulting gray level of the modified
display can be visualized in the Display sub-window (item 4, Fig. 2-15) from the
Adjust Contrast window. By choosing the Only in Region check box, in the Adjust
Contrast window, the image gray level distributions are restricted to the selected
region.
Any changes made with the Adjust Contrast command will only affect how the
image is displayed on your screen. They will not affect the underlying data, the spot
detection and quantification.
Adjust contrast preview
Each change of the gray levels of an image, when in the Adjust Contrast window
may immediately be reflected in a given region, if such a region has been defined
prior to adjusting contrast. Select one region in a gel. In the View menu, choose
34
Melanie 3 User Manual
GRAY LEVELS
Adjust Contrast. Each time you change one of the mapping parameters, the
change will immediately be reflected in the selected region (Fig. 2-17).
Figure 2-17. The Adjust Contrast option. The modifications are directly
reflected in the selected region.
Note that if the small rectangle temporarily disappears from the display, when the
Adjust Contrast window pops up, slightly change one of the parameters.
The gray levels will be adjusted in all selected gels.
If you save gels after having performed color adjustments, the latter will be saved
with the gel images (see Saving gels on page 18).
Displaying gels with pseudo colors
View
Gray Levels
Pseudo Colors
Choose Pseudo Colors. Select one of the color lookup tables, for example FiveRamps. Click OK. The lookup table will be changed accordingly (Fig. 2-18). To go
Melanie 3 User Manual
35
GELS
2
back to gray levels, choose View → Gray Levels → Pseudo Colors and select Gray
Levels among the displayed options.
Figure 2-18. Gels displayed using the FiveRamps color lookup table.
Menu: Edit
Calibrating gels
Edit
Gels
Calibrate...
Melanie enables you to calibrate pixel intensities, and as a consequence to calibrate
gels. Rather than displaying gray level values taken from the scanner device, you
may display image values indicating the real world values, for example optical density values (see Calibrating spots on page 44). Calibrated gels have an asterisk in
their names in the reports.
Setting preferences
Edit
Preferences
A few preferences may be set and preserved between Melanie sessions using the
options in the menu Edit.
In Raw Image, you may decide that all further open gels will keep their raw data
image in memory (see Loading / unloading gels on page 19).
36
Melanie 3 User Manual
REPORTING ON GELS
In Grid Preferences, you may set the grid attributes, i.e. the grid units and number
of subdivisions (see Displaying grid lines on page 31).
In Cursor Information, you may select spot and pixel attributes to be displayed in
the Cursor Information window (see Cursor information on page 47).
In Database, you may set preferences for the automatic queries in the internet (see
Databases on page 113).
Menu: Reports
Reporting on gels
Reports
Gels Report
Select gels, as described previously, and choose Reports → Gels Report.
Gels Report display summarized information about the selected gels, such as
image height and width in pixels (Rows and Columns), minimum and maximum gray
levels, number of detected spots, number of existing annotations, pixel dimensions
of the scanned image (PixWidth and PixHeight). The class to which the gel was
assigned to and the intensities calibration is displayed as well.
The Group information, also available in the Report on Gels, indicates the reference
gel (“Ref”) and whether the gels are matched against it. Value 0 indicates no matching and 1 indicates matching between the gel and the reference gel (Fig. 2-19).
Figure 2-19. Report on gels. Gels ECOLI and 94-0002 are calibrated.
Melanie 3 User Manual
37
2
38
GELS
Melanie 3 User Manual
3
SPOTS
The elementary component of a gel is the spot. Spots are spot shapes automatically detected by Melanie’s spot detection algorithm, or manually adjusted by the
user. Each spot in a gel has an associated spot ID (a unique sequential number)
automatically assigned to it when it is created. Spots may be quantified, i.e. their
optical density, area and volume are computed. Alternatively spots may be modeled
by Gaussian functions. In this case, their quantification values will be the Gaussians
peak values and volume, as well the area of the Gaussian’s half-height section.
Menu: Edit
Editing spots
Edit
Spots
Select gels to detect spots on, then take Auto-Detect. The Detect Spots window
appears. Various detection parameters are available and may be adjusted. The
default parameters have been optimized for silver stained 2-D PAGE images run
Melanie 3 User Manual
39
3
SPOTS
according to the SWISS-2DPAGE protocol [see reference 13]. You may tune the
parameters to adapt the detection program to your images. The following parameters may be set (Fig. 3-1):
Figure 3-1. The spot detection parameters.
• Number of smooths - Before detecting spots, Melanie will smooth the
image using a “smooth-by-diffusion” algorithm, in order to eliminate parasite
noise. Select the number of times the smoothing operation should occur. Note
that other smoothing algorithms are available in the Tools → Gels menu (see Filtering gels on page 121). To avoid smoothing, set the parameter to zero.
• Laplacian threshold - The detection algorithm looks for spot peaks by calculating the Laplacian for each pixel in the image. To detect as many spots as
possible, set a small value for this parameter. If you set high values, only very
curved spots will be detected and flat spots will be ignored.
• Partials threshold - Melanie also checks the spot curvature in both the X
and Y axes, in order to separate spots with flat sections, or to eliminate streaks.
Augmenting this value increases the separation power of the detection algorithm.
• Saturation - Some very dark spots may be saturated (especially when digitized with older scanners) and may therefore be flat on the top. To insure that
these spots are detected, Melanie artificially increases the peakedness (curvature) of all pixels whose OD are above a given threshold. The threshold is
expressed as a percentage of the maximum grey level in the image. A value of
90% is usually considered correct.
• Peakedness increase - This is an internal value expressing how much Melanie increases the curvature of saturated pixels. 100 is the default value and
should only be changed with care.
• Minimum perimeter - With this parameter you may decide to ignore spots
that are too small. Melanie will ignore all spots whose perimeters (in pixels) are
smaller than the given threshold.
40
Melanie 3 User Manual
Additional criteria affect the way spots are represented. You may choose between
the following three options:
• Detect spot - This is the default. Spots are detected using the Laplacian,
and spot shapes are represented that match the original spot shapes.
• Detect, then fit with Gaussians - Spots are detected with the Laplacian,
then Gaussian modeling is performed on all detected spots.
• Fit existing spots with Gaussians - Spots have to already be detected
and modeling is performed on them. Note that the parameters are of no use here.
First try to detect spots using the default parameter values, then tune the parameters for your data. You may save your chosen parameters by clicking Save and typing a file name. You may also load an existing parameters file by clicking Load and
choosing the file name.
Click OK. Spots will be detected according to the parameter values you have set.
After detection the spot shapes will be displayed over the gels (Fig. 3-2).
Figure 3-2. Left: Detected spot shapes. Right: Spots modeled as Gaussians
Default parameters are adapted to 12-bit-images. When using 16-bit-images, a dialog box lets you choose, before deciding the detection parameters, whether you
want to change the grey levels to correspond to 12 bit images. You must note that
parameters may not be that well adapted to 16-bit-images. In this case, you have to
tune them.
Detect spots in a region
You may also only detect spots in a given region. If a region has been defined in a
gel, Melanie enquires whether the detection must be done in the selected region
only or in the whole gel.
This allows you to refine the detection in a gel’s area with other parameters. Spots
outside the region are not affected.
Melanie 3 User Manual
41
3
SPOTS
Preview detection results
If a region has been defined, each change of a parameter value may immediately
display the result from the spots detection in the selected region (Fig. 3-3).
Figure 3-3. Adjusting detection parameters in real time.
Note that if the small rectangle temporarily disappears from the display, change one
of the detection parameters slightly to make it visible again.
Adding / modifying spots
The usual way to create spots is to detect them using Melanie’s powerful spot detection algorithm. Nevertheless, you may manually create, modify or delete selected
spots.
To add a new spot on the gel, choose the Spot tool and double-click in the desired
location. In the dialog box, select Disc radius to draw a circumference and use the
slider to choose its radius (units in number of pixels). Click OK and make the desired
modifications of the recently created spot in the Edit spots window. To modify a spot,
double-click on the spot shape and the edit window will be displayed.
You may also add a spot by double-clicking in the desired location and choosing Diffusion in the Add Spot window. The suggested spot, displayed in the Edit spots window, corresponds to the surrounding pixels which have a grey value darker than the
clicked pixel.
42
Melanie 3 User Manual
ADDING / MODIFYING SPOTS
You may add or modify spots inscribed in a pre-selected region:
Edit
Spots
Edit
1. Define a small region using the Region tool.
2. Choose Edit. A dialog box is displayed with an enlarged representation of the
selected region (Fig. 3-4).
3. Add or modify spots if necessary.
4. Click OK. The new spots will be added to the gel.
You may add spots from one specific gel to other gels, provided that they were previously matched. Perform the following steps:
Edit
Spots
Copy from Gel
1.
2.
3.
Select spots.
Select one or more gels you want to copy the spots to.
Choose Copy From Gel.
Pairs will be automatically created between the selected spots and the newly created spots. In this case, all gels must be in the same directory.
To delete spots, select them then choose Delete.
Edit
Spots
Delete
Edit Window
In this window, the selected spots are shown in a grey level related transparency
mode, instead of opaque, which facilitates spot editing. The grey levels are represented in gradations from blue to pink, dark pixels are blue and light pixels are pink.
Figure 3-4. The spot editing window.
To add/modify spots in the Edit spots window, hold down the left mouse button and
draw the outline of the area that you want to add. When the button is released, the
outline is closed by a line joining the first and the last point of the outline and it is
filled. Hold down the right mouse button and draw the outline of the area to delete or
split a spot. You may also use the left mouse button to add pixels to the spot, the
right mouse button to remove pixels, and the middle mouse button to fill in holes.
Melanie 3 User Manual
43
3
SPOTS
Spots quantification
Melanie automatically computes the spot values once they have been detected. The
following quantification values are calculated for each detected spot:
• Od - the highest calibrated pixel intensity in the spot.
• Area - the spot’s area in mm2.
• Vol - the spot’s volume, i.e. the integration of Od over the spot’s area.
If spots have been modeled as Gaussians, the following quantification values are
computed:
• Od - the optical density of the Gaussian’s peak.
• Area - the area of a section of the Gaussian, taken at the peak’s half height.
• Vol - the Gaussian’s volume.
The following normalized values are also available:
• %Od - the relative Od, i.e. the Od divided by the total Od over the whole
image.
• %Vol - the relative Vol, i.e. the Vol divided by the total Vol over the whole
image.
The Od and Vol values depend on pixel intensities calibration (see Calibrating spots
on page 44).
Calibrating spots
Melanie enables you to calibrate pixel intensities. Rather then displaying gray level
values taken from the scanner device, you may display image values indicating the
real world values, for example optical density values. This may also be useful to
compensate for variations due to image scanning.
Melanie provides three different ways to calibrate gels:
• By adding calibration annotations to gels;
• By using calibration annotations from the reference gel;
• By importing a calibration. For example, you may calibrate the image of a calibration strip tablet using Melanie. Generate and save a report on gels (or any
other Melanie report containing the columns Gray Slope and Gray Offset) which
may be imported to calibrate all your gels.
For this purpose, add calibration values to known spots using any existing category
of labels. For example, create one category called “Calibration” and add calibration
values to their labels (see Creating annotations on page 55).
44
Melanie 3 User Manual
SHOWING SPOTS
Edit
Gels
Calibrate...
File
Import
Calibration...
Select gels which have calibration values and choose Calibrate Intensity. Choose
the label category which contains the calibration values.
You may also calibrate gels using calibration annotations from the reference gel. Set
the reference gel. The calibration values from the reference gel are propagated to
the other gels through the paired spots.
You may also import a calibration by using the Import → Calibration command. A
dialog box asks you the file name. The specified file, for example a gels report, must
be in a text file format and must contain the columns Gray Slope and Gray Offset
with the corresponding values.
Once gels have been calibrated, Melanie allows you to display the best fitting line
through the calibration values. After displaying Calibration Plot, similar to the scatter plot window (see Scatter plot on page 88), you may open two other reports by
selecting one of the menu item of the report button in the Calibration Plot toolbar.
These reports are:
• Fitting Report: shows the gel name, gray slope and offset values, the correlation value and the number of spots.
• Calibration Report: displays spot ID, optical density, calibration and fitting
error values, as well as X and Y coordinates of spots.
Edit
Gels
Reset...
You may change the calibration at any time by taking Edit → Gels → Calibrate
Intensity and choosing a calibration category, or remove it by taking Reset Calibration.
Menu: Show
Showing spots
Show
Spots
Once spots have been detected, you may display their shapes over the gels in three
different ways (Fig.3-5): filled or outlined shapes, as well as crosses located in the
center of the spots. Select gels then choose one of the options in the Shape menu.
Figure 3-5. New spots display (outlined shape, filled shape and crosses).
Spots may be displayed with the Show All menu option, and hidden with the Hide
All option.
Melanie 3 User Manual
45
SPOTS
3
Select a region on a gel using the Region tool, then In Region to show all spots in
the selected region. You may show only selected spots with Only Selected. Only
the spot shapes of the initially selected spots are kept on the screen. It is very helpful, for example, to mark some spots on the screen when you are performing a
visual inspection of gels or a visual inspection of the analysis results. You may hide
only selected spots with Hide Selected.
You may also show (respectively hide) the IDs of selected spots. Select some spots,
then Show ID (respectively Hide All ID).
Hiding spots also has the additional effect of displaying images faster.
Coloring spots
Show
Spots
Set Color
Spots may be displayed on the screen using 3 different colors other than the default
red. To do so, select spots then choose Set Color and one of the proposed colors.
The Default command colors spots in red, the default color in Melanie. The colors
remain displayed until you select Reset All to color all spots in red, as the default.
The colors are not saved.
Menu: Select
Selecting spots
The Spot tool lets you select individual spots. Click on any spot to select it. The
selected spot will be highlighted in green. To select more than one spot, select the
first one then hold the Shift key and select additional spots by clicking on them. To
select all spots in a given region, position the cursor at the top left position of the
desired region, hold down the mouse button, then move the cursor to the bottom
right position. All spots in the selected region will be selected and highlighted in
green.
Select
Spots
Spots may also be selected from the Select → Spots sub-menu. Choose By ID and
enter a spot ID to select the corresponding spot. If colors have been previously
assigned to spots, you may choose them by taking By Color and selecting the
desired color. Choose Only Gaussians to only select spots that have been modeled by a Gaussian function.
Select a region on a gel using the Region tool, then In Region to select all spots in
the selected region, or All to select all spots in all selected gels.
If you have already saved a Spots Report, you may reselect all the spots by choosing From Report File. A dialog box lets you choose the name of the file which contains the report.
46
Melanie 3 User Manual
CURSOR INFORMATION
Finally, if some spots have already been selected, you have the possibility to do
Inverse Selection. This will unselect the selected spots and select all unselected
ones.
You may also select spots directly from a displayed Report on Spots (see Reports
and navigation on page 69).
Note that by selecting annotations or labels, their linked spots are also selected.
Restrict spots selection
You may select spots which have a value inside a certain interval. Make a first selection of spots and then Restrict by Value. In the dialog box, select a spot value type
among Vol, Area, Od, %Vol and %Od. In the Restrict by Value dialog box, click >=
and type the value which will represent the lower limit of the interval. Click also <
and type a value to define the higher limit of the interval. The spots whose values
are included in the defined interval remain selected.
Menu: Window
Cursor information
Window
Information
You may at any time display information of spots and pixels directly on the screen. In
this case, choose Window → Information.
Available information for pixels are their X and Y coordinates on the gel, as well as
pI and Mw. Pixel grey values are also available when raw images of gels are loaded
(see Loading / unloading gels on page 19). Otherwise the Value field displays
Melanie 3 User Manual
47
SPOTS
3
unloaded. Information for detected spots also include their spot ID and quantification values (Vol, Area, Od, %Vol and %Od).
Settings
Figure 3-6. Cursor information and settings window.
You may choose what information to display, as well as the order in which this information will appear on the screen. To select the displayed information, click Settings
in the Cursor Information window’s toolbar and the Settings: Cursor Information dialog box will be displayed (Fig.3-6). Select the attributes which you would like to have
in the Hidden list (left column), and transfer to the Visible list (right column) using the
>> button. You may choose many attributes at once by using the Shift or Ctrl keys.
Click Apply to confirm your choice and the selected attributes will be displayed on
Cursor Information window. You may also double-click on one attribute and it will be
transferred from one list to the other.
On the other hand, you can remove attributes from the information window by
selecting the items on the Visible list and clicking <<. The selection order is preserved on the display.
You may also save the current chosen template of cursor information by clicking
Save and typing the file name in the Name field. In the same way, you may load an
existing template by pressing Load and choosing the file name.
Edit
Preferences
Cursor...
48
These settings may also be made permanent from the Preferences → Cursor
Information menu option.
Melanie 3 User Manual
REPORT ON SPOTS
Menu: Reports
Report on Spots
Reports
Spots Report
Select some spots and choose Current, or one of the other report templates that
you may have defined previously (see below). A report will be displayed.
The Spots Report summarizes all relevant information about the selected spots:
their identification number (ID), quantification values, gel name, their center position
on the gel image (X and Y values), circularity value, pI and Mw and all attached
labels. You can also have information taken from the paired spots in the reference
gel (see Groups on page 85).
The circularity value is calculated according to the spot perimeter and area. The
higher the value, the more circular the spot.
As usual, reports may be saved, printed, exported, used to navigate through data,
etc. (see Reports and navigation on page 69).
Customizing reports
You may choose the spot attributes to build your personalized reports on spots, and
their order of appearance. In the report window, click on the Settings button in the
toolbar. In the Settings: Spots report dialog box (Fig. 3-7), to add attributes to the
report, select their names in the Gels list (left column), and transfer to the Visible
attributes list (right column) using >>. On the other hand, you can remove spot
Melanie 3 User Manual
49
3
SPOTS
attributes from the report by selecting the items on the Visible attributes list and
clicking <<. The order is preserved on the display.
Settings
button
Figure 3-7. Spots report and the settings window.
You may also choose to display spots information of the corresponding pairs in the
reference gel, provided that there is a selected reference gel and the gels are
matched together. Select the reference gel information in the Settings: Spots report
dialog box, in the Reference gel list, as described in the previous paragraph. Click
Apply to confirm your choice and the selected attributes will be displayed on the
report.
You may also save the current chosen report template by clicking Save and typing a
file name, or load an existing file by clicking Load and choosing the corresponding
file name. The template name will be added to the menu command Reports →
Spots Report (Fig. 3-8).
Figure 3-8. Templates of Report on Spots.
50
Melanie 3 User Manual
REPORT ON SPOTS
You may have as many report templates as you wish and the saved formats may be
re-used by choosing their format file names on the menu item Reports → Spots
Report.
The template names, available when Melanie starts, are those that exist in the
“Menus” subdirectory of the Melanie installation directory.
Melanie 3 User Manual
51
3
52
SPOTS
Melanie 3 User Manual
4
ANNOTATIONS
Individual points (pixels) and spots in a gel image may be marked by annotations.
An annotation is defined by its position (row and column number) and its set of
labels. Each label belongs to pre-defined categories or user-defined categories.
The label contents may be any textual data (examples in Fig. 4-1).
Pre-defined label categories
Some pre-defined label categories are provided with the Melanie software to help
you organize your data and to mark spots which have common characteristics.
These categories are:
1. Ac: This category is provided to hold the protein’s accession number (AC)
taken from a user-selected database and it is the link to Melanie’s remote database
query engine. A double-click on this label category displays the corresponding protein entry in the chosen database with the chosen browser software (See “Querying
a remote database through the Internet” on page 9-114.).
2. Landmark: This category is used to mark pixels in the gels as reference points,
for the operations of gel alignment and calculation of corresponding locations
between gels. Two annotations are considered to refer to the same point in different
gels, when they have the same label.
Melanie appends the word “AMBIGUOUS” to a landmark label when you add an
existing landmark to a gel.
Melanie 3 User Manual
53
4
ANNOTATIONS
3. Pi_Mw: This category is supplied to contain the pI and Mw information, which is
used to compute approximated pI and Mw value for any point in a gel. You may
enter the pI and/or Mw (separated by a space) of the gel at the given position. A
value of -1 means that no value is set.
Label “Ldmk1” of pre-defined
category Landmark
Category Name
Annotation
(Set of labels)
Content
(a)
(b)
(c)
Figure 4-1. (a) Annotation over one spot with 5 labels. (b) The editable
window of the annotation showing categories and contents of the displayed
labels. (c) Report on labels.
4. Comment: is an indicatory category to users. It exists as an example of a general category where users may store any comments.
5. Set: is a generic category used to mark spots which have some common characteristics. All labels from a Set category share the same text, i.e. the set name. In
Fig. 4-2, a set called St contains spots belonging to the same result of Student T
test analysis.
Figure 4-2. A set of spots marked by the same category of type “Set:St”.
54
Melanie 3 User Manual
CREATING ANNOTATIONS
To help you visually identify the different categories of labels, they are automatically
created using different background colors. Ac is displayed on the gel in pink, Landmark in blue, Pi_Mw in pale green, Comment in pale pink, Set: in yellow and all
user-defined categories are displayed in gray.
Menu: Edit
Creating annotations
To create an annotation, pick the annotation tool and double-click on a:
• gel's pixel to create a “pixel annotation”,
• gel's spot to create a “spot annotation”,
at the position in a gel where you want the annotation to be located. The Annotation
window pops up. Enter the name of a new category or choose one of the existing
categories by clicking on its name. Type the wanted label (word or text) in the dialog
box. The annotation is created, and its label is displayed on the gel.
Edit
Annotations
Labels may be added to an existing annotation. Select the Annotation tool and double-click at the basis of an annotation. In the dialog box, type the name of a new category or choose categories by clicking on its name. Type the content of the label.
Alternatively, you may add labels by selecting annotations or spots and choosing the
Add Labels option.
Annotations may be linked to spots, in this case they have small squares at their
basis (Fig. 4-3). Otherwise annotations may simply be positioned over pixels on the
Figure 4-3. Annotation detail on one spot (square basis) and on a pixel (cross
basis).
gels (small cross at their basis). To link an annotation with a spot, click on the annotation basis and drag to a spot. You may also select the annotation and choose Link
with Spot. On the other hand, you may select the annotation and drag outside the
spot, or choose Unlink with Spot, to separate one annotation from a spot.
One spot may have many annotations. One annotation may have many labels, but
only one label from each category.
Melanie 3 User Manual
55
ANNOTATIONS
4
Creating label categories
To create your own category of labels, you must add a label to the gel. Type the
name of the new category in the upper field of the displayed window. You may then
type the content of the label in the pop-up editing field and click OK. The label content will be displayed on the gel. This new category will be available on the list of
categories while there is at least one label of this category in the open gels.
Creating sets
The pre-defined category called “Set:” was created to help you mark spots, indicating that they belong to a set. It contains no information except the fact that it belongs
to a special set. The label is defined by the word “Set:” followed by an identification
name.
Edit
Annotations
To create a set, select one or many spots, choose Add Labels, click on the category “Set:” and append a keyword (which will identify this set) to the string “Set:”.
Click OK. For example, to mark spots reminding you that they need to be
sequenced, type “Set:To be sequenced” (Fig. 4-4). A label named “To be
sequenced” will be attached to the selected spots.
Figure 4-4. Creating a “Set:To be sequenced” set of spots in Melanie.
Note that the keyword “Set:” is not displayed on the labels. At the time when a new
category is created, it is immediately shown on the screen, except for the new category Set. In this case, it is visible or hidden depending on the current state of the
generic category “Set:”.
Creating specific links
Many interesting possibilities to link your gels to 2-DE databases, mass-spectrometry files, text files or any other files are available in Melanie. Using specific keywords
in labels of any category, creates links to specific objects. In this case,
• the keyword and the follower text are not visible on gels and are replaced by
three dots (a visual help to indicate a linked label).
56
Melanie 3 User Manual
CREATING SPECIFIC LINKS
• by double-clicking on “link” labels, labels are not edited but the link is
opened.
You may have links in any label category, but you can only have one link per label.
The available link types are:
• Http links: you may link your gels to specific web pages. To create an http
link, add an annotation to a gel. In the text field, type your text which must contain
the word “http:” followed by a web page.
A double click on an http link label will launch your favorite browser software
(Netscape or Explorer) on your screen and it will automatically retrieve the corresponding Web page. To set your favorite browser, choose Edit → Preferences →
Database.
For example, you may have a direct link to ExPASy (Fig. 4-5).
Figure 4-5. Label “This is a link to ExPASy...” has a link to a http page.
• File link: you may link spots or regions of gels to software files. To create a
file link, add an annotation to a gel and, in the text field, enter the string which
must contain the word “file:” followed by the file name. Click OK.
A double-click on this label will launch the specified file with the default system
application associated to the file extension. The linked files must be located in a
specific directory which may be defined by choosing Edit → Preferences → Database and by filling the Annotations folder field (see Setting preferences on page 36).
Melanie 3 User Manual
57
4
ANNOTATIONS
For example, you may have an Excel file containing the amino acid composition of a
protein (Fig. 4-6).
Figure 4-6. ““AA Composition” label containing a link to an Excel file.
• Text link: you may have a long piece of text inside any label without overloading the display. To create a text link, add an annotation to a gel and type the
string which must contain the word “text:”.
A double-click on this type of label displays a dialog box containing the entire text.
For example, you may have text containing the sample preparation procedure, the
detection method or the bibliography for a spot, attached to your gels and only part
of this information is displayed over the gel. In Fig. 4-7, the label “Sample preparation” has the protocol used for this purpose.
Figure 4-7. “Sample preparation...” label containing a link to a text field
describing the procedure of the ECOLI sample preparation.
58
Melanie 3 User Manual
MODIFYING AND DELETING ANNOTATIONS
Modifying and deleting annotations
Edit
Annotations
You can modify and delete annotations and labels. By double-clicking in one label,
an edition window is displayed where you may change its text contents. On the
other hand, once one annotation is selected, it may be modified by taking Modify. In
the edition window, you may change the labels contents and add new categories.
The Delete menu option deletes all selected labels. The Delete Categories option
deletes from selected annotations, labels which belong to chosen categories. Select
the labels, take this menu option and choose the categories to delete.
You can also manually change an annotation position. Select an annotation and
drag the annotation basis to the desired location.
To interactively change an annotation’s tag position, select an annotation and drag
its tag to the desired position (Fig. 4-8).
Figure 4-8. Default annotation tag position (left) and modified tag position
(right).
Editing annotations
We have already described how to create, modify and delete annotations and
labels. Some other convenient options of Melanie are the copy, paste and duplicate facilities.
Copying / pasting annotations
You may select annotations in a given gel image, then copy them to another gel.
This is a simple means of creating a series of similar annotations in a set of gels.
Perform the following steps:
Edit
Annotations
1. Select annotations.
2. Choose Copy. This will copy the selected annotations into memory.
3. Select only the gels you want to copy the annotations to.
4. Choose Paste Annotations. The copied annotations will be pasted into each
of the selected gels to their corresponding locations. The corresponding location
is estimated by interpolation between the two nearest common landmarks (i.e.
landmarks with the same name).
5. Adjust the annotation positions using the Annotation tool.
Melanie 3 User Manual
59
ANNOTATIONS
4
This option copies annotations from one gel to their corresponding locations in the
other gels.
Copy / pasting labels
You may also copy some labels from one gel to selected spots or annotations in a
set of gels. Perform the following steps:
1.
2.
3.
4.
Select one or more labels.
Choose Copy. The selected labels will be copied into memory.
Select one or more spots or existing annotations you want to copy the labels to.
Choose Paste Labels. In the dialog box, confirm the action.
Copy paired labels
When gels have been matched and pairs have been created, labels existing in one
gel may be copied to their corresponding spot pairs in the other gels.
Edit
Annotations
1.
2.
3.
Select annotations in the source gel.
Select the gels you want to copy the labels to and the source gel.
Choose Copy Paired Labels. In the dialog box, confirm the action.
Duplicate labels
You may copy selected labels to another category. Select labels then choose the
Duplicate Labels command. In the dialog box, choose the receiving category.
Note that the selected labels may also belong to different categories.
You can use this menu to merge several categories or to rename one category.
Menu: Select
Selecting annotations and labels
The Annotation tool is useful to select annotations and labels. To select one annotation, pick the Annotation tool and click annotation basis. To select one label, just
click on it.
Annotations and labels may only be selected when they are visible on the gels.
Annotations may be selected with the Annotation tool. Click at the basis of any
annotation to select it or at one of its labels. The selected annotation will be highlighted in green and will be displayed in front of all the other displayed annotations
60
Melanie 3 User Manual
SELECTING ANNOTATIONS AND LABELS
(Fig. 4-9). If the annotation is attached to one spot, the spot will also be selected. To
(a)
(b)
Figure 4-9. (a) Annotation hidden by the other annotations. (b) Same
annotation displayed in front of the other annotations, after selection.
select more than one annotation, select the first one, then hold the Shift key and
select additional annotations. To select all annotations in a given region, position the
cursor at the top left position of the desired region, hold down the mouse button,
then drag the cursor to the bottom right position. All annotations in the selected
region will be selected and highlighted in green.
Labels may also be selected with the Annotation tool. Click on any label to select it.
The selected label will be highlighted in green. To select more than one label, use
the Shift key.
Select
Annotations
You may also select labels and annotations by using the menu items. Select a
region on a gel using the Region tool, then In Region to select all annotations in the
selected region, or All to select all annotations in all selected gels.
If colors where assigned to annotations, they may be selected by taking By Color
and choosing the corresponding color in this menu option.
You may select a group of labels which have a sequence of letters in common in
their contents. For example, “LAT” designates all labels from the chosen categories
whose names contain the sequence of letters “LAT”. For this purpose, take By Content. Choose one or many categories and enter a label content to select the corresponding labels. Expressions in this field are taken literally when the Regular
Expression field in the dialog box is not selected.
By selecting the Regular Expression field in the dialog box, you may use regular
expressions that can be inserted into the search field. A regular expression is a concise and flexible notation for finding patterns of text. A list of regular expressions
which may be used in search criteria is given in Table 4-1.
Table 4-1. Regular expressions to search patterns in labels.
Syntax
Description
Example
.
Matches any single character.
e.oli matches ...eaoli,
aboli, ecoli...
+
Matches at least one occurrence of the preceding character.
P0+1 matches P01,
P001, P0001, ...
Melanie 3 User Manual
61
4
ANNOTATIONS
Table 4-1. Regular expressions to search patterns in labels.
Syntax
Description
Example
?
Matches zero or one occurrences of the preceding character.
P0?1 matches P1 and
P01.
*
Matches zero or more occurrences of the
preceding character.
P0*1 matches P1, P01,
P001, P0001, ...
()
Groups a subexpression.
P(24)+ matches P24,
P2424, P242424, ...
[]
Matches any of the characters inside the [].
[a-z] is the range of characters between a
and z and [0-9] is any numeral from 0 to 9.
P[a-d] matches Pa, Pb,
Pc, Pd
[^]
Matches any character not in the set of characters following the ^.
P[^bd] matches Pa, Pc,
Pe but not Pb ou Pd.
|
Matches the expression before or after the |.
Mostly used within a subexpression.
P(ab|cd)1 matches Pab1
and Pcd1
{n}
Matches exactly n times the preceding character.
P0{3}1 matches P0001
but not P01 nor P001.
{n,}
Matches at least n times the preceding character.
P0{2,}1 matches P001
and P0001, but not P01.
{n,m}
Matches at least n times and at most m
times the preceding character.
P0{1,3}1 matches P01
P001, and P0001, but
not P1 or P00001.
For example, to select all labels which contain the string P00, you may either type
the expression .*P00.* and choose the Regular Expression field in the dialog box, or
type P00 and unselect the Regular Expression field.
You may select all labels from specific categories. Choose By Category and pick
out the category names.
If you have already saved a Report on Labels or a Report on Annotations, you may
reselect all labels by choosing From Report File. A dialog box lets you choose the
name of the file which contains the report.
Finally, if some labels have already been selected, you have the possibility to do
Inverse Selection. This will unselect the selected labels and select all unselected
ones, inverting the criteria used to select them.
You may also select annotations directly from a displayed Report on Annotations,
Labels or Categories (see Reports and navigation on page 69).
Note that by selecting spots, their linked annotations are also selected.
Mass spectrometry
You may match spots according to their mass spectrometry data, using a correlation
algorithm. For this purpose, the mass spectrometry data must be available in labels
through one of the following formats:
62
Melanie 3 User Manual
SELECTING ANNOTATIONS AND LABELS
• as a file link (see Creating specific links on page 56), i.e. using the “file:” keyword followed by the name of the file which contains the ms data. This file must
be either a ms file type (PerSeptive GRAMS/386) or a text file containing a
sequence of mass values separated by carriage return.
• as a text link (see Creating specific links on page 56), i.e. using the “text:”
keyword followed by a sequence of mass values.
Select
Annotations
By MS
To match spots according to their MS data, select one label then choose By MS. In
the dialog box, choose the label category with which the selected label will be
matched. A Mass Spectrum Match report is displayed showing the match results
and a score is given for each match (from 0 to 1, i.e. from bad to good match). The
selected label is also in the report with a score of 1 (match with itself).
Common labels
You may easily retrieve common labels among many gels. If two or more gels are
Select
selected, you may choose Common Labels to select common labels in all gels. In
Annotations
the dialog box, choose the categories of labels to which the selection will be applied.
Common Labels
If only one gel is selected, this special kind of selection will correspond to selecting
packed labels, i.e. selecting labels from the specified categories containing the
same content.
Combining sets of annotations
Select
Annotations
You may combine the selection of categories and annotations. For this purpose,
decide for a first criteria and select annotations using one of the above commands.
Take the menu option Combine and choose one of the four operations from Intersection, Union, Difference and Exclusion. In the dialog box, choose the label category corresponding to your second criteria. Click Ok. The result of the logical
operation will be selected according to (Fig. 4-2):
Set A
Set B
Intersection (AND)
Set A
Set B
Difference (XOR)
Set A
Set B
Union (OR)
Set A
Set B
Exclusion (A and Not B)
Figure 4-2. Combining sets of spots on Melanie.
• Intersection: selects spots that are in the intersection of two criteria;
Melanie 3 User Manual
63
ANNOTATIONS
4
• Union: selects spots that belong to either one criterion or the other;
• Difference: select spots that are unique in one criterion plus those that are
unique in the second criterion;
• Exclusion: select spots that are found only in the first criterion and are not
found in the second criterion.
For example, you may select spots that are in the intersection of two analyses, like
Student T test and Differential Analysis. Make the first analysis and mark the outcoming spots with the label “Set:St”. Make the second analysis and mark the outcoming spots with the labels “Set:DA”. Select spots from the first analysis by
choosing Select → Annotations → By Category and in the dialog box select category “Set:St”. Then make Select → Annotations → Combine → Intersection and
choose category “Set:DA” in the dialog box. Only spots that belong to both sets will
remain selected.
Menu: Show
Showing annotations and labels
Annotations and categories may be displayed, hidden, packed, unpacked and
selected. Annotations may also be colored with different colors.
Important! Annotations may only be selected and manipulated when they are visible
on the gels. Labels may only be selected and manipulated when the annotations are
visible.
Show
Annotations
Annotations may be displayed with Show All menu option, and hidden with Hide
All. You may show only selected annotations with Only Selected annotations or
hide with Hide Selected.
Select a region on a gel using the Region tool, then In Region to show all annotations in the selected region.
If you have selected spots before selecting annotations, you may take For Spots
and all the annotations associated to the selected spots will be selected.
You may hide a certain number of categories among those that are visible on the
gels. Choose Visible Categories and in the dialog box, click on the desired category names to hide them. Fig. 4-3b shows, for some of previously chosen spots
(Fig. 4-3a), categories Ac, Pi_Mw and Comments, while categories Landmarks,
ProteinName, and others are hidden.
64
Melanie 3 User Manual
SHOWING ANNOTATIONS AND LABELS
You may also choose to display labels belonging to a certain category. Make Hidden Categories to display the categories which are not visible on the gels. In the
dialog box, click on the desired category names to make them visible.
(a)
(b)
Figure 4-3. (a) All categories and labels are visible. (b) Only Categories Ac,
Pi_Mw and Comments are visible, and only for certain spots.
When you click on an annotation which has visible and hidden labels, all its labels
will be displayed on the screen during the time it remains selected (Fig. 4-4). The
hidden labels will immediately disappear when the annotation is unselected.
Figure 4-4. Annotation with hidden labels is unselected. During the time it is
selected, the hidden labels become visible.
Melanie 3 User Manual
65
ANNOTATIONS
4
If several labels hold the same content then, by default, each spot will be displayed
with its own label. You may display a single label for all identical labels by making
Pack Categories and choosing the desired category name. Unpack Categories
separates the label tags again (Fig. 4-5).
Figure 4-5. Packed and unpacked labels for protein P00450 in the Plasma
master gel (Swiss-2DPAGE database). The label belongs to the pre-defined Ac
category.
Coloring annotations
Show
Annotations
Set Color
Annotation tags may be displayed on the screen using 3 different colors other than
the default cyan. To do so, select annotations then choose Set Colors and one of
the proposed colors. The Default command colors annotations in blue, the default
color in Melanie. The colors remain displayed until you select Reset All to color all
annotations in cyan, as the default. The colors are not saved.
You may open a label link by double-clicking on it. Alternatively, to open any label
link, select the label and choose Linked Data.
66
Melanie 3 User Manual
REPORTS ON ANNOTATIONS
Menu: Reports
Reports On Annotations
Reports
Labels Report
Melanie provides reports for annotations, categories and labels. Select labels and
choose Labels Report. The Labels Report displays information about selected
labels, such as content, category, spots ID, and X and Y positions on the gel
(Fig. 4-6).
Figure 4-6. Report on selected labels.
Reports
Categories Report
On the other hand, you may display information about all labels belonging to
selected categories and selected gels. In this case, select the gels, then choose
Categories Report and select the desired categories in the dialog box. The information displayed in this report is the same as for the Report on labels (Fig. 4-7).
Figure 4-7. Report on categories.
Melanie 3 User Manual
67
ANNOTATIONS
4
Reports
Annotations Report
You may also create reports on selected annotations which display information
about all visible categories, and their labels (Fig. 4-8). Select annotations and
choose Annotations Report.
Figure 4-8. Report on annotations.
Menu: Files
Importing labels
File
Import
Labels
File
Import
Annotations
68
You may import annotations and labels into open gels. To do so, select a gel and
choose Labels. In the displayed window, type the file name and select the file type.
You may import labels from a file containing a Report on Labels, for example, or
from any “Labels” file type. In the last case, it must contain the columns SpotID, X, Y,
Category and Label. If the spot ID is not known, use -1 in this field and Melanie will
position the label in the corresponding X and Y positions of the gel. If X and Y positions are not known, use -1 in this field and Melanie will position the label in the corresponding spot ID. Columns in the file must be separated by tabulators.
In the same way, you may import annotations from a file containing a Report on
Annotations. To do so, select Annotations, and type the file name in the displayed
window.
Melanie 3 User Manual
5
REPORTS AND
NAVIGATION
Introduction
The reports available in Melanie provide not only powerful options to display information on selected objects, but also a useful tool to navigate through data. Reports
may be accessible through the Reports menu, the Analysis menu or through displayed reports.
In the Reports menu:
• Report on Gels: Displays summarized information about the selected gels,
such as intensity calibration, number of detected spots, etc.
• Report on Spots: Displays specific information about selected spots, such
as spots ID, quantification values, attached labels, etc. This report is completely
customizable, i.e. you may choose the information to be displayed and the order
in which they will be displayed.
• Report on Labels: Displays information about selected labels, such as content, category, spots ID, and positions on the gel (X and Y).
• Report on Annotations: Displays for selected annotations, information
about all categories, and their labels.
• Report on Categories: Displays information about all labels belonging to
chosen categories. The displayed information is the same as for the Report on
labels.
• Report on Pairs: Displays the list of selected paired spot IDs among
selected gels.
• Report on Matches: Displays information on matching between the selected
gels and all open gels, that is the number of paired spots between each pair of
gels.
Melanie 3 User Manual
69
5
REPORTS AND NAVIGATION
• Report All Matches: Displays information on matching between all gels in a
given directory.
In the Analyze menu:
• Report and Histograms on Groups: Displays information on each selected
group (see Pairs and groups on page 8), such as group ID, chosen value type of
each spot in the group, and chosen statistical values calculated on all spots in the
group.
• Report and Plot on Scatters: Displays information on scatter plots such as
slope, offset and the correlation coefficient values, the pair values and the fitting
error.
• Report and Histograms on Classes: Displays chosen statistical values for
classes of gels, calculated on selected groups, such as central tendency, deviation and overlapping measures.
• Report on Statistical Test: Displays statistical values for classes of gels,
such as Student-t, Wilcoxon and Kolmogorov significance levels.
You may display as many reports and histograms simultaneously as you wish. Once
a report or histogram is displayed on the screen, it is listed in the Window menu, and
may easily be brought in front of all the other displayed windows (Fig. 5-1).
Figure 5-1. List of open reports.
Note that report and histogram windows may hide other existing report and histogram windows by popping-up in front of them.
Many of the report and histogram properties, such as saving, printing, organizing,
etc. are shared by all of them. This chapter is dedicated to these common properties.
70
Melanie 3 User Manual
SAVING/PRINTING
Toolbar
All Melanie report, histogram and plot windows have in common the toolbar shown
in Fig. 5-2. Reports also have the property of being navigable, meaning that from
one or more items in a report, histogram or plot, you may re-select corresponding
objects on the gel, as well as travel through the objects which are listed in the
reports.
1
2
3
4
5
6
Figure 5-2. Report and histogram toolbar (1) Save (2) Print (3) Copy to
Clipboard (4) Select on Gel Image (5) Select next (6) Select previous.
Reports also have particular characteristics in common. The lines in the tables are
numbered, indicating in this way the number of selected objects used to create the
report. The columns are independent elements which may be displaced, resized
and sorted in descending and ascending order of their values (similar to a
spreasheet window).
Saving/printing
Reports may be saved or printed. Tables are saved using the Excel table format, i.e.
with tabulations separating the columns. Graphics are saved using TIFF or BMP formats.
To save reports, click the Save button in the toolbar (item 1, Fig. 5-2). Enter the file
name in the displayed window and choose the file format in the Type field.
To print a report, click the Print button (item 2, Fig. 5-2). The usual PC system window is displayed where you can choose printing options such as the printer name.
Exporting data
You may export your data directly from a table into another program, for example a
spreadsheet software, like Excel. Select the desired lines in the table using the Shift
or Ctrl keys. Copy the selection to the clipboard by choosing the Copy to clipboard
button in the toolbar (item 3, Fig. 5-2) or in the contextual menu by clicking the right
mouse button. Paste into the desired software.
Melanie 3 User Manual
71
5
REPORTS AND NAVIGATION
You may also export graphics to software like Word or Photoshop, for example.
Copy the selected graphics to the clipboard by choosing the Copy to clipboard button in the toolbar or in the contextual menu. Paste into the desired software.
Selecting objects
You may select objects like spots, gels, labels, annotations, groups and pairs
directly from their reports. You may also select groups of spots directly from histograms. Double-click on a report line or on a histogram to select and display the corresponding object.
Alternatively, you may use Shift and Ctrl keys to select report lines or histograms.
Click the Select on Gel Image button in the toolbar (item 4, Fig. 5-2) or use the contextual menu. The corresponding objects will be selected on the screen and the gels
will be displaced to show at least one of them.
An example of refining the selection of spots is shown in Fig. 5-3. In this example,
some spots were first selected, then a Report on Spots was generated. In the
report, the values in the column Area were sorted in descending order. The five first
lines, i.e. the five largest spots, were retained in a new selection of spots which is
displayed on the gel.
Figure 5-3. Re-selection of spots through the report. Note that the Area
values were sorted in descending order and the re-selected spots are the first
5 spots on the sorted report.
72
Melanie 3 User Manual
NAVIGATING THROUGH DATA
Navigating through data
You may also use the Next button in the toolbar (item 5, Fig. 5-2) to select, on
screen, the corresponding following object listed in the reports or histograms. In the
same way, use the Previous button (item 6, Fig. 5-2) to select the preceding object.
An example of navigation through the data existing on a Report on Groups is shown
in Fig. 5-4. Some groups of spots, which in this case also have common landmarks
displayed on screen, were selected to verify their match and a Report on Groups
was generated. The selection was limited to group 352 (the corresponding line was
selected and the Select on Gel Image button was pressed, Fig. 5-4, item a). Notice
that all the spots belonging to group 352 are selected on the screen and the gels are
displaced to show the spots (Fig. 5-4, item b). By clicking the Select Next button, the
following group on the report, group 513, was selected on the screen (Fig. 5-4,
items c and d). And so on, all the other groups were verified by means of the report.
Melanie 3 User Manual
73
5
REPORTS AND NAVIGATION
This is a simple example to illustrate the endless possibilities of the usage of
reports, as well as the navigation through data.
(a)
(b)
(c)
(d)
Figure 5-4. Navigating on selected groups through the report. (a) Selection of
group ID 352 in the report (b) Group ID 352 is displayed on screen (c)
Selection of the following line, group ID 513 (d) Group ID 513 is displayed on
screen.
Sorting data in tables
Data may be sorted in the tables by the values of the columns. Click once on the
header of the desired column, and a triangle will be displayed indicating that the col-
74
Melanie 3 User Manual
SORTING DATA IN TABLES
umns’ data is sorted in ascending order. Click once more on the header and the triangle will be inverted indicating that the data is sorted in descending order.
Ascending order means that numbers are sorted from 1 to 9 and text is sorted from
A to Z.
(a)
(b)
Figure 5-5. Items sorted by two criteria, group ID (R:SpotID) and volume.
Spots were first sorted according to volume (ascending order), then
according to spot ID. (a) Sort ascending. (b) Sort descending.
You may sort the columns elements using multiple criteria. Rows that contain equal
items in a sorted column, appear together. When using two or more criteria, the
rows with equal items are rearranged according to the second criteria. To do so, first
sort the column of secondary choice by clicking on its header. Then click in the
header of your principal criterion to sort. In Fig. 5-5, the principal criterion is the spot
ID of the reference gel and the second criterion is the volume values.
Melanie 3 User Manual
75
5
REPORTS AND NAVIGATION
Organizing a table display
You may re-organize the columns of a table directly from the report window. Drag
the header of the column to another chosen column (Fig. 5-6). The first one will be
inserted before the second one.
Figure 5-6. Re-organizing columns in the report window.
You may also enlarge or reduce the columns size. Drag the separation between two
columns to the right to enlarge the column or to the left to reduce its size. While
dragging, you will notice that the cursor changes its format. To enlarge or reduce all
columns to the same size at once, hold the Shift key and drag the separation of two
columns.
To resize columns so that their whole content is displayed, double click on their separation. The column at the left of the cursor will regain its default size.
You may also enlarge or reduce the row size. In this case, drag the separation
between two rows to the top to reduce the row or to the bottom to increase its size.
To enlarge or reduce all rows at once, hold the Shift key and drag the line’s separation. To resize rows so that their whole content is displayed, double click on their
separation.
76
Melanie 3 User Manual
PART II
DATA ANALYSIS
6
PAIRS
Introduction
Gel matching is a key operation in 2-DE gel image analysis. The basic gel matching algorithm consists of comparing two gel images and finding pairs of related
spots, i.e. spots depicting the same protein in both gels. A pair is represented by a
doublet (f1, f2) where f1 is a spot ID in the first gel and f2 a spot ID in the other gel.
One generally says that gels have been matched, and that individual spots have
been paired.
Melanie can match two or more gels. Matching two gels means finding all the pairs
between spots of the two gels. Matching several gels means picking out a reference gel, then successively matching each gel with the reference gel. In this way,
spots in all gels may be compared with spots in the reference gel. For consistency,
when matching only two gels, Melanie will also ask you to specify which one is the
reference gel.
All spots in selected gels that are paired with the same spot in the reference gel
form so-called groups. The group concept is essential to analyze spots in a set of
gels. Elaborate reports, histograms, statistics and analyses may be produced from
them (see Groups on page 85).
Melanie 3 User Manual
79
PAIRS
6
In Melanie you can match gels with single pairs or multiple pairs. Matching with
single pairs means that one spot in a gel will be paired with exactly one spot in the
other gel. Matching with multiple pairs means allowing that one spot in one gel be
paired with several spots in the other gel (Fig. 6-1).
Figure 6-1. One spot paired to two spots in the other gel
Menu: Edit
Automatic matching
Edit
Pairs
To match two or more gels, select them by clicking on their banners while holding
Shift or Control keys, or by using the Select → Gels menu options. Choose AutoMatch Gels. Melanie will first request that you designate the reference gel from the
selected gels. You will then be asked whether you wish to allow multiple pairs. All
gels will then be matched with the reference gel.
Depending on the computer you are running Melanie on, this might take time.
Saving pairs creates a pairs file that resides in the same directory as the matched
gels. Therefore, only gels that reside in the same directory may be matched.
Matching tips
The only prerequisite for matching two gels is that spots have already been
detected. Aligning gels prior to matching is optional, but in many cases the matching
process will be faster and will produce better and more accurate results, especially
with distorted gel images (see Aligning gels on page 31).
Melanie has been designed to automatically match gels. Nevertheless you may
speed up and improve the matching process by specifying a few starting pairs. You
may define starting pairs by manually adding pairs, or by automatically pairing identical annotations (such as landmarks or ACs, for example).
80
Melanie 3 User Manual
MATCHING TIPS
Using annotations as starting pairs
Edit
Pairs
If two or more gels have annotations with identical labels, for example landmarks,
you can use these to create starting pairs. Select the gels, then Match Annotations. Melanie will ask you to select the category of labels to match and the reference gel. It will then, for each spot in the reference gel that has a label of the
selected category defined in it, pair it with spots in the other gels that have the same
label defined in them. These newly created pairs may then be used as starting pairs
for matching.
Note that only annotations that are linked to spots may be matched.
Adding / deleting pairs
Select one spot in one gel and one or more spots in the other gel using the Spot tool
(click on one spot, then hold down the shift key and click on the other ones). Choose
Add (or Ctrl+Shift+L).
To delete pairs, select spots in one gel and select the gels from which the corresponding pairs will be deleted. Choose Delete (or Ctrl+Shift+U).
Note: a very convenient way to add pairs between a set of gels and a reference gel
is to create groups (see Groups on page 85). Corresponding spots may also be
easily discerned when gels are in stack mode and spots are displayed in overlapped
mode. In this case, use also the flip facility (Ctrl+F) to locate spots.
Menu: Show
Showing pairs
View
Stack
You can look at the matching results in stack mode. Stack gels then choose Show
Pairs. The pairs between the reference gel of the stack and the other stacked gels
are displayed in the form of blue vectors linking the locations of paired spots
(Fig. 6-2). To hide vectors, choose Hide Pairs.
Figure 6-2. Matched gels: blue vectors indicate paired spots.
Melanie 3 User Manual
81
PAIRS
6
In tile mode, groups of spots are easily visualized by displaying the group IDs (see
Showing groups on page 86).
Menu: Select
Selecting pairs
Select
Pairs
To select all pairs among two matched gels, select them then choose All Pairs. All
paired spots will be selected.
You can highlight only pairs for a given set of spots. Using the Spot tool, select a
number of spots in one of the gels. Choose For Spots. Spots in selected gels that
have been paired to the selected spots will be highlighted (Fig. 6-3).
Figure 6-3. Selected paired spots across gels and the corresponding report.
To select only multiple pairs from two selected gels, excluding single pairs, take
Multiple Pairs. You may also select pairs directly from a displayed Report on Pairs
(see Reports and navigation on page 69).
Select
Pairs
An algorithm to predict the accuracy of pairs has been implemented in Melanie. It is
based on the length of the vectors between paired spots. You may select bad pairs
by choosing Bad Pairs, the Vector length and Score parameters.
This measure of bad pairs is computed by Melanie for each pair according to the following steps:
1.
82
a neighboring region is considered around each pair,
Melanie 3 User Manual
REPORTS ON PAIRS
2. corresponding regions are superimposed in order to minimize the vector
lengths in the region, using Least Squares,
3. for each pair of spots in the region, the score is increased by 1 when its vector
length (in pixels) is below the threshold and decreased otherwise.
4. a pair is considered to be bad if its final score is smaller than the second threshold, the Score parameter.
On the other hand, you may also select good pairs. In this case, perform the following steps:
1.
Choose two gels and then Select → Pairs → All Pairs;
2.
Select Show → Spots → Only Selected;
3.
Choose Select → Pairs → Bad Pairs;
4.
Choose Select → Spots → Inverse Selection.
Menu: Reports
Reports on pairs
Reports
Melanie can display a report on pairs among matched gels. Select matched gels
and a number of pairs, using one of the selection methods described above. Then
take Pairs Report. You will get the list of all paired spot IDs (identifications) among
gels (Fig. 6-3).
When many gels are selected, this report corresponds to a report on group IDs displaying the list of all paired spot IDs among all gels.
Another way to display the matching result is to select two or more matched gels,
then Matches Report. This will display the number of pairs between all the selected
gels and any open gels.
Finally, you may choose All Matches Report. This displays information on matching between all gels in a given directory.
Melanie 3 User Manual
83
6
84
PAIRS
Melanie 3 User Manual
7
GROUPS
Introduction
The spot group is an essential concept in the Melanie software. When several gels
have been matched to a given reference gel, the latter provides a unique numbering
scheme for spots across all gels. Each paired spot in a gel image may then be associated to the corresponding spot ID in the reference gel. The set of spots that are
paired with one given spot in the reference gel forms a spot group (see Figure 1-7
on page 1-9). The group ID is the ID of the corresponding spot in the reference gel.
The group is the basic element for analyzing spot variations across gels and for producing histograms and reports, as well as statistical and artificial intelligence analysis.
Groups are automatically created when matching a set of gels with a reference gel,
but they may also be created and modified manually (see Pairs on page 79).
The reference gel is the central node of spot groups. All spots in selected gels that
are paired with the same spot in the reference gel form so-called groups. Groups
may change when the reference gel has changed.
If you have matched your gels with multiple pairs, you may then obtain very large
groups, because a given spot may be paired to several spots in the reference gel.
You should therefore use multiple pairs with care.
Melanie 3 User Manual
85
GROUPS
7
Menu: Edit
Editing groups
Edit
Groups
A convenient way to add pairs between a set of gels and a reference gel is to create
groups. You first have to set the reference gel. Select the reference gel and drag to
the Reference Gel area or choose Set Reference Gel. Select one spot in the reference gel and spots in the other selected gels. By choosing Group Spots, pairs will
be added between each of the selected spots and the selected spot in the reference
gel.
To remove some spots that are part of a given group, select a number of such spots.
Choose Ungroup Spots. This removes the pairs between the selected spots and
the reference gel.
To completely remove groups, select the spots in the reference gel, do Shift+M to
select the corresponding groups and take Ungroup Spots.
Menu: Show
Showing groups
Show
Groups
You may display the group IDs of the reference gel on all visible gels which have
been matched to it. Set the reference gel, select spots then choose Show ID (Fig.
7-1). Inversely, to hide the group IDs, select Hide All ID.
Figure 7-1. Spot IDs of the reference gel (group ids) are displayed on all
matched gels.
86
Melanie 3 User Manual
SELECTING GROUPS
Menu: Select
Selecting groups
The group is the basic element for analyzing and searching changes in protein
expression across gels. Groups allow you to produce reports or histograms and to
analyze sets of gels. In such cases, you first have to select the groups of interest.
Select
Groups
To select and display all groups, choose All. To select one specific group, take By
ID and specify the group ID when requested. If the reference gel is not set, Melanie
will request you to select one.
To select the groups one or more spots belong to, select spots using the Spots tool,
then For Spots.
You may also select groups directly from a displayed Report On Groups (see
Reports and navigation on page 69).
Finally, if some groups have already been selected, you have the possibility to do
Inverse Selection. This will unselect the selected groups and select all unselected
ones.
Restriction of groups selection
Melanie allows you to restrict the groups selection according to the presence or
absence of selected spots in the groups. Select spots, choose Select → Groups
→ Restrict Selection and one of the options in the Restrict Groups Selection dialog box. Use the sliders to choose the threshold on the restriction.
The groups to the corresponding selected spots will be restricted according to:
• selected spots is >=: to keep groups that have selected spots in at least the
chosen number of gels.
• selected spots is <: to keep groups that have selected spots in at most the
chosen number of gels.
• unselected spots is >=: to keep groups that have unselected spots in at least
the chosen number of gels.
• unselected spots is <: to keep groups that have unselected spots in at most
the chosen number of gels.
For the ease of understanding, two possible usages will be studied while these functions are described.
Case number 1: Suppose that you have 6 gels and you would like to study the
groups of AT LEAST 3 spots, and with a Vol value higher than 0.02.
In other words, you would like to analyze spots according to two criteria:
Melanie 3 User Manual
87
7
GROUPS
1. have a Vol value higher than a certain threshold, representing meaningful spots
AND
2. be present in at least half of the selected gels.
In this case, you may select this special set of spots by performing the following
steps:
• Select all the 6 gels and make Select → Spots → All;
• then Select → Spots → Restrict by value, choose Vol. Keep selected only
the spots that have a value t ≥ 0.02 and click OK;
Spots corresponding to the first criteria will remain selected. To restrict the selection
according to the second criteria:
• make Select → Groups → Restrict selection. Keep the groups whose number of “selected spots is >=”, move the slider to choose 3 gels and click OK;
The remaining groups of spots verify both specified criteria.
Case number 2: Suppose now that you would like to study the groups in
which ALL spots have a Vol higher than 0.02.
This choice would restrict the selection of groups to the two criteria defined in case
number one, plus a third criteria:
3. all present spots have a Vol value higher than a certain threshold.
Without unselecting the preceding case:
• make Select → Groups → Restrict selection. Keep the groups whose number of “unselected spots is <“, select value 1 in the slider and click OK;
The remaining selected groups contain spots that verify the three specified criteria.
The following logical step could be to analyze the remaining spots with statistical criteria, like Student T test or Wilcoxon test, also available in Melanie, to highlight
meaningful spots.
As you may notice, there are endless possibilities for combining selections of spots
and groups, and your own experiments and needs will lead you to the adapted use
of this function.
Menu: Analyze
Scatter plot
In order to analyze gel similarities or experimental variations such as stain intensitie
variations or sample loading, you may plot scatter graphics on groups with regression lines and correlation coefficients between gels.
88
Melanie 3 User Manual
SCATTER PLOT
Analyze
Scatters Plot
Select two or more gels and groups of spots. Choose Scatter Plot. Select one of
the spot value types (Od, Vol, Area, %Od, %Vol) to calculate the correlation. The
Scatter Plot window plots the pairs values, and the fitting line of each selected gel
against the reference gel (Fig. 7-2).
Reports
Regression
line
Regression
line equation
Correlation coefficient
Number of pairs
Figure 7-2. Scatter graphic on groups.
As usual, you may save and print the graphics using the corresponding buttons of
the window toolbar.
The relationship between the spots values from two gels can be estimated by
searching the linear dependence between the spot values from one gel against the
values taken in the other gel. The linear dependence is defined as the best fitting
straight line through the pair values. The fitting line is defined by a slope and its offset, i.e. the equation y = s lope ⋅ x + offset . In Melanie’s case, variable x is the spot
values from one gel and y is the corresponding value in the reference gel.
The goodness-of-fit of this approximation is given by the correlation coefficient Corr.
This coefficient can vary between -1 and +1, where an absolute value near 1 indicates a good fit (i.e the spot values of one gel can be predicted, to some extent, by
the values of the other gel) while a low value indicates that the data could not be
approximated by a straight line.
For example:
• 1.0 ⋅ x + 0 with 1 correlation indicates that all paired spot values are the
same in the two gels.
• 1.2 ⋅ x + 0 with 0.95 correlation indicates that almost all paired values are
20% higher in the reference gel.
Melanie 3 User Manual
89
7
GROUPS
• 1.0 ⋅ x + 0.2 with correlation 0.95 indicate that almost all paired values are
shifted by +0.2 in the reference gel.
In general, when the data show a high correlation and the fitting line is not the identity ( 1.0 ⋅ x + 0 ), you should check for possible reasons your values are systematically slanted (perhaps staining, difference of protein load or image acquisition
problem).
Information related to the scatter plots may be found in the Reports menu button in
the toolbar (Fig. 7-2). The gels legend can be obtained by choosing Gels Report on
the menu. The Fitting Report displays for each plot its corresponding slope and offset values of the regression line, its coefficient correlation value and the number of
spot pairs. The Scatter Report displays for each pair of spots their corresponding
values in the gels and the fitting error in relation to the regression line. The latter
may be used, for example, to verify abnormalities between pairs.
Statistics for Groups
Considering groups allows you to analyze variations of proteins among gels, and
statistics help you to analyze these variations. Melanie provides some descriptive
statistics of location and dispersion which may be calculated and displayed in the
Report and Histograms on Groups.
Descriptive statistics are summary values which describe spot values from a group.
They allow you to locate groups composed of spots whose quantification values are
peculiar. These variations may be due to an inadequate detection-matching operation, or may result from protein expression changes among gels. Therefore, these
statistics are useful for controlling the extracted data, as well as for analyzing them.
The statistics tool includes all the options that the expert may expect. Nevertheless,
the reluctant user towards statistics may simply use the default settings.
The available statistics are part of the Robust Statistics and include the most common measures currently used. Melanie extracts from each group of spots the central tendency, which allows you to localize the central value representing the data,
and the dispersion, which indicates how closely the data fall about this center.
90
Melanie 3 User Manual
STATISTICS FOR GROUPS
The descriptive statistics can be chosen with the following interface (Fig. 7-3):
Figure 7-3. Statistics common to Report on Groups, Histograms on Groups,
Report on Classes and Histograms on Classes.
• Central tendency gives the general location of a variable. This is commonly
calculated by the arithmetic mean (also known as average or center of gravity of
a distribution), the median (the middle value which divides the sample in two
equal parts) or the midrange.
• By selecting Mean the arithmetic mean is calculated, i.e. the sum of
all the sample values divided by the sample size.
• By selecting Midrange the midpoint of the sample value is calculated,
i.e. the middle location between the two sample extremes.
• By selecting Reference gel values the central tendency is the value
from the spot in the reference gel.
Mean (or midrange) values are sensitive to extreme values (outliers) and can be
seriously contaminated by just one observation. On the other hand, the median is
highly resistant to outliers. A compromise between mean (or midrange) and median
is given by the trimmed mean (or midrange) where a predefined number of outliers
is removed from the sample. The trimmed measures are more robust than the mean
(or midrange) but are more sensitive than the median.
The percentage sliders available in the dialog box allow you to remove outliers.
100% value means that all the spot values available in a group will be used to calculate the statistics, i.e. no suppression of outliers. 0% corresponds to the Median
measure. For example, 80% value means that the 10% minimum values and the
10% maximum values will be discarded from the sample, and the statistical value
will be calculated for the remaining values.
• Dispersion measures the variability of the sample data, how clustered or
scattered data are about its center. There are numerous measures of variability:
standard-deviation, range, interquartile range and many others. Like the statistics
for central tendency, these measures make use of all the available sample data,
and can be heavily influenced by outliers. Therefore you can also restrict the
sample to the central values by trimming out the extreme values.
• By selecting Mean squared deviation (M.S.D.) the square root of the
average squared difference of each sample value to the center location is calculated.
Melanie 3 User Manual
91
7
GROUPS
• By selecting Mean absolute deviation (M.A.D.) the mean of the
absolute difference between each value and the central value is calculated. It is not affected by outliers as much as the Mean squared
deviation since the differences are not squared.
• By selecting Half-range size the difference between the largest and
the smallest values divided by 2 is calculated.
As for the central tendency, the percentage slider allows you to remove extreme values from the dispersion statistics. A 100% value means that all the values are used
to calculate the dispersion, and on the other hand, 0% will always represent no dispersion (zero).
Some examples:
• Mean (100%) and Mean squared deviation (100%) are the most commonly
used statistics (Fig. 7-4, item a). Notice that the standard deviation is the Mean
squared deviation multiplied by N ⁄ ( N – 1 ) where N is the sample size. This difference comes from the fact that the standard deviation should be an unbiased
estimator.
• Median (Mean 0%) and Mean absolute deviation (100%) are much more
robust to outliers than the statistics above (Fig. 7-4, item b).
• Midrange (100%) and Half-range (100%) define an interval which includes
all sample values (Fig. 7-4, item c).
Mean(100%)
M.S.D.(100%)
(a)
Median
M.A.D.(100%)
Midrange(100%)
Half-range(100%)
(b)
(c)
Figure 7-4. Histograms showing the sensitivity of central and dispersion
values. (a) Mean (100%), M.S.D. (100%) (b) Median, M.A.D. (100%) (c) Midrange
(100%), Half-range (100%).
92
Melanie 3 User Manual
HISTOGRAMS ON GROUPS
• Midrange (50%) and Half-range (50%) are known as order statistics and
interquartile ranges (Fig. 7-5).
(a)
(b)
(c)
(d)
Figure 7-5. Histograms showing the sensitivity of outliers suppression.
Midrange and Half-range values with (a) 100%, (b) 80%, (c) 50% and (d) 33%.
Notice that absent spots, represented by zero values, are also considered in the calculation of statistics.
Histograms on groups
Histograms and Report on Groups provide valuable operations which may be used
to look for peculiar groups of spots. Analyzing groups or verifying the matching or
spot detection operations, are some of the endless possibilities of their usage. You
may also visually compare spots or even navigate through pairs and groups. Histograms on Groups and Report on Groups are dual elements, they have a reciprocal
relationship.
Analyze
Groups Histograms
Histograms are a more visual way to look at groups. To get histograms on groups,
select groups (on the gels or by using the Report on Groups) then take Groups Histograms. The descriptive statistics directly available in the subsequent dialog box
are location and dispersion values, explained in Statistics for Groups on page 90.
Melanie 3 User Manual
93
7
GROUPS
In the displayed histograms, the brown lines correspond to the spot values, the blue
line corresponds to the chosen Central value, and the red lines to the range defined
by [Central - Dispersion, Central + Dispersion].
Reports
Sort by Similarity
Displayed values
Range
extremes
Central
Gel index
Group ID
Figure 7-6. Histograms on Groups.
Figure 7-6 shows some histograms for selected groups. The slider on the bottom
right corner of the window allows you to visualize the rest of the groups which are
equitably disposed in pages.
The histograms may also be selected as any other Melanie object and be saved,
printed or exported to other software. To select one histogram, click on the histogram window. To select many histograms, use Shift or Ctrl keys.
You may re-select the corresponding groups on the gels by using the Select on Gel
Image button, and navigate through groups with Select Next and Select Previous
buttons.
By using the Reports menu, you may display the numerical values of selected histograms when choosing Report on Groups, and the latter will create a new groups
report with the selected groups. You may as well display the histograms legend by
selecting the Gels Report item.
Use the Report on Groups to change the order or to refine your histograms selection.
94
Melanie 3 User Manual
HISTOGRAMS ON GROUPS
Comparing protein expression changes
Melanie provides facilities in the histograms window to visually compare protein
expression changes across different groups: normalize values, sort values, select/
unselect adaptive gradations and search by similarity.
You may simplify the comparison across groups by normalizing the spot values relatively to their groups statistics values (Displayed values item, Fig. 7-6). The available
normalizations are:
•
•
•
•
Value: Raw spot value;
Relative: | Spot_value - Central_tendency |;
Ratio: Spot_value / Central_tendency;
Normalized: | Spot_value - Central_tendency | / Dispersion.
To highlight spot variations, you can display the spot values sorted in ascending
order, in this case select the Sorted values check box at the bottom of the histograms window (Fig. 7-7).
Figure 7-7. Histograms on Groups with unsorted values and with sorted in
ascending order values.
Also, to highlight spot variations inside a group, the histograms gradations are
adjusted according to each group. Unselect the Adaptive gradations check box to
display the same gradation in all histograms (Fig. 7-8).
Figure 7-8. Histograms on Groups with adaptive gradations set individually
and set according to the minimum and maximum values.
You may look for similar histograms easily on Histograms on Groups window. Select
one histogram and press Sort by Similarity button in the toolbar. A new histogram
Melanie 3 User Manual
95
GROUPS
7
window will be displayed where the selected histogram is first displayed and the
other histograms follow a similar criterion. This criterion is based on the selected
histogram’s shape. For example, the histograms shown in Fig. 7-9 can be considered similar.
Figure 7-9. Histograms displayed according to their shape similarity.
Reports on groups
Similar to the Histograms on Groups, the Report on Groups describes numerical
data concerning groups of spots as well as their corresponding statistical values.
Analyze
Groups Report
Once you have selected a given number of groups (possibly all), you may display a
report on them. Choose Groups Report. Melanie will ask you to pick out the reference gel, provided it has not yet been selected. You then have to select one of the
spot value types for the report (Od, Vol, Area, %Od, %Vol) and choose the statistics
values to be displayed in the report.
In the Report on Groups, in addition to the central and dispersion values described
earlier, other measures for groups analysis are also available (Fig. 7-10):
Figure 7-10. Additional values for the Report on Groups.
• Coefficient of Variation is deviation divided by the central tendency. It measures the relative variability by correcting the magnitude of the data values, thus
giving a measure that has no units. When you choose the statistics Median and
Mean absolute deviation, this measure is also known as the Coefficient of Dispersion.
• Range Ratio is the maximum value divided by the smallest value in the
sample specified by the percentage slider.
96
Melanie 3 User Manual
REPORTS ON GROUPS
• Separability is the highest difference among two consecutive sorted values
in the whole sample. It measures the greatest gap that you can have if you want
to split the group values in two classes.
• Correspondence Analysis (C.A.) which shows the amount by which each
spot contributes to the constitution of the first two principal axis on the factorial
space [see reference 10].
To simplify the comparison between groups, you can normalize the spot values as
described for the Histograms on Groups. In the Report on Groups window, choose
in the Displayed value list (Fig. 7-11) the type of normalization used to display the
spots values.
Plot C.A.
Histograms
Reports
Displayed values
Figure 7-11. Report on Groups.
Clicking Histograms in the toolbar (Fig. 7-11), will display the histograms on
selected groups from the report. You may immediately analyze the selected groups
and directly iterate on the screen through your data (see Histograms on groups on
page 93).
If the Correspondence Analysis check box has been selected in the dialog (Fig.
7-10), a Correspondence Analysis is done and the C.A. column displays the amount
by which each spot group contributes to the constitution of the axis in the factorial
space (the inertia value). This method creates a projection onto a factorial space of
small dimensionality, in which gels and their significant spots appear as points. Consequently, we can determine which gels are similar and which are the characteristic
spots of these gels. In fact, the natural formation of classes among the gels is highlighted with this method and can be seen in a graphical representation of gels and
spots that are projected into the 2-D factorial space. Choose the Plot C.A. button in
the toolbar (Fig. 7-11). A dialog box lets you choose to display gels, significant spots
or both, and the graphical results of the correspondence analysis will be displayed.
Melanie 3 User Manual
97
7
GROUPS
Figure 7-12 shows the correspondence analysis plot for 6 gels ([]) and 18 significative group IDs (+). Gels that are found close to each other (apart from the scaling
factor), may correspond to the same class.
Figure 7-12. Plot of correspondence analysis
The Reports menu button (Fig. 7-11) allows the display of reports correlated to the
groups. The Gels Report item is a reduced version of the original Report on Gels to
be used, for example, as a legend for the histograms.
Spots Report
The Spots Report item in the Reports menu button (Fig. 7-11), is useful to compare
one spot against the other spots of the same group. The available measures, to
quantify the spot values relatively to their groups, are the same as above (chosen
value in the Displayed values list). Therefore you can select the spots which are outliers or representative of a group.
You can select the most representative spots of a group by, for example, choosing
the spots whose values are close to the mean (difference below 20%). In this case,
take Mean 100% and 0.8 < ratio < 1.2. As well, a median ratio =1 will select the
spots that are in the middle of the group.
You can select outliers whose values are outside the range given by its mean and
two times the standard deviation. In fact, with a normal distribution, at most 5% of
the values should be outside this interval.
Other examples to find out outliers can be summarized as:
98
Melanie 3 User Manual
HEURISTIC CLUSTERING
- Median, ratio value > 2: selects spots which are at least 2 times higher or lower
than half of the spots from the group;
- MidRange (100%) + Half-Range (100%), normalized value = 1: selects spots
which are the highest or the lowest in their groups;
- MidRange (50%) + Half-Range (50%), normalized value > 2: selects spots which
are at least 2 times higher (or lower) than the 75% of spots from their groups.
By restricting the selected groups, you can, for example, remove the groups which
contain too many outliers. You can also use this functionality to search for peculiar
gels. For example, a gel containing more outliers than the others could indicate a
peculiar gel and you should check the reasons before continuing the analysis.
Heuristic clustering
Melanie proposes a powerful analysis method to automatically create sets of gels,
and highlight significant groups of spots. Heuristic clustering, a machine learning
algorithm from the artificial intelligence, is used to describe the characteristic spots
of 2-D PAGE gels while using heuristics to speed up the search [see reference 9].
The Heuristic clustering algorithm is an alternative to blindly classify similar gels into
two or more classes and to determine the characteristic spots of each class, that is
the proteins that are potentially differently expressed in the various classes.
Select gels and groups of spots. Choose Do Clustering. Select one of the spot
Analyze
value types (Od, Vol, Area, %Od, %Vol) to be considered by this classification algoHeuristic Clustering rithm. In the following window, define the minimum and maximum number of classes
to be formed by Melanie (respectively, Minimum number of classes and Maximum
number of classes parameter).
For example, if you choose 2 and 4, Melanie will successively split the gels in 2, 3
and 4 classes, then compare the resulting classifications and, according to a similarity function, show the best one.
Select the sensitivity parameter to be considered between the highest and the lowest values in groups (Sensitivity parameter). The smaller this parameter, the smaller
Melanie 3 User Manual
99
7
GROUPS
the accepted difference among groups will be (and more spots will be present in the
results). This parameter may be seen in a schematic way in Figure 7-13.
Sensitivity
Spot
Interval Class 1
min
max
Interval Class 2
min
max
Figure 7-13. Sensitivity parameter.
Depending on the computer you are running Melanie on, this might take time, especially when the number of maximum classes is high.
The resulting classification may be visualized in a dendogram which plots the
classes and their gels. It may also be analyzed through its Report where the significant spots are also displayed. The Classification Level parameter in the Heuristic
Clustering window establishes the depth of classification which may be seen in the
plot and report as well. (Fig. 7-14).
After the analysis has been performed, you may display a report which shows the
Analyze
names of the selected gels and their classes, as well as information on each
Heuristic Clustering selected group, such as group ID and their intervals of minimum and maximum values in each class. In this case take Report.
Another way of visualizing the classification made by Heuristic Clustering is to display a dendogram which shows the classes and their gels. Choose Plot.
Figure 7-14. Two classes and one classification level.
100
Melanie 3 User Manual
8
CLASSES
A number of gels, having common biological meaning or common characteristics,
establish a class of gels. It corresponds to a set of gels representing the same population. One of the main goals of Melanie is to help you find significant protein
expression changes among several populations of gels. For this purpose, two complementary techniques are available:
• Overlapping measures: Summarizes each class by an interval and measures the overlapping across them.
• Statistical Test: Measures the difference among populations and estimates if
this difference is significant (i.e. is not only due to chance).
This chapter describes how the analysis and visualization of differently expressed
proteins through populations of gels can be highlighted with statistical tests, reports
and histograms.
Menu: Edit
Specifying classes
To identify variations between two populations of gels, you need to specify which
gels belong to which population by creating classes.
Edit
Classes
To create a class, select the gels which belong to it and choose Add to Class. In the
dialog box, enter a name for the class (for example, class A) or choose among the
existing names. Repeat the same procedures to create the other classes.
Melanie 3 User Manual
101
CLASSES
8
Edit
Classes
If you want to cancel the class of one or many gels, select the gels and then choose
Remove from Class.
Menu: Analyze
Overlapping measures
As for groups of spots, each protein class may be summarized by two statistical values, namely central tendency and dispersion (see Statistics for Groups on page 90).
By computing an overlapping measure between the classes range summary, you
can find the proteins which are expressed differently in one population against the
others.
Histograms and reports on classes display, for each class of gels and for each
selected group, two values that describe classes and indicate their overlap according to the Displayed value list on the toolbar (see Fig. 8-3 or Fig. 8-8):
• Center: Raw central tendency of the current class;
• Dispersion: Raw dispersion values of the current class. These two values
define the interval which summarizes the proteins sample for the class. You can
also characterize a class only by the central value by setting the dispersion percentage slider to 0%.
The following values are different measures to indicate the overlapping degree
between the current class against one of the other classes.
• Gap: Maximum difference between the range of the current class and the
range of one of the other classes. Negative values indicate overlapping intervals
and positive values indicate no overlapping intervals (Fig. 8-1).
102
Melanie 3 User Manual
OVERLAPPING MEASURES
• Ratio: Maximum ratio between the range of the current class and the range
of one of the other classes. Values smaller than 1 indicate overlapping and higher
indicate no overlapping (Fig. 8-1).
No-overlapping case
Interval class A
Interval class B
Gap > 0 and Ratio > 1
Overlapping case
Interval class A
Interval class B
Gap < 0 and Ratio < 1
Figure 8-1. Schema of the Gap and Ratio values.
• Normalized: Minimum overlapping between the range of the current class
and the range of the other classes. A value smaller than 1 indicates overlapping.
For example, 0.25 indicates that 25% of the range is not recovered by one of the
other classes. In the same way, 1.5 indicates a gap of 0.5 from the range size of
the current class to its furthest class. Because this value is not symmetrical, a
value from class A compared to class B is not the same as the value from class B
compared to class A (Fig. 8-2).
No-overlapping case
Interval class A
Interval class B
1.5
2
Overlapping case
Interval class A
Interval class B
0.75
0.5
Figure 8-2. Schema of the Normalize value.
Note that the calculations where the protein is absent in a class are represented in
the report and histograms by the number 1000000.
Melanie 3 User Manual
103
8
CLASSES
Histograms on Classes
As for groups of spots, you may visually study statistics values of classes by displayAnalyze
ing histograms. Select groups of spots and choose Classes Histograms. Select
Classes Histograms
one of the spot value types (Od, Vol, Area, %Od, %Vol). In the dialog box, choose
central and dispersion statistics (see Statistics for Groups on page 90). The displayed histograms show, for each class, the chosen Displayed value and the dispersion interval (Fig. 8-3).
Reports menu
Groups Histograms menu
Displayed value list
Dispersion
interval
Central
value
Group ID
Figure 8-3. Histograms on Classes.
The histograms on classes may also be selected as any other object and be saved,
printed or exported to other software. You may re-select the corresponding groups
on the gels by using the Select on Gel Image button, and navigate through groups
with Select Next and Select Previous buttons.
In the Histograms on Classes window, you may find short ways to useful operations.
You may also find report and histogram short cuts. The Reports menu button (Fig.
8-3) allows you to display reports correlated to the classes.
The Gels Report item is a reduced version of the original Report on Gels to be
used, for example, as a legend to the classes.
The Groups Report item separately displays a Report on Groups for selected
groups for each class. The Information displayed is the original information usually
found in the Report on Groups (see Reports on groups on page 96).
You may also create, from the Histograms on Classes window, a Report on Classes
for the selected corresponding histograms, as well as a more complete histogram of
104
Melanie 3 User Manual
HISTOGRAMS ON CLASSES+GROUPS
classes+groups (Histogram button in the toolbar). In the same way as Histograms
and Report on Groups, Histograms and Report on Classes are dual elements, they
have a reciprocal relationship.
To simplify the visual search of non-overlapping intervals, you may display the
classes values sorted in ascending order, in this case select the Sorted values
check box in the bottom of the histograms window (Fig. 8-4).
Figure 8-4. Histograms on Classes with unsorted central values and with
sorted, in ascending order, central values.
To have the same gradations for all histograms, unselect the Adaptive gradations
check box in the bottom of the histograms window (Fig. 8-5).
Figure 8-5. Histograms on Classes with adaptive gradations set individually,
and set according to the minimum and maximum values.
Use the Report on Classes to change the order or to refine your histograms selection.
Histograms on Classes+Groups
From the Report and Histograms on Classes windows, you may request more
detailed and complete histograms on classes for selected groups. They display, for
each group, the extracted classes intervals and their corresponding spot values.
Analyze
Classes...
Select gels and groups of spots. Choose Classes Histograms or Classes Report.
Select one of the spot value types (Od, Vol, Area, %Od, %Vol). In the dialog box,
Melanie 3 User Manual
105
8
CLASSES
select central and dispersion statistics. In the toolbar of the displayed window, select
the item Groups Histograms in the Histograms menu.
The histograms are displayed for each group of spots and for each class. The available information from the classes are the central value and the dispersion interval. A
vertical gray line separates the spots values for each class (Fig. 8-6).
The information displayed in these specific histograms are described in Histograms
on groups on page 93 and Histograms on Classes on page 104.
Reports menu
Class separation
Dispersion
interval
Central
value
Spot
values
Figure 8-6. Histograms on Classes+Groups.
The histograms on classes may also be selected as any other object and be saved,
printed or exported to any other software. You may re-select the corresponding
groups on the gels by using the Select on Gel Image button, and navigate through
groups with Select Next and Select Previous buttons.
You may also decide to display the chosen classes displayed values sorted in
ascending order. In this case select the Sorted values check box at the bottom of
the histograms window (Fig. 8-6). The spot values are sorted inside the classes and
106
Melanie 3 User Manual
REPORT ON CLASSES
the classes are also sorted according to the central value, i.e. the Displayed value
chosen for the Histogram or the Report on Classes (Fig. 8-7).
Figure 8-7. Histograms on Classes+Groups with unsorted and sorted in
ascending order values. The classes are sorted according to their central
values and the spots are sorted also inside the classes.
In the Histogram on Classes+Groups window, unselect the Adaptive gradations
check box to have the same gradations in all displayed histograms.
Report on Classes
Analyze
Classes Report
Specific reports on classes may be generated to display their statistical values.
Once classes have been set, select the gels and groups of spots to be included in
the report. Choose Classes Report. Select one of the spot value types (Od, Vol,
Area, %Od, %Vol). In the dialog box, select central and dispersion statistics, which
are explained in Statistics for Groups on page 90.
Reports menu
Histograms menu
Displayed value list
Figure 8-8. Report on Classes.
The Report on Classes displays the chosen Displayed value (Fig. 8-8) for each
class and the maximum value among all the classes. The values available in the
Melanie 3 User Manual
107
CLASSES
8
Report on Classes allow you to differentiate one class from the other classes, and
this according to each group of spots.
From the Report on Classes window, you may also create the same reports found in
the Histograms on Classes window for the selected corresponding histograms.The
available reports are the Report on Gels, used as a legend for classes and gels, as
well as the Report on Groups separated by classes.
In the Histograms menu button, you may choose to display specific histograms on
classes and on groups.
Statistical tests
Melanie also includes statistical tests to determine differently expressed proteins
[see reference 11].
The main characteristic of statistical tests is to establish the probability that the
measured difference between populations can be due to chance. In order to
express the results as probabilities, the protein values must follow the restrictive
assumptions about these tests.
Because protein expression among several gels rarely follow these assumptions,
Melanie only displays the numerical values for each test and lets the user search in
the appropriate tables for the corresponding significance levels.
Analyze
Statistical Tests
Select a given number of groups among the selected gels. Choose Statistical
Tests. You then have to select one of the spot value types for the analysis (Od, Vol,
Area, %Od, %Vol).
Choose the statistical test values, which you would like to have displayed, from Student t-test, Wilcoxon test and Kolmogorov test. The Statistical Tests report displays,
for each selected group of spots, the chosen statistical values. The displayed values
should be considered as qualitative indications of potentially differently expressed
proteins.
Student t-test
The Student t-test is the most used test to determine whether two populations are
significantly different, and this based on the assumption that:
• the data follow the normal probability distribution.
• the standard deviation of the two classes are similar.
The statistics are based on the difference between the two classes means normalized by the standard deviation.
108
Melanie 3 User Manual
STATISTICAL TESTS
The displayed value for each group of spots in the Report on Statistical Test corresponds to the probability p of confidence on the Student t-test hypothesis, i.e. to
affirm with p probability that both populations are significantly different.
When the normal distribution assumption is not followed, non parametric tests, like
Wilcoxon or Kolmogorov, may provide a better analysis.
Wilcoxon or Mann-Whitney test
The Wilcoxon or Mann-Whitney Test investigate the hypothesis that two populations
differ only with respect to their median values.
The characteristics of this test are that no assumptions are made about the data
distribution. It considers only that they have the same distribution.
The statistics are based on the number of shifts needed to order the values from the
two populations so that they don’t overlap. For the example given in Fig. 8-9, the
population A
x
x
x
x
x
x
x
population B
a1 a2
a3 a4
x
x x
x
x
a5 b1 a6 b2 b3 a7 b4 b5
x
b6
sample values
Figure 8-9. Example of two populations.
Wilcoxon test indicates that the last two values from A must be swapped four times
(to the left) so that both populations no longer overlap.
The report values are the normalized number of shifts needed to sort the two populations. You may then use this value to look for the probability of confidence in a Wilcoxon table.
Kolmogorov
The Kolmogorov-Smirnov test is used to test whether or not two samples come from
the same distribution. The Kolmogorov-Smirnov test does not require the assumption that the population is normally distributed, nor does Wilcoxon.
The statistics measure the number of values, in percent, from a population which is
not covered by values from the other population. For the example given in Fig. 8-9,
the Kolmogorov test shows that 5/7 values from A are not covered by the values
from B.
Melanie 3 User Manual
109
8
CLASSES
The sample percentage not covered by the other population is displayed on the
Report on Statistical Test. You may then use this value to look for the probability of
confidence in a Kolmogorov table.
Note that all statistical values are only useful when dealing with more than 2 gels
per class.
Sort the columns in the report, by clicking in their headers, and re-select the groups
which correspond to your own criterion of statistical value.
110
Melanie 3 User Manual
PART III
TOOLS
9
DATABASES
2-DE databases
A key aspect of the Melanie program is its ability to link spots on gel images to protein data in 2-DE databases. 2-DE databases contain data on proteins identified on
2-DE images, such as pI and Mw, bibliographical references to protein related literature, information on protein functions, etc. Several specialized 2-DE databases exist
that Melanie can work in conjunction with. Melanie is especially well suited to work
with data from the SWISS-2DPAGE global 2-DE database that is accessible over
the Internet (see SWISS-2DPAGE master gels on page 115).
Spots on 2-DE gels analyzed with Melanie may be linked to two different types of 2DE databases:
1. Private 2-DE databases - This is a database you build yourself by defining
your own master gel on which you add protein-related data. You may then match
gels with your master protein map.
2. Remote 2-DE databases - If your computer is connected to the Internet, you
may link your gels to remote databases such as SWISS-2DPAGE, and remotely
retrieve protein data related to spots on your gels.
The spot annotation with Ac label
The annotation with an Ac label is a small tag associated to a spot which identifies the corresponding protein (see Annotations on page 53). The Ac label holds the
protein’s accession number taken from the 2-DE database. The Ac label is the link
between the gel and the 2-DE database.
Melanie 3 User Manual
113
DATABASES
9
Querying a remote database through the
Internet
In Melanie you may work with your own master images, or you can link your gels to
any SWISS-2DPAGE master gels. An interesting possibility to link your images to 2DE databases is offered if your computer is connected to the Internet. You may
retrieve data from remote 2-DE databases for any label containing a valid accession
number (Ac).
The http query is formed by two parts:
• the fixed part which contains the http address and the query engine;
• the variable part which contains the Ac label.
Querying one annotation means that the fixed and variable parts are concatenated.
Setting the browser
Tools
Database
To retrieve data from remote databases you must have the Netscape Navigator®
World-Wide Web or Microsoft Internet Explorer browser installed. Choose Settings
and select your favorite browser.
Setting the database
You have to set the http site of the remote federated 2-DE database [see reference
25], i.e. a 2-DE database that may be remotely queried from within 2-DE analysis
software. Choose Settings and enter the whole http site.
For example, you may decide to query, on the ExPASy server, the SWISS-2DPAGE
2-DE database using its query engine Nice2dpage, or the SWISS-PROT protein
sequence database using the query engine Niceprot. In the first case, type http://
www.expasy.ch/cgi-bin/nice2dpage.pl in Database URL field. In the second case,
type http://www.expasy.ch/cgi-bin/niceprot.pl.
Click the World 2D button in the Database Settings window to display, in your chosen browser, a list of federated 2D-PAGE databases and servers which may be queried from Melanie or consult the page http://www.expasy.ch/ch2d/2d-index.html.
The World 2D button is a reminder of the possible servers. Copy the desired database format name from the displayed window and paste it to the field Database URL
in Melanie.
The query formats are specific to the databases. Some formats must include the “?”
character, others must include the “=” character. Melanie concatenates the Ac label
to the text typed in the field Database URL.
These settings may also be made permanent from the Edit → Preferences →
Database menu option.
114
Melanie 3 User Manual
SWISS-2DPAGE MASTER GELS
Querying the database
Show
Annotations
To query the remote database, double-click one spot that has a label with a valid
accession number (Ac). This will call the chosen browser program on your computer
that is going to automatically retrieve the corresponding entry from the remote database. Alternatively, you may select the label and choose Show → Annotations →
Linked Data.
For example, if you have set the database SWISS-2DPAGE on the www.expasy.ch
server, with the query engine Nice2DPAGE, by double-clicking the spot label which
has the accession number P02649, you will obtain the entry for Human Apo E in
your chosen browser (see Fig. 9-1).
SWISS-2DPAGE master gels
SWISS-2DPAGE master gels contain annotations for all proteins corresponding to
entries in the SWISS-2DPAGE 2-DE database. Each annotation holds the accession number (in the Ac label category) of the database entry, as well as the entry’s
short name (in the ProteinName label category).
For example, the Human Plasma protein map possesses the Ac label P02768 and
the ProteinName label ALBU_HUMAN, for each spot that corresponds to albumin.
SWISS-2DPAGE entries contain detailed data on the related proteins, such as the
protein’s full name, bibliographical references, annotations (protein function, pathological variations, etc.) and the pI and Mw of the related spot on the 2-DE maps.
They also hold cross-references to other databases such as the SWISS-PROT protein sequence database (that in turn has cross-references to numerous other databases such as nucleotide sequence databases, disease databases, etc.) or the
Melanie 3 User Manual
115
DATABASES
9
YEPD Yeast 2-DE database and the ECO2DBASE E. Coli 2-DE database
(Fig. 9-1).
Figure 9-1. The SWISS-2DPAGE entry for human Apo E.
Loading labels from a master
Tools
Database
Load Protein...
On most 2-DE databases, the accession number is the unique entry identifier, while
the protein name may change. It is therefore strongly recommended to use Acs.
Melanie provides a way of automatically updating the protein names in your gels.
Select a gel containing labels with valid Acs. Set it as the master gel. Select all
labels you want to update. Choose Load Protein Name from Swiss-2D. For each
selected label, Melanie will request its short name from SWISS-2DPAGE database
(using the Ac as identifier) and then update the ProteinName label accordingly.
In addition to labels containing data from the SWISS-2DPAGE database, spots in
SWISS-2DPAGE master gels also present the particularity of possessing serial
numbers, an identification number that uniquely links a spot on the gel and protein
data in the SWISS-2DPAGE database to one spot on a specific SWISS-2DPAGE
master gel. The serial number has the form 2D-xxxxxx, where x is a digit or an
116
Melanie 3 User Manual
SWISS-2DPAGE MASTER GELS
upper case letter. For example, 2D-000C5W and 2D-000C6F identify two spots on
the Human Plasma protein map that have been identified as Apo E (Fig. 9-1).
Tools
Database
Load Swiss...
The serial numbers are embedded in the SWISS-2DPAGE master gels and may not
be changed. To display the serial number information of SWISS-2DPAGE master
gels using Melanie, select a master gel then choose Load Swiss-2D Serial Number. The serial numbers are placed in labels from the SerialNumber category which
by default are not visible. To make this category visible, choose Show → Annotations → Hidden Categories and select the category name in the proposed list of
categories.
Melanie 3 User Manual
117
9
118
DATABASES
Melanie 3 User Manual
10
CREATING IMAGES
The functions found in the Tools → Gels menu processes existing 2-DE gel images
on the screen, but affects image files on disk. From this menu you may create new
gel images from the selected ones. You can duplicate, crop and filter gels, create
new synthetic, and flip or scale as well as erase gels. Except for the Erase option, all
options in this menu create new gels that are automatically opened and displayed in
the Melanie window.
Creating synthetic gels
One way to study variations in protein expression among a series of gels is to produce a synthetic gel by merging spots from these gels. In this case, the synthetic gel
is used as a path connecting the studied gels in analysis operations.
As well, side effects of gel runs, such as staining, running differences, sample variation, may be overcome by merging all gels from the same sample into an averaged
gel.
Besides, Melanie allows you to choose the spots which are included in the synthetic
gels.
To create a synthetic gel, perform the following steps:
Tools
Create Synthetic...
1.
Select the spots to be included in the synthetic gel.
2.
Choose Tools → Create Synthetic Gel.
3.
The Create Synthetic Gel window then lets you specify the new file name.
Melanie 3 User Manual
119
10
CREATING IMAGES
The synthetic gel contains all selected spots. If spots belong to a group, only one
spot per group will be present in the synthetic gel, which is the closest to the average quantification value of the group. In this case, Vol, Area and Od values assigned
to the spots in the synthetic gel correspond to the chosen spot. The %Od and %Vol
values are recalculated according to the total Od and Vol, respectively, of the new
synthetic image.
If some gels are matched against others, you may decide to “keep only triple” spots
in the synthetic gel. In this case, only the groups whose spots form a triangle are
considered in the synthetic image (Fig. 10-1).
S1
Gel 1
S2
S3
Gel 2
Gel 3
Figure 10-1. Triangle of pairs.
The synthetic gel is saved in the same directory as the matched gels, and pairs will
be automatically created against the synthetic gel.
The resulting synthetic gel will be created and displayed (Fig. 10-2).
Figure 10-2. A synthetic gel and its three contributing gels. The reference gel
is ECOLI.
120
Melanie 3 User Manual
DUPLICATING GELS
You may now perform a quantitative study on their spots, using spot groups (see
Groups on page 85).
The synthetic gel can be updated by adding new spots with Edit → Spots → Copy
from Gel (see Adding / modifying spots on page 42). The image will be updated
according to these new spots.
Duplicating gels
You can create copies of selected gels and include existing objects such as spots or
annotations.
Tools
Gels
Select the gels you want to duplicate. Choose Duplicate and give new file names
for them. You may also add an extension or replace the extensions of the original
image files. The gel image files will be copied to disk. They will then be opened and
displayed in the Melanie window.
Erasing gels
To delete existing gels, select them, then Erase. All selected gels will be removed
from the screen as well as from the disk. Associated spot pairs are deleted as well.
Cropping gels
Define regions in selected gels using the Region tool. Choose Crop. You may
choose what objects you want to keep with the cropped image, such as spots and
annotations. You may also decide to keep the image alignment. Another dialog box
then lets you specify the new file names. You may also add an extension or replace
the extensions of the original image files. Click OK. New gels will be created containing only the parts of the gels that lie within the specified regions, plus the specified objects.
Filtering gels
Melanie has been optimized for analyzing 2-DE gel images without prior image processing or enhancement. If you analyze low quality images, Melanie provides image
processing filters that may help you to enhance the quality of your images.
Melanie 3 User Manual
121
CREATING IMAGES
10
Nevertheless, keep in mind that after filtering images, spot quantification values will
change and will be hard to interpret.
Tools
Gels
Select the gels you want to filter, then pick a filter in the Filter Image options. This
will create copies of the gels after they have been filtered, leaving the original
images unaffected. The following filters are available:
1. Smoothing - Smooths the raw gel image. You have the choice between the following four smoothing algorithms:
•
•
•
•
Gaussian smoothing
Diffusion smoothing
Polynomial fitting
Adaptive smoothing
You will also be asked to choose how many times you wish the smooth filter to
be applied.
2. Histogram Equalization - Performs histogram equalization on the selected
gels. Various options are available, and the following five equalization algorithms are
provided:
•
•
•
•
•
Uniform
Exponential
Rayleigh
Cube Root
Logarithmic
3. Remap Grey Levels - Creates copies of the selected gels with modified grey
level mapping (see Gray levels on page 33). This is especially useful if you analyze
images with a very low grey level range.
For example, the Melanie spot detection algorithm may not work properly on an
image with only 25 grey levels. You can therefore remap it to an image with 4096
shades of grey so that spots may be correctly detected.
4. Contrast Enhancement - Applies a contrast enhancing algorithm to the
images in order to highlight small spots (Fig. 10-3). The following three contrast
enhancement algorithms are available:
• Quadratic
• Sigmoid
122
Melanie 3 User Manual
FILTERING GELS
• Wallis
Figure 10-3. The original image (left) and the same image after contrast
enhancement (right).
5. Filter Background - Applies one of the two following background filtering algorithms to the selected gels, in order to eliminate gel background (Fig. 10-4):
• Subtraction of global image minimum
• Background subtraction by polynomial transformation
Figure 10-4. The original image (left) and the same image after background
subtraction (right).
6. Morphological Filter - Applies a morphological filtering algorithm (rank filter)
to the selected gels (Fig. 10-5), according to 2 parameters:
• the window size, which can be 3x3, 5x5 or 7x7 pixels wide,
• and the value index.
Figure 10-5. The original image (left) and the same image after a
morphological filter with 3x3 and value index = 8 (right).
Melanie 3 User Manual
123
CREATING IMAGES
10
This algorithm produces an image by replacing each central pixel of a “window” by
the grey value specified by “value index” in the list of pixel values from the defined
window, sorted in ascending order. If the value index is 0, the filter corresponds to
an erosion (shrink spots). If the value index is the maximum window size, the filter
corresponds to a dilation (grow spots). If the value index is the central window size,
the filter is a median filter.
Flipping gels
Tools
Gels
If you have scanned images in the wrong direction, you may correct this by applying
the Flip Gels options. Select gels, then Flip and choose one of the flipping options
(Horizontally, Vertically or Both Directions). As for other options in the Tools menu,
you will have to specify file names.
Scaling gels
The Image menu lets you create larger or smaller copies of selected gels. Select
gels, then Scale By and type the horizontal and vertical scale factor values. As for
other options in the Tools menu, you will have to specify file names.
Rotating gels
If you have scanned images in the wrong position, you can correct this by applying
Rotate Gels. Select gels, then Rotate. A dialog box lets you specify the rotation
angle with the sliders. As for other options in the Tools menu, you will have to specify file names.
Inverting grey levels
The last option in the Tools menu lets you change the grey levels of selected gels by
inverting them (reverse video). Select gels, then Invert Gray Levels. As for other
options in the Tools menu, you will have to specify file names.
124
Melanie 3 User Manual
PART IV
APPENDIXES
A
DIFFERENCES BETWEEN MELANIE
II AND MELANIE 3 OR WHERE TO FIND
WHAT SEEMS TO HAVE DISAPPEARED
Show and select objects
Most operations in Melanie may only be applied to selected objects on selected
gels. For instance, a report on spots will only be enabled if there are selected spots
on selected gels.
Likewise, most of the main operations in Melanie may now only be carried out when
objects are visible on gels, i.e. you can only select the objects that are visible on the
display. For example, to select annotations or spots, they must be displayed on gels.
Nonetheless, when a hidden object is selected, by the means of a report for example, it may be viewed on the screen, but it will immediately disappear once it is unselected again.
Select gels
Selecting gels is much faster and easier. To select one gel, you just need to click on
the gel’s selection banner, the horizontal stripe located at the top of the gel which
contains its name. The action of selecting gels may be done at any time, with any of
Melanie’s tools.
Melanie 3 User Manual
127
A
DIFFERENCES BETWEEN MELANIE II AND MELANIE 3 OR WHERE TO
Landmarks and labels
Landmarks and labels were generalized with the new object Annotation. The object
Landmark is now replaced by the pre-defined label category Landmark. Landmarks
are also used as reference starting points to align gels.
Labels were also replaced by label categories.The pre-defined label category Ac
replaces the Accession Number field from Labels in earlier versions of Melanie, and
it also keeps the main property of being the link to Melanie’s remote database query
engine. The short ID information is held by a category designated ProteinName.
Aligning gels
To be able to perform operations easily and faster in many gels simultaneously, such
as magnifying, moving, etc., an implicit alignment is automatically done when gels
have landmarks with the same names. This alignment calculates corresponding pixels in gels based on the simple interpolation of the two closest landmarks with same
names in gels. This implicit alignment does not replace gel warping needed to compensate deformations on gels and to improve matching. We still encourage users to
align gels before stacking and matching. For this purpose, select gels and choose
View → Align Gels → Align.
Stacking many gels
Earlier versions of Melanie were able to stack two gels to better compare given gel
areas, and to create and visualize pairs. Selecting one gel on the stack immediately
selected the other one.
You may now stack many gels at a time, i.e. display one gel on top of the others,
thus creating a “pile” of gels. By switching from one gel to the other, many new operations may be done on the gels of the stack, such as displaying overlapped spots,
for example. You may also choose to select one, two or many gels in the stack and
operations will be carried out only in these selected gels.
Analyzing data
In Melanie 3, not only the display has changed but also the way to reason about
groups of spots and classes of gels. Anyhow, some operations used to analyze gels
128
Melanie 3 User Manual
SHOW AND SELECT OBJECTS
in Melanie 2.3 or earlier may still be found in Melanie 3, with the difference that
zeros (absent proteins) are taken into calculations:
Differential analysis with classes set: take Analyze → Classes Report. In the
Classes Report dialog, choose Mean (100%) and dispersion (0%). In the displayed
report, choose Ratio in the Display value list. The results will be displayed in the
report and by sorting the values in this column, you may select the most important
group values, according to your own criteria.
Differential analysis without classes set: take Analyze → Groups Report and select
the Range ratio item. Sort the resulting column to enable the selection of the most
important values.
Correspondence analysis without classes set: take Analyze → Groups Report and
select the Correspondence Analysis item. The results will be displayed in the report
and by sorting the values in this column, you may select the most important groups
values for the factorial discrimination.
What happens when you open your old
Melanie files?
When you open a file in Melanie that was created in Melanie 2.3 or earlier, it is converted to a new file format. In this new format, the existing information on the gels is
converted to annotations by using the following rules:
•
•
•
•
•
Landmarks are converted to the category Landmarks;
Landmarks with Pi and Mw are also copied to the category Pi_Mw;
Labels with Accession Numbers are converted to the category Ac;
Labels with short ID are converted to a category called ProteinName.
Gel comments are converted to a category called GelComment. Its label
displays the text “Gel Comment...” and is positioned in the top-left corner on the
gel. By double-clicking on the label, a dialog box shows the comment text.
If you work with Melanie 3 and save the files in the older format (for Melanie 2.3 or
earlier), portions of your work, in particular the new categories of annotations, will
not be retained.
Save As
You may also decide to save files created in Melanie as earlier Melanie versions by
using the command File → Save As and by choosing “MelanieII gel” in the Type
field. In this old format, the existing annotation information is converted by using the
following rules:
• Category Landmarks is converted to Landmarks;
• Category Pi_Mw is converted to Landmarks;
Melanie 3 User Manual
129
A
DIFFERENCES BETWEEN MELANIE II AND MELANIE 3 OR WHERE TO
• Category Ac is converted to Labels with Accession Numbers;
• Category ProteinName is converted to Labels with short ID;
• Category GelComment is converted to the textual comment associated to a
gel;
• All the other existing annotations and labels will not be saved.
130
Melanie 3 User Manual
B
SHORT-CUTS AND
MENU STRUCTURE
The following menus are provided in the melanie software:
• File - to handle whole gels and data on disk (open and close gel images,
save data, print images, import and export data).
• View - to modify the window display (fixed or variable number of cells) and
gels display (stacked, aligned, zoomed, grid lines).
• Edit - to edit (add, modify, delete) specific objects.
• Show - to show or hide specific objects.
• Select - to select specific objects.
• Analyze - to compute differences and similarities among gels (statistical
and artificial intelligence data analysis).
• Reports - to display information on selected objects and to navigate in gels
by means of the data.
• Tools - to create new gel images from selected ones (duplicate, crop, filter
gels, create synthetic gels, flip and scale gels, as well as erase gels).
• Window - to display information and zoom windows, and to list open report
windows.
• Help - to obtain on-line help.
The descriptions of menus and sub-menus may be easily found with the help of the
following tables:
Melanie 3 User Manual
131
B
SHORT-CUTS AND MENU STRUCTURE
Menu structure
Table 10-6. File menu.
Short-cuts
See page
Open ...
Ctrl + O
17
Close
Ctrl + W
20
Raw Image
Load
19
Unload
19
Select Gels with Loaded Image
19
Settings ...
19
Save
All Changes
Ctrl + S
18
Contrast Mapping
18
Calibration
18
Spots
Shift + S
18
Annotations
Alt + S
18
Pairs
Ctrl + Shift + S
18
Save As ...
Revert from File
All Changes
18
Contrast Mapping
18
Calibration
18
Spots
18
Annotations
18
Pairs
18
Images ...
18
Labels ...
68
Annotations...
68
Calibration ...
44
Gel to Clipboard
18
Gel to File
18
Gels Window to Clipboard
18
Gels Window to File
18
Import
Export
19
Page Setup ...
Print
Gels ...
132
Melanie 3 User Manual
19
Table 10-6. File menu.
Short-cuts
Gels Window ...
Exit
See page
19
20
Melanie 3 User Manual
133
B
SHORT-CUTS AND MENU STRUCTURE
Table 10-7. View menu.
Short-cuts
See page
24
Layout Settings ...
Stack
Selected Gels
Ctrl + G
25
Unstack Selected Gels
Ctrl + U
25
Set Stack Reference ...
25
Show Overlapped
27
27
Hide Overlapped
Show Pairs
Ctrl + Shift + Y
27
Hide Pairs
Ctrl + Shift + H
27
Front to Back
Ctrl + F
25
Next
Page Up
25
Previous
Page Down
25
Align Gels
Align ...
31
Unalign
31
Other Alignment ...
31
Show ...
31
Hide
31
Adjust Contrast ...
33
Pseudo Colors ...
35
Grid Lines
Gray Levels
Zoom
In
Shift + Up
28
Out
Shift + Down
28
1/16 ... 32
28
Same Location
27
Move Gels
Up
Ctrl + Up
27
Down
Ctrl + Down
27
Left
Ctrl + Left
27
Right
Ctrl + Right
27
Top Left ... Right
134
Melanie 3 User Manual
27
Table 10-8. Edit menu.
Short-cuts
See page
Gels
Calibrate Intensity
44
Reset Calibration
44
Auto Detect ...
39
Spots
Edit ...
42
Shift + E
42
Copy from Gel
Delete
42
Shift + X
Annotations
55
Add Label ...
Modify ...
Alt + E
59
Copy
Alt + C
59
59
Copy Paired Labels ...
59
Paste Annotations
Paste Labels ...
59
Alt + V
59
Duplicate Labels ...
59
Delete by Category
Delete
Alt + X
59
Link with Spot
Alt + L
59
Unlink from Spot
Alt + U
59
Pairs
Match Annotations ...
81
Auto+Match Gels
80
Add
Ctrl + Shift + L
81
Delete
Ctrl + Shift + U
81
Groups
86
Set Reference Gel ...
Group Spots
Shift + G
86
Ungroup Spots
Shift + U
86
Classes
Preferences
Add to Class ...
101
Remove from Class
101
...
36
Melanie 3 User Manual
135
B
SHORT-CUTS AND MENU STRUCTURE
Table 10-9. Show menu.
Short-cuts
See page
Only Selected
Ctrl + Z
23
Hide Selected
Ctrl + H
23
Show All
Ctrl + Y
23
Gels
Sorted by Name
23
Sorted by Classes
23
Spots
Shape
Crossed
Shift + 6
45
Outlined
Shift + 7
45
Filled
Shift + 8
45
Show All
Shift + Y
45
Hide All
Shift + H
45
45
In Region
Only Selected
Shift + Z
45
Hide Selected
45
Show ID
45
Hide All ID
45
Set Color
46
Annotations
Show All
Alt + Y
64
Hide All
Alt + H
64
In Region
64
For Spots
64
Only Selected
Alt + Z
64
Hide Selected
64
Visible Categories ...
64
Hidden Categories ...
64
Pack Categories ...
64
Unpack Categories ...
64
Linked Data
64
Set Color
66
Show ID
86
Hide All ID
86
Groups
136
Melanie 3 User Manual
Table 10-10. Select menu.
Short-cuts
See page
Gels
21
By Name
Visible
Ctrl + A
21
Aligned
21
Stacked
21
All
21
Inverse Selection
21
For Groups
21
For Classes ...
21
By ID
46
By Color
46
Only Gaussians
46
In Region
46
From Report File ...
46
Spots
All
Shift + A
46
Restrict by Value ...
47
Inverse Selection
46
By Content ...
60
By Category ...
60
By MS
62
Combine
63
Annotations
Intersection ...
63
Union ...
63
Difference ...
63
Exclusion ...
63
By Color
60
Common Labels ...
63
In Region
63
From Report File ...
63
All
Alt + A
63
60
Inverse Selection
Pairs
For Spots
Ctrl + Shift + M
82
Melanie 3 User Manual
137
B
SHORT-CUTS AND MENU STRUCTURE
Table 10-10. Select menu.
All
Short-cuts
See page
Ctrl + Shift + A
82
Bad Pairs ...
82
Multiple Pairs
82
By ID ...
87
For Spots
87
Groups
All Groups
Select All
Unselect All
138
Melanie 3 User Manual
Shift + M
87
Restrict Selection ...
87
Inverse Selection
87
Table 10-11. Analyze and Reports menus.
Menu
Short-cuts
See page
Analyze
Groups Report ...
96
Groups Histograms ...
93
Scatters Plot
88
Classes Report ...
107
Classes Histograms ...
104
Statistical Tests ...
108
Heuristic Clustering
99
Do Clustering ...
99
Report ...
99
Plot ...
99
Reports
Gels Report ...
37
Spots Report
49
Current
49
Labels Report ...
67
Annotations Report ...
67
Categories Report ...
67
Pairs Report
83
Matches Report
83
All Matches Report ...
83
Melanie 3 User Manual
139
B
SHORT-CUTS AND MENU STRUCTURE
Table 10-12. Tools menu.
Shortcuts
See
page
Gels
Crop ...
121
Duplicate ...
121
Erase ...
121
124
Flip
Horizontally ...
124
Vertically ...
124
Both Directions ...
124
121
Filter Image
Smooth ...
121
Histogram Equalization ...
121
Remap Gray Levels
...
121
Contrast Enhancement ...
121
Filter Background ...
121
Morphological Filters
...
121
Scale By ...
124
Rotate ...
124
Invert Gray Levels ...
124
119
Create
Synthetic
Gels ...
Database
Settings ...
114
Load Protein Name from
Swiss-2D
115
Load Swiss-2D Serial Number
115
Toolbar
140
Melanie 3 User Manual
Hand
Ctrl + 1
Magnify
Ctrl + 2
Region
Ctrl + 3
Spot
Ctrl + 4
Annotation
Ctrl + 5
Table 10-13. Window and Help menus.
Shortcuts
Menu
See page
Window
Zoom
29
Information
47
Help
User Manual ...
Index ...
Tutorial ...
About Melanie
Melanie 3 User Manual
141
B
SHORT-CUTS AND MENU STRUCTURE
Gels handling
Table 10-14.
142
Short-Cut
Menu Command
Ctrl+A
Select → Gels → Visible
Ctrl+F
View → Stack → Front to Back
Ctrl+G
View → Stack → Selected Gels
Ctrl+H
Show → Gels → Hide Selected
Ctrl+O
File → Open
Ctrl+S
File → Save
Ctrl+U
View → Stack → Unstack Selected Gels
Ctrl+W
File → Close
Ctrl+Y
Show → Gels → All
Ctrl+Z
Show → Gels → Only Selected
Ctrl+Up
View → Move Gels → Up
Ctrl+Down
View → Move Gels → Down
Ctrl+Left
View → Move Gels → Left
Ctrl+Right
View → Move Gels → Right
Ctrl+1
Tools → Toolbar → Hand
Ctrl+2
Tools → Toolbar → Magnify
Ctrl+3
Tools → Toolbar → Region
Ctrl+4
Tools → Toolbar → Spot
Ctrl+5
Tools → Toolbar → Annotation
PageUp
View → Stack → Next
PageDown
View → Stack → Previous
Shift+Up
View → Zoom → In
Shift+Down
View → Zoom → Out
Melanie 3 User Manual
Spots handling
Table 10-15.
Short-Cut
Menu Command
Shift+A
Select → Spots → All
Shift+G
Edit → Groups → Group Spots
Shift+H
Show → Spots → Hide All
Shift+M
Select → Groups → For Spots
Shift+O
File → Open
Shift+S
File → Save → Spots
Shift+U
Edit → Groups → Ungroup Spots
Shift+X
Edit → Spots → Delete
Shift+Y
Show → Spots → Show All
Shift+Z
Show → Spots → Only Selected
Shift+1
Show → Spots → Shape → Crossed
Shift+2
Show → Spots → Shape → Outlined
Shift+3
Show → Spots → Shape → Filled
Shift+4
Show → Spots → Set Color → Purple
Shift+5
Show → Spots → Set Color → Orange
Shift+6
Show → Spots → Set Color → Brown
Shift+7
Show → Spots → Set Color → Default
Melanie 3 User Manual
143
B
SHORT-CUTS AND MENU STRUCTURE
Annotations handling
Table 10-16.
Short-Cut
Menu Command
Alt+A
Select → Annotations → All
Alt+C
Edit → Annotations → Copy
Alt+E
Edit → Annotations → Modify
Alt+H
Show → Annotations → Hide All
Alt+L
Edit → Annotations → Link with Spot
Alt+S
File → Save → Annotations
Alt+U
Edit → Annotations → Unlink from Spot
Alt+V
Edit → Annotations → Paste Labels
Alt+X
Edit → Annotations → Delete Annotations
Alt+Y
Show → Annotations → Show All
Alt+Z
Show → Annotations → Only Selected
Pairs handling
Table 10-17.
144
Short-Cut
Menu Command
Ctrl+Shift+A
Select → Pairs → All
Ctrl+Shift+H
View → Stack → Hide Pairs
Ctrl+Shift+L
Edit → Pairs → Add
Ctrl+Shift+M
Select → Pairs → For Spots
Ctrl+Shift+S
File → Save → Pairs
Ctrl+Shift+U
Edit → Pairs → Delete
Ctrl+Shift+Y
View → Stack → Show Pairs
Melanie 3 User Manual
C
KNOWN BUGS
If you are using Melanie with a graphics display set to 256 colors, you may feel
that the colors are badly displayed.
If printed reports are truncated, you may change the paper orientation to landscape in the printer set-up.
Directories cannot be destroyed when a Explorer window has their names displayed.
Accentuated characters are not correctly supported by the english API.
Melanie 3 User Manual
145
C
146
KNOWN BUGS
Melanie 3 User Manual
D
REFERENCES
The Melanie project
1.
The Melanie II 2-DE analysis software WWW page:
http://www.expasy.ch/melanie/
2. Appel R.D. and Hochstrasser D.F. Computer Analysis of 2-D Images. In: Methods in Molecular Biology, Vol 112: 2-D Protocols for Proteome Analysis, A.J. Link
(Eds), Humana Press Inc., Totowa NJ, 1998, pp 363-381.
3. Appel, R.D., Palagi, P.M., Walther, D., Vargas, J.R., Sanchez, J.C., Ravier, F.,
Pasquali, C., Hochstrasser, D.F. MelanieII: a third generation software package for
analysis of two-dimensional electrophoresis images - I. Features and user interface.
Electrophoresis 1997, 18, 2724-2734.
4. Appel, R.D., Vargas, J.R., Palagi, P.M., Walther, D., Hochstrasser, D.F. MelanieII: a third generation software package for analysis of two-dimensional electrophoresis images - II. Algorithms. Electrophoresis. 1997, 18, 2735-2748.
5. Vargas R.J. Two-dimensional gel electrophoresis computer analysis systems:
from image acquisition to protein identification. Ph.D. thesis, Faculty of science,
Geneva University, 1996.
6. Wilkins M.C., Hochstrasser D.F., Sanchez J.C., Bairoch A., Appel R.D. Integrating two-dimensional gel databases using the Melanie II software. Trends in Biochemical Sciences TiBS 1996, December (252), 21(12), pp. 496-497.
7. Appel R.D., Bologna G., Hochstrasser D.F. Classification tools for diagnostic
rule formation from protein maps. Proc. MIE’93, 11th International Congress of the
European Federation for Medical Informatics, Jerusalem, April 18-22, 1993, 40-44.
8. Appel R.D., Hochstrasser D.F., Funk M., Vargas R.J., Pellegrini C., Muller A.F.,
Scherrer J-R. The MELANIE project - From a Biopsy to Automatic Protein Map
Interpretation by Computer. Electrophoresis 1991, 12, 722-735.
Melanie 3 User Manual
147
D
9. Appel R.D., Hochstrasser D.F., Roch C., Funk M., Muller A.F., Pellegrini C.,
Automatic classification of two-dimensional gel electrophoresis pictures by heuristic
clustering analysis: A step toward machine learning. Electrophoresis. 1988, 9, 136142.
10. Pun T., Hochstrasser D.F., Appel R.D., Funk, M., Villars-Augsburger, V., Pellegrini C. Computerized classification of two-dimensional gel electrophoretograms by
correspondence analysis and ascendant hierarchical clustering. Applied and Theoretical Electrophoresis 1988, 1, 3-9 .
11. Armitage P., Berry G. Statistical Methods and Medical Research. Blackwell Scientific Publications. Oxford, London, 1987.
12. Miller M.J., Olson A.D., Thorgeirsson S.S. Computer analysis of two-dimensional gels: Automatic matching. Electrophoresis 1984, 5, 297-303.
Two-dimensional electrophoresis (2-DE)
13. 2-D PAGE protocols:
http://www.expasy.ch/ch2d/protocols/
14. Link, A. J. (Editor) 2-D Protocols for Proteome Analysis. Methods in Molecular
Biology, Vol 112. Humana Press Inc., Totowa NJ, 1998.
15. Herbert B.R., Sanchez J.-C., Bini L. Two-Dimensional Electrophoresis: The
State of the Art and Future Directions. In: Proteome research: new frontiers in functional genomics, M.R. Wilkins, K.L. Williams, R.D. Appel, D.F. Hochstrasser (Eds),
Springer Verlag, 1997.
2-DE databases
16. The SWISS-2DPAGE 2-DE database:
http://www.expasy.ch/ch2d/
17. WORLD-2DPAGE: index to federated 2-DE databases:
http://www.expasy.ch/ch2d/2d-index.html
18. Hoogland C., Sanchez J.C., Bairoch A., Hochstrasser D.F., Appel R.D. The
SWISS-2DPAGE database: what has changed during the last year. Nucleic Acids
Res. 1999, 27, 289-291.
19. Appel R.D., Bairoch A. and Hochstrasser D.F. 2-D Databases on the WWW. In:
Methods in Molecular Biology, Vol 112: 2-D Protocols for Proteome Analysis, A.J.
Link (Eds), Humana Press Inc., Totowa NJ, 1998, pp 383-391.
20. Appel R.D., Hoogland C., Bairoch A. and Hochstrasser D.F. Constructing a 2-D
Database for the WWW. In: Methods in Molecular Biology, Vol 112: 2-D Protocols for
Proteome Analysis, A.J. Link (Eds), Humana Press Inc., Totowa NJ, 1998, pp 411416.
148
Melanie 3 User Manual
21. Tonella L., Ou K., Sanchez J.-C., Frutiger S., Appel R.D., Bairoch A., Walsh
B.J., Yan J.X., Tyler M., Hoogland C., Rouge V., Morsch f.S., Gooley A.A., Hughes
G.J., Williams K.L., Hochstrasser D.F. ‘97 Escherichia coli SWISS-2DPAGE database update. Electrophoresis 1998, 19, 1960-71.
22. Appel R.D. Interfacing and Integrating Databases. In: Proteome research: new
frontiers in functional genomics, M.R. Wilkins, K.L. Williams, R.D. Appel, D.F. Hochstrasser (Eds), Springer Verlag Berlin Heidelberg, 1997, pp 149-175.
23. Hoogland C., Baujard V., Sanchez J.-C., Hochstrasser D.F., Appel R.D.
Make2ddb: a simple package to set up a 2-DE database on the WWW. Electrophoresis 1997, 18, 2755-2758.
24. Peitsch, M.R., Wilkins M.R., Tonella T., Sanchez J.C., Appel R.D., Hochstrasser
D.F. Large-scale protein modelling and integration with the SWISS-PROT and
SWISS-2DPAGE databases: The example of Escherichia coli. Electrophoresis
1997, 18, 498-501.
25. Appel R.D., Bairoch A., Sanchez J.C., Vargas J.R., Golaz O., Pasquali C.,
Hochstrasser D.H. Federated 2-DE database: a simple means of publishing 2-DE
data. Electrophoresis 1996, 17, 540-546.
26. Appel R.D., Sanchez J-C., Bairoch A., Golaz O., Ravier F., Pasquali C., Hughes
G.J., Hochstrasser D. The SWISS-2DPAGE database of two-dimensional polyacrylamide gel electrophoresis. Nucleic Acids Research, 1996, 22(17), 3581-3582.
27. Pasquali C., VanBogelen R.A., Wilkins M., Frutiger S., Appel R.D., Vargas R.,
Sanchez J.C., Hochstrasser D.F. The ESCHERICHIA COLI SWISS-2DPAGE database. Electrophoresis 1996, 17, 547-555.
28. Sanchez J.C., Golaz O., Frutiger S., Schaller D., Appel R.D., Bairoch A.,
Hughes G.J., Hochstrasser D.F. The YEAST SWISS-2DPAGE database. Electrophoresis 1996, 17, 556-565.
29. Gravel P., Sanchez J.C., Walzer C., Golaz O., Hochstrasser D.F., Balant L.P.,
Hughes G.J., Garcia-Sevilla J., Guimon J. Human blood platelet protein map established by two-dimensional polyacrylamide gel electrophoresis. Electrophoresis
1995, 16, 1152-1159.
30. Sanchez J.-C., Appel R.D., Golaz O., Pasquali C., Ravier F., Bairoch A., Hochstrasser D.F. Inside SWISS-2DPAGE database. Electrophoresis 1995, 16, 11311151.
31. Appel R.D., Sanchez J.C., Bairoch A., Golaz O., Miu M., Pasquali C., Vargas
R.J., Hughes G., Hochstrasser D.F. SWISS-2DPAGE: a database of two-dimensional gel electrophoresis images. Electrophoresis 1993, 14, 1232-1238.
32. Golaz, O., Hughes, G.J., Frutiger, S., Paquet, N., Bairoch, A., Pasquali, C.,
Sanchez, J.-C., Tissot, J.-D., Appel, R.D., Walzer, C., Balant, L., Hochstrasser, D.F.
Plasma & Red Blood Cell Protein Maps: The 1993 Update. Electrophoresis 1993,
14, 1223-1231.
33. Hughes, G.J., Frutiger, S., Paquet, N., Pasquali, C., Sanchez, J-C., Tissot, J.D.,
Bairoch, A., Appel, R.D., Hochstrasser, D.F. Human Liver Protein Map: The 1993
Update. Electrophoresis 1993, 14, 1216-1222.
Melanie 3 User Manual
149
D
Proteome and ExPASy
34. The ExPASy WWW server:
http://www.expasy.ch/
35. Wilkins M.R., Williams K.L., Appel R.D., Hochstrasser, D.F. (Editors). Proteome
research: new frontiers in functional genomics. Springer Verlag Berlin Heidelberg
1997.
36. Binz P.-A., Müller M., Walther D., Bienvenut W.V., Gras R., Hoogland C.,
Bouchet G., Gasteiger E., Fabbretti R., Gay S., Palagi P., Wilkins M.R., Rouge V.,
Tonella L., Paesano S., Rossellat G., Karmime A., Bairoch A., Sanchez J.-C., Appel
R.D., Hochstrasser D.F. A Molecular Scanner to Highly Automate Proteomic
Research and to Display Proteome Images. Analytical Chemistry, Vol. 71, 1999.
37. Hoogland C., Sanchez J.-C., Walther D., Baujard V., Baujard O., Tonella L.,
Hochstrasser D.F., Appel R.D. Two-dimensional electrophoresis resources available
from ExPASy. Electrophoresis 1999, in press.
38. Gras, R., Müller M., Gay S., Gasteiger E., Binz P.-A., Bienvenut W., Hoogland
C., Sanchez, J.-C., Bairoch, A., Hochstrasser D.F., Appel R.D. Improving protein
identification from peptide mass fingerprinting through a parameterized multi-level
scoring algorithm and optimized peak detection. Electrophoresis 1999, in press.
39. Gay S., Binz P.-A., Hochstrasser D.F., Appel R.D. Modeling peptide mass fingerprinting data using the atomic composition of peptides. Electrophoresis 1999, in
press.
40. Binz P.A., Wilkins M.R., Gasteiger E., Bairoch A., Appel R.D., Hochstrasser D.F.
Internet Resources for Protein Identification and Characterization. In: Microcharacterization of Proteins, R. Kellner, F. Lottspeich, H.E. Meyer (Eds), Wiley-VCH, 2nd
ed., 1999, 277-300.
41. Wilkins M.R., Gasteiger E., Bairoch A., Sanchez J.C., Williams K.L., Appel
R.D., Hochstrasser D.F. Protein Identification and Analysis Tools in the ExPASy
Server. In: Methods in Molecular Biology, Vol 112: 2-D Protocols for Proteome Analysis, A.J. Link (Eds), Humana Press Inc., Totowa NJ, 1998, pp 531-552.
42. Wilkins M.R., Gasteiger E., Tonella L., Ou K., Tyler M., Sanchez J.-C., Gooley
A.A., Walsh B.J., Bairoch A., Appel R.D., Williams K.L., Hochstrasser D.F. Protein
identification with N- and C-terminal sequence tags in proteome projects. Journal of
Molecular Biology 1998, 278(3), 599-608.
43. Wilkins, M.R., Gasteiger, E., Wheeler, C., Lindskog, I., Sanchez, J.-C., Bairoch,
A., Appel, R.D., Dunn, M.D., Hochstrasser, D.F. Multiple parameter cross-species
mprotein identification using MultiIdent - a world-wide web accessible tool. Electrophoresis 1998, 19, 13199-3206.
44. Sanchez J.C., Wilkins M., Appel R.D., Hochstrasser D.F. Identifying Proteins for
Proteome Studies. In: Protein Function: a practical approach (second edition), E.T.
Creighton (Ed.), IRL Press 1997, pp. 1–27.
45. Wilkins M.R., Lindskog I., Gasteiger E, Bairoch A., Sanchez J.C., Hochstrasser
D.F., Appel R.D. Detailed peptide characterization using PeptideMass - a WorldWide Web accessible tool. Electrophoresis 1997, 18, 403-408.
46. Hochstrasser D.F., Appel R.D., Golaz O., Pasquali C., Sanchez J.-C., Bairoch A.
Sharing of Worldwide Spread Knowledge Using Hypermedia Facilities & Fast Communications Protocols (Mosaic & World-Wide Web): The Example of ExPASy. Meth.
Inform. Med., 1995, 34: 75-78.
150
Melanie 3 User Manual
47. Appel R.D., Bairoch A., Hochstrasser D.F. A new generation of information
retrieval tools for biologists: the example of the expasy WWW server. Trends in Biochemical Sciences TiBS June 1994 (222), 19(6), pp. 258-260.
Melanie 3 User Manual
151
D
152
Melanie 3 User Manual
E
TECHNICAL
SUPPORT
Bio-Rad provides technical support on the features of the Melanie software.
The staff of Bio-Rad is receptive to your suggestions. Many of the new features
and enhancements in this version of Melanie are a direct result of conversations with customers, biologists and proteomics scientists. If you have any suggestions, problems or questions on the use of the features, please contact your
local Bio-Rad office, or in the U.S. call Bio-Rad Technical Service at 1-8004BIORAD (1-800-424-6723). Please report any reproducible software problems
to Bio-Rad Laboratories.
Melanie 3 User Manual
153
E
154
TECHNICAL SUPPORT
Melanie 3 User Manual
INDEX
A
accession number (AC) ....................53
adaptive gradations
histogram on groups .....................95
histograms on classes ...................105
histograms on classes+groups ......107
adding
annotations ....................................55
labels .............................................55
pairs ..............................................81
spots ..............................................42
adjusting contrast .............................33
in real time .....................................34
aligning
gels ................................................31
special alignments .........................32
Analyze
Classes Histograms ......................104, 105
Classes Report .............................105, 107
Groups Histograms .......................93
Groups Report ..............................96
Heuristic Clustering
Do Clustering ...........................99
Plot ..........................................100
Report ......................................100
Scatters Plot ..................................89
Statistical Tests .............................108
annotation tool ..................................60
annotations .......................................8, 53
adding ...........................................55
as starting pairs .............................81
coloring .........................................66
copying ..........................................59
creating .........................................55
definition ........................................8
deleting ..........................................59
editing ........................................... 59
importing ....................................... 68
modifying ...................................... 59
moving .......................................... 59
moving tags .................................. 59
pasting .......................................... 59
reporting ....................................... 67
selecting ........................................ 60
showing ......................................... 64
C
calibrating
spots ............................................. 44
calibration plot .................................. 45
calibration report .............................. 45
categories
Ac .................................................. 53
adding ........................................... 56
Comment ...................................... 54
creating ......................................... 56
Landmarks .................................... 53
Pi_Mw ........................................... 54
reporting ....................................... 67
Sets ............................................... 54, 56
classes ............................................. 9, 101
definition ....................................... 9
gels report ..................................... 94, 104
histograms .................................... 104, 108
overlapping measures .................. 102
report ............................................ 104
reporting ....................................... 107
classes+groups
histograms .................................... 105
closing gels ...................................... 20
coefficient of dispersion .................... 96
coefficient of variation ...................... 96
coloring
Melanie 3 User Manual
155
annotations ................................... 66
spots ............................................. 46
contextual
menus ........................................... 5
contrast
adjusting contrast .......................... 33
adjusting contrast in real time ....... 34
correlation coefficient ....................... 88
correspondence analysis
groups ........................................... 97
corresponding location ..................... 27, 59
creating
annotations ................................... 55
categories ..................................... 56
classes .......................................... 101
groups as starting pairs ................ 81
Sets ............................................... 56
starting pairs ................................. 80
synthetic gels ................................ 119
cropping gels .................................... 121
cursor information ............................. 47
D
data analysis
kolmogorov test ............................. 109
student t-test ................................. 108
wilcoxon test ................................. 109
database ........................................... 113
2-DE databases ............................ 113
accessing remote databases ........ 114
accession number (AC) ................ 53
browser ......................................... 3
labels for ....................................... 113
loading labels ................................ 116
private database ........................... 113
querying the database .................. 115
remote database ........................... 113
setting the browser ........................ 114
setting the database ...................... 114
SWISS-2DPAGE master gels ....... 115
SWISS-2DPAGE serial numbers .. 116
deleting
annotations ................................... 59
gels ............................................... 121
groups ........................................... 86
labels ............................................. 59
pairs .............................................. 81
spots ............................................. 43
detecting
spots ............................................. 39
spots in region ............................... 41
display order
gels ............................................... 24
displaying
gels ............................................... 22
grid lines ........................................ 31
pseudo colors ................................ 35
duplicating gels ................................. 121
E
Edit
Annotations
Add Label ................................ 55, 56
156
Melanie 3 User Manual
Copy ........................................ 59, 60
Copy Paired Labels ................. 60
Delete ...................................... 59
Delete by Category ................. 59
Duplicate Labels ..................... 60
Link with Spot .......................... 55
Modify ..................................... 59
Paste Annotations ................... 59
Paste Labels ........................... 60
Unlink with Spot ...................... 55
Classes
Add to Class ............................ 101
Remove from Class ................ 102
Gels
Calibrate Intensity ................... 45
Reset Calibration .................... 45
Groups
Group Spots ............................ 86
Set Reference Gel .................. 86
Ungroup Spots ........................ 86
Pairs
Add .......................................... 81
Auto-Match Gels ..................... 80
Delete ...................................... 81
Match Annotations .................. 81
Preferences
Cursor Information .................. 37, 48
Database ................................. 37, 57, 114
Grid Preferences ..................... 37
Raw Image .............................. 36
Spots
Add From Gel .......................... 43
Auto-Detect ............................. 39
Delete ...................................... 43
Edit .......................................... 43
editing
annotations ................................... 59
groups ........................................... 86
labels ............................................ 59
pairs .............................................. 80
spots ............................................. 39
erasing gels ...................................... 121
exiting Melanie ................................. 20
exporting
histograms .................................... 71
Melanie images ............................ 18
reports .......................................... 71
F
federated 2-DE database ................. 114
File
Close ............................................ 20
Exit ................................................ 20
Export
Gel Region to Clipboard .......... 19
Gel to File ................................ 19
Gels Window to Clipboard ...... 19
Gels Window to File .................19
Import
Annotations .............................68
Calibration ...............................45
Images .....................................18
Labels ......................................68
Open .............................................17
Page Setup ...................................19
Print
Gels .........................................19
Gels Window ...........................19
Raw Image
Load ........................................20
Select Gels with Loaded Image 20
Settings ...................................20
Unload .....................................20
Revert from File .............................18
Save ..............................................18
Save As .........................................18
file format
opening foreign image formats ......18
opening Melanie images ...............17
filtering gels ......................................121
fitting report ......................................45
flipping gels .......................................124
G
Gaussian spots .................................44
gels ...................................................7
aligning ..........................................31
closing ...........................................20
cropping ........................................121
definition ........................................7
deleting ..........................................121
display order ..................................24
displaying ......................................22
displaying grid lines .......................31
displaying information ...................47
duplicating .....................................121
erasing ..........................................121
exporting .......................................18
filtering ..........................................121
flipping ...........................................124
inverting grey levels .......................124
layout .............................................22
loading ...........................................19
matching ........................................79
moving ...........................................27
opening .........................................17
printing ..........................................19
reference gel .................................31, 79, 85
reporting ........................................37
reverting save ................................18
rotating ..........................................124
saving ............................................18
scaling ...........................................124
selecting ........................................21
showing .........................................23
stacking .........................................25
unaligning ......................................32
unloading .......................................19
zooming ........................................ 28
gels report to classes ....................... 104
gray offset ......................................... 45
gray slope ......................................... 45
green objects .................................... 10
grid lines over gels ........................... 31
groups .............................................. 8, 85
coefficient of dispersion ................ 96
coefficient of variation ................... 96
correspondence analysis .............. 97
creating groups by matching ......... 85
definition ....................................... 8
deleting ......................................... 86
editing ........................................... 86
ID .................................................. 85
in matched gels ............................. 79
range ratio ..................................... 96
reporting ....................................... 94, 96
restriction ...................................... 87
selecting ........................................ 87
separability .................................... 97
showing ......................................... 86
histograms ............................... 93
spots report ................................... 98
statistics ........................................ 90
ungrouping .................................... 86
with multiple pairs ......................... 85
groups report for classes .................. 104
H
hand symbol. See manual.
hand tool .......................................... 27
hardware requirements .................... 2
Help
Index ............................................. 6
User Manual ................................. 6
help (on-line) .................................... 5, 6, 131
hidden gels zonea ............................ 6
histograms ........................................ 69
classes .......................................... 104, 108
classes+groups ............................. 105
exporting ....................................... 71
groups ........................................... 93
printing .......................................... 71
saving ........................................... 71
selecting groups ............................ 72
I
images
importing ....................................... 18
importing
annotations ................................... 68
foreign image formats ................... 18
labels ............................................ 68
installation ........................................ 2
interface ........................................... 4
Internet
accessing remote databases ........ 113, 114
querying the database .................. 115
setting the browser ....................... 114
setting the database ..................... 114
inverting grey levels .......................... 124
Melanie 3 User Manual
157
K
kolmogorov test
data analysis ................................. 109
gels ............................................... 27
stacked gels ............................ 26
multiple pairs .................................... 80
L
labels ................................................ 53
AC ................................................. 53
accessing remote databases ........ 53, 113
adding ........................................... 55
Comment ...................................... 54
creating ......................................... 55
deleting ......................................... 59
editing ........................................... 59
importing ....................................... 68
Landmark ...................................... 53
modifying ....................................... 59
Pi_Mw ........................................... 54
reporting ........................................ 67
selecting ........................................ 60
Sets ............................................... 54
showing ......................................... 64
licence .............................................. 3
loading gels ...................................... 19
loading protein name ........................ 116
O
objects .............................................. 7
annotations ................................... 8
classes .......................................... 9
gels ............................................... 7
groups ........................................... 8
pairs .............................................. 8
regions .......................................... 7
spots ............................................. 8
opening gels
foreign image formats ................... 18
Melanie format .............................. 17
organizing
reports .......................................... 76
outliers ............................................. 98
overlapping measures for classes .... 102
M
magnify glass ................................... 29
magnify tool ...................................... 28
manual .............................................. 1
on-line help ................................... 5, 6, 131
mass spectrometry ........................... 62
master gels
loading labels ................................ 116
SWISS-2DPAGE masters ............. 115
match ms data .................................. 62
matching ........................................... 79
aligned gels ................................... 80
automatic matching ....................... 80
creating groups ............................. 79, 85
ms spectrum ................................. 62
starting pairs ................................. 80
using annotations for matching ..... 81
melanie format .................................. 18
menus ............................................... 4
Analyze ......................................... 4, 131
contextual ...................................... 5
Edit ................................................ 4, 131
File ................................................ 4, 131
Help ............................................... 5, 131
Report ........................................... 4, 131
Select ............................................ 4, 131
Show ............................................. 4, 131
Tools .............................................. 5, 131
View .............................................. 4, 131
Window ......................................... 5, 131
modifying
annotations ................................... 59
groups ........................................... 86
labels ............................................. 59
spots ............................................. 39, 42
moving
annotations ................................... 59
annotations tags ............................ 59
158
Melanie 3 User Manual
P
pairs ................................................. 8
definition ....................................... 8
editing ........................................... 80
reporting ....................................... 83
selecting ....................................... 82
showing ........................................ 81
pixels information ............................. 47
preferences
browser ......................................... 114
cursor information ......................... 36
database ....................................... 36, 114
grid lines ....................................... 36
raw image ..................................... 36
printing
gels ............................................... 19
histograms .................................... 71
regions .......................................... 19
reports .......................................... 71
window .......................................... 19
pseudo colors ................................... 35
Q
quantifying spots .............................. 44
R
range ratio ........................................ 96
reference gels .................................. 79
reference gels zone .......................... 6
region tool ........................................ 21
regions ............................................. 7
printing .......................................... 19
Reports
All Matches ................................... 83
Annotations ................................... 68
Categories .................................... 67
Gels .............................................. 37
Groups .......................................... 96
Labels ........................................... 67
Matches ........................................ 83
Pairs .............................................. 83
Spots ............................................ 50
Current ....................................49
reports ..............................................69
all matches ....................................83
exporting .......................................71
on annotations ...............................67
on categories ................................67
on classes .....................................104, 107
on gels ...........................................37
on groups ......................................94, 96
on labels ........................................67
on matches ....................................83
on ms spectrum match ..................63
on pairs .........................................83
on spots .........................................49
organizing ......................................76
printing ..........................................71
saving ............................................71
selecting objects ............................72
sorting data ...................................74
restricting groups ..............................87
reverting gels ....................................18
rotating gels ......................................124
running Melanie ................................3
S
saving
foreign image formats ...................18
histograms .....................................71
Melanie images .............................18
reports ...........................................71
reverting ........................................18
scaling gels .......................................124
scatters plot ......................................88
fitting report ...................................90
scatter report .................................90
Select
Annotations
All ............................................61
By Category .............................62
By Color ...................................61
By Content ...............................61
By MS ......................................63
Combine
Difference ....................63
Exclusion .....................63
Intersection .................63
Union ...........................63
Common Labels ......................63
From Report File .....................62
In Region .................................61
Inverse Selection .....................62
Gels
Aligned ....................................21
All ............................................21
By Name ..................................21
For Classes .............................21
For Groups ..............................21
Inverse Selection .....................21
Stacked ....................................21
Visible ...................................... 21
Groups
All ............................................ 87
By ID ....................................... 87
For Spots ................................. 87
Inverse Selection ..................... 87
Restrict Selection .................... 87
Pairs
All ............................................ 82
Bad Pairs ................................. 82
For Spots ................................. 82
Multiple Pairs ........................... 82
Spots
All ............................................ 46
By Color .................................. 46
By ID ....................................... 46
From Report File ..................... 46
In Region ................................. 46
Inverse Selection ..................... 47
Only Gaussians ....................... 46
Restrict by Value ..................... 47
selecting
annotations ................................... 60
from histograms
groups ..................................... 72
from report
annotations .............................. 62
gels .......................................... 21
groups ..................................... 87
labels ....................................... 60
objects ..................................... 72
pairs ........................................ 82
spots ........................................ 47
gels ............................................... 21
groups ........................................... 87
labels ............................................ 60
pairs .............................................. 82
spots ............................................. 46
stacked gels .................................. 26
separability for groups ...................... 97
serial numbers .................................. 116
Sets
creating ......................................... 56
setting preferences ........................... 36
shortcuts .......................................... 5
Show
Annotations
For Spots ................................. 64
Hidden Categories .................. 65
Hide All .................................... 64
Hide Selected .......................... 64
In Region ................................. 64
Linked Data ............................. 66, 115
Only Selected .......................... 64
Pack Categories ...................... 66
Set Color
Default ........................ 66
Melanie 3 User Manual
159
Reset All ..................... 66
Set Colors ............................... 66
Show All .................................. 64
Unpack Categories .................. 66
Visible Categories ................... 64
Gels
Hide Selected .......................... 24
Only Selected .......................... 24
Show All .................................. 24
Sorted by Classes ................... 24
Sorted by Name ...................... 24
Groups
Hide All ID ............................... 86
Show ID ................................... 86
Spots
Hide All .................................... 45
Hide All ID ............................... 46
Hide Selected .......................... 46
In Region ................................. 46
Only Selected .......................... 46
Set Color ................................. 46
Default ........................ 46
Reset All ..................... 46
Shape ...................................... 45
Show All .................................. 45
Show ID ................................... 46
showing
annotations ................................... 64
circularity ....................................... 49
gels ............................................... 23
groups ........................................... 86
labels ............................................. 64
pairs .............................................. 81
spots ............................................. 45
single pairs ....................................... 80
smoothing
smooth filters ................................. 122
when detecting spots .................... 40
software requirements ...................... 2
sort by similarity
histograms on groups ................... 95
sorted values
histograms on classes .................. 105
histograms on classes+groups ..... 106
histograms on groups ................... 95
sorting data
reports ........................................... 74
spot tool ............................................ 46
spots ................................................. 39
adding ........................................... 42
adding from gel ............................. 43
adjusting detection parameters in real time 42
calibrating ...................................... 44
coloring ......................................... 46
definition ........................................ 8
detecting ....................................... 39
detecting in region ......................... 41
detection parameters .................... 40
editing ........................................... 39
160
Melanie 3 User Manual
gaussian ....................................... 44
ID .................................................. 8, 39
modifying ...................................... 42
quantifying .................................... 44
reports .......................................... 49
for groups ................................ 98
templates ................................ 50
selecting ....................................... 46
showing ........................................ 45
stacked gels
selecting ....................................... 26
stacking gels .................................... 25
statistical tests .................................. 108
statistics
central tendency ........................... 90
dispersion ..................................... 90
groups ........................................... 90
half-range size .............................. 92
mean ............................................. 91
mean absolute deviation ............... 92
mean squared deviation ............... 91
midrange ....................................... 91
reference gel values ..................... 91
significance levels ......................... 108
status bar ......................................... 5
student t-test
data analysis ................................. 108
SWISS-2DPAGE
master gels ................................... 115
serial numbers .............................. 116
SWISS-PROT .................................. 115
synthetic gels ................................... 119
T
templates
spots report .................................. 50
Tools
Create Synthetic Gel .................... 119
Database
Load Protein Name from Database 116
Load Swiss-2D Serial Number 117
Settings ................................... 114
Gels .............................................. 119
Crop ........................................ 121
Duplicate ................................. 121
Erase ....................................... 121
Filter Image ............................. 122
Flip .......................................... 124
Invert Gray Levels ................... 124
Rotate ..................................... 124
Scale By .................................. 124
tools ................................................. 6
U
unaligning gels ................................. 32
ungroup spots .................................. 86
unloading gels .................................. 19
V
View
Align Gels
Align ........................................32
Other Alignment ......................32
Unalign ....................................32
Gray Levels
Adjust Contrast ........................34, 35
Pseudo Colors .........................35
Grid Lines
Hide .........................................31
Show ........................................31
Layout Settings ..............................24
Move Gels .....................................28
Same Location ........................28
Stack
Front To Back ...........................26
Hide Overlapped .....................27
Hide Pairs ................................27, 81
Next .........................................26
Previous ...................................26
Selected Gels ..........................25
Set Stack Reference ............... 26
Show Overlapped .................... 27
Show Pairs .............................. 27, 81
Unstack Selected Gels ............ 26
Zoom ............................................. 29
W
wilcoxon test
data analysis ................................. 109
Window
Information .................................... 47
Zoom ............................................. 29
window
printing .......................................... 19
World-Wide Web. See Internet. See database.
Z
zone
hidden gels ................................... 6
reference gel ................................. 6
zooming gels .................................... 28
with magnifying glass on line ........ 29
Melanie 3 User Manual
161
162
Melanie 3 User Manual
CREDITS
The Melanie project originated in 1985 at the Geneva University Hospital and
the Computer Science Department of Geneva University, Switzerland, by Ron
Appel, Matthieu Funk, Denis Hochstrasser and Christian Pellegrini. Melanie 3,
its third version, has been developed at the Swiss Institute of Bioinformatics, in
collaboration with other groups of the Geneva Proteomics Network.
The following key persons have contributed to Melanie 3:
Software design and developments in Geneva:
• Daniel Walther
• Gérard Bouchet
• Patricia M. Palagi
Software developments in Cochabamba, Bolivia:
•
•
•
•
J. Reynaldo Vargas
Gonzalo Argote
Oscar Antezana
Soraya Ordonez
2-D PAGE applications:
•
•
•
•
Jean-Charles Sanchez
Véronique Rouge
Luisa Tonella
Catherine Zimmermann
The following persons have also contributed through code development, support, or the development of earlier versions of Melanie:
Melanie 3 User Manual
•
•
•
•
•
•
•
•
•
•
•
•
•
•
•
•
Peter Burke
Horia Ciobanu
Ottavio Cremona
Anca Dima
Roberto Fabbretti
Olivier Golaz
Andrew Goodman
Christine Hoogland
Romica Iancu
Elena Manoila
Marina Miu
Markus Müller
Christian Pasquali
Gheorghe Popescu
Florence Ravier
Jan Snydr-Michael
Melanie 3 User Manual