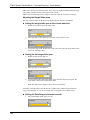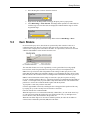
1
Working with the Data
4.
5.
6.
7.
8.
9.
7.8.2.2
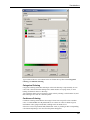
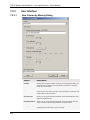
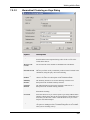
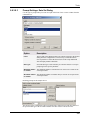
Comment: The transposed data set will have the same number of columns as the
number of records selected. The upper limit is 5000.
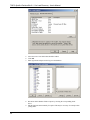
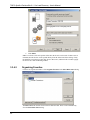
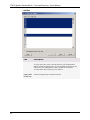
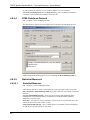
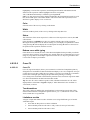
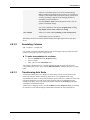
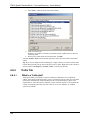
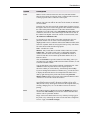
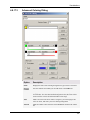
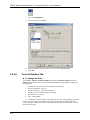
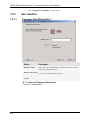
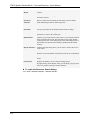
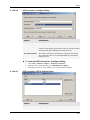
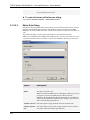
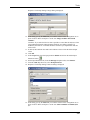
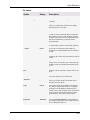
Click Next >.
Response: Step 2 of the wizard is shown.
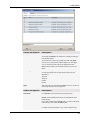
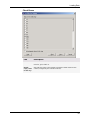
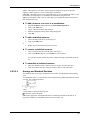
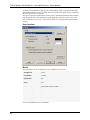
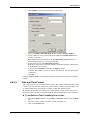
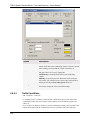
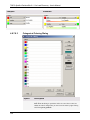
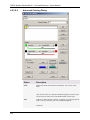
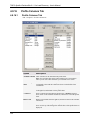
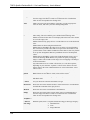
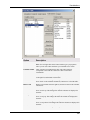
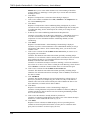
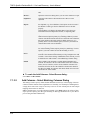
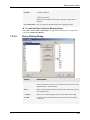
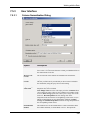
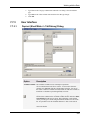
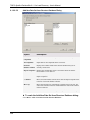
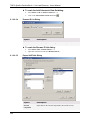
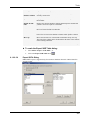
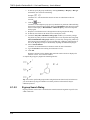
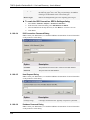
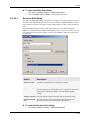
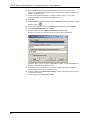
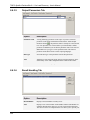
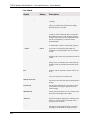
Select the columns you want to include in the transposed data set, and click Add >> .
Comment: Each selected column will become a separate record in the transposed data
set.
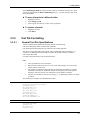
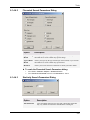
Click Next >.
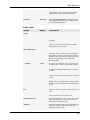
Response: Step 3 of the wizard is shown.
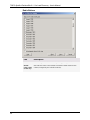
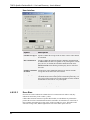
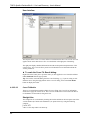
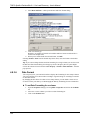
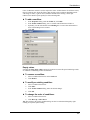
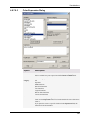
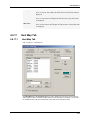
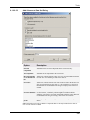
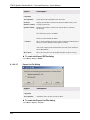
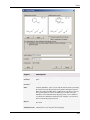
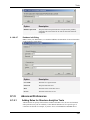
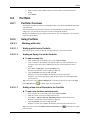
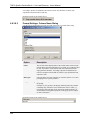
If required, select annotation columns.
Comment: Each transposed column will be annotated with the value of this column.
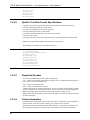
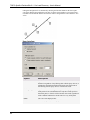
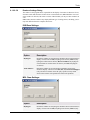
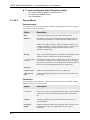
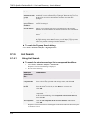
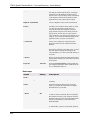
Click Finish.
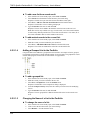
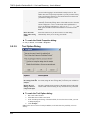
Response: A message box appears, prompting you to save your previous data set.
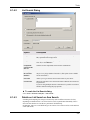
Click Yes to save the previous data set.
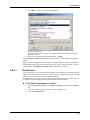
Response: The new, transposed data set replaces the original data set.
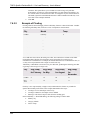
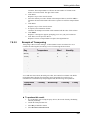
Example of Transposing
Transposing a data set means rotating it, so that columns become records and vice versa.
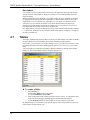
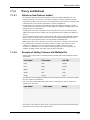
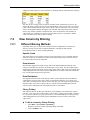
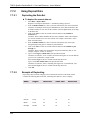
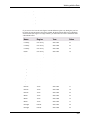
Consider the following table, describing a series of meteorological observations:
Day
Temperature
Wind
Humidity
Monday
16
5
75
Tuesday
19
8
70
Wednesday
17
10
70
Thursday
24
9
65
Friday
26
2
75
Saturday
27
2
80
Sunday
25
4
80
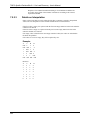
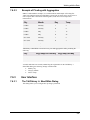
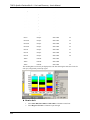
As we add more observations, the table grows taller, but remains four columns wide. While
useful during data collection, this format may not be appropriate for certain types of
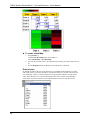
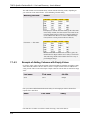
calculations or visualizations. By transposing this table, the following can be produced:
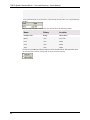
Transposed
columns
Tuesday
Wednesday
Thursday
Friday
Temperature
19
17
24
26
Humidity
70
70
65
75
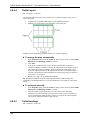
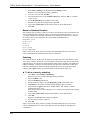
► To produce this result:
1.
2.
3.
4.
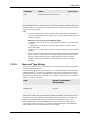
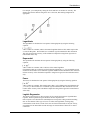
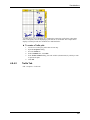
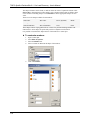
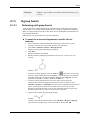
In a visualization, select (using the query devices) the records Tuesday, Wednesday,
Thursday and Friday.
Launch the Transpose Data tool.
Select Day as identifier column.
Select Work on: Selected records.
255