1
EUROCONTROL
Project:
PEGASUS
Issue:
Software User Manual – MFILERUNNER
4.2
PEG-SUM-MFR
Doc. No.:
K
Sheet
Date:
21 of 70
16/01/2004
“Per PRN Time series” Graphical Interface
The following section provides an overview of the graphical user interface of the “Per
PRN Time series” GUI. This GUI differs from the “Time series” one in that the user can
select the data he wants to plot on a per PRN basis. This implies that multiple data
cannot be plotted in the same subplot.
4.2.1
Main GUI
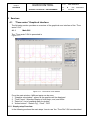
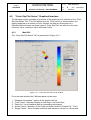
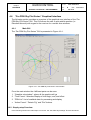
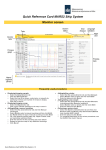
The “Per PRN Time series” GUI is presented in Figure 4.2-1.
Figure 4.2-1: “Per PRN Time series” main window
From the main window the 5 different parts can be seen:
1. “Graphics sub-window”: where all the graphics will go
2. “Time Frame”: Selection/Display of time begin, end, and offset
3. “Data List Frame: List of available data for plotting
4. “PRN List Frame”: List of available PRN for plotting
5. Action buttons: “Detach Fig”, “Plot”
4.2.2 Step-by-step Overview
In the following sections the main steps ‘how-to-use’ the “Per PRN Time Plot” GUI are
described: