1
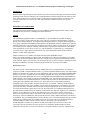
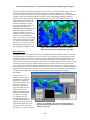
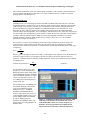
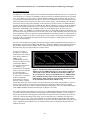
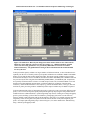
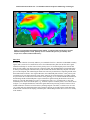
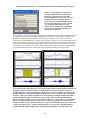
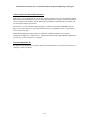
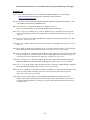
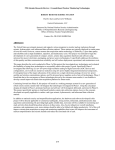
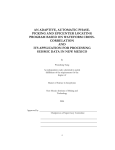
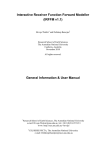
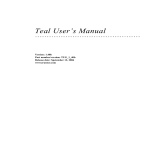
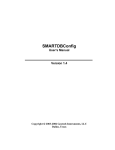
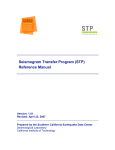
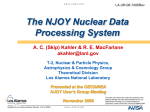
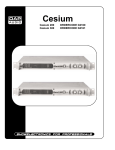
27th Seismic Research Review: Ground-Based Nuclear Explosion Monitoring Technologies
THE 2005 MATSEIS AND NNSA SEISMIC REGIONAL ANALYSIS TOOLS
Darren M. Hart, B. John Merchant, J. Mark Harris, and Christopher J. Young
Sandia National Laboratories
Sponsored by National Nuclear Security Administration
Office of Nonproliferation Research and Engineering
Office of Defense Nuclear Nonproliferation
Contract No. DE-AC04-94AL85000
ABSTRACT
In continuing to support the National Nuclear Security Administration (NNSA) Knowledge Base (KB), we
developed a set of prototype seismic regional analysis tools (MatSeis, EventID Tool, CodaMag Tool,
PhaseMatch Tool, and Infra Tool) to facilitate evaluation of new KB data products, and we continue to
maintain and improve these tools. A brief description of the latest versions of MatSeis and the regional
analysis tools are given below. MatSeis has been extended to use the FISSURES data handling interface
(DHI) client FISSURES-Matlab-Interface (FMI) to connect to both the Northern and Southern California
data centers located at Berkeley and Caltech, respectively. A routine was built to support instrument
response file download and to automatically perform waveform conversion from counts to nanometers. In
addition, both SENSOR and INSTRUMENT flatfile database tables are now exportable through the
“waveform write” function. For PhaseMatch Tool, a new method has been added to select station-event
pairs for dispersion curve calculations. The user is presented with a list of available stations for a given
event, and by selecting from the list, a great circle path is highlighted and the dispersion curve presented.
Infra Tool now has the ability to remove a specified signal (i.e., signal-subtraction) from its analysis, in an
attempt to detect secondary signals. Preliminary results demonstrate complete removal of the specified
signals, allowing for further analysis of residual FK plane. Work is continuing in this area to refine
methodology and increase user functionality. For CodaMag Tool, the station-specific MDAC source
spectrum and S-wave corner frequency are computed and displayed for reference on the moment spectrum
determined by modeling the coda magnitude. Also, Mw is read from any available sources (i.e., STAMAG,
NETMAG and DISCRIM_DATA) and displayed as an internal consistency check. For EventID Tool, the
amplitude measurement type was switched to the time-domain RMS (TRMS) method, and we have also
implemented linear discrimination analysis (LDA), and developed a new tool for computing integrated
attenuation maps for a user specified location. In this paper, each of the aforementioned additions are
described in greater detail with regard to usage and where relevant, their underlining theory.
907
27th Seismic Research Review: Ground-Based Nuclear Explosion Monitoring Technologies
OBJECTIVE
MatSeis and the regional analysis tools continue to provide an excellent prototyping environment in which
promising seismic analysis techniques can be implemented and evaluated quickly and with relatively little
effort. These products are now all fairly mature, but development on them continues in response to the
research results from our co-workers at LANL and LLNL and to feedback from our users at other
institutions.
RESEARCH ACCOMPLISHED
The following sections describe the latest versions of MatSeis, and the regional seismic analysis tools –
PhaseMatch Tool, Infra Tool, CodaMag Tool and EventID Tool.
MatSeis
The main MatSeis graphical window is a standard time vs. epicentral distance plot that can display
waveforms, arrivals, origins, and travel time curves. The user can interact with this display by clicking
directly on the displayed objects, by using the buttons along the bottom, by using the menus along the top,
or by typing commands at the Matlab prompt. MatSeis is predominantly written as Matlab m-file functions,
which are organized in a set of directories according to the general purpose of each. However, the package
also includes a set of compiled C functions and Java objects. Typically the compiled code is introduced
where performance of an m-file is too slow (e.g., FK calculations) or cumbersome (e.g., managing the
waveform, arrival, origin, and travel time objects). For a more detailed description of the features in
MatSeis, see Hart and Young (2004).
MatSeis continues to be available to the public from the NNSA NEM R&E website
(https://www.nemre.nnsa.doe.gov/cgi-bin /prod /nemre/matseis.cgi ). We have introduced a new method
for tracking downloads of MatSeis that allows us to compile a list of registration information provided by
users and create maps of user locations. Our first map of this type is shown in Figure 1, detailing the broad
distribution of MatSeis, especially in Western Europe and the east coast of the United States.
Data Center Access
For the last several versions, MatSeis has been reading data from two standard sources: Java database
connectivity (JDBC) compliant database tables (e.g., Oracle) and flatfile database tables, each following the
NNSA Core Schema (Carr, 2002). In a recent collaboration with University of Washington and IRIS DMC,
MatSeis is now able to read data directly from suitably equipped data centers, across the internet. This is
possible through FISSURES DHI client services and the DHI client FISSURES-MATLAB-INTERFACE
(FMI). Initially, work was done to connect to the IRIS DMC event, network and seismogram server. Once
these connections were established and tested, work proceeded to connect to other data centers that were
running the same FISSURES DHI client services. These data centers are the Northern California
Earthquake Data Center (NCEDC) located at the University of California – Berkeley and the Southern
California Earthquake Data Center (SCEDC) located at the California Institute of Technology. Our main
goal in this task was to establish connections to the seismogram and network servers for the retrieval of
waveform and instrument response data. Over time, the connections were established and routines were
developed to use the FMI client as the backbone for download. Once this basic capability was available in
MatSeis, we were then able to work on more detailed use cases. One of these was the conversion of
retrieved waveforms from counts to nano-meters (nm). In this use case, the user sets up a time-window
based query, start time and duration, and specifies the network, station, channel and location code desired
for download. The provided information is used by the data center to search its holdings and reply with the
number of waveforms that met the provided criteria. The user can use the received information about
available holdings to further restrict which waveforms to download, by specifying limits in
latitude/longitude coordinates or by distance/azimuth. In the end the user will select to retrieve the
waveforms. Once the waveforms are retrieved, the user is prompted to decide whether waveform
calibration is desired. If it is, then a list is built of the waveforms network(s), station(s), channel(s) and
908
27th Seismic Research Review: Ground-Based Nuclear Explosion Monitoring Technologies
location codes and used in querying the data center’s network server for the instrument response files. The
available instrument response files are then downloaded, saved to disk and then used to calibrate the
waveforms to a specific frequency based on the waveform’s associated channel type (e.g., UHZ calibration
frequency equals 0.004 Hz, BHZ calibration frequency equals 1.0 Hz and HHZ calibration frequency
equals 10.0 Hz). The downloaded instrument response files from a data center’s network server are in
SEED format and are based on the
number of stage filters used by the
instrument. The final step in this
process was to build up routines for
generating flatfile tables for
SENSOR and INSTRUMENT so the
instrument response associations
would be available for future use.
With these routines in place, a nearly
complete set of flatfile database
tables (e.g., arrival, assoc, instrument,
lastid, netmag, origerr, origin, sensor,
site, sitechan, and wfdisc) and data
directories (i.e., /resp and /w) can be
generated, upon export, after event
processing during a MatSeis session.
Figure 1. Map of locations for 167 separate MatSeis
downloads from December 2004 through July 2005.
Phase Match Tool
PhaseMatch Tool is a waveform analysis interface launched from MatSeis that allows the user to calculate
the predicted surface wave dispersion for a given source to receiver path by ray tracing through a model,
and then use the model dispersion to generate and apply a matched filter (Herrin and Goforth, 1977). The
tool allows the user to view the observed waveform, the model dispersion, the predicted waveform, the
cross-correlation of the predicted and observed waveforms, and the match-filtered waveform. The user can
control the frequency range of the model dispersion used, as well as the time limit of the portion of the
cross-correlated waveform from which the match-filtered waveform is taken. Once a satisfactory filtering
has been achieved, the user can send either the observed waveform or the filtered waveform to the MatSeis
amplitude measurement widget -- Measure Tool -- to measure surface wave amplitudes. These amplitudes
can then be used to determine event magnitude, which in turn can be used as part of an mb/Ms
discriminant.
The new surface wave
analysis features are part of
the LR Path Tool, which we
designed as a companion
tool to Phase Match to allow
the user to examine the
dispersion models they are
using. By loading an event
and set of stations into
MatSeis, launching the LR
Path Tool and selecting the
new button “Set to Map
GC”, MatSeis takes the
selected origin and station
list and builds the great circle
paths for event-station pairs and
presents them in MapTool. Then
generates a listbox with station
information (i.e., great circle object
Figure 2. New LR Path Tool. The list of loaded stations is
presented and the LR dispersion curve is updated based on
station to event path.
909
27th Seismic Research Review: Ground-Based Nuclear Explosion Monitoring Technologies
index, station channel name, great circle path endpoint coordinates). After selecting a station from the list,
the tool computes and displays its dispersion curve. Figure 2 illustrates the set of windows used while
working with the new LR Path Tool.
Coda Magnitude Tool
CodaMag Tool is a waveform analysis interface launched from MatSeis that allows the user to calculate
magnitudes and source spectra for an event of interest by fitting empirical decay functions to narrow-band
coda envelopes of a given phase (currently Lg). The technique was developed by Mayeda and has been
described in detail in several papers (Mayeda, 1993; Mayeda and Walter, 1996; Mayeda et al., 1999;
Mayeda et al., 2003). The tool consists of two displays. The main one shows the calculated moment
spectrum and the derived magnitudes. The second display, launched from the first, shows how the spectrum
was derived. The user can adjust the Lg arrival window, examine the fit between the observed and synthetic
envelopes, and control which frequency bands are used for the magnitude calculations. The various
required parameters (frequency bands, groups velocity windows, decay curves, etc.) are read from
parameter files unique to each station.
New features to version 1.10 include display of theoretical source moment–rate spectrum and S-wave
corner frequency to help evaluate the quantities derived from the data. For computing the CodaMag
theoretical source moment-rate spectrum, we started with the spectral shape defined by Brune (1970) given
in Equation 1.
S(w) =
So
1 + ( wwc ) 2
Equation 1.
Where S0 is the zero frequency spectral level and wc is the angular corner frequency. Since the moment-rate
spectrum is required to have a zero frequency spectral level equal to the moment (M0), the term S0 in
equation 1 is substituted with the moment, yielding Equation 2, which is the moment-rate spectrum plotted
in CodaMag Tool.
moment-rate spectrum(w) =
Mo
1 + ( wwc ) 2
Equation 2.
For calculation of the S-wave corner
frequency we use the formulation by
Walter and Taylor (2002), using station
specific Magnitude-Distance Amplitude
Correction (MDAC) parameters. Figure
3 shows a screen-shot of version 1.10
of CodaMag Tool, illustrating the new
features of the tool.
The upcoming work on CodaMag Tool
will include displaying values of Mw
retrieved from different internal
database sources (i.e. STAMAG,
NETMAG and DISCRIM_DATA
tables) to help evaluate the accuracy of
coda magnitude calibration for a given
station, multiple-band yield estimates
by region, reading processing
parameters from database tables, and
storage of the processing parameters in
database tables.
Figure 3. CodaMag Tool illustrating new features. Solid
white line is the moment-rate spectrum, and vertical
white dashed line is the S-wave corner frequency (fcS =
0.84 Hz). Processing parameters provided by Kevin
Mayeda of Lawrence Livermore National Laboratory.
910
27th Seismic Research Review: Ground-Based Nuclear Explosion Monitoring Technologies
Event Identification Tool
EventID Tool is a waveform analysis interface launched from MatSeis that allows the user to categorize an
event of interest (i.e. explosion or earthquake) using spectral ratios of standard regional arrivals (see Hartse
et al., 1997; Walter et al., 1999). This is a station-calibrated technique, and researchers must provide a set
of station-specific calibration parameters that are stored in a set of database tables and assessed by the tool
when processing an event of interest. The tool consists of three displays. The main display plots the phase
ratio for the current event against a backdrop of the same ratio for archived events (if available) that have
already been identified (event types are indicated with different symbology). The user can choose different
phases and/or frequency bands to ratio to try to improve the separation of the earthquake and explosion
populations, and the display will immediately update. A second display shows the user a plot of an
“MDAC-o-gram” (i.e. the MDAC corrected measurements at all of the phase/frequency combinations) for
the current event along with all of the archived events. This can be useful in deciding which ratio will yield
the best separation. If there are questions about the amplitude measurements themselves, a third display can
be brought up, and the user can easily examine group velocity windows for the phases and change them if
necessary. If they are changed, the measurements will automatically be re-made and the ratios will be
updated in the main display.
Version 1.10 of EventID Tool supports both time and frequency domain amplitude measurement types, as
defined in the custom schema for DISCRIM_DATA (i.e. FREQ and TRMS). It also implements the linear
discrimination analysis (LDA) technique, can run validation scripts, and can generate path-integrated
attenuation (Q) maps. We describe these new features below.
In previous versions of
EventID Tool, amplitude
measurements were made in
the frequency domain (i.e.
FREQ f_t_type
measurements), while the
reference events were being
read from the database
based on their time-domain
(i.e. TRMS f_t_type
measurements) counterparts.
Figure 4. Plot demonstrating log(amplitude) measurement types
In theory, the measurements
FREQ (green) and TRMS (magenta) across 8 frequency bands (0.5are equivalent, but in
1 Hz, 1-2 Hz, 2-4 Hz, 4-6 Hz, 8-10 Hz, 10-12 Hz and 12-16 Hz). In
practice, slight differences
the case shown here, the log residual differences (i.e. TRMS-FREQ)
are observed, so a consistent
had a standard deviation of 0.113 about the mean of 0.211 for Pn,
method of amplitude
0.066 about the mean of 0.207 for Pg, 0.057 about the mean of 0.194
measurement was desired.
for Sn and 0.067 about the mean of 0.207 for Lg.
The tool will now compute
both measurement types for the current event, and comparisons can be made using the MDAC-o-gram, as
shown in Figure 4. Future work will focus on allowing more flexibility within the tool for switching
between measurement types, both for validation and operational purposes. For a more detailed description
of the TRMS and FREQ measurement techniques see Rogers et al. (2002).
For evaluation of the LDA technique, new controls were added to implement this method as unobtrusively
as possible without interfering with the existing single-ratio discriminant capability. As seen in Figure 5,
the previous methods for selecting phase, spectral and cross-spectral ratios are located just above the new
section for selecting and editing a LDA string. The user controls the active method by selecting from a
radio-button, “on” or “off”, switch. Upon selecting one of the discrimination methods the other methods
controls are disabled ensuring that the tool and user are clear as to the desired functionality. There are many
ways to implement LDA within the tool; we anticipate further work on refining this interface based on
feedback from users.
911
27th Seismic Research Review: Ground-Based Nuclear Explosion Monitoring Technologies
Figure 5. EventID Tool. Minor layout changes have been made to allow for new LDA controls.
Menus have been added for selection of other new feature, e.g., validation methods, Q model
viewer tool. Processing parameters were provided by Bill Walter of Lawrence Livermore
National Laboratory. A hypothetical LDA string is shown to demonstrate the format intended
for use by the tool.
To help researchers quickly validate ever larger numbers of calibrated stations, we have introduced a new
capability into the tool. A routinely used script for product validation was modified to handle an abundant
number of cases that the data products might fall within. The output from the validation script provides
useful numerical analyses for an event that has been delivered in the DISCRIM_DATA database table and
was processed by the tool using data from DISCRIM_PARM, MDAC_FI and MDAF_FD. Comparisons
are separately made between the reference event and tool processed event, for both the MDAC corrected
and uncorrected log(amplitude) measurements, providing residuals for evaluation of measurement
consistency. Other useful information is also output; e.g., station and channel name, event type, start and
end time for phase processing windows. Additional possible output variables may be added if requested.
To better understand the effects of attenuation observed at a station for events occurring at different source
points, a new tool was developed to quickly build path-integrated Q maps using the 2D Q models that are
included with some calibrated stations. A path-integrated Q map consists of taking an existing tomography
grid of Q values, defining a point of interest within the Q tomography grid (in this case the station of
interest), defining a path-integration grid for the integration to take place over, and then computes the pathintegrated Q values for the great-circle paths between the station and each of the path-integration grid
points. An example path-integrated Q map is shown in Figure 6, for station ARA0 of the ARCESS array,
using a 1Hz Pn Q tomography model.
912
27th Seismic Research Review: Ground-Based Nuclear Explosion Monitoring Technologies
Figure 6. Pn path-integrated Q0 map station ARA0. A grid increment of 0.66 degree in both
latitude and longitude was used. Q0 map used to construct this plot was provided by Steve
Taylor of Los Alamos National Laboratory.
Infra Tool
Research and evaluation is currently underway to extend Infra Tool for 1) detection of imbedded secondary
signals, and 2) removal of a constant noise source from infrasound array data. For the first task a signalsubtraction technique is used for removal of the primary source of correlated signal power from the FK
plane for each window step when processing a segment of data. Our implementation of signal-subtraction
is done by beamforming the infrasound array to the azimuth and slowness defined by the peak correlated
power in the FK plane, then subtracting the beam from each array element and re-computing the FK on the
beam-subtracted waveforms. After signal subtraction, the residual FK plane will have a new point of peak
correlated power from which detection criteria (Hart, 2004) can be used to determine if secondary signals
are present. For the second task of constant noise source jamming, we use a fixed azimuth and slowness for
beamforming and the residual FK plane is again searched for signals meeting the detection criteria. Our
purpose is to provide functionality to remove a constant noise source (e.g., microbaroms), or any peak
correlated power observed in the FK plane (e.g., chemical explosion or artillery blasts). A new GUI, shown
in Figure 7, was designed and built to control the signal-subtraction processing. Features in the new GUI
include methods to switch between fixed source jamming and peak correlation, a switch to turn ‘on’ and
‘off’ results from non-signal-subtraction, and a switch for applying or not applying the signal subtraction
method. Work continues on developing evaluation plots of the technique for the user to review for validity
of the method.
913
27th Seismic Research Review: Ground-Based Nuclear Explosion Monitoring Technologies
Figure 7. New graphical user interface for
the signal-subtraction method planned for
Infra Tool. Select fixed source and add
specific azimuth and trace velocity values for
the fixed noise source jamming method, or
choose the peak correlation method. Select
the Use Signal Subtraction to turn “on” and
“off” the signal-subtraction processing
routine. By selecting the Plot Original Data,
the results from non-signal subtraction are
displayed for comparison.
As an example, we show results from processing using the standard method and signal-subtraction for peak
correlated power removal and secondary signal detection in Figures 8 a and b. Figure 8a shows that the
standard processing method clearly detects two pulses with start times of 1998/10/20 21:56:20 and
1998/10/20 22:01:00 and durations 3.3 minutes and 2.5 minutes, respectively. The average azimuth of these
pulses is 289.2 degrees. Figure 8b shows the signal-subtraction results of the initial peak correlated power
obtained by the standard processing method. In this case three detections are made and each occurs at the
approximately same azimuth, 327.2 degrees. These are likely refracted wavefronts from local topography
near the infrasound station of the primary pulses detected with the standard processing method.
a)
b)
Figures 8a and 8b. Demonstration of signal-subtraction technique for removal of peak correlated
power and secondary signal detection. A waveform segment with start time 1998/10/20 21:50:00 and
20 minute duration was chosen for the Los Alamos Infrasound Array (LSAR). Waveforms were
bandpass filtered at 1-3 Hz (bottom displays of both panels) and processed using 20 second moving
window with 50% overlap. Detection threshold criteria were set to: correlation > 0.5, slope limit in
azimuth < 1.0 degrees, Number of samples 4 (i.e. 80 second LTA), standard deviation in azimuth <
2.5 and azimuth data gap 0. a) Standard processing results, with associated detection windows.
Detection window statistics: average correlation 0.8 ± 0.097, trace velocity 380 m/s ± 7 and azimuth
289.2 ± 2.0. b) Signal-subtraction results for removal of peak correlated power, with associated
detection windows. Detection window statistics: average correlation 0.566 ± 0.105, trace velocity 399
± 20 m/s and azimuth 327.2 ± 1.8. Data obtained from the U.S. Army Space and Missile Defense
Command (SMDC) Monitoring Research website Infrasound database of ground truth events.
914
27th Seismic Research Review: Ground-Based Nuclear Explosion Monitoring Technologies
CONCLUSIONS AND RECOMMENDATIONS
In this paper, we have highlighted some of the more significant changes in the past year in MatSeis and the
MatSeis-based regional analysis tools. In the coming year and beyond, we expect to continue to modify the
tools in response to user feedback, with the ultimate goal of building a well-integrated, user-friendly, and
powerful regional analysis environment.
The official 1.9 version of the basic MatSeis package is available to all from the GNEM R&E web site:
https://www.nemre.nnsa.doe.gov/cgi-bin/prod/nemre/matseis.cgi, with MatSeis version 1.10 planned for
release in November 2005.
Matlab and the Signal Processing Toolbox are required to run MatSeis. MatSeis will run on Sun
workstations, Windows PC’s, and Linux PC’s. MatSeis should run on other supported Matlab platforms as
well, but the C code will need to be re-compiled.
ACKNOWLEDGEMENTS
We thank all of the MatSeis users who have helped us to debug and improve the software, particularly our
colleagues at LANL and LLNL.
915
27th Seismic Research Review: Ground-Based Nuclear Explosion Monitoring Technologies
REFERENCES
Carr, D. (2002), National Nuclear Security Administration Knowledge Base Core Table Schema
Document, Sandia National Laboratories, SAND2002-3005 (available at
http://www.nemre.nn.doe.gov ).
Hart, D. M. (2004), Automated Infrasound Signal Detection Algorithms Implemented in MatSeis – Infra
Tool, Sandia Technical Report SAND2004-1889.
Hart, D. M. and Chris J. Young (2004), MatSeis User Manual version 1.9,
https://www.nemre.nnsa.doe.gov/prod/nemre/fileshare/matseis_manual.pdf.
Hartse, H. E., Taylor, S. R., Phillips, W. S., and G. E. Randall (1997). A preliminary study of regional
seismic discrimination in central Asia with emphasis on western China, Bull. Seism. Soc. Am. 87:
551-568.
Herrin, E. and T. Goforth (1977). Phase-matched filters: application to the study of rayleigh waves, Bull.
Seism. Soc. Am. 67: 1259-1275.
Mayeda, K. (1993). Mb(LgCoda): a stable single station estimator of magnitude, Bull. Seism. Soc. Am. 83:
851-861.
Mayeda, K. and W. R. Walter (1996). Moment, energy, stress drop, and source spectra of western United
States earthquakes from regional coda envelopes, J. Geophys. Res. 101: 11,195-11,208.
Mayeda, K., R. Hofstetter, A. J. Rodgers and W. R. Walter (1999). Applying coda envelope measurements
to local and regional waveforms for stable estimates of magnitude, source spectra, and energy, 21st
Annual Seismic Research Symposium on Monitoring a CTBT, Vol I, pp. 527-533.
Mayeda, K., A. Hofstetter, J. L. O’Boyle and W. R. Walter (2003). Stable and Transportable Regional
Magnitudes Based on Coda-Derived Moment-Rate Spectra, Bull. Seism. Soc. Am. 93: 224-293.
Rogers, A. J., T. Lay, W. R. Walter, and K. M. Mayeda (1997). Comparison of Regional Phase Amplitude
Ratio Measurement Techniques, Bull. Seism. Soc. Am., 87, 1613-1621.
Walter, W. R., A. J. Rodgers, A. Sicherman, W. Hanley, K. Mayeda, S. C. Myers and M. Pasyanos (1999).
LLNL's regional seismic monitoring research, 21st Annual Seismic Research Symposium on
Monitoring a CTBT, Vol I, pp. 294-302.
Walter, W.R. and S. R. Taylor (2002), A Revised Magnitude and Distance Amplitude Correction
(MDAC2) Procedure for Regional Seismic Discriminants: Theory and Testing at NTS, Lawrence
Livermore National Laboratory, Livermore CA, report: UCRL-ID146882 and Los Alamos report:
LA-UR-02-1008.
916