1
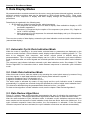
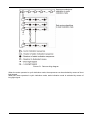
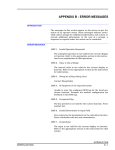
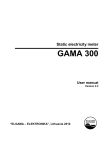
Multifunction Meter of
active, reactive and apparent Electric Energy
EPQS
User Manual
Version 5
“ELGAMA – ELEKTRONIKA”, Lithuania 2007
“ELGAMA-ELEKTRONIKA”
EPQS
Multifunction Meter of Active, Reactive and
Apparent Electric Energy
User Manual
"ELGAMA-ELEKTRONIKA" Ltd.
Visoriu str. 2,
LT-08300 Vilnius
Lithuania
Tel. 8 5 2375 000
Fax. 8 5 2375020
e-mail: [email protected]
This user manual describes the electronic multifunction EPQS meter of electric energy and the use of
the meter. Please read this document carefully before installing and using the meter. The
manufacturer’s warranty shall not apply if the meter is damaged as a result of failure to comply with
the requirements described in this manual or registration certificate or those of work safety.
The manufacturer shall not be held liable for any kind of loss incurred by the meter parameterization
performed not following instructions described in the users program as well as recommendations and
State-defined tariffs. The manufacturer shall be not held liable for any damage related to partial or
total data loss due to unprofessional actions of authorized persons.
This user manual describes all possible features, functions, and auxiliary outputs of the electrical
energy meter. Your meter might not have some features, functions, or auxiliary outputs described in
this document. The exact configuration, features, accessories, and connection diagram of the meter is
provided in its registration certificate.
CHAPTER 2. METER DESIGN
Table of Contents
1. PURPOSE AND FEATURES .......................................................................................................... 7
1.1. MARKING OF METER MODIFICATIONS ................................................................................................................8
1.2. TECHNICAL SPECIFICATIONS............................................................................................................................9
2. DESIGN ........................................................................................................................................ 10
2.1. CASE ...........................................................................................................................................................10
2.2. GENERAL REQUIREMENTS AND INSTALLATION PROCEDURE ............................................................................11
2.3. ELECTRONIC CIRCUITRY AND PRINCIPLES OF OPERATION ................................................................................13
2.3.1. Measurement module .........................................................................................................................13
2.3.2. Analog to Digital Signal Conversion....................................................................................................13
2.3.3. Central Processor Unit ........................................................................................................................13
2.3.4. Non-volatile RAM Unit.........................................................................................................................14
2.3.5. Internal Clock ......................................................................................................................................14
2.3.6. Liquid Crystal Display (LCD)...............................................................................................................14
2.4. COMMUNICATION INTERFACES .......................................................................................................................15
2.4.1. Optical Interface (D0) ..........................................................................................................................15
2.4.2. Electrical communication Interface .....................................................................................................15
2.4.3. Auxiliary Communication Interface (optional) .....................................................................................15
2.4.4. Interface Priorities ...............................................................................................................................15
2.5. THE METER INPUTS AND OUTPUTS ................................................................................................................15
2.5.1. Optical LED Output (Red Light Emission Diodes) ..............................................................................15
2.5.2. Pulse Output contacts .........................................................................................................................16
2.5.3. Relay Outputs (Optional) ....................................................................................................................16
2.5.4. External Backup Power Supply (optional) ..........................................................................................16
2.6. POWER SUPPLY ............................................................................................................................................17
2.7. PUSH BUTTON ..............................................................................................................................................17
3. DATA REGISTRATION ................................................................................................................. 17
3.1. ENERGY REGISTRATION ................................................................................................................................19
3.2. DEMAND REGISTRATION ................................................................................................................................20
3.3. REGISTRATION OF INSTANTANEOUS VALUES ..................................................................................................20
3.4. POWER QUALITY REGISTRATION....................................................................................................................22
3.5. “END OF BILLING PERIOD” ..............................................................................................................................23
4. TARIFF MODULE.......................................................................................................................... 24
4.1. DAY PROGRAM..............................................................................................................................................24
4.2. W EEK PROGRAM ...........................................................................................................................................24
4.3. TARIFF SEASONS ..........................................................................................................................................24
4.4. SPECIAL DAYS ..............................................................................................................................................25
4.5. TARIFF MODULE OPERATION IN CASE OF CLOCK FAILURE ..............................................................................25
5. DATA DISPLAY MODES............................................................................................................... 26
5.1. AUTOMATIC CYCLIC DATA INDICATION MODE .................................................................................................26
5.2. STATIC DATA INDICATION MODE ....................................................................................................................26
5.3. DATA REVIEW ALGORITHMS ..........................................................................................................................26
6. PARAMETERISATION .................................................................................................................. 28
7. METER DATA PROTECTION ....................................................................................................... 29
7.1. PHYSICAL PROTECTION OF DATA AND PARAMETERS .......................................................................................29
7.2. SOFTWARE PROTECTION ...............................................................................................................................29
7.2.1. Password ............................................................................................................................................29
7.2.2. Lock of optical interface (optional) ......................................................................................................29
7.2.3. Event logbook .....................................................................................................................................29
7.2.4. Counters and Timers ..........................................................................................................................30
7.2.5. Protection of Factory Constants..........................................................................................................30
ANNEX A. DATA AVAILABLE TO DISPLAY ON LCD ....................................................................... 31
1. Purpose and Features
The EPQS meter is a multifunction device for measurement of electric energy. CT operated meters
comply with requirements of IEC 62053-22 standard, class 0,5 or 0,2s.
The meter data structure is compatible with DLMS standard. Each measured parameter has its OBIS
(OBject Identification System) code describing the parameter or value. OBIS codes together with
allocated parameters are transmitted through the communication interfaces and displayed on the
meter LCD display screen.
The meter measures, registers, and collects data on active energy of both directions (+A, -A), reactive
energy of both directions (+R, -R), reactive energy in four quadrants (R1, R2, R3, R4), and apparent
energy of both directions (+W, -W). The meter also registers maximums of average power, collects
load profiles and registers cumulative powers.
Besides the aforementioned values, the EPQS meter can display or transmit via its communication
interfaces the following profiles stored in any of 16 freely programmed channels: phase and line
voltages; currents; instantaneous active, reactive, and apparent power; frequency; power factor (cos
ϕ). It can also analyze power quality and generate weekly reports of power grid quality.
Up to eight of energy and the same number of power maximum tariffs can be activated for tariffication
of energy and power. The structure of tariff module lets adapt the meter for virtually any of existing
tariff program.
For remote data transmission, the meter has two independent electrical communication interfaces.
For local data readout, optical interface D0 is provided.
Several modifications of EPQS meter are manufactured. They may differ in nominal current, voltage,
connection type, and the meter hardware or software. The designation of different modifications of
EPQS meter is explained in Table 1-1.
CHAPTER 2. METER DESIGN
1.1. Marking of meter modifications
Table 1-1. Explanation of meter modification code
EPQS
X
Measuring elements:
3 elements, 4 – wire connection
1
X
X.
XX.
XX
Rated voltage, V:
3x57,7/100; 3x63,5/110; 3x69,2/120; 3x100; 3x110; 1
3x120
multi range (3x57,7 ...230/100 ...400)
2
3x220/380; 3x230/400; 3x380; 3x400
3
3x120/208; 3x127/220; 3x220; 3x230
4
Rated (maximal) current, A:
CT connection 5(6,25)
CT connection 5(10)
CT connection 1(2), 1(1,25)
CT connection 1(6)
1
2
3
4
5
Software code:
Hardware code:
Hardware of class 0.2s
2X
1.2. Technical Specifications
Accuracy class:
Rated voltage, V
Rated (maximum) current, A
Rated frequency, Hz
Sensitivity threshold, %Inom
CT operated 0.2s or 0.5s (IEC 62053-22)
see table 1-1
see table 1-1
50 or 60
CT operated 0,1
Power consumption, VA
Meter constant, imp/kWh
Communication interfaces:
in voltage circuits 2 (0,76W)
in current circuits 0,4/phase (CT operated)
≤130000
optical interface D0 IEC 62056-21
electrical interface I IEC 62056-31
electrical interface II IEC 62056-31
pulse outputs:
number:
output constant, imp/kWh (imp/kVArh):
pulse duration, ms
External backup power supply:
Tariff module:
number of energy tariffs:
number of maximum demand tariffs:
Data storage without power supply:
Backup supply of internal clock:
Battery resource for not connected meter
Insulation:
pulse voltage test (IEC 60060-1)
alternating voltage test
Operating temperatures
Storage and transportation temperatures
Weight, Kg:
Dimensions, mm3
6 (independent)
≤130000
≥ 30
= 12V
programmable (1 … 8)
programmable (1 … 8)
20 years (t=20°C);
2 years (t=60°С)
Li battery
> 5 years
6kV
4kV
-40°C … +60°C
-50°C … +70°C
< 1,5
325 x 177 x 55
CHAPTER 2. METER DESIGN
2. Design
2.1. Case
Picture 2-1 presents the external view of the device.
Picture 2-1. Meter exterior
1
2
3
4
5
Transparent cover
Sealed screws;
Meter panel;
Liquid Crystal Display;
Display control photo sensor
6
7
8
9
10
Optical communication interface;
Terminal block cover
Button
Light emitting diode (LED) 1;
Light emitting diode (LED) 2;
The meter panel is covered by transparent cover moulded from UV ray-stabilised polycarbonate cover
providing protection from external mechanical factors and moisture.
The cover is fixed to the case by two sealed screws.
The liquid crystal display (LCD) is located in the frontal part of the meter. It allows the display of all
values stored in the memory, instantaneous values and parameters.
On the lower left, a display control photo sensor is located. In order to display specific information on
the display, a corresponding light signal must be transmitted to the photo sensor.
The D0 optical interface is located on the right side of the frontal part. The purpose of this interface is
data transfer between the meter and a portable computer or terminal and the meter parameterisation.
The meter has its own backup power supply that provides power to the internal clock should the main
electrical network fail. The backup supply consists of a standard 3.6 V Li-Ion battery. If a –Battery lowmessage appears on the display, the battery must be replaced.
Only the manufacturer or its authorised representative may replace the battery!
The power and auxiliary terminal block is located on the bottom of the meter. All connections having
been completed and checked, the terminal block shall be covered with sealed cover.
2.2. General Requirements and Installation Procedure
1. Only personnel authorised by the Electric Utility can carry out the meter installation,
disconnection, repair, any subsequent parameterisation, and sealing; the rules of installation
of electrical devises must be observed. The manufacturer shall not be held liable for the meter
malfunction should the user fail to adhere to the relevant requirements.
2. The meter is installed in dry premises containing no chemically aggressive gases or vapour.
3. The meter is fixed with three screws. The meter overall dimensions and distances between the
mounting holes are shown in picture 2-2.
4. The meters are connected according to the scheme shown on the cover of the meter terminal
box diagrams. Picture 2-4 shows the general connection of EPQS meters through current and
voltage transformers.
5. Regular verification of the meter shall be carried once in eight years.
6. Only natural or legal persons authorised by the manufacturer can repair the meter.
Picture 2-2. The Overall Dimensions and Mounting Holes of EPQS Meter
CHAPTER 2. METER DESIGN
20 21 27 28 23 24 41 42 43 44 40 58 16 15 31 32 55 57 71 72
61 62 65
Terminal cover opening
button
Picture 2-3. Meter terminal box
CL2
CL1
Picture 2-4. Wiring diagram
S0 outputs
Test Relay
outputs
2.3. Electronic circuitry and principles of operation
Picture 2-5. Block diagram of the meter
2.3.1. Measurement module
The measurement module converts the electricity network voltage and current values to
corresponding analog signals.
The voltage value is converted by a resistive voltage divider, and the current value is converted by a
precise current transformer. Firmware of the central processor unit compensates a phase shift in the
current measurement circuit. The voltage and current of each phase is measured by a separate
respective measurement module (further referred to as “measurement element”).
2.3.2. Analog to Digital Signal Conversion
From the measurement module, the analog voltage and current signals further go to a 6-channel ADC
(Analog to Digital Converter) (Sigma – Delta integrator). The integrator converts the analog signals
into digital 16-bit codes 72 times during a single AC period. A logical multiplexer unit integrated in the
same chip combines signals of different phases into a single sequence of digital codes.
2.3.3. Central Processor Unit
Multiplexer unit output codes are further sent to the central processor unit (CPU) where they are
multiplied by calibration constants entered during calibration. Based on the result, the processor then
calculates square voltage and square current for each phase and voltage with 90° phase shift
(necessary for calculating of reactive energy): I²A, I²B, I²C, U²A, U²B, U²C, U’A, U’B, U’C.- From these values,
active, reactive and apparent powers and energies are calculated. The CPU also acts as a controller
of memory unit, LCD, and communication interfaces, generates calibration (LED) signals and
performs other functions.
CHAPTER 2. METER DESIGN
2.3.4. Non-volatile RAM Unit
With exception of instantaneous values, all meter data are stored in non-volatile RAM (NVRAM) unit.
This FLASH type memory unit does not require any power supply for data storage. The data are
written to the memory at the end of each integration period, day, or month and in case of power
failure.
2.3.5. Internal Clock
The meter has a built-in independent real-time clock that counts real time (hours, minutes, seconds),
date (year, month, day, week day), generates control signals corresponding to 8 tariff time zones (T1
… T8; M1 ... M8). In case of disconnection of the meter’s power supply, the clock is powered from a
built-in lithium battery. After a shutdown of the electricity network, the clock preserves the tariff time
zone control function and counts time for a period of no less than 10 years. If the power supply is
restored after that period has passed, the meter will perform as a single-tariff device, and the data will
be assigned to the tariff zone specified during the parameterisation. It can be any of activated energy
or power tariffs.
The internal clock has a quartz resonator temperature error compensator. The clock can be corrected
by programming the meter as well. The correction range is [-20 ... +20] seconds, but the annual
cumulative correction value cannot exceed +/- 10 min.
The clock can automatically adjust for summer time. The date and time of the start and end of
summer time are stored during the meter parameterisation. The adjustment time must be set in the
MM-DD-HH (month-day-hour) format. The adjustment offset in hours must also be set.
There are the following options of adjustment to daylight time:
• Adjustment month, day, hour, and offset are set. At the specified moment the clock is adjusted
by the specified offset.
• Month and day are set. In this case summer time starts at 2 AM and ends at 3 AM. The clock
is adjusted by the specified offset.
• Only month is set. In this summer time starts at 2 AM on the last Sunday of the month
specified and ends at 3 AM on the last Sunday of the month specified. The clock is adjusted
by the specified offset.
• No adjustment date/time is specified. In this case summer time starts at 2 AM on the last
Sunday of March and ends at 3 AM on the last Sunday of October.
• Changes are disabled. No clock adjustment is made.
Note: both date and time formats for summer time start and end must match.
2.3.6. Liquid Crystal Display (LCD)
The meter has a built-in alphanumerical 64-symbol four-line LCD with backlight. The display can be
conventionally divided into 13 information fields. Picture 2-3 shows LCD information fields.
Table 2-1. Information fields of LCD
1
Caption of the sequence
2
Number of readout in sequence
3
Display mode indicator
4
Number of readouts in current sequence
5
Abbreviated name of readout
6
Readout OBIS code
7
Value
8
9
10
11
12
13
Measurement unit
Indicators of load quadrant for each phase
Active energy tariff
Active demand tariff
Indicator of phase sequence
“Extended review available” indicator
Warnings and error messages are shown on first row of LCD, every 2 seconds changing
For detailed information about data review on LCD, see chapter 5.
2.4. Communication Interfaces
For data exchange with external units (i. e. computer or manual data reading terminal), the EPQS
meter has standard optical and electrical communication interfaces.
2.4.1. Optical Interface (D0)
This interface is used for the meter parameterisation and for transferring of data stored in the meter to
a data reading terminal or portable PC with a QuadrCom software installed in it. The optical interface
transfer protocol is IEC 62056-21compatible. The maximum transfer rate is 9600 bps.
2.4.2. Electrical communication Interface
This interface is used for the meter parameterisation and for data transfer via local network. The
electrical communication interface implements IEC 62056-31transfer protocol. The maximum data
transfer rate is 19200 bps. There can be following implementations of electrical interface:
• RS 232;
• RS 485;
• Current loop interface (CL)
2.4.3. Auxiliary Communication Interface (optional)
The following auxiliary communication interface that operates independently from the optical and the
first electrical interfaces can be built in upon a request:
• Current loop interface (CL2);
• Electric interface RS 485 ;
• Electric interface RS 232.
2.4.4. Interface Priorities
Communication through the optical interface D0 and the first electrical interface is provided by the
same single universal asynchronous receiver-transmitter unit (UART), so it is impossible to use both
interfaces for data transfer concurrently. The meter has strict software defined priorities for
communication interfaces, and a certain priority of one or another interface is determined by the
following rules:
• Optical interface has higher priority than electrical;
• If request is received through the optical interface while a communication session is going on
through the electrical interface, communication through electrical interface is interrupted, and
a request received through the optical interface is carried out. Communication through the
electrical interface is not interrupted only if an answer to a request is currently transmitted
through electrical interface. In that case communication is interrupted only after the answer
has been sent.
2.5. The Meter Inputs and Outputs
2.5.1. Optical LED Output (Red Light Emission Diodes)
The optical LED output is located on the front panel. It is used for the meter calibration and
verification. The LED emits light signals whose frequency corresponds to calculated electrical energy.
LED signals are generated by the meter CPU. Meter constant is the main parameter of the LED
output. The meter constant means a number of light signals emitted by LED for 1 kWh (1 kVAr or 1
kVA) of electrical energy.
The EPQS meter has two optical LED outputs. The meter constant is set by the manufacturer. Both
LED outputs can generate signals for active, reactive, or apparent electrical energy and the first
output (see Diagram 2-1) can additionally transmit the meter clock time signals in order to estimate
time count error. Table 2-3 lists LED output parameters.
CHAPTER 2. METER DESIGN
Table 2-3. LED output parameters
Meter constant, imp/kWh (imp/kVArh)
Pulse duration, ms
Pulse duration for clock testing, s
Pause between pulses while testing clock, s
1 – 65000
30
0,5
0,5
2.5.2. Pulse Output contacts
Meter pulse output contacts transmit telemetry pulses for energy accounting systems. The EPQS
meter has six pulse outputs (see picture 2-4). Outputs can be programmed for any kind of energy (+A,
-A, R1, R2, R3, R4, A, R); A and R outputs are not programmable. Table 2-4 lists output parameters.
Outputs are galvanically separated.
Table 2-4. Characteristics of outputs
Maximum voltage, V
Minimum voltage, V
Maximum current, mA
Output constant, imp/kWh (imp/kVArh, imp/kVAh)
Pulse duration, ms
Pause between pulses, ms
220V
10V
100
1 … 130000
10 … 250
10 … 250
The parameters of pulse outputs must be set in a way that the following inequality is met:
K<
3,6 ⋅10 6
N⋅ (ti + t p ) ⋅ U max ⋅ I max
K– output constant [imp/kWh, imp/kVArh or imp/kVAh];
N – number of measuring elements;
ti – pulse duration [sec];
tp – pause duration [sec];
Umax – maximum permissible voltage of electricity network;
Imax – maximum load current.
2.5.3. Relay Outputs (Optional)
The EPQS meter may have up to two built-in electronic semiconductor relays. The relay output can
be programmed to operate on the following conditions:
• A certain energy (T1 … T8) or power (M1 … M8) tariff comes into force
• Daily, at certain time intervals (up to 4 intervals daily). Resolution is 1 minute.
• Average power of current integration period exceeds a set value after n seconds from the
beginning of integration period. In that case the relay may operate until:
o The end of integration period;
o The end of the next integration period;
• New event or state has been registered, such as:
o Power failure at any phase;
o Phase sequence change;
o Meter damage or malfunction.
Table 2-5. Relay output parameters
Maximum switching voltage, V
Maximum switching current, mA
350
50 (U=Umax)
2.5.4. External Backup Power Supply (optional)
An external backup power supply allows reading meter data while there is no power in the network
meter is connected to. Main parameters of the backup power supply is presented in table 2-6.
Table 2-6. External backup power supply parameters
Voltage, V
12,5±0,6
Power consumption, mA
<200
If all phases are disconnected and the backup power supply is used, a “L - - -” sign is displayed on the
phase sequence indicator.
Notes:
• It is not mandatory to disconnect the backup power supply after the meter has been connected
to the electrical network
• The meter is supplied with backup power terminals upon a separate request only!
2.6. Power Supply
The components of the meter electronic circuitry are powered by a multi-voltage power supply.
It ensures smooth operation within the permissible voltage range from 50 V to 260 V of network
voltage. The power supply protects the meter from brief “lightning-type” voltage surges and is not
associated with any single phase so the meter is operating as long as there is voltage at least in one
phase. If the “ground” terminal is disconnected, the meter is operating as long as there is voltage at
least in two phases.
The power circuit incorporates a high capacity capacitor. A special circuit checks its voltage,
and if it drops below a certain critical value the CPU writes vital data on the meter state and measured
values to FLASH memory. After the voltage is on again, the meter restores its state variables from the
stored data, switches tariffs if necessary and resumes measurements. In that way, the meter data are
reliably protected from unexpected consequences of power failure.
2.7. Push Button
Meter has bifunctional push button (see picture 2-1). There is possibility to seal button in
position A (see fig. 2-1) so, that switching to position B without damage of seal is impossible.
In position A, push button is used to display specific information on LCD. Button provides following
commands:
• short signal (push and hold button for 0,5s);
• long signal (push and hold button for 2s).
Signals user provides by push button are identical to signals user provides to photosensor.
For detailed information about data display on LCD and readout sequences see chapter 5.
The position B of the push button is used for cumulation/reset (“end of the billing period”). For
detailed information see chapter 3.5.
Function of position “B” depends on user request and can be one of the following:
• “Cumulation/Reset”. Pushing button in this position provides “End of billing period”. For more
information, see chapter 3.5.
• Lock of optical interface. For more information see chapter 7.2.2
Implemented function of position “B” can be recognized by picture near to button:
- Position “B” is used for interface lock
Position “B” is used for Cumulation/ Reset
CHAPTER 3. DATA REGISTRATION
3. Data Registration
This chapter describes the way measured and calculated data are stored in the meter memory.
The data and parameter structure of the EPQS meter fully complies with international DLMS standard
(COSEM Identification System and Interface Objects, DLMS UA 100-1:2000). As provided by the
Standard, each value and parameter has its own OBIS (OBject Identification System) code that is
displayed on the indicator and stored in the meter memory.
The meter has two memory units: RAM memory and energetically independent FLASH memory for
data storage. In the case of power outage the data stored in RAM are lost while the data stored in
FLASH remain. The most of measured values are stored in RAM and are written in FLASH unit only
after the end of integration period, day, or month or when the power supply voltage drops below a
critical level.
At the end of each demand interval, energies of this period [+A, -A, R1, R2, R3, R4, +W, -W] are
written into the FLASH memory. From that data, a profile of average power demand of integration
period, i.e. load profile, is formed.
At the end of each day, a daily profile is written into appropriate FLASH memory registers. This profile
consists of the following data:
1. Daily energy consumption [+A, -A, R1, R2, R3, R4, +W, -W] by all tariffs [T1…T8].
2. Daily maximum demand [+P, -P, Q1, Q2, Q3, Q4, +S, -S] by all tariffs [M1…M8].
3. Timestamps of daily maximum demands.
The number of daily profiles stored in the meter memory depends on the number of activated demand
and energy tariffs. Table 3-1 lists the maximum number of daily profiles that can be stored in the
memory when a certain number of energy and power tariffs are activated.
Number of energy
tariffs
Table 3-1. Number of Daily Profile Records Stored in the Memory
Number of demand tariffs
1
2
3
4
5
6
7
8
1
817
583
453
370
313
271
238
213
2
510
407
339
290
254
225
202
184
3
370
313
271
238
213
193
176
161
4
290
254
225
202
184
168
155
144
5
238
213
193
176
161
149
139
130
6
202
184
168
155
144
134
126
118
7
176
161
149
139
130
122
115
108
8
155
144
134
126
118
111
105
100
At the end of each month, a monthly profile is written into the non-volatile memory. This profile
consists of the following data:
1. Total energy [+A, -A, R1, R2, R3, R4, +W, -W] by all tariffs [T1…T8].
2. Monthly energy [+A, -A, R1, R2, R3, R4, +W, -W] by all tariffs [T1…T8].
3. Monthly maximum demand [+P, -P, Q1, Q2, Q3, Q4, +S, -S] by all tariffs [M1…M8].
4. Timestamps of monthly maximum demands.
5. Cumulative demand [+P, -P, Q1, Q2, Q3, Q4, +S, -S] by all tariffs [M1…M8].
6. Date time stamp of the end of billing period.
The number of monthly profiles stored in the meter memory depends on the number of demand and
energy tariffs. Table 3-2 lists the maximum number of monthly profiles that can be stored at given
number of energy and demand tariffs.
Number of energy
tariffs
Table 3-2. Number of Monthly Profile Records Stored in the Memory
Number of demand tariffs
1
2
3
4
5
6
7
8
1
440
307
235
190
160
138
121
107
2
285
222
182
154
133
117
105
94
3
210
174
148
129
114
102
92
84
4
166
142
125
110
99
90
82
76
5
138
121
107
97
88
81
74
69
6
117
105
94
86
79
73
68
64
7
102
92
84
77
72
67
62
58
8
90
82
76
70
65
61
58
54
3.1. Energy Registration
The EPQS meter measures active electrical energy in both directions +A and –A; reactive electrical
energy in each quadrant R1, R2, R3, and R4; apparent electrical energy in both directions +W and –
W. All measured values of those parameters are stored in RAM memory unit. At the end of integration
period or in case of power failure, those values are written into appropriate FLASH memory registers.
During the registration, the appropriate quadrant into whose register data must be written is
determined by the direction of active electrical energy and the sign of reactive electrical energy.
Diagram 3-1 shows the way of determining of the energy and power quadrant by the signs of active
and reactive electrical energy.
Picture 3-1. The Way of Determining of Energy Quadrant
On the meter LCD, the load quadrant is indicated by different signs and letters.
CHAPTER 3. DATA REGISTRATION
The following electrical energy values are accumulated and stored in the meter memory:
• Integration period energy;
• Daily energy – by all tariffs and total.
• Monthly energy – by all tariffs and total.
• Total energy of each tariff and sum of all tariffs.
3.2. Demand registration
The meter calculates average power over integration period and based on the calculated data,
determines and registers maximum demands with their respective timestamps.
The EPQS meter registers values of maximum demand of active (+P, -P), reactive (Q1, Q2, Q3, Q4),
and apparent (+S, -S) power of each demand on daily and monthly basis. Monthly maximum demand
values are stored in monthly profiles and daily maximum demand - in daily profiles (see above).
The meter collects load profiles of active +A and -A; reactive R1, R2, R3, R4; apparent +W, -W
energy.
The values of average power of integration period are stored into appropriate load profile registers of
FLASH memory after the end of an integration period.
The meter memory can hold at least 8190 of values of average power of integration period for each
kind of energy. The duration of load profile data storage in the meter memory depends on the duration
of integration period. The duration of integration period can be set from 30 s to 3600 s at 1 s step. The
integration period is set upon the condition that the time interval of 1 hour can be divided into a whole
number of integration periods.
400
350
341
300
Days
250
200
170
150
100
85
50
0,5
1
28
17
5
2
0
3
5
15
30
60
Integration period, min
Picture 3-2. Load profile length dependency on integration period
3.3. Registration of Instantaneous Values
For registration of instantaneous values, the EPQS meter provides 16 freely programmed channels.
Table 3-5 lists values that can be registered by those freely programmed channels.
A freely programmed channel is an area in the meter FLASH memory.
A time interval between the two successive moments of registration of chosen value is called query
period. In the case of EPQS meter, all freely programmed channels have a common query period that
can be set from 30 s to 3600 s during parameterisation. The query period must be set so that the time
interval of 1 hour can be divided into a whole number of query periods.
The values are registered in freely programmed channels by one of the following algorithms:
At the time intervals of query period, an instantaneous value of chosen parameter is registered
• The minimum value over the query period is registered.
• The average value over the query period is registered.
• The maximum value over the query period is registered.
Algorithm is set independently for each channel.
Table 3-3. List of data, available to log into programmable channels
Instantaneous quantity
Current of phase L1
Current of phase L2
Current of phase L3
Voltage of phase L1
Voltage of phase L1
Voltage of phase L1
L1L2 line -to -line voltage
L1L3 line -to -line voltage
L2L3 line -to -line voltage
Total active power
Active power of phase L1
Active power of phase L2
Active power of phase L3
Total apparent power
Apparent power of phase L1
Apparent power of phase L2
Apparent power of phase L3
Total reactive power
Reactive power of phase L1
Reactive power of phase L2
Reactive power of phase L3
Frequency
Total power factor cos(ϕ)
Power factor cos (ϕ) of phase L1
Power factor cos (ϕ) of phase L2
Power factor cos (ϕ) of phase L3
Temperature
Battery voltage
OBIS code
31.7.0()
51.7.0()
71.7.0()
32.7.0()
52.7.0()
72.7.0()
12.7.1()
12.7.2()
12.7.3()
1.7.0()
21.7.0()
41.7.0()
61.7.0()
9.7.0()
29.7.0()
49.7.0()
69.7.0()
3.7.0()
23.7.0()
43.7.0()
63.7.0()
14.7.0()
13.7.0()
33.7.0()
53.7.0()
73.7.0()
130.0.17()
130.0.18()
The amount of information that can be accumulated in a single channel depends on the number of
activated channels.
Picture 3-3 shows this dependence.
CHAPTER 3. DATA REGISTRATION
14000
12286
Number of records
12000
9826
10000
8188
7018
8000
6142
6000
4000
2000
0
1
2
3
4
5
6
7
8
9
10
11
12
13
14
15
16
Num ber of channels
Picture 3-3. Channel capacity dependence on number of activated channels
In order to calculate how many days a record will be held in a freely programmed channel, formula 1
is used:
T=
N max ⋅ tint
1440
T – Duration of record storage in days
Nmax – Channel capacity (see chart 3-3)
tint – measuring interval duration in minutes
3.4. Power Quality Registration
The EPQS meter can register several parameters of power quality. During the parameterisation, the
permissible range of electrical network voltage and frequency fluctuations is set together with power
quality monitoring start date. At the date and time specified, the meter starts calculating the average
frequency value each 10 seconds, and the average voltage value – each 10 minutes.
The meter registers periods when the average frequency or voltage value does not comply with
requirements set during parameterisation and calculates voltage failures on each phase. According to
the calculated data, the following quality parameters are established:
• Time percentage when the network voltage and/or frequency did not meet the requirements at
least in one phase
• Number of power outages in each phase
Power quality parameters are recorded in weekly reports. The meter memory can hold up to 256
weekly reports of power quality.
Power quality measurement methods described in this document comply with the requirements of EN
50160 European Standard.
3.5. “End of billing period”
Meter automatically ends billing period at the end of calendar month. Therefore there are a few
possibilities to end billing period manually:
• By pushing button in position “Cumulation/Reset”;
• Sending command via optical interface (communication protocol IEC 62056-21);
• Sending command via electrical interface (communication protocol IEC 62056-31).
When user pushes button “Cumulation/Reset” or sends command via communication interface, a
message “Cumulative+Reset!” is displayed on the first line of the LCD.
Billing period can be manually ended only once per calendar month. If user attempts to end billing
period second time per calendar month, a message “Blocked” is displayed on first line of the LCD.
If billing period is ended manually, meter does not ends billing period automatically at the end of that
calendar month.
CHAPTER 4. TARIFF MODULE
4. Tariff Module
The EPQS meter supports up to 8 energy and 8 demand tariffs. The number of energy and demand
tariffs is set during parameterisation. Tariff module of the meter provides multi-tariff accounting
according to meter’s tariff program. Owner of the meter can change and configure tariff program
(operator password required). Tariff program is designed from 3 levels:
• Day program;
• Week program;
• Tariff seasons.
4.1. Day program
Day program is schedule that describes tariff switching during a day. Each tariff switchover is
described by one record in day program. It contains time of switchover, number of energy tariff to be
activated and number of demand tariff to be activated. Switchover time must be sinchronised with
hour raster. One day program supports up to 16 switchovers. Meter supports up to 127 different day
programs.
Energy tariffs and demand tariffs can be changed independently. That means switching energy tariff it
is not necessary to change demand tariff and visa versa.
Table 4-1 shows an example of the day program.
Table 4-1. An example of day program
Day program #1
07:00
T2
M2
09:00
T1
M1
12:00
T2
M2
19:00
T1
M1
21:00
T2
M2
23:00
T4
M4
4.2. Week program
The week program describes what day program is assigned for each day of week. Week program is a
list containing 8 numbers.
of them determines which day program is activated for each day of the week and for days-off. Up to
32 different week programs can be created. Different day programs may be applied for each day of
week or the same day program may be applied throughout the whole week. Table 4-2 shows an
example of week program.
Table 4-2. An example of week program
Monday
Tuesday
Wednesday Thursday
1
1
1
1
1
Friday
1
Saturday
2
Sunday
2
Days-off
2
4.3. Tariff Seasons
Tariff seasons let to change tariff application order several times per year, i. e. activate different week
programs on different seasons. A season defines date and time when necessary week program is
activated. Active and passive season program can be created, each describing up to 16 seasons.
The active season profile is a season profile used at the present moment.
The passive season profile is a season profile currently inactive but becoming active at the specified
year, month, day, and hour. The passive schedule lets to enter a new tariff schedule beforehand
(keeping the active schedule) and switch to it at some moment in the future. Table 4-3 shows an
example of active season profile.
Table 4-3. An example of tariff seasons
Date time
Week program
04.01 00:00
2
05.01 00:00
3
09.01 00:00
2
10.01 00:00
1
4.4. Special days
The meter has a special day register. When a new special day is entered into the register, the date
and day profile applicable on that day is specified. Each special day can be allocated a different day
program or several special days can share the same day program. The special day register holds up
to 256 days. If a year is specified besides a month and a day during the creation of a new special day
entry, this day shall be treated as a special day only in the specified year.
Table 4-4 shows an example of special day list.
Day
Day program
2004.03.31
2
2004.04.01
2
****.01.01
2
****.02.16
2
****.03.11
2
****.12.25
2
****.12.26
2
4.5. Tariff Module Operation in Case of Clock Failure
The tariff module manages tariff schedule on the basis of data received from a real-time clock. In the
case of clock failure (i. e., clock provides incorrect time data or no data at all), the management of
tariff schedule becomes impossible because real time is unknown. Should this happen, the
performance of tariff schedule is interrupted, and all energy and maximum power data are recorder
upon “default on failure” energy and power tariffs. Those “default on failure “ tariffs are defined during
the meter parameterisation.
CHAPTER 5. DATA DISPLAY MODES
5. Data Display Modes
All parameterisation constants entered into the meter, energy and power demand registers, as well as
electrical network monitoring data can be displayed on liquid crystal display (LCD). Data, meter
displays on LCD, sequence of display and other display settings are completely configurable
parameters.
Data display is organized in the following way:
1. All the data are divided into data groups, called sequences.
a. One sequence can contain up to 32 data to display. Data available to display on LCD
are listed in appendix A.
b. Sequence is recognized by the caption of the sequence (see picture 2-3). Caption is
set of 11 ASCII symbols.
c. Meter supports up to 32 sequences for automatic data display and up to 32 sequences
for manual data display.
There are two modes of data display: automatic cyclic data indication mode and static data indication
(manual data display).
5.1. Automatic Cyclic Data Indication Mode
While the meter is operating in its usual mode, selected data or parameters are displayed on the
screen at certain intervals. In this indication mode, display mode indicator is blinking symbol “%”. The
data to be displayed, their sequence, and screen refresh period is defined during the
parameterisation. Time of single readout display can be 1-600 s. Automatic cyclic data indication
mode is activated after no control signals are received specified time interval called “static indication
time”.
The sequence type indicator indicates automatic cyclic data indication mode. See chapter 5.3 “Data
Review Algorithms” for instructions how to switch between sequences in automatic cyclic indication
mode.
5.2. Static Data Indication Mode
When this mode is active, data are called up by actuating the control photo sensor by means of long
and short signals. In static data indication mode, display mode indicator is symbol “/”.
A signal is considered “long” if its duration is 2 s.
A signal is considered “short” if its duration is 0.5 s.
The static mode is activated by means of long signal and the cyclic indication mode if activated
automatically if no signals are received during the specified time interval called “static indication time”.
This interval is defined during the parameterisation and can be from 1 s to 600 s.
For data review algorithm in static indication mode, see the chapter “Data Review Algorithms”.
5.3. Data Review Algorithms
Picture 5-1 shows a data review algorithm demonstrating the way of activating the necessary cyclic
indication sequence. The diagram also shows algorithms for data review in static indication mode.
After the meter switches to cyclic indication mode, it activates a cyclic indication sequence with the
same number as the sequence of static indication mode that was active before the switchover. If no
cyclic indication sequence bears that number, the first sequence is activated. If the first static
indication sequence has been activated, the cyclic indication mode does not activate automatically.
Picture 5-1. Data scrolling diagram
When the meter operates in cyclic indication mode, the sequences can be switched by means of short
light signals.
When the meter operates in cyclic indication mode, static indication mode is activated by means of
long light signal.
CHAPTER 5. DATA DISPLAY MODES
6. Parameterisation
The EPQS meter is parameterised through the optical or first electrical interface. For
parameterisation, QuadrCom software developed by ELGAMA-ELEKTRONIKA Ltd. is used. Each
parameterisation session is recorded in the event logbook together with timestamp. Before each
parameterisation, it is necessary to download all data to a computer because some accounting data
might be erased from the memory during the parameterisation. Table 6-1 lists what data on what
conditions are erased from the memory during the parameterisation.
Table 6-1
+
+
-
+
-
+
+
+
-
+
+
+
-
+
+
+
-
+
+
+
-
+
-
+
-
Log book
+
+
+
-
Quality
monitoring report
Monthly energy
Daily max.
demand
+
+
+
-
Cumulative
demand
+
-
Monthly max.
demand
Date and Time
Clock adjustment
Integration period
Transformation coefficients
Programmable channels
Measurement interval
Start date of quality monitoring
Other parameters
Daily energy
Changed parameters
Programmable
channels
Load Profiles
Data
-
7. Meter Data Protection
The EPQS meter has features of physical and software protection of data and parameters from
unauthorised actions.
7.1. Physical Protection of Data and Parameters
The meter is protected from an unauthorised access by the following physical measures:
Sealed front cover
Sealed terminal block
Registration of cover opening actions in event logbok
The sealed front cover moulded from transparent plastic restricts the access to the meter circuitry
located under the front panel. The transparent plastic cover is fixed by two sealed screws. One screw
is sealed with the manufacturer’s seal, the other – with metrology centre seal.
The terminal block is sealed after the meter is installed at the user premises. The sealing is performed
by a representative of the organisation that installed the meter.
7.2. Software Protection
The meter has software measures of data protection and the event logbook, for recording parameter
changes and attempts to affect the accuracy of calculations.
7.2.1. Password
All data stored in the meter are password-protected and have various access levels. There are two
levels of access to the meter data and parameters: “user” level (allows data review and changing of
some parameters) and “operator” level (allows review of all data and changing of almost all meter
parameters).
The user password grants rights to change only some of the parameters. Table 7-1 lists parameter
access levels. Each time the connection is established through the communication interfaces, the
meter asks the password. The password consists of any 8 symbols. No parameters can be changed
until the correct password has been provided. If incorrect password is entered four times in a day, the
communication interfaces will be locked for 24 hours. During that period communication is impossible.
7.2.2. Lock of optical interface (optional)
On the user request, meter can be equipped with function “lock of optical interface”. There are
following types of lock:
• Full lock. User is not allowed to communicate with meter until interface is unlocked.
• Lock of parameters. User is not allowed to change meter parameters, but permitted to read all
the meter data.
To unlock optical interface, user needs to push and hold button in position “B” for a second.
7.2.3. Event logbook
The event logbook is a meter memory area that stores the data on the last 8190 events or states.
Table A-5 of Annex A lists events and states that are recorded in the event logbook.
Each event is recorded together with its date and time stamp; if a state is recorded, its beginning and
end date and time stamps are recorded as well.
This information can be displayed on the screen or transmitted through the communication interfaces.
CHAPTER 7. METER DATA PROTECTION
7.2.4. Counters and Timers
The EPQS meter has a set of counters and timers for counting of events and registering of state
durations. After a certain event takes place, the value of respective counter increases by one, and
after a state has been registered, a respective timer starts counting its duration.
7.2.5. Protection of Factory Constants
During factory parameterisation, various factory constants are entered in the meter memory. Changes
of those constants may affect measurement accuracy; therefore software and mechanical measures
for protection of factory constants are installed. Factory constants may be changed only with the
meter cover taken off and with special software
Table 7-1. Access levels
Parameter
Telemetry output constant
Customer name (15 symbols)
Location (15 symbols)
Configuration bits
Current and voltage transformer ratios
Values of nominal, minimum, and maximum voltage, current, and frequency
Integration period duration
Beginning of settlement period
Clock adjustment to daylight saving changes
Duration of cyclic data indication
Duration of static data indication
Number of activated energy and demand tariffs
Activation of passive seasons
Tariff application order
Measurement period of freely programmed channel
Start of power quality monitoring
Telemetry outputs
User password
Operator password
Daily tariff schedules
Static indicator sequence tables
Cyclic indicator sequence tables
Static indicator sequence headings
Cyclic indicator sequence headings
Special days
Week programs
Active tariff seasons
Passive tariff seasons
Freely programmed channels
Formats of data output to display screen
Access level
Operator
Operator
Operator
Operator
Operator
Operator
Operator
Operator
Operator
User
User
Operator
Operator
Operator
Operator
Operator
Operator
User
Operator
Operator
User
User
User
User
Operator
Operator
Operator
Operator
Operator
Operator
Annex A. Data available to display on LCD
Table A-1. Energy Data
Name
Full
Total positive active energy
Total negative active energy
Total positive reactive energy
Total negative reactive energy
Total reactive energy of I quadrant
Total reactive energy of II quadrant
Total reactive energy of III quadrant
Total reactive energy of IV quadrant
Positive apparent energy
Negative apparent energy
Monthly positive active energy
Monthly negative active energy
Monthly positive reactive energy
Monthly negative reactive energy
Monthly reactive energy of I quadrant
Monthly reactive energy of II quadrant
Monthly reactive energy of III quadrant
Monthly reactive energy of IV quadrant
Monthly positive apparent energy
Monthly negative apparent energy
Daily positive active energy
Daily negative active energy
Daily positive reactive energy
Daily negative reactive energy
Daily reactive energy of I quadrant
Daily reactive energy of II quadrant
Daily reactive energy of III quadrant
Daily reactive energy of IV quadrant
Daily positive apparent energy
Daily negative apparent energy
Positive active energy of integration period
Negative active energy of integration period
Positive reactive energy of integration period
Negative reactive energy of integration period
Energy of I quadrant of integration period
Energy of II quadrant of integration period
Energy of III quadrant of integration period
Energy of IV quadrant of integration period
Positive apparent energy of integration period
Negative apparent energy of integration period
Abbreviated
+Atot_T1…T8, TΣ
-Atot_T1…T8, TΣ
+Rtot_T1…T8, TΣ
-Rtot_T1…T8, TΣ
R1tot_T1…T8, TΣ
R2tot_T1…T8, TΣ
R3tot_T1…T8, TΣ
R4tot_T1…T8, TΣ
+Wtot_T1…T8, TΣ
-Wtot_T1…T8, TΣ
+Amon_T1...T8, TΣ
-Amon_T1...T8, TΣ
+Rmon_T1…T8, TΣ
-Rmon_T1…T8, TΣ
R1mon_T1...T8, TΣ
R2mon_T1...T8, TΣ
R3mon_T1...T8, TΣ
R4mon_T1...T8, TΣ
+Wmon_T1..T8, TΣ
-Wmon_T1...T8, TΣ
+Aday_T1...T8, TΣ
-Aday_T1...T8, TΣ
+Rday_T1...T8, TΣ
-Rday_T1...T8, TΣ
R1day_T1...T8, TΣ
R2day_T1...T8, TΣ
R3day_T1...T8, TΣ
R4day_T1...T8, TΣ
Wday_T1...T8, TΣ
Wday_T1…T8, TΣ
+A_per
-A_per
+R_per
-R_per
R1_per
R2_per
R3_per
R4_per
+W _per
-W _per
OBIS
code
1.8.T
2.8.T
3.8.T
4.8.T
5.8.T
6.8.T
7.8.T
8.8.T
9.8.T
10.8.T
1.9.T
2.9.T
3.9.T
4.9.T
5.9.T
6.9.T
7.9.T
8.9.T
9.9.T
10.9.T
1.10.T
2.10.T
3.10.T
4.10.T
5.10.T
6.10.T
7.10.T
8.10.T
9.10.T
10.10.T
1.29.0
2.29.0
3.29.0
4.29.0
5.29.0
6.29.0
7.29.0
8.29.0
9.29.0
10.29.0
Comments
T - energy tariff[1 … 8]
T=0 - sum of all tariffsIt
is also possible to
review total energies
registered at the end of
previous billing periods
(months).
T - energy tariff[1 … 8]
T=0 - sum of all tariffsIt
is also possible to
review energies over
previous billing periods
T - energy tariff[1 … 8]
T=0 - sum of all tariffsIt
is also possible to
review energies over
previous days.
It is also possible to
review
energies
of
previous
integration
periods.The 4th row on
the
LCD
screen
indicates timestamp of
the displayed data.
APPENDIX A. DATA AVAILABLE TO DISPLAY ON LCD
Table A-2. Demand Data
Name
Full
Demand of current integration period
Demand of last integration period
OBIS code
Comments
Abbreviated
+P_curr
-P_curr
Q1_curr
Q2_curr
Q3_curr
Q4_curr
+S_curr
-S_curr
+P_last
-P_last
Q1_last
Q2_last
Q3_last
Q4_last
+S_last
-S_last
1.4.0
2.4.0
5.4.0
6.4.0
7.4.0
8.4.0
9.4.0
10.4.0
1.5.0
2.5.0
5.5.0
6.5.0
7.5.0
8.5.0
9.5.0
10.5.0
On the 4th row on the
LCD
screen,
the
integration
period
duration [s] and time left
until the end of current
integration period is
indicated
+P_dayM1...M8
-P_dayM1...M8
Q1_dayM1...M8
Q2_dayM1...M8
Q3_dayM1...M8
Q4_dayM1...M8
+S_dayM1...M8
-S_dayM1...M8
+P_monM1...M8
-P_monM1...M8
Q1_monM1...M8
Q2_monM1...M8
Q3_monM1...M8
Q4_monM1...M8
+S_monM1...M8
-S_monM1...M8
+P_cumM1…M8
-P_cumM1…M8
Q1_cumM1…M8
Q2_cumM1…M8
Q3_cumM1…M8
Q4_cumM1…M8
+S_cumM1…M8
-S_cumM1…M8
1.26.M
2.26.M
5.26.M
6.26.M
7.26.M
8.26.M
9.26.M
10.26.M
1.16.M
2.16.M
5.16.M
6.16.M
7.16.M
8.16.M
9.16.M
10.16.M
1.12.M
2.12.M
5.12.M
6.12.M
7.12.M
8.12.M
9.12.M
10.12.M
M - demand tariff [1 …
8]. The 4th row indicates
timestamp. The 4th
symbol of OBIS code
indicates the position
number of day (0 current
day,
1
yesterday, etc.).
On the 4th row on the
LCD, duration of integration period [s] and
time left until the end of
current
integration
period is indicated.
Table A-2 (continue). Demand Data
Daily maximum demand
Monthly maximum demand
Cumulative demand
M - demand tariff [1 …
8]. The 4th row indicates
timestamp. The 4th
symbol of OBIS code
indicates the position
number of month (0 current month, 1 - last
month, etc.).
M - demand tariff [1 …
8].The 4th symbol of
OBIS code indicates the
month to which belongs
the
data
currently
displayed (0 - current
month, 1 - last month,
etc.)
Table A-3. Instantaneous Data
Name
Full
Current in phase L1
Current in phase L2
Current in phase L3
Voltage in phase L1
Voltage in phase L2
Voltage in phase L3
Line voltage of phases L1 L2
Line voltage of phases L1 L3
Line voltage of phases L2 L3
Total active power in all phases
Active power in phase L1
Active power in phase L2
Active power in phase L3
Total apparent power in all phases
Apparent power in phase L1
Apparent power in phase L2
Apparent power in phase L3
Total reactive power in all phases
Reactive power in phase L1
Reactive power in phase L2
Reactive power in phase L3
Frequency
Resultant cos(ϕ) in all phases
cos(ϕ) power in phase L1
cos(ϕ) power in phase L2
cos(ϕ) power in phase L3
OBIS code
Abbreviated
Irms_L1
Irms_L2
Irms_L3
Urms_L1
Urms_L2
Urms_L3
Urms_L12
Urms_L13
Urms_L23
Pins_LS
Pins_L1
Pins_L2
Pins_L3
Sins_LS
Sins_L1
Sins_L2
Sins_L3
Qins_LS
Qins_L1
Qins_L2
Qins_L3
Freq_
PFins_LS
PFins_L1
PFins_L2
PFins_L3
31.7.0
51.7.0
71.7.0
32.7.0
52.7.0
72.7.0
12.7.1
12.7.2
12.7.3
1.7.0
21.7.0
41.7.0
61.7.0
9.7.0
29.7.0
49.7.0
69.7.0
3.7.0
23.7.0
43.7.0
63.7.0
14.7.0
13.7.0
33.7.0
53.7.0
73.7.0
Comments
APPENDIX A. DATA AVAILABLE TO DISPLAY ON LCD
Table A-4. Parameters
Name
OBIS code
Abbreviated
IDENTIFIERS
Vendor ID
Vendor
96.1.1
Model ID
Model
96.1.2
Version ID
Version
96.1.3
Meter number
Number
96.1.4
User ID
User
96.1.5
Location ID
Location
96.1.6
User password
Passw_1
0.61.0
Operator password
Passw_2
0.62.0
Manufacturer password
Passw_3
0.63.0
CALIBRATION CONSTANTS
Current and voltage
IU_cal.
96.60.0
Current phase shift
ph_cal
96.61.0
Active power offset
Poffset
96.62.0
Reactive power offset
Qoffset
96.63.0
Hilbert's transformation constant
Hilbert
96.64.0
Sensitivity threshold
Thresh
96.65.0
Clock adjustment factor
Clock adjustment
96.66.0
PARAMETERISATION CONSTANTS
LED output constant
LED out
0.3.0
pulse output constant
TM out
0.3.3
Current and voltage transformer ratio
Transf.
0.4.0
Nominal values and their permissible ranges Nominal
0.6.0
Demand and billing periods
IntgPer
0.8.0
Summer/Winter time changeover
DaySave
0.50.0
Duration of static and cyclic LCD sequences Show_tm
0.51.0
Number of tariffs and default on failure tariffs Tariffs
0.52.0
Query period of freely programmed FreePer
0.53.0
channels
Power quality monitoring start
PQM_beg
0.54.0
Telemetry outputs
S0
0.55.0
Temperature range
0.56.0
Passive tariff activation date
0.57.0
Relay 1
0.58.0
Relay 2
0.59.0
Data display formats
0.60.0
INDICATION PROFILES
Tariff table
Tariffs
13.0.0
Special day table
Specday
11.0.0
Programmed channels
130.0.K
PARAMETERISED PROFILES
Day profiles
99.60.0
Static indication sequence table
99.61.0
Cyclic indication sequence table
99.62.0
Static indication sequence headers
99.63.0
Cyclic indication sequence headers
99.64.0
Special days
99.65.0
Week profiles
99.66.0
Active tariff seasons
99.67.0
Passive tariff seasons
99.68.0
Programmed channels
99.69.0
Full
Comments
Extended
Extended
Extended
K-channel No.
Table A-5. Events and States
Name
Full
Voltage of all phases
Voltage in phase L1
Voltage in phase L2
Voltage in phase L3
Meter error
Meter reset
Watchdog reset
Incorrect operation
Effect of magnetic field
Effect of unfavourable temperature
Wrong password: access blocked
Manufacturer access granted
Case open
Clock adjustment
Reset of cumulative demand data
Remote parameterisation
Local parameterisation
Summer time
Reverse phase sequence
MKI 1 relay state
MKI 2 relay state
Reset of daily energy data
Reset of monthly energy data
Reset of daily maximum demand data
Reset of monthly maximum demand data
Clock
Temperature
Battery voltage
Abbreviated
Power
U_L1
U_L2
U_L3
Error
Reset
WatchDg
Illegal
Magnet
Temper.
Blocked
VendorA
Cover_o
Clock_s
Cum_res
Conf_re
Conf_lo
Summer
L132
MKI 1
MKI 2
Eday_re
Emon_re
Pday_re
Pmon_re
OBIS code
140.0.1
140.0.2
140.0.3
140.0.4
140.0.5
140.0.6
140.0.7
140.0.8
140.0.9
140.0.10
140.0.11
140.0.12
140.0.13
140.0.14
140.0.15
140.0.16
140.0.17
140.0.21
140.0.22
140.0.23
140.0.24
140.0.25
140.0.26
140.0.27
140.0.28
1.0.0
130.0.18
130.0.18
Comments
State
State
State
State
Event
Event
Event
Event
State
State
State
State
Event
Event
Event
Event
Event
State
State
State
State
Event
Event
Event
Event
Table A-6. Timers and Counters
Name
Full
Meter operation timer
Battery operation timer
Timer of magnetic field effect duration
Timer of unfavourable temperature effect duration
Three-phase voltage failure counter
Magnetic field effect counter
Unfavourable temperature effect counter
Billing period counter
Cover opening event counter
Wrong password counter
Clock adjustment counter
Counter of cumulative power demand data reset
Remote parameterisation session counter
Local parameterisation session counter
Watchdog reset counter
Illegal operation counter
Meter reset counter
Meter error counter
Abbreviated
Work_tm
Batt_tm
Magn_tm
Temp_tm
Outages
Magn_ct
Temp_ct
Account
Cover_o
Passw_e
Clock_s
Cum_res
Conf_re
Conf_lo
WDg_res
Ill_ops
Err_res
Err_cnt
OBIS code
96.70.1
96.70.2
96.70.3
96.70.4
96.70.5
96.70.6
96.70.7
96.70.8
96.70.9
96.70.10
96.70.11
96.70.12
96.70.13
96.70.14
96.70.15
96.70.16
96.70.17
96.70.18
APPENDIX A. DATA AVAILABLE TO DISPLAY ON LCD
Table A-6. Energy Quality Monitoring
Name
Full
Voltage in phase L1 under limit occurrence counter
Voltage in phase L2 under limit occurrence counter
Voltage in phase L3 under limit occurrence counter
Voltage in phase L1 over limit occurrence counter
Voltage in phase L2 over limit occurrence counter
Voltage in phase L3 over limit occurrence counter
Frequency under limit occurrence counter
Frequency over limit occurrence counter
Power outages in phase L1 counter
Power outages in phase L2 counter
Power outages in phase L3 counter
Abbreviated
Uund_L1
Uund_L2
Uund_L3
Uove_L1
Uove_L2
Uove_L3
f_under
f_over
Uoff_L1
Uoff_L2
Uoff_L3
OBIS code
32.32.0
52.32.0
72.32.0
32.36.0
52.36.0
72.36.0
14.32.0
14.36.0
32.40.0
52.40.0
72.40.0