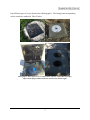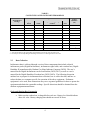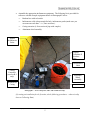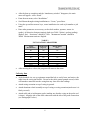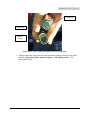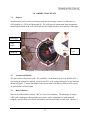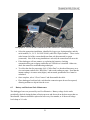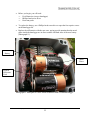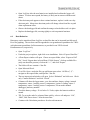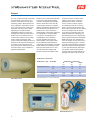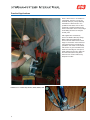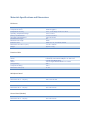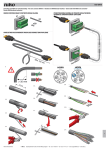
1
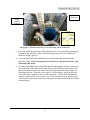
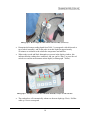
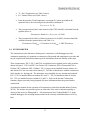
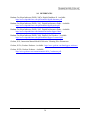
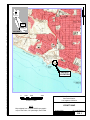
Geotechnical Instrumentation Report White Point Landslide San Pedro District Los Angeles, California August 21, 2014 Submitted To: Mr. Craig Kunesh City of Los Angeles Department of Public Works Bureau of Engineering 1149 S. Broadway, Suite 120 Los Angeles, CA 90015 By: Shannon & Wilson, Inc. 664 West Broadway Glendale, CA 91204 51-1-10079-033 / 51-1-10111-001 TABLE OF CONTENTS Page 1.0 GENERAL .............................................................................................................................1 2.0 INCLINOMETERS ................................................................................................................2 2.1 Purpose .......................................................................................................................2 2.2 Location and Details...................................................................................................2 2.3 Data Collection ...........................................................................................................4 2.4 Data Reduction .........................................................................................................11 2.5 Monitoring and Reporting Recommendations .........................................................12 3.0 OBSERVATION WELLS ...................................................................................................13 3.1 Purpose .....................................................................................................................13 3.2 Location and Details.................................................................................................13 3.3 Data Collection .........................................................................................................13 4.0 VIBRATING WIRE PIEZOMETERS.................................................................................15 4.1 Data Collection .........................................................................................................15 4.2 Piezometric Calculation ...........................................................................................15 5.0 EXTENSOMETER ..............................................................................................................17 5.1 Data Collection .........................................................................................................18 5.2 Deformation Calculation ..........................................................................................18 6.0 DATALOGGERS ................................................................................................................19 6.1 LogView Installation ................................................................................................19 6.2 Data Collection .........................................................................................................20 6.3 Battery and Desiccant Pack Maintenance ................................................................21 6.4 Data Reduction .........................................................................................................23 7.0 DYNA FORCE SYSTEM ....................................................................................................24 7.1 General .....................................................................................................................24 7.2 Data Collection .........................................................................................................24 8.0 LIMITATIONS ....................................................................................................................28 9.0 REFERENCES .....................................................................................................................30 51-1-10111-001 51-1-10079-033-R1/wp/ady i TABLE OF CONTENTS (cont.) Page TABLES 1 2 3 4 5 6 Location of Instrumented Borings ...........................................................................2 Cover Types Over Instrumented Borings ................................................................4 Installation Parameters .............................................................................................6 Observation Well ...................................................................................................14 Vibrating Wire Piezometer (VWP) Calibration Parameters ..................................16 Extensometer Calibration Parameters ....................................................................19 FIGURES 1 2 Vicinity Map Site and Instrumentation CD OF ELECTRONIC DATA FILES WhitePoint.dpw (DigiPro2) WhitePoint.lvpe (LogView) VWPs.xls (Excel) Extensometers.xls (Excel) DynaForce.xls (Excel) APPENDICES A B Dyna Force User’s Manual and Brochure Important Information About Your Geotechnical/Environmental Report 51-1-10111-001 51-1-10079-033-R1/wp/ady ii GEOTECHNICAL INSTRUMENTATION REPORT WHITE POINT LANDSLIDE 5-YEAR MAINTENANCE AND MONITORING PLAN SAN PEDRO DISTRICT, LOS ANGELES, CALIFORNIA 1.0 GENERAL This report presents our geotechnical instrumentation maintenance and monitoring recommendations for the White Point Landslide. The project site is located as shown in the attached Figure 1, Vicinity Map. This report supersedes our previous Geotechnical Instrumentation Report dated December 19, 2012 in its entirety. These recommendations provide the minimum standard of care for maintenance and monitoring for this project site. Our recommendations include monitoring frequency, reporting, and action thresholds for individual systems, as follows: Inclinometers Groundwater Wells Vibrating Wire Piezometers (VWPs) Vibrating Wire (VW) Crackmeters (Extensometers) DYNA Force® electro-magnetic sensors Details of our subsurface explorations and installation of instrumentation are in our Final Geotechnical Report dated August 15, 2012 (Final Report), our Addendum Geotechnical Report No. 1 dated December 19, 2012 (Add-1 Report), and our Data Report for White Point Landslide Boring B-12 dated July 3, 2014 (B-12 Report). For convenience, latitude and longitude of the instrumented borings and locations of the logs (including revisions) are provided in Table 1 below. Data files collected by Shannon & Wilson for the project are provided on compact disk included with this report. For the instrumentation described below, we recommend a minimum frequency of instrumentation readings of at least three months. Additional readings should be taken following large storm events, reports of landslide movement, or other circumstance that suggest changes to the subsurface conditions at and around the landslide as determined by the City. 51-1-10111-001 51-1-10079-033-R1/wp/ady 1 TABLE 1 LOCATION OF INSTRUMENTED BORINGS Instrumented Borings Latitude Longitude Northing Easting Log of Boring B-1 33.7153498707 -118.313740393 1718939.65735 6466248.35559 Add-1 Report B-3 33.7151320791 -118.311955256 1718858.70671 6466791.02398 Final Report B-5 33.7154232354 -118.312770158 1718965.43738 6466543.51657 Final Report B-6 33.7159803536 -118.312136945 1719167.59069 6466736.72533 Final Report B-7 33.7148147179 -118.311823625 1718743.08529 6466830.69885 Add-1 Report B-8 33.7152161498 -118.311469122 1718888.84407 6466938.96726 Final Report B-9 33.7156985883 -118.312561590 1719065.44918 6466607.26000 Final Report B-10 33.7147985487 -118.311435325 1718736.83469 6466948.77511 Add-1 Report B-11 33.7146408505 -118.311359063 1718679.37175 6466971.79119 Add-1 Report B-12 33.7146179 -118.311165129 1718670.83688 6467030.74712 Data Report Notes: 1. Latitude and Longitude were obtained from City of Los Angeles Survey. 2. Northings and Eastings are in feet, projected from NAD 1983 Stateplan California V FIPS 0405. 2.0 INCLINOMETERS 2.1 Purpose A slope inclinometer is a device for monitoring lateral ground movements and subsurface deformation normal to the axis of an inclinometer casing by means of a portable probe passing through the casing. It can provide indications of developing instabilities; allow the assessment of pattern, depth, and rate of movement; and help observers with decisions on possible remedial actions to such movements. 2.2 Location and Details We installed seven inclinometer casings to permit periodic monitoring in Borings B-1, B-5, B-7, and B-9 though B-12 at the locations shown in Figure 2. The inclinometer casings, manufactured by the Durham Geo Slope Indicator Company, are constructed of acrylonitrile/butadiene/styrene plastic, with internal longitudinal machined grooves aligned at 90 degrees to each other around the interior perimeter of the casing. The grooves allow for tracking and orientation of the inclinometer probe throughout the length of the casing. They are constructed using 2.75-inch outside diameter (O.D.) inclinometer casing or a 3.34-inch O.D. casing. The vertical installations are coupled to the surrounding subsurface through the borehole backfilled with cement-bentonite grout. They are sealed from the surface environment using 51-1-10111-001 51-1-10079-033-R1/wp/ady 2 four different types of covers shown below (Photograph 1). The borings and corresponding socket wrench are outlined in Table 2 below. Photograph 1 –Three types of covers: square black (top left), round white (top right), square black spring-loaded (bottom left), and cast iron (bottom right). 51-1-10111-001 51-1-10079-033-R1/wp/ady 3 TABLE 2 COVER TYPES OVER INSTRUMENTED BORINGS Instrumented Borings Cover Type Square Black Round White B-1 Square Black Spring Loaded1 Cast Iron X Socket Diameter (in) 15/16 B-3 X 9/16 B-5 X 9/16 B-6 X 15/16 B-7 X 15/16 B-8 X 15/16 B-9 X 15/16 B-10 X 3/4 B-11 X 3/4 B-12 X N/A2 Note: 1. Note that the bolts on the square black spring-loaded covers do not come out of the cover. 2. B-12 may be accessed by lifting the lid using a screw driver or other rigid item as a lever bar. 2.3 Data Collection Inclinometer data is collected through a series of three components that include a biaxial inclinometer probe (Digitilt Inclinometer), inclinometer signal cable, and a readout box (Digitilt DataMate II) manufactured by Durham Geo Slope Indicator Company (DGSI). The user’s manual for the Digitilt Inclinometer can be found online (DGSI, 2011), as well as a user’s manual for the Digitilt DataMate II readout box (DGSI, 2007a). The following discussion outlines how to prepare for inclinometer data collection, how to collect the data, and how to reduce the data on a computer specific for operation of the above equipment. If alternate equipment is to be used, these instructions may serve as general guidelines for how to operate the equipment and obtain the repeatable readings. Specific directions should be obtained from the alternate equipment manufacturer. Probe and Readout Box Preparation Make sure the readout box is charged before each use. Battery level should indicate above 6.0 volts. Battery charging time should not exceed 24 hours. 51-1-10111-001 51-1-10079-033-R1/wp/ady 4 Assemble the appropriate inclinometer equipment. The following list is provided for reference with the example equipment shown in Photograph 2 below: ― Readout box with red switch. ― Inclinometer cable (deep enough for hole, inclinometer probe (make sure you use same one each time – i.e., same serial no.). ― Casing extension (1-foot section of pipe with coupler). ― Aluminum wheel assembly. Digitilt Inclinometer Probe Digitilt DataMate II Readout Box Inclinometer Cable Casing Extension (used on B-1 only) Aluminum Wheel Assembly Inclinometer Casing Red Switch Photograph 2 – View of the probe, cable, and readout box setup. (If creating an installation for the first time, do the following procedures – otherwise skip down to Collecting Data) 51-1-10111-001 51-1-10079-033-R1/wp/ady 5 After the boot up completes and the “introductory window” disappears, the main menu will appear - select “Read.” From the next menu, select “Installation.” Scroll down through existing installations to “Create,” press Enter. Using the up and down arrow keys, create installation site such as job number or job name. Enter other parameters as necessary, such as hole number, operator, sensor s/n (probe), A0 direction, bottom (starting) depth (see Table 3 below), and top (ending) depth (4 feet). “Increment” should be 2 feet. “Instrument Constant” should be 20000. Measurement units are English. TABLE 3 INSTALLATION PARAMETERS Casing Identification A0 Direction (degrees) Bottom Depth (feet) B-1 B-5 B-7 B-9 180 230 228 207 128 120 116 114 B-10 218 130 B-11 202 130 B-12 222 130 After entering these values, the program will return to the menu. Collecting Data At the borehole site, set up equipment around the hole to easily lower and retrieve the cable from the casing into bucket. Do not let the cable contact ground or mud, which will introduce materials into the casing that may later affect the readings. Attach casing extension to top of casing in ground. Attach aluminum wheel assembly to top of casing or casing extension (make sure it is firmly secured). Attach cable end to inclinometer probe (making sure that the o-ring on the probe end is intact). Align the ribs of the cable connection with the ribs of the probe connection (see Photograph 3 below). 51-1-10111-001 51-1-10079-033-R1/wp/ady 6 Cable Rib Probe Rib Black ORing Photograph 3 – How to inspect and align the probe before tightening. Tighten connection with wrench in probe box while holding at the top of the probe assembly (do not hold probe wheels to tighten – will damage probe!). See Photograph 4 below. 51-1-10111-001 51-1-10079-033-R1/wp/ady 7 Photograph 4 – How to tighten the probe. Turn on the readout box by lifting and pushing the power tab, and make cable connections. Connect the other end of the probe cable. Select “Read.” Scroll down through the list of installations to locate the site to be read, select “Enter.” Select “Enter” for each line shown, which will advance the program through the previously defined parameters. Change only the existing parameters shown if a different operator, different probe S/N, or different starting/ending depth is used. When the program has gone through the parameters, a window will appear with the bottom (starting) reading depth, an “A0”, a “B0”, and reading values for each direction. Align the probe with the grooves in the casing that are marked by dark marker, or A0-direction. This is generally set up in the direction of anticipated direction of movement (Photograph 5). 51-1-10111-001 51-1-10079-033-R1/wp/ady 8 A0 Direction Dark Marker Probe wheels facing up Photograph 5 – Relation between the grooves of the casing and the A0 direction. Lower the probe down into the casing with the probe’s wheel assemblies pointing up towards the A0-direction. Make sure that the upper and lower sets of wheels are inside the casing’s grooves. Lower the probe and cable carefully down to the bottom depth specified for the particular casing. Do not let the probe free fall or lower fast down the hole – this will damage the probe. To ensure repeatability between different people monitoring the casings, consistently line up the edge of the mark on the cable closest to the borehole (red or yellow foot mark) with the back side of the wheel assembly (right behind the cable clamps), see Photograph 6 below. With the wheel in place, it is then about 1 foot from the back side of the wheel assembly to the top of the extension. The top of the inclinometer casing is considered the “zero” point, so if a 1-foot extension is used, subtract about 2 feet from the cable mark at the back of the pulley assembly to determine the bottom (starting depth). 51-1-10111-001 51-1-10079-033-R1/wp/ady 9 Photograph 6 – How to align the cable with the wheel assembly (red arrow). Determine the bottom reading depth from Table 3 (corresponds with cable mark at top of wheel assembly), and let the probe sit at this depth for approximately 10 minutes to acclimate to the subsurface temperature and stabilize. When ready to read and black diamonds are present in the display window, this indicates that the readings have stabilized, and you can hit “Enter” or press the red switch to record the measurement at that depth (see Photograph 7 below). Photograph 7 – Example of readout box with black diamonds, ready to record at 46 feet. The readout box will automatically advance to the next depth (up 2 feet). Pull the cable up 2 feet to correspond. 51-1-10111-001 51-1-10079-033-R1/wp/ady 10 2.4 If advancement of the cable takes the mark more than a 1/4-inch past the back of the wheel assembly, lower the probe back down a foot and bring it back up to the mark. Always take readings bringing the probe up, not lowering down (this will keep the cable in tension). Continue this process to the top depth reading. Periodically confirm the readout depth indicators with the actual top of casing depth on the cable. If the numbers on the readout box do not correspond with the depth on the cable, press the arrow keys on the box to drop back to a lower depth, hit “Enter,” and then lower the probe down past the depth indicated and back up. When at the correct depth, press “Enter” to engage the readout. The previous and the current readings for that depth are then displayed. If the readings match on display, then hit “Enter” and resume monitoring again. If they do not, go deeper and repeat process. Once readings are completed in one direction, the readout box shows a menu - select “Continue.” Take the probe out of the casing, and turn it around 180 degrees – with wheels pointing down in the A0-direction. Lower to bottom again (confirm that the wheels are in the pipe grooves), and set the cable in the assembly to correspond to the bottom reading depth. Let probe acclimate for only about five minutes (as it just came out of the casing). Start readings again, pulling cable up every 2 feet as before. When at the top depth and done reading, select “Validate” to check on quality of the readings. The readout will take a moment to “calculate,” and then display the “Mean” and “Standard Deviation” for both the “A” and “B” directions. The mean is an average of the check sums of each reading. This value is generally less than 10 (absolute value) in the “A” direction, and less than 20 in the “B” direction. A lower standard deviation value results in better data (0 being ideal). If the mean values are greater than 20 in the “A” direction, or 50 in the “B” direction, a second set of readings should be performed. When finished with reading this installation, select “Done” from the menu, and dataset will be stored automatically. For baseline readings, we recommend completing three sets of readings. Data Reduction Graphing software is recommended for reviewing collected data. A single inclinometer survey may generate several hundred data points. Over time, tens of thousands of data points are 51-1-10111-001 51-1-10079-033-R1/wp/ady 11 manipulated, reduced, graphed, and archived in the inclinometer project database. Slope Indicator's DigiPro2 software for Windows is designed to expedite this process. You can download a trial version of the program on Slope Indicator’s website (DGSI, 2012). A user’s manual for DigiPro2 is located on their website (DGSI, 2014). Uploading Readout Box Data to Computer 2.5 To upload the inclinometer data from the readout box to the computer, use the USB Communications cable (COM-109). Plug the round end of the cable into the “USB” portal on the readout box and the USB end of the cable into the computer. Open DigiPro2 on your computer. For a new installation, select “File – New”. Navigate to a location to save your file and give it a name. This will be saved as a .dpw format. Go to “File – Open.” Navigate to the *.dpw file. Use the switch to turn on the DataMate and select “Communicate.” In DigiPro2, select “DataMate - Retrieve New.” Next, plot the data on a cumulative displacement plot, or other desired plot type. To plot a specific boring, click to highlight the desired boring and then select “PlotSaved Reports.” A new window will open. Select “Cumulative Displacement, English” and press “Ok”. The graph will now display with various plot formatting options. This will plot your most recent reading against the baseline reading. You may choose to plot one or more of your subsequent readings against the baseline to view how the displacement is changing over time. In some instances, the readings may need to be error corrected. Error correction is not a simple subject, and applying corrections appropriately requires knowledge and experience. Please refer to the Error Correction section of the DigiPro2 User’s Manual for details (DGSI, 2014). Monitoring and Reporting Recommendations Inclinometer casings should be monitored on a frequency as determined by the City. At a minimum, we recommend completing readings every 3 months or whenever movement is suspected. If the observed lateral displacement along any portion of the casing is greater than 0.05 inch per month, the casings should be read on a weekly basis to check for acceleration of a potential movement. Weekly readings should continue until the change in maximum lateral deflection at any point is less than 0.02 inch for four consecutive weeks. 51-1-10111-001 51-1-10079-033-R1/wp/ady 12 3.0 OBSERVATION WELLS 3.1 Purpose An observation well is used to monitor groundwater levels using a water level indicator (i.e., well sounder) or a VWP (see Photograph 8). The wells provide information about piezometric head along the depth of the well screen and provide insight into the overall stability of the slope. Datalogger VWP Cable Well Cover Well Cap Photograph 8 – View of 2-inch-diameter well with datalogger. 3.2 Location and Details The site has three observation wells. We installed a 2-inch-diameter polyvinyl chloride (PVC) well casing in borings B-6 and B-8, and an 8-inch PVC well casing in boring B-3 at the locations shown in Figure 2. Construction details of the observation wells and elevations of well screens are provided in our Final Report. 3.3 Data Collection Data can be collected from either a VWP or a water level indicator. The advantage of using a VWP with a datalogger is that groundwater pressure can be monitored on a predetermined frequency and all arrays of collected information can be downloaded at a later time; whereas, a 51-1-10111-001 51-1-10079-033-R1/wp/ady 13 water level indicator measures groundwater level periodically (i.e., when someone is on site to take the measurement). Unlike the VWPs that are grouted into place adjacent to the inclinometer casings, these VWPs are placed inside the well casing near the bottom of the well. It is critical to keep the VWP at its current elevation, and not to pull it out of the well. This will result in a false groundwater reading. The following discussion outlines two different methods to measure groundwater levels in these wells: Method 1: VWP See discussion below on VWPs. Method 2: Water Level Indicator Before starting, be sure to have the following: ― ― ― Wrench with sockets: 9/16-inch and 15/16-inch-diameters. Pencil and paper to record reading. Water level indicator. Open the well cover and the well cap. Turn on indicator and test signal to confirm that it is functioning. Lower the probe from the indicator spool into the well slowly. When the probe contacts the surface of the water, the LED indicator on the spool illuminates and the beeper sounds. Record the depth-to-water measurement from graduations on the cable to the top of the casing. The depth of the water can be calculated by adding the depth-to-water measurement plus the distance between the ground surface and the casing as shown in Table 4. For example, if the depth of the water measured from the top of the casing at B-3 is 50 feet, the depth below ground surface would be approximately 50.6 feet. TABLE 4 OBSERVATION WELL Observation Well Identification Distance from Top of Casing to Ground Surface (feet) B-3 0.55 B-6 0.41 B-8 0.41 51-1-10111-001 51-1-10079-033-R1/wp/ady 14 4.0 VIBRATING WIRE PIEZOMETERS The VWPs with dataloggers provide continuous monitoring of pore water pressures and temperatures over time and may be coupled with inclinometer data to provide hydrostatic pressures and deformation measurements in the same borehole. VWPs provide measurements of hydrostatic pressures at a point, unlike screened observation wells which extend across several depths. The VWP is used to identify confined groundwater zones. Sixteen VWPs (Geokon Model 4500 series) are installed at Borings B-1, B-3, and B-5 through B-12 at the locations shown in Figure 2. An instruction manual can be downloaded online (Geokon, 2014). Thirteen VWPs are grouted in-place adjacent to the inclinometer casings and three VWPs are suspended inside well casings. Ten stand-alone dataloggers are installed on VWPs at the landslide area. Borings B-10, B-11, and B-12 have Geokon Model LC-2x4 four-channel dataloggers, and B-1, B-3, and B-5 through B-9 have Geokon Model LC-2 single channel dataloggers. The dataloggers are currently scheduled to take measurements of the VWPs at hourly intervals. 4.1 Data Collection Data may be collected using a hand-held readout box or datalogger. The following outlines procedures for collecting data from VWPs connected to dataloggers. Before starting, have the following: 4.2 ― Wrench with sockets: 9/16-, 3/4-, and 15/16-inch-diameters. ― Laptop with LogView and any relevant software drivers installed (see Section 5.1 on LogView Installation). ― USB communications cable between computer and datalogger. Follow instructions under Section 5.0, Dataloggers Piezometric Calculation The sensor reading column must be converted from digits to pressure (psi) through the parameters provided in Table 5 below and the following equation (Geokon, 2011): 51-1-10111-001 51-1-10079-033-R1/wp/ady 15 Where: P = Pressure (psi) R1 = Current Sensor Reading (from *.dat file) R0 = Zero Reading (see Table 5 below) G = Linear Calibration Factor (see Table 5 below) TABLE 5 VIBRATING WIRE PIEZOMETER (VWP) CALIBRATION PARAMETERS Boring Boring Elevation, (feet) VWP Elevation (feet) Datalogger Sensor Number Zero Reading, R0 Linear Calibration Factor, G Zero Temperature, T0 (°C) Thermal Factor, K (kPa/°C) B-1 123 1.8 1 8859.1 0.02644 21.3 0.00015 B-3 124.1 14.1 1 8724.2 0.01765 26.6 0.00057 B-5 123.9 6.4 1 8601.4 0.02616 8.1 0.00544 B-6 136.7 33.7 1 8755.4 0.01787 26.6 0.00652 B-7 122.6 6.9 1 8853.9 0.02539 15.1 0.00271 B-8 127.6 27.1 1 8838.6 0.01718 26.4 0.00081 B-9 128.1 14 1 8838.7 0.02562 11.7 0.00533 -7.99 2 8912.9 0.01582 25.6 0.00514 12.01 1 8668.5 0.01630 25.6 0.00425 32.01 3 8910.3 0.01613 26.0 0.00780 -8.85 1 8736.0 0.01756 17.6 0.00496 11.15 2 8788.0 0.01793 17.7 0.00527 41.15 3 8720.5 0.01779 17.4 0.00212 -9.34 1 8724.9 0.01776 16.1 0.009753 20.66 2 8845.3 0.01754 15.9 0.003633 45.66 3 8840.5 0.0163 16.2 0.005956 B-10 122.51 B-11 121.25 B-12 122.06 A temperature correction should be applied, to account for the thermal effects of the materials composing the vibrating wire (Geokon, 2011): Where: PT = Temperature Correction, kPa T1 = Current Sensor Temperature, °C (from *.dat file) 51-1-10111-001 51-1-10079-033-R1/wp/ady 16 T0 = Zero Temperature (see Table 5 above) K = Thermal Factor (see Table 5 above) From the pressure (P) and temperature correction (PT) values provided in the equations above, the corrected pressure should be calculated as: The piezometric head (feet) at the location of the VWP should be calculated from the equation above as: The piezometric head (feet) in relation to mean sea level (MSL) elevation should be calculated from the equation above and Table 5 as: 5.0 EXTENSOMETER The extensometers (also known as vibrating wire crackmeters) with dataloggers provide continuous monitoring of expansion or contraction of the ground and temperatures over time and may be coupled with inclinometer data to provide information about the stability of the slope. Three extensometers, EX-2, EX-3, and EX-4 are anchored across ground cracks at the locations shown in Figure 2. EX-2 and EX-3 are Geokon VW Crackmeter 4420-1-50mm and EX-4 is Geokon VW Crackmeter 4420-1-300mm. EX-1 was previously installed between Anchor A-1 and Anchor B-1, but was removed on January 23, 2014 due to interference with the construction of the Anchor A-1 bearing pad. The instrument was reinstalled at a new location and renamed EX-3. EX-3 is installed between Anchors B-1 and C-1. EX-2 is installed in front of Anchor D-1. EX-4 is installed between Anchors E-1 and F-1. Refer to the Anchor Construction Summary Report (currently being prepared) for more information about the ground anchor construction. An instruction manual for the operation of extensometers can be downloaded online (Geokon, 2013b). The anchors are grouted in-place on either side of the crack to measure opening or closing of the crack (see Photograph 9). All extensometers have Geokon Model LC-2 single channel dataloggers for recording measurements on the currently established interval of every hour. 51-1-10111-001 51-1-10079-033-R1/wp/ady 17 Photograph 9 – View of extensometer EX-2. 5.1 Data Collection Data may be collected using a hand-held readout box or datalogger. The following outlines procedures for collecting data from extensometers connected to dataloggers. Before starting, have the following: 5.2 ― Laptop with LogView and any relevant software drivers installed (see Section 5.1 on LogView Installation). ― USB communications cable between computer and datalogger. Follow instructions under Section 5.0, Dataloggers. Deformation Calculation The sensor reading column must be converted from digits to deformation (in) through the parameters provided in Table 6 below and the following equation (Geokon, 2011): Where: D = Deformation (in) R1 = Current Sensor Reading (from *.dat file) 51-1-10111-001 51-1-10079-033-R1/wp/ady 18 R0 = Zero Reading (see Table 6 below) G = Gage Factor (see Table 6 below) T1 = Current Temperature Reading (from *.dat file) T0 = Zero Temperature (see Table 6 below) K = Thermal Coefficient F = Unit Factor, 0.03937 Millimeters to Inches M = Multiplier (see Table 6 below) B = Constant (see Table 6 below) TABLE 6 EXTENSOMETER CALIBRATION PARAMETERS VW Crackmeter Zero Reading, R0 Linear Calibration Factor, G Zero Temperature, T0 (°C) Multiplier, M Constant, B EX-2 3922.955 0.0005332 17.1 0.00033 0.415 EX-3 EX-4 3876.438 3793.658 0.0005388 0.0026410 16.2 18.7 0.00033 0.000245 0.415 0.564 6.0 DATALOGGERS 6.1 LogView Installation LogView Software simplifies the task of configuration, communication, monitoring, data collection and data reduction using dataloggers. The data sheet, user’s guide, software, and drivers can be downloaded for free from the Geokon website (Geokon, 2013a). Download USB Drivers for Geokon Model 8002 Series Dataloggers onto a laptop. Download LogView. Open LogView. The first time the program opens, it will prompt you to create a workspace name (i.e., user name). Click “Ok” and the workspace folder will automatically be saved to a location depending on the operating system: 51-1-10111-001 51-1-10079-033-R1/wp/ady 19 Windows XP: C:\Documents and Settings\All Users\Shared Documents\Geokon\ LogView\Workspaces Vista and Windows 7: C:\Users\Public\Public Documents\Geokon\LogView\Workspaces 6.2 LogView should now have a user-named folder under the project explorer frame. Right click on this folder and select “Import-Project from .LPVE file.” Navigate to the WhitePoint.LPVE file provided with this letter. Click “Ok” to import. In the project explorer, the file should now show a yellow folder, a brown box named WhitePoint, and ten dataloggers. If they are not shown, try pushing the (+) sign next to WhitePoint. Data Collection Instruction manuals for these datalogger models can be downloaded online (Geokon, 2013a). We have programmed the dataloggers to read on an hourly basis and append new data to the existing data files established for each datalogger. The LC-2 and LC-2x4 dataloggers have a memory capacity of 8,000 and 10,666 total readings, or about 10 and 4.5 months of readings, respectively. When the capacity is reached, the dataloggers are programmed to wrap the readings, meaning the oldest arrays of data will be replaced with new data. Collection frequency and memory formatting can be changed by following the datalogger instruction manual (Geokon, 2013a). Open “LogView.” Use the cable to connect the computer to the datalogger (Photograph 10). The dataloggers are named according to model type, boring number, and serial number. 51-1-10111-001 51-1-10079-033-R1/wp/ady 20 Photograph 10 – View of the USB communications cable connected to a 4-channel datalogger. 6.3 Select the appropriate installation, identified by logger type, boring number, and the serial number (i.e., LC-2: B-1 SN1219449), and click “Open Connect.” Three circles at the bottom left of the screen should turn from red (disconnected) to green (connected). Note if the wrong installation is selected, the connection will not work. If the datalogger will not connect, try replacing the batteries, checking communications port on laptop, and make sure USB driver is installed. Otherwise, check the manual for troubleshooting techniques. To collect the data for processing, click “Collect Data” to download data arrays or to view an instant readout click “Read Now” and record reading on paper. Note that the instant reading is in sensor units (digits), and measured groundwater level must be calculated. Once complete, select “Close Connect” and disassemble the cable. Place datalogger back into hole, such that the connection ports do not face upward, allowing moisture to drip in from the cover. Battery and Desiccant Pack Maintenance The datalogger boxes are powered by two D-cell batteries. Battery voltage levels can be periodically checked during the data collection process and observed on the data arrays that are downloaded. Batteries should be replaced at least every four months, or if observed voltage levels drop to 2.6 volts. 51-1-10111-001 51-1-10079-033-R1/wp/ady 21 Before you begin, you will need: ― ― ― D-cell batteries (two per datalogger) Phillips-head screw driver Desiccant packs To replace the battery, use a Phillips-head screwdriver to open the four captive screws on the datalogger lid. Replace the old batteries with the new ones, paying special attention that the metal plates inside the datalogger are in direct contact with both sides of the new battery (Photograph 11). D-cell Battery Metal Plates Expired Desiccant Pack Photograph 11 – Metal plates in contact with D-cell batteries inside a 2-channel datalogger. 51-1-10111-001 51-1-10079-033-R1/wp/ady 22 6.4 Open LogView after the new batteries are installed and confirm the logger will connect. If it does not respond, the battery is likely not in contact with the metal sheets. If the desiccant pack appears to have retained moisture, replace it with a new dry desiccant pack. Many times dessicant packs will change colors from blue to pink when replacement is due. Observe the datalogger lid and confirm the orange-colored rubber seal is in place. Replace the datalogger lid, screwing tightly to seal out potential moisture. Data Reduction Data arrays can be transferred from LogView to data files that can be imported into Microsoft Excel for graphing. The raw data could be appended to our groundwater spreadsheet for VWPs or displacement spreadsheet for Extensometers, as provided in our VWPs.xls and Extensometers.xls, respectively. Open “LogView.” Under the project explorer, right click on an installation. Select “Export- Data files.” A Data Export window will open. Choose an export folder, select “Export as DAT File,” check “Export dates in Serial Date (Y1900) format,” click on available files (only one should be present), click on the “>>”, and click “Export.” The folder will now contain a *.dat file. Open Microsoft Excel. Go to File- Open –under the file type pull down menu select “All Files (*.*)”navigate to the export folder, and open the *.dat file. The text import wizard window will open. Select “Delimited” and click next. Check only “Comma Delimiter” and click “Finish.” Columns will show the logger name, year, date and time, battery voltage, internal temperature, sensor 1 reading, sensor 1 temperature, [sensor 2 reading, sensor 2 temperature, sensor 3 reading, sensor 3 temperature, if from multi-channel datalogger] and array number. Check the battery voltage. If it is below 2.6 Volts, replace the batteries within a month. TIP: To get to the end of a column of data quickly, select a cell and press “Ctrl”, “Shift”, and “Down Arrow” all at the same time. Continue with Calculation procedures for selected instrument. 51-1-10111-001 51-1-10079-033-R1/wp/ady 23 7.0 DYNA FORCE SYSTEM 7.1 General The DYNA Force® electro-magnetic sensors, manufactured by Dywidag Systems International, are installed along two ground anchors, Anchor C-1 and Anchor G-1 at the locations shown in Figure 2. The sensors are used to monitor the tension force exerted on the ground anchor. The wire leads from the sensors are attached to a portable Power Stress unit to create a magnetic field, measure the residual value, and then convert it to a direct force reading. Unlike the dataloggers, this system collects data only at the time of collection and does not record data at a predetermined frequency. The user’s manual and brochure can be found in Appendix A. 7.2 Data Collection The following outlines procedures for connecting to and collecting data from the DYNA Force® electro-magnetic sensors attached to the anchors. Before starting, have the following (see Photograph 12): ― Portable power source consisting of at least 300 Watts and 17 Amps. Extension cable could be required. ― Multiplexer (Use multiplier with Ports 1-7 for Anchor C-1 and Ports 9-15 for Anchor G-1) ― Power Stress Unit ― Power stress extension cable with blue masking tape 51-1-10111-001 51-1-10079-033-R1/wp/ady 24 Power Stress Unit Sensor Leads Power Switch Multiplexer Power Source Power Stress Extension Cable Photograph 12 – View of the Dyna Force Power Stress Unit Set-Up. Remove protective cap from sensor lead and insert sensor lead to corresponding multiplexer port by pushing and then twisting the end to secure it. Note that sensor leads are labeled by channel number and sensor number as shown in Photograph 13. Sensor number must be plugged into correct multiplexer port (i.e. CH#1 – SN#3 shall be plugged into port 3 on the multiplexer). Plug all seven sensor leads into the multiplexer before continuing. 51-1-10111-001 51-1-10079-033-R1/wp/ady 25 Photograph 13 – View of a sensor leads, labeled with channel number and sensor number, and corresponding multiplexer Connect the power stress extension cable with the blue masking tape between the power stress unit (2 ports) and the multiplexer (1 port) as shown in Photograph 12. The power stress ports will receive the two black plastic ends and the multiplexer port will receive the metallic end. Note that the multiplexer for sensors 1-7, has one female end and one male end. Connect the power stress extension cable to the male end of this multiplexer. Connect power source to Power Stress Unit as shown in Photograph 13. Turn on power source. Turn on power stress unit by flipping the switch on the back of the unit to on but pushing the line symbol down. Wait at least 2 minutes while power stress unit boots up. Press “Run” button shown in Photograph 14 below. 51-1-10111-001 51-1-10079-033-R1/wp/ady 26 Photograph 14 – View of power stress readout box Press the down arrow to highlight “2. Set Auto”. Press “Run”. Seven sensor numbers should now be showing on the screen. The sensor numbers shown on the screen should correspond with the numbers on the sensor leads. If sensor numbers do not correspond with sensor leads, use the arrows to highlight the sensors on the screen and push the left arrow to unselect and switch off readings for these sensors. Push “F3” to change pages. Use the up or down arrows to highlight the seven other sensors on the screen and push the right arrow to switch on readings for these sensors. Push “F4” to save settings. Use the down arrow to scroll down to “3. m_measurement”. Press “Run”. Seven sensor numbers should now be showing on the screen. The sensor numbers shown on the screen should correspond with the numbers on the sensor leads. 51-1-10111-001 51-1-10079-033-R1/wp/ady 27 If sensor numbers do not correspond with sensor leads, press “F3” to change pages and see appropriate sensors. Press “Run” to collect data and wait a minute or two. Now force readings will be collected for all sensors. If needed, press “F3” to change pages to view appropriate sensor numbers. Sensor numbers are displayed along with corresponding temperature and force reading (kips) for each sensor. Record force readings by hand for each sensor. Compare these readings with previously collected readings to see if changes in anchor tension have occurred. If significant tension is lost, anchors may require retensioning. Turn off power stress unit by flipping the switch on the back of the unit to off by pressing the circle symbol down. Disconnect power source. Disconnect power stress extension cable. Unplug sensor leads and screw on protective sensor caps. 8.0 LIMITATIONS The professional opinions presented in this report were developed using the degree of care and skill, ordinarily exercised under similar circumstances and at similar locations, by reputable geotechnical consultants. No other warranty, expressed or implied, is intended as to the professional advice included in this report. The report has not been prepared for use by other parties, and may not contain sufficient information for purposes of other parties or other uses. The scope of our services did not include the responsibility for either job safety or surveying. Shannon & Wilson, Inc. has prepared the document, “Important Information About Your Geotechnical/Environmental Report,” in Appendix B to assist you and others in understanding the use and limitations of this report. 51-1-10111-001 51-1-10079-033-R1/wp/ady 28 9.0 REFERENCES Durham Geo Slope Indicator (DGSI), 2007a, Digitilt DataMate II: Available: http://www.slopeindicator.com/pdf/manuals/digitilt-datamate.pdf. Durham Geo Slope Indicator (DGSI), 2011, Digitilt Inclinometer Probe: Available: http://www.slopeindicator.com/pdf/manuals/digitilt-probe.pdf. Durham Geo Slope Indicator (DGSI), 2012, Digitilt Inclinometer Probe: Available: http://www.slopeindicator.com/instruments/inclin-digipro2.html. Durham Geo Slope Indicator (DGSI), 2014, DigiPro2 for Windows: Available: http://www.slopeindicator.com/pdf/manuals/digipro-2-manual.pdf. Geokon, 2011, Instruction Manual Model 4500 series Vibrating Wire Piezometers. Geokon, 2013a, Geokon- Products: Available: http://www.geokon.com/dataloggers-software/. Geokon, 2013b, Geokon- Products: Available: http://www.geokon.com/content/manuals/4420_Crackmeter.pdf. 51-1-10111-001 51-1-10079-033-R1/wp/ady 30 Project Location Los Angeles CALIFORNIA Filename: I:\PROJECTS\10079 White Point Observation - Hayward Baker\033 Anchors - Construction Services\Graphics\FIG 1 - VICINITY MAP.dwg Date: 08-19-2014 Login: Louis Larios Sacramento PROJECT LOCATION 0 1000 2000 4000 SCALE: 1"=2000' NOTE Map adapted from 1:24,000 USGS topographic map of San Pedro, CA quadrangle, dated 1964. White Point Landslide San Pedro District Los Angeles, California VICINITY MAP August 2014 51-1-10079-033 FIG. 1 Author: lol Nike Missile Silo Area B-9 AVENUE B-8 WPNP TRAIL B-5 B-3 PASEO DEL MAR B-1 B-10 B-7 B-11 Anchor C-1 2011 LANDSLIDE EX-3 WEYMOUT H Date: 8/19/2014 Path: \\Lax-fs1\vol1\PROJECTS\10079 White Point Observation - Hayward Baker\033 Anchors - Construction Services\Graphics\FIG 1 - SITE AND INSTRUMENTATION.mxd B-6 B-12 Anchor G-1 EX-4 EX-2 Ground Cracks EXPLANATION Groundwater Well and Vibrating Wire Piezometer Inclinometer and Vibrating Wire Piezometer Vibrating Wire Crackmeter (Extensometer) DYNA Force® Elasto-Magnetic Sensor White Point Landslide San Pedro District Los Angeles, CA 1 inch = 80 feet 0 40 80 160 Feet REFERENCE: Topography by Advanced Digital Maps, Inc, Photo Dated 12-14-2011 DATUM: NAD 1983 State Plane California V FIPS 0405 SITE AND INSTRUMENTATION August 2014 51-1-10079-033 FIG. 2 CD OF ELECTRONIC DATA FILES 51-1-10079-033 APPENDIX A DYNA FORCE USER’S MANUAL AND BROCHURE 51-1-10079-033 zE&KZWW>/d/KEDEh> DEh>^z^dD ^dW͗/E/d/>/d/KEͲZKZ/E' ^dW͗&KZD^hZDEddWZ^Ed ^dW͗&KZD^hZDEd/Ed,&hdhZ hd/KE͊ ^dW͟͞/^KEKE>zKE&KZEz>K/^WW>/KEd,^dZEͬZ ^dW͗/E/d/>/d/KEͲZKZ/E' ϭ͘ ŽŶŶĞĐƚůĞĂĚǁŝƌĞĨƌŽŵLJŶĂ&ŽƌĐĞƚŽƉŽǁĞƌƐƚƌĞƐƐƵŶŝƚ͘ŽŶŶĞĐƚƚŽ ĞŝƚŚĞƌŽƌƉŽǁĞƌ;WŝĐ͘ϭͿ Ϯ͘ ^ǁŝƚĐŚŽŶƚŚĞƉŽǁĞƌƐƚƌĞƐƐƵŶŝƚĂŶĚǁĂŝƚĨŽƌŵŝŶϮŵŝŶƵƚĞƐ ϯ͘ WƌĞƐƐ͞ZhE͟ďƵƚƚŽŶ ϰ͘ ^ĐƌĞĞŶ͞ϭ͘DĞĂƐƵƌĞŵĞŶƚ͟ǁŝůůĂƉƉĞĂƌĂŶĚŝƐŚŝŐŚůŝŐŚƚĞĚ ϱ͘ WƌĞƐƐZhEďƵƚƚŽŶ;WŝĐ͘ϮĂŽƌWŝĐ͘ϮďͿ ϲ͘ DĞĂƐƵƌĞŵĞŶƚƐĐƌĞĞŶǁŝůůĂƉƉĞĂƌ;WŝĐ͘ϯͿ ϳ͘ ĞĨĂƵůƚ,ηŝƐϭ͘ŚĂŶŐĞ,ηďLJƐĞůĞĐƚŝŶŐ͞&Ϯ͟;ŝĨƌĞƋƵŝƌĞĚͿ͘ ϴ͘ ^ĞůĞĐƚ^EηďLJƉƌĞƐƐŝŶŐhWͬKtEŬĞLJ WŝĐ͘ϭ WŝĐ͘ϮĂ;^ƚĂŶĚĂƌĚƵŶŝƚͿWŝĐ͘Ϯď;ƵƚŽŵĂƚĞĚƵŶŝƚͿ ϵ͘ ƚƚŚŝƐƉŽŝŶƚƚŚĞ,ηĂŶĚ^EηŝƐƐĞůĞĐƚĞĚ ϭϬ͘ WƌĞƐƐ͞&ϰ͟ďƵƚƚŽŶ͘ĞƌŽŝƐŚŝŐŚůŝŐŚƚĞĚ;WŝĐ͘ϰͿ ϭϭ͘ ƐŬŝŶŐŝĨƚŽŵĂŬĞZK͍ ϭϮ͘ /ĨzĞƐ͕WƌĞƐƐ͞ZhE͟ďƵƚƚŽŶ ϭϯ͘ ƐŬŝŶŐŝĨĂƵƚŽŵĂƚŝĐdDWZdhZƚŽďĞŵĞĂƐƵƌĞĚ͍;WŝĐ͘ϱͿ ϭϰ͘ WƌĞƐƐ͞ZhE͟ďƵƚƚŽŶ͘/ƚǁŝůůŵĞĂƐƵƌĞƚŚĞƚĞŵƉ WŝĐ͘ϯ WŝĐ͘ϰ /ƚǁŝůůƉĞƌĨŽƌŵϱŝƚĞƌĂƚŝŽŶƐƚŽŵĂŬĞĂnjĞƌŽƌĞĂĚŝŶŐ /ĨƚŚĞƚĞŵƉƐĞŶƐŽƌŝƐŶŽƚǁŽƌŬŝŶŐŝƚǁŝůůĂƐŬƚŽŝŶƉƵƚƚŚĞƚĞŵƉ͘ ϭϰ͘ϭ͘ WƌĞƐƐ͞&ϯ͟ƚŽŚŝŐŚůŝŐŚƚƚĞŵƉ ϭϰ͘Ϯ͘ /ŶƉƵƚƚŚĞdDWZdhZƵƐŝŶŐĂƌƌŽǁƐ ϭϰ͘ϯ͘ WƌĞƐƐ͞ZhE͟ďƵƚƚŽŶ WŝĐ͘ϱ WŝĐ͘ϲ WŝĐ͘ϳ ϭϱ͘ ͞ZKKE͟ǁŝůůĂƉƉĞĂƌŽŶƚŚĞƐĐƌĞĞŶĂŶĚƚŚĞĨŽƌĐĞǁŝůůďĞƐŚŽǁŶ͘/ĨƚŚĞŶƵŵďĞƌŝƐǁŝƚŚŝŶнͬͲϬ͘ϯŬŝƉƐ͕ŝƚŝƐ ŽŬĂLJ͘/ĨĞdžĐĞĞĚƐƚŚĞůŝŵŝƚ͕ƉƌĞƐƐ͞ZhE͟ĂŐĂŝŶƚŽŵĂŬĞZKƌĞĂĚŝŶŐ͘ƚƚŚŝƐƉŽŝŶƚZKŝƐŚŝŐŚůŝŐŚƚĞĚ͘;WŝĐ͘ϲͿ ϭϲ͘WƌĞƐƐ͞&ϰ͟ďƵƚƚŽŶƚŽƵŶͲŚŝŐŚůŝŐŚƚƚŚĞnjĞƌŽ;WŝĐ͘ϳͿ͘/ƚŝƐǀĞƌLJŝŵƉŽƌƚĂŶƚƚŽĚŽƐŽ͊ ϭϳ͘&ŽƌĐĞĂƉƉůŝĐĂƚŝŽŶŽŶƚŚĞƐƚƌĂŶĚŵĂLJĐŽŵŵĞŶĐĞŶŽǁ͘ ^dW͗&KZD^hZDEddWZ^Ed ϭ͘ dŚĞƐLJƐƚĞŵŝƐƌĞĂĚLJƚŽŵĞĂƐƵƌĞƚŚĞĨŽƌĐĞŽĨƚŚĞ^ĞůĞĐƚĞĚ^ĞŶƐŽƌ Ϯ͘ ƉƉůLJůŽĂĚƚŽƚŚĞ^ƚƌĂŶĚͬĂƌ ϯ͘ WƌĞƐƐ͞ZhE͟ďƵƚƚŽŶƚŽƚĂŬĞƚŚĞƌĞĂĚŝŶŐ͘&ŽƌĐĞǁŝůůďĞƐŚŽǁŶŝŶŬŝƉƐŽƌĂŶLJŽƚŚĞƌƵŶŝƚĐŚŽƐĞŶ͘ ^dW͗&KZD^hZDEd/Ed,&hdhZ ϭ͘ ŽŶŶĞĐƚůĞĂĚǁŝƌĞĨƌŽŵLJŶĂ&ŽƌĐĞƚŽƉŽǁĞƌƐƚƌĞƐƐƵŶŝƚ͘ŽŶŶĞĐƚƚŽ ĞŝƚŚĞƌŽƌƉŽǁĞƌ Ϯ͘ ^ǁŝƚĐŚŽŶƚŚĞƉŽǁĞƌƐƚƌĞƐƐƵŶŝƚĂŶĚǁĂŝƚĨŽƌŵŝŶϮŵŝŶƵƚĞƐ ϯ͘ WƌĞƐƐ͞ZhE͟ďƵƚƚŽŶ ϰ͘ ^ĐƌĞĞŶǁŝůůƐŚŽǁ͞ϭ͘ZhE^E^KZd^d͟ŚŝŐŚůŝŐŚƚĞĚ ϱ͘ WƌĞƐƐ͞ZhE͟ďƵƚƚŽŶ ϲ͘ ^ĞůĞĐƚ,ηΘ^EηďLJƵƐŝŶŐ&ϮĂŶĚhWͬKtEŬĞLJƐ ϳ͘ WƌĞƐƐ͞ZhE͟ďƵƚƚŽŶ ϴ͘ dŚĞĨŽƌĐĞŝŶƚŚĞ^ƚƌĂŶĚͬĂƌǁŝůůďĞƐŚŽǁŶŝŶĨĞǁƐĞĐŽŶĚƐ hd/KE͊ EsZWZ^^͞&ϰ͟hddKEdK,/',>/',dZKKEd,^dZE,^&KZ tZE/E' ϭ͘ ƚƚŚĞƚŝŵĞŽĨ^ƚƌĂŶĚͬĂƌŝŶƐƚĂůůůĂƚŝŽŶ͕ƚĂŬĞĞdžƚƌĂĐĂƌĞŶŽƚƚŽŚŝƚĂŶĚĚĂŵĂŐĞƚŚĞLJLJŶĂ&ŽƌĐĞ͘ Ϯ͘ ^ĞĐƵƌĞLJŶĂ&ŽƌĐĞůĞĂĚǁŝƌĞĨƌŽ ŽŵĂŶLJĚĂŵĂŐĞŚĂƉƉĞŶŝŶŐ͘ĂŵĂŐĞŝŶůĞĂĚǁŝƌĞŵĂĂLJĐƌĞĂƚĞƐŚŽƌƚĐŝƌĐƵŝƚ ĂŶĚƚŚĞƉŽǁĞƌƐƚƌĞƐƐƵŶŝƚŵĂLJĨĨĂŝů͘ ϯ͘ dĂŬĞĞdžƚƌĂĐĂƌĞǁŚŝůĞƚŚƌĞĂĚŝŶŐŐĞŶĚĐŽŶŶĞĐƚŽƌƚŽƚŚĞƉŽǁĞƌƐƚƌĞƐƐƵŶŝƚƐŽƚŚĂƚWŝŶƐĂƌĞŶŽƚĚĂŵĂŐĞĚ͘ ϰ͘ tŚĞŶLJŶĂ&ŽƌĐĞŝƐŝŶƐƚĂůůĞĚĨŽ ŽƌƐƚƌĂŶĚͬďĂƌĂůƌĞĂĚLJŝŶƉůĂĐĞ͕ǁĂŝƚĨŽƌƚǁŽŚŽƵƌƐďĞ ĞĨŽƌĞƚĂŬŝŶŐĂŶLJ ƌĞĂĚŝŶŐƐŽƚŚĂƚƚĞŵƉĞƌĂƚƵƌĞŝŶďŽƚŚLJŶĂ&ŽƌĐĞΘƐƚƌĂŶĚͬĂƌĞƋƵĂůŝnjĞƐ͘ ϱ͘ DĂŬĞƐƵƌĞƌŝŐŚƚLJŶĂ&ŽƌĐĞůĞĂĚǁŝƌĞŝƐĐŽŶŶĞĐƚĞĚƚŽƚŚĞƉŽǁĞƌƐƚƌĞƐƐƵŶŝƚĂŶĚĐŽƌƌĞƐƉŽŶĚŝŶŐ,ηĂŶĚ ^EηŝƐƐĞůĞĐƚĞĚ͘ <ĞĞƉƚŚĞƵŶŝƚǁĂƌŵ ϲ͘ dŚĞŽƉĞƌĂƚŝŽŶƚĞŵƉĞƌĂƚƵƌĞĨŽƌLJŶĂ&ŽƌĐĞƉŽǁĞƌƐƚƌĞƐƐƵŶŝƚŝƐĨƌŽŵϯϮƚŽϭϱϬϬ&͘< Ϭ ǁŚĞŶŽƉĞƌĂƚĞĚŝŶǁŝŶƚĞƌ͘ ;ƉƌĞĨĞƌĂďůLJŐƌĞĂƚĞƌƚŚĂŶϰϮ &Ϳǁ ϳ͘ ŽŶŽƚůĞƚǁĂƚĞƌĐŽŵĞŝŶĐŽŶƚĂĐƚǁŝƚŚƚŚĞĐŽŶŶĞĐƚŽƌ͘tƌĂƉĂƌŽƵŶĚƚŚĞĞŶĚĐŽŶŶĞĐĐƚŽƌƚŽƉƌŽƚĞĐƚĨƌŽŵ ǁĂƚĞƌͬŵƵĚ͘/ĨƚŚĞƌĞŝƐƉŽƐƐŝďŝůŝƚƚLJƚŚĞĞŶĚĐŽŶŶĞĐƚŽƌǁŝůůďĞƵŶĚĞƌǁĂƚĞƌ͕ƐĞĂůƚŚĞĞŶĚƵƐŝŶŐŚĞĂƚƐŚƌŝŶŬ ĂŶĚƐĞĂůŵĂƐƚŝĐƚĂƉĞƐŽƚŚĂƚŶŽǁĂƚĞƌĐĂŶƉĞŶĞƚƌĂƚĞŝŶƚŽĐŽŶŶĞĐƚŽƌƐ͘/ĨƚŚĞƌĞŝƐǁĂƚĞƌŽŶĂĐŽŶŶĞĐƚŽƌ͕ ƌĞŵŽǀĞƚŚĞǁĂƚĞƌĂŶĚĚƌLJƚŚĞĐĐŽŶŶĞĐƚŽƌĨŝƌƐƚ͘KŶůLJŵĂŬĞŵĞĂƐƵƌĞŵĞŶƚĂĨƚĞƌĐŽŶŶ ŶĞĐƚŽƌŝƐĚƌLJ͘ DYNA Force™ Elasto-Magnetic Sensor Penobscott Narrows Bridge and Observatory, Maine, USA 2 Contents General ..................................................................................................................... 4 Quality Assurance .................................................................................................... 5 Practical Applications ............................................................................................... 6 General On many occasions during construction and service life of the structure, it is crucial to know the force in the posttensioning system. Although there are many methods to measure the tendon force, most of them are cumbersome, expensive, and the accuracy differs depending on the method used. DYWIDAG has been involved in the development, testing and execution of DYNA Force™ to measure the force in the tendon. DYNA Force™ is being used in cable stay bridges, cable system testing and building structure to measure the force during stressing and to monitor forces during the service life of the structure. DYNA Force™ can be used for bare, epoxy-coated and greased-sheathed steel. DYNA Force™ is manufactured based on the theory that the permeability of steel to a magnetic field changes with the stress level in the steel. By measuring the change in a magnetic field the magnitude of the stress in the steel element can be obtained. The DYNA Force™ does not alter the characteristics of the tendon other than its magnetization. The permeability is a function of temperature and magnetization, and a calibration process eliminates the impact of these variables. The program takes into consideration the temperature change effect automatically. A portable Power Stress unit is attached to wire leads from the DYNA Force™. This unit will create the magnetic field and then measure the residual value and then convert it to a direct force reading. The accuracy of the force measurement is within 1%.DYNA Force™ system is robust, requires no maintenance and has no moving parts. It is composed of sensors and Power Stress unit (read-out box). DYNA Force™ is installed over the strand or bar during construction and a zero reading is taken before applying any post-tensioning force. It is expected to have a similar service life as the bridge/ building structure. This will allow the owner to regularly monitor the forces in the post-tensioning system in minutes as a part of their inspection procedures without the need for lift-off equipment or other special expensive techniques. This will also avoid the inaccuracies and risks often associated with lift-off readings. One person can do this job. DYNA Force™ Dimensions DYNA Force™ Type Strand/Bar [in] [in] [in] Strand DYNA Force™ 0.5“ 0.6“ 0.71 0.78 1.50 1.50 5.1 5.1 1-1/4“ & 1-3/8“ 1-3/4“ 1.70 2.10 2.80 3.90 6.7 8.3 2-1/2“ 2.85 6.20 12 Bar DYNA Force™ DYNA Force™ Dimensions OD Length Note: Dimensions for 2-1/2“ bar are preliminary Bar DYNA Force™ Power-Stress Unit 4 ID Strand DYNA Force™ Quality Assurance All DYNA Force™ sensors are professionally made in a quality controlled facility. Furthermore, each DYNA Force™ is tested and individually packed and numbered at the DSI facility before sending to the job site. Although many tests have been conducted in the development of the DYNA Force™, DSI conducted additional tests to simulate the performance of the system when places within the anchorage zone of stay cables. In these tests DYNA Force™ sensors were placed near the center and on the outside of the strand bundle. The loads were applied using a stressing jack and the force was monitored using a very accurate load cell. The load cell readings were compared to the results from the Power Stress unit and very good correlation was obtained. Testing and Calibration of DYNA Force™ 5 Practical Applications When a DYNA Force™ is installed on a strand/bar, the force in it may be obtained directly by merely attaching the leads from DYNA Force™ to a portable Power Stress unit. No other equipment is needed. DYNA Force™ sensors have been used in many bridge and building structures for the past several years. DSI supplied two hundred forty sensors for Waldo cable stay bridge, Maine, USA. Each cable had six sensors and the cable forces at each stage of construction were monitored using these sensors. Periodic lift-off operations were made on the strands with sensors. A good correlation was observed. The bridge is now open to traffic and the forces in any cable can be monitored anytime using these DYNA Force™ sensors without any disruption to traffic. DYNA Force™ in Cable Stay Anchor, Waldo, Maine, USA 6 Practical Applications DSI used DYNA Force™ sensors in a fatigue testing of 41-strand cable stay system. Force in each 0.6” dia epoxy coated strand was monitored at various loading stages during two-million fatigue cycles. DYNA Force™ in Fatigue Test of Cable Stay System DYNA Force™ sensors were used in moment resisting frames in a City Office building, California. The tendons were 0.5“ diameter greased and sheathed un-bonded strands. DYNA Force™ was used to measure the force during stressing and will be used to monitor the forces in each loop tendon especially after earthquake takes place. DYNA Force™ for Seismic Evaluation of Building Structure, California, USA 7 DYWIDAG-Systems International CANADA Ltd. 320 Marmon Drive Bolingbrook, IL 60440 USA Phone: (630)-739-1100 Fax: (630)-739-5517 E-Mail: [email protected] Eastern Division 37 Cardico Drive Gormley, ON L0H1G0 Phone: (905) 888-8988 Fax: (905) 888-8987 E-Mail: [email protected] 525 Wanaque Avenue, Suite LL1 Pompton Lakes, NJ 07442 Phone: (724) 869-0155 Fax: (973) 831-6503 E-Mail: [email protected] 1250 Connecticut Avenue, NW Suite 200 Washington, DC 20036 Phone: (202) 263-4601 Fax: (866) 308-3832 E-Mail: [email protected] 3300 SW 50th Avenue Davie, FL 33314 Phone: (954)-318-1105 Fax: (954)-318-1107 E-Mail: [email protected] 4732 Stone Drive, Suite A Tucker, GA 30084 Phone: (770) 491-3790 Fax: (770) 938-1219 E-Mail: [email protected] 2400 Hwy 287 N, Suite 106 Mansfield, TX 76063 Phone: (817) 473-6161 Fax: (817) 473-1453 E-Mail: [email protected] 3280 E. 59th Street Long Beach, CA 90805 Phone: (562) 529-2109 Fax: (562) 529-2225 E-Mail: [email protected] Quebec Office C.P. 412 St. Bruno, Quebec J3V 5GB Phone: (450) 653-0935 Fax: (450) 653-0977 E-Mail: [email protected] Western Division 19433 96 th Av. Suite 103 Surrey, BC V4N4C4 Phone: (604) 888-8818 Fax: (604) 888-5008 E-Mail: [email protected] Calgary Office 2816-21 Street N.E., Suite 204 Calgary, Alberta T2E 6 Z2 Phone: (403) 291-4414 Fax: (403) 250-5221 E-Mail: [email protected] AUSTRIA ARGENTINA AUSTRALIA BELGIUM BOSNIA AND HERZEGOVINA BRAZIL CANADA CHILE COLOMBIA COSTA RICA CROATIA CZECH REPUBLIC DENMARK EGYPT ESTONIA FINLAND FRANCE GERMANY GREECE Details, dimensions and system designs are subject to change without notice. DYWIDAG-Systems International USA Inc. GUATEMALA HONDURAS HONG KONG INDONESIA IRAN ITALY JAPAN KOREA LEBANON LUXEMBOURG MALAYSIA MEXICO NETHERLANDS NORWAY OMAN PANAMA PARAGUAY PERU POLAND PORTUGAL QATAR SAUDI ARABIA SINGAPORE SOUTH AFRICA SPAIN SWEDEN SWITZERLAND TAIWAN THAILAND TURKEY UNITED ARAB EMIRATES UNITED KINGDOM URUGUAY USA VENEZUELA www.dsiamerica.com w w w. d s i c a n a d a . c a 04191-1/01.10-web cb Please note: This brochure serves basic information purposes only. Technical data and information provided herein shall be considered non-binding and may be subject to change without notice. We do not assume any liability For losses or damages attributed to the use of this technical data and any improper use of our products. Should you require further information on particular products, please do not hesitate to contact us. Materials Specifications and Dimensions EM Sensor Measurement Range Temperature sensor Temperature accuracy Operating Temperature Range Primary Coil Resistance Secondary Coil Resistance Standard lead Length Maximum lend Length Extension Cord Dimensions: ID x OD x L (mm) Weight Absolute stress 1770 MPa 3000 ohm @25˚C 0.5˚C , in the range of -20˚C to +80˚C -20˚C to +80˚C 16 ohm to 25 ohm 5 ohm to 25 ohm 2m 250m AWG 16 to 14, 6 contacts, twisted 19 x 36 x 130 mm Approx. 0.5 kg Extension Cable Conductors Shield Tape Jacket Voltage Rating Temperature Rating Dimensions: Dia. (mm) 3 pairs (1 pair of AWG16 and 2 pairs of AWG 20) Individually & Overall Alum/Mylar & TC drain wire Overall Clear Mylar Wrap .050” Sunlight Resistant Black PVC Jacket 300 V 105 C 11 mm Multiplexer Board Number of Channels Dimensions: W x L x H (mm) 8 CH 160 x 100 x 30 mm Number of Channels Dimensions: W x L x H (mm) 4 CH 187 x 66 x 30 mm Control Panel (Modem) Dimensions: W x L x H (mm) 187 x 66 x 30 mm Read-out Unit Number of Channel (s) Measurement Range Accuracy Operating Temperature Range Maximum Discharge Voltage Charging time Sample Rate Interface LCD Display Protection Power Supply Cover Dimensions: W x L x H (mm) 1 1 to 95% Yielding Stress 0.5% F.S. (Dependent upon the size of an EM sensor) -20˚C to +80˚C 450 V 7 second (Max) higher than 0.1Hz RS485/RS232C Graphic LCD 128 X 64 Pixels Lightning protector, Power Surge protector AC 90-246, 60/50 Hz, 150W NEMA4X/IP68 Enclosure (Option) 183.5x111x300 mm Enclosure Box Materials Protection Cover Color Inner Panel Dimensions: W x L x H (inch) 16-ga. steel with concealed steel hinges NEMA4/IP66 Enclosure Polyurethane-foam gasket and a 1/4-turn coin-slot latch Gray Steel 24”x20”x8” APPENDIX B IMPORTANT INFORMATION ABOUT YOUR GEOTECHNICAL/ENVIRONMENTAL REPORT 51-1-10079-033 SHANNON & WILSON, INC. Attachment to and part of Report 51-1-10079-033 Geotechnical and Environmental Consultants Date: Dated: August 21, 2014 To: City of Los Angeles Bureau of Engineering Attn: Mr. Craig Kunesh Important Information About Your Geotechnical/Environmental Report CONSULTING SERVICES ARE PERFORMED FOR SPECIFIC PURPOSES AND FOR SPECIFIC CLIENTS. Consultants prepare reports to meet the specific needs of specific individuals. A report prepared for a civil engineer may not be adequate for a construction contractor or even another civil engineer. Unless indicated otherwise, your consultant prepared your report expressly for you and expressly for the purposes you indicated. No one other than you should apply this report for its intended purpose without first conferring with the consultant. No party should apply this report for any purpose other than that originally contemplated without first conferring with the consultant. THE CONSULTANT'S REPORT IS BASED ON PROJECT-SPECIFIC FACTORS. A geotechnical/environmental report is based on a subsurface exploration plan designed to consider a unique set of project-specific factors. Depending on the project, these may include the general nature of the structure and property involved; its size and configuration; its historical use and practice; the location of the structure on the site and its orientation; other improvements such as access roads, parking lots, and underground utilities; and the additional risk created by scope-of-service limitations imposed by the client. To help avoid costly problems, ask the consultant to evaluate how any factors that change subsequent to the date of the report may affect the recommendations. Unless your consultant indicates otherwise, your report should not be used: (1) when the nature of the proposed project is changed (for example, if an office building will be erected instead of a parking garage, or if a refrigerated warehouse will be built instead of an unrefrigerated one, or chemicals are discovered on or near the site); (2) when the size, elevation, or configuration of the proposed project is altered; (3) when the location or orientation of the proposed project is modified; (4) when there is a change of ownership; or (5) for application to an adjacent site. Consultants cannot accept responsibility for problems that may occur if they are not consulted after factors, which were considered in the development of the report, have changed. SUBSURFACE CONDITIONS CAN CHANGE. Subsurface conditions may be affected as a result of natural processes or human activity. Because a geotechnical/environmental report is based on conditions that existed at the time of subsurface exploration, construction decisions should not be based on a report whose adequacy may have been affected by time. Ask the consultant to advise if additional tests are desirable before construction starts; for example, groundwater conditions commonly vary seasonally. Construction operations at or adjacent to the site and natural events such as floods, earthquakes, or groundwater fluctuations may also affect subsurface conditions and, thus, the continuing adequacy of a geotechnical/environmental report. The consultant should be kept apprised of any such events, and should be consulted to determine if additional tests are necessary. MOST RECOMMENDATIONS ARE PROFESSIONAL JUDGMENTS. Site exploration and testing identifies actual surface and subsurface conditions only at those points where samples are taken. The data were extrapolated by your consultant, who then applied judgment to render an opinion about overall subsurface conditions. The actual interface between materials may be far more gradual or abrupt than your report indicates. Actual conditions in areas not sampled may differ from those predicted in your report. While nothing can be done to prevent such situations, you and your consultant can work together to help reduce their impacts. Retaining your consultant to observe subsurface construction operations can be particularly beneficial in this respect. 1/2010 A REPORT'S CONCLUSIONS ARE PRELIMINARY. The conclusions contained in your consultant's report are preliminary because they must be based on the assumption that conditions revealed through selective exploratory sampling are indicative of actual conditions throughout a site. Actual subsurface conditions can be discerned only during earthwork; therefore, you should retain your consultant to observe actual conditions and to provide conclusions. Only the consultant who prepared the report is fully familiar with the background information needed to determine whether or not the report's recommendations based on those conclusions are valid and whether or not the contractor is abiding by applicable recommendations. The consultant who developed your report cannot assume responsibility or liability for the adequacy of the report's recommendations if another party is retained to observe construction. THE CONSULTANT'S REPORT IS SUBJECT TO MISINTERPRETATION. Costly problems can occur when other design professionals develop their plans based on misinterpretation of a geotechnical/environmental report. To help avoid these problems, the consultant should be retained to work with other project design professionals to explain relevant geotechnical, geological, hydrogeological, and environmental findings, and to review the adequacy of their plans and specifications relative to these issues. BORING LOGS AND/OR MONITORING WELL DATA SHOULD NOT BE SEPARATED FROM THE REPORT. Final boring logs developed by the consultant are based on interpretation of field logs (assembled by site personnel), field test results, and laboratory and/or office evaluation of field samples and data. Only final boring logs and data are customarily included in geotechnical/environmental reports. These final logs should not, under any circumstances, be redrawn for inclusion in architectural or other design drawings, because drafters may commit errors or omissions in the transfer process. To reduce the likelihood of boring log or monitoring well misinterpretation, contractors should be given ready access to the complete geotechnical engineering/environmental report prepared or authorized for their use. If access is provided only to the report prepared for you, you should advise contractors of the report's limitations, assuming that a contractor was not one of the specific persons for whom the report was prepared, and that developing construction cost estimates was not one of the specific purposes for which it was prepared. While a contractor may gain important knowledge from a report prepared for another party, the contractor should discuss the report with your consultant and perform the additional or alternative work believed necessary to obtain the data specifically appropriate for construction cost estimating purposes. Some clients hold the mistaken impression that simply disclaiming responsibility for the accuracy of subsurface information always insulates them from attendant liability. Providing the best available information to contractors helps prevent costly construction problems and the adversarial attitudes that aggravate them to a disproportionate scale. READ RESPONSIBILITY CLAUSES CLOSELY. Because geotechnical/environmental engineering is based extensively on judgment and opinion, it is far less exact than other design disciplines. This situation has resulted in wholly unwarranted claims being lodged against consultants. To help prevent this problem, consultants have developed a number of clauses for use in their contracts, reports and other documents. These responsibility clauses are not exculpatory clauses designed to transfer the consultant's liabilities to other parties; rather, they are definitive clauses that identify where the consultant's responsibilities begin and end. Their use helps all parties involved recognize their individual responsibilities and take appropriate action. Some of these definitive clauses are likely to appear in your report, and you are encouraged to read them closely. Your consultant will be pleased to give full and frank answers to your questions. The preceding paragraphs are based on information provided by the ASFE/Association of Engineering Firms Practicing in the Geosciences, Silver Spring, Maryland 1/2010