1
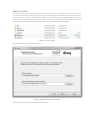
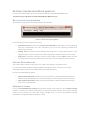
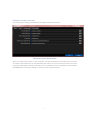
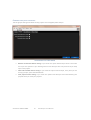
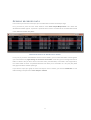
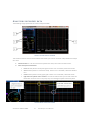
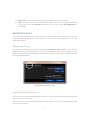
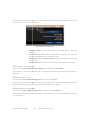
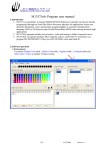
Data Analysis User
Manual
July 2012 Edition
Worldwide technical support and product information:
www.toolsforsmartminds.com
TOOLS for SMART MINDS Corporate headquarter
Via Padania, 16 Castel Mella 25030 Brescia (Italy)
Copyright © 2010 Tools for Smart Minds. All rights reserved.
C ONTENTS
PREFACE
ABOUT THIS MANUAL
REQUIREMENTS
6
6
6
MINIMUM HARDWARE REQUIREMENTS
6
MINIMUM SOFTWARE REQUIREMENTS
6
INSTALLATION
7
GETTING STARTED WITH DATA ANALYSIS
8
DATA ANALYSIS MAIN WINDOW
8
SETTING DATA ANALYSIS
8
GENERAL SETTINGS
8
General folders settings
9
General projects settings
10
OPENING RECORDED DATA
11
ANALYZING RECORDED DATA
12
CHART ANALYSIS TOOLS
EXPORTING DATA
ERRORE. IL SEGNALIBRO NON È DEFINITO.
13
Export data to disk
13
Export data to clipboard
14
Export image to disk
14
Export image to clipboard
14
OTHER FUNCTIONALITIES
15
FIGURE INDEX
16
INDEX
17
P REFACE
iDaq is a general purpose data logger capable to acquire, store and analyze data coming from National
Instruments acquisition devices. These devices can be connected to a computer through different types of
interfaces: USB, PC, PCI Express, Ethernet. iDaq uses one acquisition device at a time. If you have more than
one acquisition device connected at the same time to the computer, iDaq let you choose the one you want to
use to acquire signals.
Data acquiring, anyway, is just the first step you can do. After having recorded data, you can go on analyzing,
comparing and checking them in a very fast and easy way. The iDaq subprogram Data analysis in particular has
the task of analyzing data recorded by iDaq during the signal acquisition. Select a graph you’re interested in
and use Data Analysis functionalities to get an accurate and professional study.
A BOUT
THIS MANUAL
This manual has been prepared to help you to remove all your doubts about Data Analysis using. Use it to
familiarize yourself with Data Analysis: it contains a lot of examples to teach you step by step all about his
features and applications. Throughout each example, you will find illustrations giving information about the
concepts explained in that step. It is divided in three parts:
•
•
•
INSTALLING DATA ANALYSIS: This section describes the minimum requirements for installing and
using Data Analysis. The user has to know how to install and configure National Instruments
acquisition devices in order to succeed in using this section.
CONFIGURE DATA ANALYSIS: This section describes how to arrange necessary general settings for a
correct program working.
RUNNING DATA ANALYSIS: This section describes features, functions and application cases of Data
Analysis. There are a few examples of how to use Data Analysis in order to help the user to understand
how it works.
R EQUIREMENTS
In this section are listed requirements that users must have in order to install and use Data Analysis properly. It
is strongly recommended to check them out before starting Data Analysis installation.
M INIMUM
HARDWARE REQUIREMENTS
Ensure that your computer fulfill the following hardware requirements:
•
Dual core CPU (quad core CPU is suggested)
•
2 GB RAM (4 GB is strongly recommended)
•
display resolution 1024x768 or higher
•
200 MB free space on disk required by iDaq
•
about 800 MB free space on disk required by National Instruments device drivers
•
mouse or other pointing device
M INIMUM
SOFTWARE REQUIREMENTS
Ensure that your computer fulfill the following software requirements:
•
OS: Windows XP+SP3 or Win 7
•
National Instruments device's drivers. You can download a free copy of the proper device driver for
your acquisition device at www.ni.com.
I NSTALLATION
This section guides you step-by-step through the installation process and introduces you to the first use of D
and Data Analysis. Before installing iDaq you have to install and configure the National Instruments acquisition
device. Check your acquisition device with the National instruments software Measurement & Automation you
can find in the NI drivers CD-ROM. After having done it, you can start the guided installation. IDaq is distributed
as a ZIP file. Extract iDaq files into a temporary folder and run installation wizard setup.exe.
F IGURE 1 - I NSTALLING I D AQ
After having clicked it, this window will appear:
F IGURE 2 - I D AQ INSTALLATION WIZARD WINDOW
Follow the guided procedure till the end of the installation.
G ETTING STARTED WITH D ATA ANALYSIS
In order to run Data analysis use its link created on desktop or from Windows Start menu:
Start
D ATA
All programs
TOOLS for SMART MINDS
iDaq
Data Analysis.
ANALYSIS MAIN WINDOW
The following image represents the Data Analysis main window:
F IGURE 3 – D ATA ANALYSIS MAIN WINDOW
In the Data Analysis main window you can find:
•
Data analysis menu: It contains the Open data functionality, which allows you to start working
with your recorded data (For more information you can see the “Opening recorded data”
section of this manual).
•
Settings menu: It contains several settings that allows you to handle Data Analysis in the
rightest way (For more information look at the “Setting Data Analysis” section of this manual.
•
Help menu: It contains a link to this manual in order to help you and a “About” section in which
are listed software indications about the current version you’ve installed and other features.
S ETTING D ATA A NALYSIS
This section explains about all the items you can find in the “Settings” drop-down menu.
It is very important to check the Settings list before starting your work: in this way you can take
advantage of all the services Data Analysis offers you without problems.
Here you have the following options:
•
Open recorded data folder: Allows you to open the folder in which by default Data Analysis
stores all your recorded data. It is a fast way to keep your data handy and reach them easily.
•
Open exported data folder: Allows you to open the folder in which by default Data Analysis
stores all your exported data.
G ENERAL
SETTINGS
If you push Settings General settings from the Data Analysis main window, it opens General settings
window: it allows you to define some options for the Data Analysis working. These General settings
concern all the projects you open after having changed them, so if you need different settings
remember to change them before closing your work.
GENERAL
F O LD E R S S E T TI N GS
This section groups settings related to files and folders used by Data analysis..
F IGURE 4 D ATA ANALYSIS F OLDERS WINDOW
When you install Data Analysis on your computer, it creates by default some folders where your data
are saved. In this window you can see the folders path and you can use it to find your data. You can also
change the folder paths if you think it would be more comfortable for you having data in another folder.
Select OK button to save your settings or cancel if you don’t want save them.
9
GENERAL
P R OJ E C TS S E T TI N GS
This tab groups settings that affect the way projects are managed by Data Analysis.
F IGURE 5 P ROJECTS SETTINGS WINDOW
•
Remove closed tasks before saving: If you check this option Data Analysis doesn’t save each
chart you have opened in your working session: Data Analysis saves only charts that you keep
open in the project.
•
Show edit window before saving: If you check this option Data Analysis, every time you are
closing a project, opens the Edit Window
•
Save projects when closing: If you check this option Data Analysis saves automatically your
projects when you close your projects.
© TOOLS for SMART MINDS
10
Data Analysis- User Manual
O PENING RECORDED DATA
In this section you will learn how open your recorded data and start the Analysis stage.
First, you have to press from the main window’s menu Data analysis Open Data. This makes the
Record data window appear: it presents a practical table in which are listed all the recorded data stored
in the default Recorded data folder.
F IGURE 6 F UNCTIONALITIES IN “R ECORDED DATA ” WINDOW
In any case, if you have recorded data stored in several folders, you can select the folder containing data
you’re interested in by right-clicking on an element of the table. In this way you can change data source
folder or delete a file you don’t want in the table. Every recorded data, as showed in the image before,
has several fields in which are specified features that allow you to remember in a very easy way what
that graph stood for without opening it.
If you want to open your graph in order to analyze it more in details, you have to double-click on one
table heading: that opens the “Chart Analysis” window.
11
A NALYZING RECORDED DATA
The following image represents the “Chart analysis window”:
F IGURE 7 "C HART ANALYSIS " WINDOW
This window contains several functionalities that allows you to do an accurate and professional analysis
of a chart:
1.
2.
Channels table: is a list of all channels implied in the chart, their rates and their colour.
Chart analysis functionalities:
•
P icon: Shows/ doesn’t show plot legend. If the P icon is selected, it becomes violet.
•
X icon: Shows/ doesn’t show time stamp. If the X icon is selected, it becomes brown T
icon.
•
G icon: Shows/ doesn’t show graph grid. If the G icon is selected, it becomes violet.
•
Light blue and yellow values readers: The values readers allow you to read values of a
benchmark on the chart in a very easy way. The next figure explains how they work:
F IGURE 8 V ALUE READER FUNCTIONING
© TOOLS for SMART MINDS
12
Data Analysis- User Manual
3.
4.
Values table: is a list of rates between two points registered by the values readers
Chart: The chart representing recorded values acquired by iDaq. An important instrument
concerning a chart is the Autoscale functionality: if you need it, select Chart Autoscale or
press Ctrl+A
EXPORTING DATA
In this section you will learn how to export data you’ve analyzed with Data Analysis. First, you have to
select the Export menu from the “Chart Analysis” window: here are the functionalities you can find
about data exporting.
EXPORT
D AT A TO D I S K
This exporting functionality (you can find it pressing Export Export data to disk or simply pressing
Ctrl+T) allows you to save analysed data in a file in the exportedData folder. Before exporting, you can
define the data format you want for the data file you’re creating. The next figure represents the Data
exporting window opened:
F IGURE 9 D ATA EXPORTING OPTIONS
GENERAL SETTINGS FUNCTIONALITY:
Here you have to choose a data format for the file you’re saving. You can select from the drop-down
menu either CSV or XML format.
In the Precision field you can insert the number of decimal digits to record. You can also indicate which
data you want to export.
13
According to the format you choose, you have several options to select. For example if you press the
CSV tab you can see several check-boxes:
check
F IGURE 10 S ETTING CSV OPTIONS
Separator caracter:
caracter: Select the caracter to separate data in your CSV
document.
Traspose data:
data By default data are organized in columns. If you check the
Traspose data option data are organized in rows.
Add signals names as column headers:
headers Assign signals names as titles at the
top of columns.
Add time info:
info Add in the document the date in which data were recorded.
EXPORT
D AT A TO C L IP B O A R D
You can find it in Export
Export data to clipboard or simply pressing Ctrl+Shift+T.
If you select it, a copy of the acquired data is stored in the clipboard so that you can past them in a
document.
EXPORT
IM AG E T O D IS K
You can find it in Export
Export image to disk or simply pressing Ctrl+I.
If you select it, Data Analysis allows you to save the image of your chart in the folder you prefer. By
default the image is saved in the “exported data” folder, but you can change it.
EXPORT
IM AG E T O C L IP B O AR D
You can find it in Export
Export image to disk or simply pressing Ctrl+Shift+I.
If you select it, Data Analysis allows you to store a copy of the chart in the clipboard
rd so that you can past
it in a document.
© TOOLS for SMART MINDS
14
Data Analysis- User Manual
O THER
FUNCTIONALITIES
This section explains about other functionalities Data Analyzis provides you.
•
Note functionality: Press from the “Chart Analysis window” menu Note Edit: it
opens a window in which you can annote comments about your working session.
•
Preview functionality: Press from the “Chart Analysis window” menu the Preview tab:
it opens a window in which you find a preview of the entire chart
15
F IGURE INDEX
FIGURE 1 - INSTALLING IDAQ .............................................................................................................................. 7
FIGURE 2 - IDAQ INSTALLATION WIZARD WINDOW ................................................................................................... 7
FIGURE 3 – DATA ANALYSIS MAIN WINDOW............................................................................................................ 8
FIGURE 4 DATA ANALYSIS FOLDERS WINDOW .......................................................................................................... 9
FIGURE 5 PROJECTS SETTINGS WINDOW ............................................................................................................... 10
FIGURE 6 FUNCTIONALITIES IN “RECORDED DATA” WINDOW.................................................................................... 11
FIGURE 7 "CHART ANALYSIS" WINDOW ................................................................................................................ 12
FIGURE 8 VALUE READER FUNCTIONING ............................................................................................................... 12
FIGURE 10 DATA EXPORTING OPTIONS ................................................................................................................ 13
FIGURE 11 SETTING CSV OPTIONS ...................................................................................................................... 14
© TOOLS for SMART MINDS
16
Data Analysis- User Manual
A PPENDIX 1: A NALYSIS SIGNS LEGEND
Graph legend OFF
Graph legend ON
Time scale OFF
Time scale ON
Graph grid OFF
Graph grid ON
Yellow values reader
Light blue values reader
17
INDEX
A
Export data to clipboard ................................. 14
Analysis tools
Export data to disk .......................................... 13
Channels table ................................................ 12
Export image to clipboard............................... 14
G icon ............................................................. 12
Export image to disk ....................................... 14
Insert a note ................................................... 15
R
P icon .............................................................. 12
Recorded data window commands
Preview ........................................................... 15
Double-clicking on a table element ................ 11
Values readers ................................................ 12
Right-clicking on a table element.................... 11
X icon .............................................................. 12
S
D
Setting Data analysis
Data analysis work windows
Opening folders ................................................ 8
Chart analysis window .................................... 12
Setting folders ................................................... 9
Main window .............................................. 8; 11
Setting Data Analysis
Record data window ...................................... 11
Setting projects ............................................... 10
E
Exporting data
© TOOLS for SMART MINDS
18
Data Analysis- User Manual
19