1
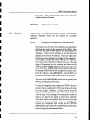
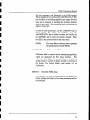
[ARISIIA)
~ssunwnuym
Regional Gwtqtst,
ASSESSMENT
FTqmttyNm:
LouUOn:
SmItham
DateApQmvd
REPORT: 25725
Thorn
NADZT
NADs3
NTS:
1soo.02.11
htlnlna Dlvkkm@):
Latltwk
LatlllldN
1o4K1ow
663404
663364
Lonpltuda
Lo-:
ON conttdellual:
19#0.08.21
AtHn
13243 00
1324807
UTM:
UTM:
OB 64ea6a
627070
os64a3664627s63
camp:
Claim(s):
Check-Mate, Stuart 13
opmtor(s):
Author(s):
Kohlma Pa&k Qdd Corp., Almaden Resourcea Cwp
Pdiquln, J. Duane, Pdiquln, Mcqan
Repoct Yue
No. or pagas:
Searched For:
Gdd,copper,snw
GEOL, GEOC
Elements Anaiwd For : Muitielament
Gedqiil
.
MNGR Miwxatogmphb
(84sampte(s);PIMA)
Keywords:
-3
Statanmnt Nos.:
3123262,3127941
MINFILE No&z
IWK
Related Repoti
02512,10243,11s23,15897
Mintstry of Energy and Mtne8
Enarab,
018.104K
POrPWk
anddIes,
FYRo, Qwrtr kklynr
porphm.
Rhydib,
Stuhinl &cup, Triassic
CG1,104K 116
Thursday. F&may
11, 1 W
Pagel:
1
I
I
I
I
I
I
I
I
I
I
I
I
I
I
I
I
I
I
I
Geology
atid Hydrothermal
Alteration
Mineralogy
of
The Thorn Prospect,
(104 K low
A t/in Mining Division
58“34’N,
132O48’W
Morgan J. Poliquin, M.Sc.
and
J. D. Poliquin, P. Eng,
for
Kohima Pacific Gold Corp.
November 13,1998
Check-mate, Stuart 1, Stuart 2, Stuart 3 Claims
GEOL%ICAL
SURVEY BRANCH
ASSESSMENT
REPORT
I
I
I
I
I
I
I
I
I
I
I
I
I
I
I
I
I
I
I
Table of Contents
summary
2
.........................................................................................................................................................
Style of Mineralization ................................................................................................................................
Introduction .....................................................................................................................................................
Location and Access.. ..................................................................................................................................
claim Information ......................................................................................................................................
History.. .......................................................................................................................................................
Geology ...........................................................................................................................................................
Regional Geology.. .....................................................................................................................................
Property Geology.. ............................. .:. ..................................................... .: ...............................................
Alteration and Mineralization.. ...................................................................................................................
Alteration Mineralogy .....................................................................................................................................
Methodology.. ...........................................................................................................................................
Results.. .....................................................................................................................................................
Discussion.. ................................................................................................................................................
Sampling Results ...........................................................................................................................................
Outcrop Sampling Results.. ......................................................................................................................
Diamond Drill Core Splitting Results.. .....................................................................................................
Conclusions and Recommendations.. ............................................................................................................
References .....................................................................................................................................................
Appendix A: PEvIA Data and Example Spectra.. ........................................................................................
Appendix B: Assay Certificates ...................................................................................................................
Appendix C: Certificate.. ..............................................................................................................................
Appendix D: Cost Statements.. ....................................................................................................................
Appendix E: PIMA Manual.. ......................................................................................................................
2
4
4
.6
6
8
.8
.8
,8
8
.lO
10
11
13
.13
.14
14
16
.I7
.30
34
.36
.38
List of Figures and Tables
Figure
Figure
Figure
Figure
Figure
1:
2:
3:
4:
5:
Table
Table
Table
Table
Table
Table
Table
Table
Table
Table
1:
2:
3:
4:
5:
6:
7:
8:
9:
10:
,3
Location Map, B.C. .................................................................................................................
5
Index Map.. ........................................... ....................................................................................
.7
Property Geology .....................................................................................................................
Location of Drillholes and Discovery Enargite-Pyrite Zone ................................................... .9
.lO
Example of PIMA Spectra.. ...................................................................................................
Claim Information ...................................................................................................................
Hand Trenching Results from American Uranium Work, 1968.. ............................................
Diamond Drilling Results from Inland Recovery work, 1986.. ...............................................
PIMA Results for Hole 86-3.. ................................................................................................
PIMAResultsforHole
86-l .................................................................................................
PIMA Results for Hole 86-6.. ................................................................................................
Outcrop Sampling Results.. ...................................................................................................
Sampling from Hole 86-3 ......................................................................................................
Complete Assay Intervals, Hole 86-3 .....................................................................................
Costs for Proposed Phase I work.. .......................................... .:..............................................
.4
.6
,6
,ll
,112
,13
,13
,14
14
15
I
I
I
I
I
I
I
I
I
I
I
I
I
I
I
I
I
I
I
Summary
The Thorn prospect has been recognized es a zone of spectacular alteration for some time. Brightly
coloured alteration occurs in rock faces along La Jaune and Camp Creeks, south of the Sutlahiie River.
The intermittent work initially concentrated on the porphyry potential in the erea. The gold potential was
only the focus in the most recent campaigns of work. The alteration mineralogy and style of mineralization
alerted the author to the potential to fmd high sulphidation epithermal mineralization. In past campaigns of
work, energite-beering massive sulphide boulders have been found in La Jaune Creek. The best value
obtained from float sampling was 8.45 % Cu, 22 g/t Au and 3 11 g/t Ag. Hand trenching never found the
source of such boulders, however on the east slope of La Jaune Creek, sampling from one 3.7 meter wide
trench returned 9 g/t Au, 311.9 g/t Ag and 0.3 % Cu. During 1986 an 8 hole 688 meter NQ diamond drill
program tested coincident VLF-EM and gold soil anomalies on e small portion of the alteration zone.
Despite limited sampling of altered sections of core, significant gold-copper values were intersected. These
included 10.29 meters of 2.7 g/t Au, 35 g/t Ag and 2.58 meters of 3.78 % Co, 2.0 g/t Au and 152.5 g/t Ag.
No shtdies were every carried out on the core to determine the alteration mineralogy associated with CuAu-Ag mineralization.
This focus of this study was the core from the 1986 program of drilling. Samples were selected on regular
intervals for rnineralogic analysis with a PIMA, a portable infrared spectrometer, capable of determining
alteration mineralogy. Samples were taken from three holes, 86-1, 86-3 end 86-6. Hole 86-3 returned 10.3
meters of 2.7 g/t Au end 35 g/t Ag in past sampling, however intervals ‘were left unsampled from this
campaign of work. These unsplit intervals were sampled to provide a continuous sample interval for the
hole. Limited prospecting was also carried out along Camp Creek, interpreted to represent a major
structural feature, possibly genetically related to alteration-mineralization. A massive zone of enargitepy& was discovered, striking et 060°, parallel to the Creek. Sampling across the exposed 0.5 meters of
this zone returned 6.9 % Cu, 0.9 g/t Au and 180 g/t Ag.
Future work should focus on the alteration zone exposed along Camp Creek. The discovery of massive
enargite-pyrite along the creek supports the interpretation that the creek may be a reflection of the
important controlling stmctural at the time of alteration-mineralization. Prospecting, detailed rock-chip and
soil sampling should be carried out in conjunction with ground geophysics on a grid oriented perpendicular
to the flow of Camp Creek, approximately 15OO.
Style of Mineralization
The author spent time doing graduate work in the South Pacific at the University of Auckland, a centre for
research in epithermal systems. Recently high-sulphidation systems have been distinguished as a distinct
style of mineralization and have become far better understood. Generally it is thought that magmatic
vapours, namely HCI, HF end SO2 , separate from a melt and ascend along major shuchnal features these
gases disassociate in the presence of groundwater, end cool to form a highly acidic fluid (Arribas, 1995).
These fluids alter the wall rock adjacent to the controlling structure forming increasingly neutral stable
clay-dominated mineralogic assemblages zoned away from the stmctore. The fluids are generally so acid
that they have the ability to leech all cations from the host rock, resulting in a residual silica. The residual
or wggy silica bodies are greatly reduced in volume end as such highly pernxable. Subsequent to the
ascent of volatiles, metal-bearing brines ascend along the controlling structural features, precipitating
highly oxidized sulphides, often characterized by enargite, in zones of permeability, including muggy silica
bodies.
High-sulphidation ore-bodies very in mineralogy and style. Large gold-rich bodies, generally associated
with muggy silica and quark-alunite alteration may represent higher levels of such systems. Examples of
this style of mineralization include Peirina, Peru, La Coipa, and Nevada, Chile, Nansatsu, Japan and
Summitville, Colorado. Massive structurally-contiolled enargite-pyrite veins are the source of ore at El
India, Chile, Lepanto, Philippines and Chelopech, Bulgaria. In the case of El India, (23 MT of ore
averaging 6.6 g/t Au, 50 g/t Ag end 4 % Co) massive enargite-pyrite veins, associated with pyrophyllite
2
I
I
I
I
I
I
I
I
I
I
I
I
I
I
I
I
I
I
I
RN-SUTLAHINI
Kohima Pacific Gold Corp.
Figure 1: Locatlon of Thorn property
NLSlMK10W
3
I
I
I
I
I
I
I
I
I
I
I
I
I
I
I
I
I
I
I
altered wall rock, arc crosscut by late-stage gold rich quartz veining and quartz-alunite alteration (Jannus,
1995; Sillitoe, 1995).
Recent work on the Lepanto enargite mine in the Philippines (33 MT of ore grading 2.2% Cu, 3.5 g/t Au
and 11 g/t Ag) has demonstrated with stable isoptope, K-AI and U-Pb age data and fluid inclusion data a
distinct connection with underlying high-grade copper-gold porphyry mineralization in the giant FSE
porphyry deposit (Arribas et al., 1995; Hedenquist et al., 1998). Such a connection has always been
postulated, however this new data implies that settings such as the Thorn showing, arc prospective for
high-grade porphyry copper-gold ore as well as the exposed enargite copper-gold-silver mineralization.
Introduction
The Thorn project was acquired by Kohima Pacific Gold Corp. (Kohimaj in the winter of 1997 and the
spring of 1998. An option to obtain a 100% interest in the Check-mate claim was acquired by Kobima.
Three 4-post claims totaling 52 units were staked around the checkmate claim. The project was acquired
following the recognition, by M.J. Poliquin that the alteration mineralogy and style of mineralization
represented a previously unrecognized high-sulphidation epitbermal Co-Au system. Much recent research
has been conducted on such systems worldwide in recent years and this understanding led the author to
recognize the potential of the Thorn prospect.
Core existing from the 1986 campaign of drilling, carried out by Inland Recovery Group Ltd., was found to
be preserved in good condition although the core racks had collapsed. Considerable time was required to
extract the core and restack it to ensure its preservation. In this program the core, and several areas of
prominent outcrop, were sampled for the purposes of determining alteration mineralogy. As described
above, high-sulphidation settings arc characterized by acid-stable phyllosilicate hydrothermal assemblages
that are zoned, generally parallel to the source structure for ascending hydrothermal fluids. These alteration
patterns, consisting largely of varying compositions of clay that reflect increasingly neutral stable
conditions away from the controlling structure. As a result, a spatial mineralogic database CM often guide
the explorationist towards feeder stmctures and potentially economic mineralization within the altered arca.
Unfortunately the alteration minerals are generally very difficult to identify and distinguish in hand
specimen due to tbe fme-grained nature of clay-dominated mineralogy. New instrumentation, capable of
identifying mineralogy using an infrared spectromehy, has been made available to the exploration
community. The instrument, a portable infrared spectrometer (PIMA), was used in this study to identify
clay mineralogy. Samples were selected from three drill holes, 86-1, 86-3 and 86-6 at intervals down the
hole and measured with the PIMA. Samples were also taken from outcrops mapped along Camp Creek.
Some rock-chip sampling was carried out on mineralized outcrop exposed in Camp Creek. Sections of core
were also split to fill in gaps left by the initial sampling of the core.
Location and Access
The Thorn prospect is located at 58 33’ N latitude and 132 48’W longihlde on map sheet 104K-10W. It lies
on a northwestern flowing tributary of the Sutlahine River in northwestern British Colombia (Figure 1).
The Sutlahine River flows into the Taku River which drains into the Pacific Ocean near Juneau, Alaska.
The nearest centres to the property arc Atlin, located 125 kilometers to tbe northwest and Telegraph Creek,
located 125 kilometers to tbe southeast. ‘Ibe property was accessed by helicopter from Atlin, B.C. for the
work described in this report. The property is located 20 kilometers southeast of King Salmon Lake and 11
kilometers northwest of Trapper Lake, both of which are accessible by float-plane.
Ckeck-mate
20
Stuart I
20
Stuart 2
16
.ytlwt 3
16
Table 1:Claim Information
32069
360714
360715
3607,16
Sept. 2,200l
Nov. 21,200O
~No+. 21.2000
~‘Nbv. 21; 2000
4
I
I
I
I
I
I
I
I
I
I
I
I
I
I
I
I
I
I
I
Claim Information
The claim area consists of the Check-mate claim, held under option by Kohima Pacific Gold Corp.
(Kohiia) and the wholly owned Stuart 1-3 claims, acquired by staking. Table 1 is a list of the claims and
their expiry dates. Figure 2 illustrates the location of the claims.
History
Prominent white-yellow alteration exposed in the Sutlahine and Camp creek area was fmt recognized io
1959 by Kennco exploration geologists. There is no record of any staking having been carried out at that
time.
In 1963 Julian Mining Company staked the Thorn property to cover mineralized outcrops in the drainage
area of the creeks. This work cuhninatcd in four, short Pack Sack drill holes. Results arc unknown to the
author. In 1964, the claimed area was increased and prospecting and geologic mapping was carried out. In
1965 several zones of silicification and anomalous gold values were discovered. Geophysical and
geochemical anomalies were tested with four holes that totaled 179 meters. Subsequently Julian allowed
the property to lapse. Apparently the gold values were not encouraging with the then prevailing gold
prices.
In 1968 the property was rc-staked as the Ink group, acquired by Montana Mines and optioned to
American Uranium Ltd. Work conducted included the sampling of 22 hand tienches, stream sediment
sampling and reconnaissance ground magnctics. Best results from this phase of work included the trenches
summarized in table 2. Subsequently the property was allowed to lapse in 1970.
Uranium Ltd. (Taken from Sanguinetti,
1969)
In 1981 J.R. Woodcock acquired the Daisy claims which were staked to cover the general area of
alteration. In 1982 the claims were optioned to Inland Recovery Group Ltd.. In 1983 a program of geologic
mapping, geochemistry and VLF-EM was carried out. Several zones of coincident elevated gold soil
geochemistry and VLF conductors were identified from this work and were subsequently tested by
diamond drilling in 1986. Eight holes were drilled totaling 688 meters from 3 drill pads. The drilling
intersected several zones of high Au-Ag and Co-Au-Ag mineralization. The intervals sampled for assay arc
listed in table 3. Locations of the drill holes arc illustrated in figures 3,4.
6
I
I
I
I
I
I
I
I
I
I
I
I
I
I
I
I
I
I
I
I
I
I
I
I
I
I
I
I
I
I
I
I
I’
I
I
I
I
The claims were allowed to lapse in 1993 and the Check-mate claim was staked by Clive Aspinall of Atlin,
B.C. shortly after. Kohima Pacific Gold Corp. acquired the right to obtain a 100% interest in this claim in
1998 and in November of 1997 staked the Stuart 1, Stuart 2 and Stuart 3 cl&s which surround the Checkmate claim. In July and August of 1998 84 samples were taken for mineralogic study, using a portable
infrared spectrometer (PIMA). Eleven samples were assayed of diamond drill core, in order to in fdl gaps
in previous sampling. Two chip-samples of outcrop, one from ri zone of massive enargite-pyrite, were also
analyzed.
Geology
Regional Geology
Approximately eight kilometers to the southwest the Coast Range Plutonic Complex Batholith occurs in
contact with Lower Triassic elastic sedimentary rocks and volcanics, Upper Triassic intermediate volcanic
rocks of the Stuhini Group and Lower to Middle Jurassic sedimentary rocks of the Takwhoni Formation
(Souther, 1971). The youngest rocks in the area are the largely flat-lying Sloko group Tertiary rhyolite
volcanics.
Property Geology
The project covers an area of hydrothermal alteration developed in andesite tuffs of the Stuhiii Group.
Altered quartz-feldspar dykes inbude these rocks as do fme-grained matic dykes. A specimen was selected
by Dr. Panteleyev during a visit to the property in 1990 for K-Ar age dating. According to Dr. Panteleyev,
a date of 80 Ma was obtained for altered Stubini volcanics (pas. corn. Panteleyev, 1998). This date
suggests that alteration and mineralization in not associated with flat-lying Sloko rhyolites as has been
previously assumed.
Outcrop is sparse and largely restricted to creek walls and peaks. No mapping was carried out as part of the
present work. From an examination of the core it was noted that altered rock included Stuhini volcanic
tuffs. Previous work described quartz-feldspar dykes as the only significantly altered units.
Alteration and Mineralization
Intense phyllosilicate-sulphate-pyrite-quartz alteration occurs over a roughly 2 x 2 kilometer area. Outcrops
largely occur in canyons and creek walls. The altered rock is forms spectacular white-yellow in colour
bluffs on the walls of La Jaune and Camp Creeks, in sharp contrast to the subdued colours of the Coast
rainforest. The alteration zones are aligned in a roughly northeast-southwest direction (Figure 3). The most
significant zone of alteration is exposed along the walls of Camp Creek. Camp Creek itself is interpreted to
reflect a major structure that may have controlled the ascent of hydrothermal fluids. To the south of this
major zone other areas of outcropping hydrothermally altered rock occur (Figure 3). These zones were the
focus of the 1986 drilling campaign.
To the authors knowledge no significant work has been carried out over the main Camp Creek alteration
zone. Minor prospecting along the Creek, in this program of work, resulted in the discovery of outcropping
massive enargite-pyrite minerrdization associated with a highly clay altered and pyritized volcanic wall
rock. The width of the zone is unknown as the sulphides are covered by gravel in the stream, however a
width of 0.5 meters is exposed. The structure strikes approximately N 60° E, parallel to Camp Creek
(Figure 4).
Alteration Mineralogy
The PIMA was used to determine alteration mineralogy. Samples were collected from three diamond drill
holes, 86-1, 86-3 and 86-6. These holes were selected because they are spatially farthest apart from one
another, and therefore represent the greatest area. Specimens were collected to represent the alteration
mineralogy
observed
in
the
core,
at
regular
intervals
the
down
hole.
8
I
I
I
I
I
I
I
I
I
I
I
I
I
I
I
I
I
I
I
I
I
I
I
I
I
I
I
I
I
I
I
I
I
I
I
I
I
I
Methodology
The objective of the analysis was to determine the style of alteration (with particular emphasis on clays and
sulfates). The PIMA short-wave infrared spectrometer was chosen as a fast and efficient method of
determining the major alteration minerals present. The short-wave infrared (SWIR) technique is exhcmcly
sensitive to alteration minerals such as clays, carbonates and selected sulfates, particularly ahmite and
jamsite. SWIR analysis is also sensitive to elcmcntal substitution and changes in order OI crystallinity in
tiCI?JS.
Short-wave infrared spectroscopy detects the vibrational energy within molecular bonds that have bending
and stretching modes within tbe 1300 to 25OOmn region of the electmmagnctic spectrum. The observed
absorption fcahwcs arc actually fmt and second overtones and combination tones of fundamental modes
which occur in the mid-infrared region. SWIR is particularly sensitive to certain molecules, including,
OH, H,O, NH4, CO,, and AI-OH. The positions of the features in the spectrum and their characteristic
shapes arc a function of the molecules present in the mineral. SWIR spectroscopy therefore, yields some
crystalliity information, but is not detecting primary changes in the lattice stmchue as does X-ray
diffraction.
Variations in chemical composition may be detected as the positions of features shift
consistently with elemental substitution.
‘Ibe following figure demonstrates the various aspects of an absorption fcahuc, including wavelength
position, depth and width (full height, half width maximum).
04
i
1300
Figure 5:
1600
1900
2200
2500
Example of PIMA Spectra
The PIMA-II is a commercial field instrument built by Integrated Spectronics Pty. Ltd. in Australia. The
instrument has an internal light source, allowing collection of laboratory quality data in the field. In
addition, internal calibration allows for comparison of data from one year to the next. The instrument is
capable of measuring a variety of sample types, including rocks, chips, powders and liquids.
Results
Tables 4,5 and 6 list the minerals identified with the PIMA for samples from holes 86-3, 86-l and 86-6
respectively.
10
I
I
I
I
I
I
I
I
I
I
I
I
I
I
I
I
I
I
I
Discussion
The drill holes intersected Stuhini volcanoclastics that are pervasively altered. Generally primary textures
are obliterated by intense white-grey friable clay-pyrite alteration, often associated with quartz veining.
Quartz-feldspar dykes crosscut the volcanics and are also altered. The primary texties are recognizable in
the dykes, however. Late stage, prominent green matic dykes also occur, crosscutting the altered rock.
These mafic dykes are chloritized and contain pyrite.
The ubiquitous presence of pyrite in the samples affected the spectra slightly, by adding “noise” to the
output. However some very clear distinctions and conclusions can be drawn from the work. The bleached,
high intensity clay alteration that is noticeably associated with veining, abundant sulphides and
mineralization is characterized by pyrophyllite and generally lesser dickite. Hole 86-6 passed out of this
alteration and into more neutral stable clay assemblages, from illite-pyrophyllite to illite and finally
chlorite-illite down the hole. This type of gradation in clay mineralogy is classic in high-sulphidation
systems, where acid fluid have been progressively neutralized by wall rock to the structure along which
they have ascended.
Dickite appears to increase in zones of higher gold grades, and occurs in quartz-sulphide veins. An
association between elevated gold grades and the presence of dickite has been recognized in other highsulphidation deposits (Sillitoe, 1995; Thompson, A. J. B., pars. comm.). It is interesting to note that the
pyrophyllite-dickite alteration occurring from 47 to 75 meters depth in hole 86-6, and surrounding a
massive enargite-pyrite vein, has never been split for geochemical analysis..
Illite*smectite alteration is associated with quartz-feldpsar dykes that cross-cut Stihuni volcanics. Primary
textures are largely preserved in these dykes, and illite occurs in the groundmass associated with pyrite and
minor chalcopyrite.
11
I
I
I
I
I
I
I
I
I
I
I
I
I
I
I
I
I
I
I
l-l
8.0
1-2
1-3
1-4
1-S
1~6
10.1
13.5
16.1
19.0
21.9
24.6
26.5
29.3
33.8
38.4
43.5
46.8
1-7
l-8
I-9
l-10
I-11
I-12
I-13
1-14
l-15
1-16
I-17
1-18
l-19
l-20
l-21
1-22
l-23
1-24
l-2.5
1-26
l-27
l-28
I-29
l-30
l-31
l-32
1-33
1-34
Table 5:
49.9
52.7
53.4
57.0
58.7
62.4
65.3
,66.0
21.2
74.1
77.6
80.6
85.7
88.7
91.7
96.8
103.2
108.8
110.2
107.4
110.0
Illitc
.; .,
illite
ilk
iWe
ilk
illite
ilk
illite
illite
illite
illite
illite
ilk
illite
pyrophyllite
pymphyllite
pyropbyllite-dickit*
:~~,:,:
pyropbyllite
py@hyllite
: ~ ~‘1,:
‘,
~@yrophyllite
i,,fT#,Y;~:j
,,,
~pyrophyllite
pyrophyllite
‘,~:~.“~‘~,I,
‘~
i&te
illite
illite
illite
illite
illite
illite ~~
pymphyllite
pyropbyllite
pymphyllite
illite
illite
PIMA Results from
12
smectite?
smectite?
smect@e?
smectite ~’
smectite
smectite?
SlWXtite?
smectite?
smectite?
smectite?,
smectite?
smectite?~
smectite?
Hole 86-1
I
I
I
I
I
I
I
I
I
I
I
I
I
I
I
I
I
I
I
6-I
6-2
6-3
6-4
6-S
6-6
6-7
6-8
6-9
6-10
6-11
6-12
6-13
6-14
6-15
6-16
6-17
6718
6-19
6-20
6-21
6-22
6-23
6-24
6-25
6-26
Table 6:
45.0
46.5
47.8
49.8
5 1.3
54.0
55.5
57.0
59.6
6 1.6
63.2
65.2
66.1
66.9
67.3
68.4
70.4
70.7
72.2
73.4
76.2
78.5
80.2
81.6
82.7
85.7
Samples taken from
Appendix A) contain
diaspore assemblage
and greater proximity
illite
illite
smectite
pyrophyllite
~dickite
pymphyllite
pyrophyllite
pymphyllite
dickite
pyrophyllite
dickite
pyrophyllite
dickite
pyrophyllite
dickite
pyrophyllite
dickite
dickite-pyrophyllite
pyrophyllitc
pyrophyllite
pyrophyllite
dickite
illite
smectite
ill&
smectite
pyrophyllite-dickite
~pyrophyllite
di&te
~illite
~PyrOPhyIlite
illite
pyrophyllite
illite
illite
,illite
illite
chlorite
,#itc
chlorite
‘1~ ‘,:,,~:illite
PIi& Results of&e
86-6
,L~,,~;:
~,~,,~~;
adjacent to the outcropping massive enargite-pyrite zone (OC-1, OC-2, OC-3; see
pyrophyllite!xliaspore. Dickite was not observed in these samples. The pyrophylliteand enargite mineralization in Camp Creek probably represents higher temperatures
to the central part of the system from the area of past drilling.
Sampling Results
Samples were taken for analysis from several outcrops along Camp Creek as well as from diamond drill
core from the 1986 program of drilling.
Outcrop Sampling Results
An outcrop of massive enargite-pyrite was found, exposed along the southern bank of Camp Creek (Figure
3). The exposed potion of the structure is 0.5 meters wide. This zone was chip-sampled as was an adjacent
zone of silicitication and pyrophyllite alteration. The results of this sampling are shown in table 4.
0863
Table 7:
2.7
0.03
Outcrop Chip-Sampling
13
Results
I
I
I
I
I
I
I
I
I
I
I
I
I
I
I
I
I
I
I
Diamond Drill Core Splitting Results
Sampling carried out at the time of drilling was very selective. Holes 86-3 and 86-6 were recognized as
poorly sampled holes. In the case of 86-3 a zone of intense clay alteration and silicification had been
sampled rehnning values listed in Table 3, however significant gaps were left in the sampling. These gaps
were sampled to provide a continuous database for the hole. Hole 86-6 was very sparsely sampled. A
considerable zone of alteration and veining was left unsampled. Only a short section of massive enargitepyrite was sampled in tbis hole. Unformnately owing to time constmints, hole 86-6 could not be sampled as
part of this program.
The sampling results, when combined with past sampling data for hole provide an interesting database
when considering the alteration mineralogic data gathered.
0851
0852
0853
0854
0855
0856
0857
~0858
0859
0860
0861
Table 8:
19;o
21.0
27.0
28.9
30.7
33.8
38.4
39.4
39.9”
‘42.0
44.3
21.0
23.0
27.7
30.2
32.4
35.0
38.6
39.7
42.0
43.8
hug
,
‘2.0
2.0
0.7
0.3
0.7
1.2
0.2
a3
2~1
*
: ,;i;,
0.‘140
0.135
0.140
0.210
0.080
0.220
,~~:~~:
,10.8
5.4
~6.2
:~‘10.8
:~ ~,‘l&
‘,’
:~,~~l:~::*$~,
,,,~,
~~~;~,:>:!,:
b.370, ~;,~,$J$~@
,0;160,‘:;~:; ;;,g.z$
(m(l; ; ;~~~,;,~::;:::s~i~
0.285~~“:;:,::-:~~,~~:~~,718~
,,Q..2$0Q ~i:~‘:4.0 ‘~
Sampling from hole 863
By combining these date with the assay work done previously a more continuous section of sampling is
provided. Table 9 summarizes the results.
23.0
38.6-l
43.5
Table 9:
Conclusions
27.14
56.5
52.5
4.14
17.83
9.00
,0.93
1.52
~2.58
73.5
18.9
30.4
,0..50
,,0.05
~0.06~
Complete Intervals, Hole 86-3
and Recommendations
‘Ihe identification of acid-stable clays with the PIh4A confirmed that the Tbom prospect is a highsulphidation epithetmel system. Pymphyllite and dickite are associated with quartz-gold veining and
massive enargite zones. This assemblage is indicative of deeper levels of exposure within the hydrothermal
system as pyrophyllite is observed to occur at temperatures >200°C in geothermal systems (Reyes, 1990).
Economic mineralization, ixi the form of massive enargite and quartz-gold veins, occur at this level of
exposure associated with pyrophyllite-bearing wall-rock alteration in many bigb-sulpbidation systems.
High-grade massive-enargite veins, occurring at the Thorn prospect, are typical of economic mineralization
explOited as ore in the world-class El India and Lepanto deposits. Late-stage quartz veining and high-gold
grades also occur at the Thorn project, Such veining is importent gold-ore at the El India deposit. Highsulphidation zones of massive-enargite and gold-quartz veining are strongly stmchrally controlled. Oreforming magmatic fluids are focused away from a source intrusive body and into zones of major
permeability that are characterized by major faults and stmchral features and which control economic
mineralization.
14
Camp Creek is interpreted to be the geographic reflection of such a structure. Pyrophyllite-bearing acidsulphate alteration appears to be controlled in this direction and a massive enargite vein has been located,
striking parallel to the creek. This area of the property has never been thoroughly explored. No extensive
geochemical, geophysical work has been extended across the creek, and no drilling has been directed along
or across the creek. The drilling carried out in 1986 was tested altered arcas to the south of Camp Creek.
The PIMA study on core from this program indicated that several zones of pyrophyllite-dickite alteration
occur and are associated with quark-gold veining. These zones probably represent narrow structures that
parallel Camp Creek, which is the main zone of alteration.
Work on this zone should be conducted in two phases. An extensive first phase of grid-construction, rockchip and soil sampling should focus on Camp Creek. Rock-chip samples should be taken across the grid,
with representative specimens for determining alteration mineralogy for each site. Soil samples should be
taken on a 100 x 50 meter grid spacing. The massive enargite-pyrite veins should have a significant EM
signature. VLF-EM work reported by past workers on the property was not conclusive. However a ground
hoop-EM survey on lines that cross Camp Creek should be able to penetrate overburden and differentiate
between massive enargite zones and the high pyrite content associated with argillic alteration. Targets
generated from this work, including the known outcropping massive enargite vein should be targeted with
deep diamond drill holes. Exciting and significant gold-copper grades have been intersected with past
drilling to the south of this area with several short holes. Hole CB-3 contained 37.5 meters of around 1 g/t
gold and included 9 meters of 2.58 g/t Au. Further drilling is warranted to test some of the deeper and
lateral potential of the zone of quartz veining intersected in hole CB-3. Veins at El Jndio proved elusive at
the drill stage and many high grade st~ctures were found subsequent to drill testing in underground
exploration development work. Table 10 is a preliminary cost schedule for a proposed phase I work
program.
Soil/ Rock Sampling
2 samplers
1 geologist
rock samples
soil samples
15
15
500
loo0
PIMA ,time
10
EM GeophyslcJ
10
Helicopter t/me
Float Plane time
Supplies
400.00
400.00
30.00
30.00
~700.00
6oo,oo
20, hours
IO hours
~800.00
300.00
1@XK!iClp
: ~~
~Gw?qoo
10,~0,~.00
$107ibO!m
TO@/
Table 10:
e,ooo.oo
S,OOO.OO
1:5,00~.00
30,r@@$b
~Qp&@l
,~, ‘~,’
~,:,,~~’
,~
:~,8,000.00
Cost Proposal for Phase I Work
15
I
I
I
I
I
I
I
I
I
I
I
I
I
I
I
I
I
I
I
References
Arribas, A., Jr., 1995, Characteristics of bigb-sultidation epithermal deposits and their relation to
magmatic fluid: Mineralogical Association of Canada Short Course Series, v. 23, p. 419-454.
Arribas, A., Jr., Hedenquist, J.W., Itaya, T., Okada, T., Conception, R.A., and Garcia, J.S., Jr., 1995,
Contemporaneous formation of adjacent porphyry and epitbermal Co-Au deposits over 300 leaio
northern Luzon, Philippines: Geology, v.23, p.337-340.
Hedenquist, J.W., Arribas, A., Jr., Reynolds, T.J., 1998, Evolution of an intrusion-cenhed hydrothermal
system: Far Southeast-Lepanto porphm and epithermal Cu-Au deposits, Philippines: Econ.
Geol., v. 93, p. 373-404.
Jannas, R., 1995, Reduced and oxidized high-sulfidation deposits of the El India Disaict, Chile, Unpubl.
Ph.D. thesis, Harvard University
Reyes, A.G., 1990, Petrology of Pbillipines geothermal systems and the application of alteration
mineralogy to their assessment: Jour. Vol. And Geotbemul Research 43, p. 279-309.
Sanguinetti, MB., 1969, A report on the Ink and Lin claims, Sutlabine River area: B.C. Assessment
Report # 2512
Sillitoe, R.H., 1995, Exploration and discovery of base- and precious-metal deposits in the Circom-Pacific
region during tbe last 25 years, Metal Mining Agency of Japan Bull., 125 p.
Soutber, J.G., 1971, Geology and mineral deposits of the Tulsequah map-area, British Columbia,
Wallis, J.E., 1983, Geology, geochemistry, geophysics of the Thorn property: B.C. Assessment Report #
11923.
Woodcock, J.R., 1982, Thorn Property: B.C. Assessment Report # 10423
Woodcock, J.R., 1987, Drilling report on the Thorn property: B.C. Assessment Report # 15897
lb
I
I
I
I
Appendix A:
PIMA Spectra
17
I
I
I
I
I
I
I
I
I
I
I
I
I
I
I
I
I
I
I
EXAMPLE OF ALUNITESPECTRA
EXAMPLEOF DICKITE SPECTRA
I
I
I
I
I
I
I
I
I
I
I
I
I
I
I
I
I
I
I
EXAMPLEOF KAOLINITESPECTRA
-4
EXAMPLEOF ILLITESPECTRA
9,
73
66
I
EXAMPLE OF SMECTITESPECTRA
I
I
I
I
63
EXAMPLEOF PYROPWLLITESPECTRA
77
M
I
I
I
I
I
I
I
I
I
I
I
I
I
I
I
I
I
I
I
Sample #
l-l
1-2
1-3
1-4
l-5
1-6
l-7
1-8
1-9
l-10
l-11
1-12
1-13
1-14
1-15
SpecfraforHole86-1Speclmens
I
I
I
I
I
I
I
I
I
I
I
I
I
I
I
I
I
I
I
l-11
1-12
1-13
1-14
1-15
1-16
1-17
1-18
1-19
l-20
1-21
1-22
1-23
1-24
1-25
1-26
1-27
I
I
I
I
I
I
I
I
I
I
I
I
I
I
I
I
I
I
I
1-23
l-24
l-25
1-26
1-27
l-28
1-29
l-30
l-31
1-32
l-33
l-34
l-35
1-36
1500
1700
2100
1900
Ya”*Le”gth
I”
nm
2300
‘%
‘0
Spectra for Hole 86-3
Sample #
3-2
3-3
3-4
3-5
3-6
3-7
3-8
3-9
3-10
3-11
I
I
I
I
I
I
I
I
I
I
I
I
I
I
I
I
I
I
I
s-10
3-11
3-12
3-13
3-14
3-15
3-16
3-17
3-18
3-19
Sample #
Spectra for Hole 86-6 Spectra
6-l
6-2
6-3
6-4
6-5
6-6
6-7
6-8
6-9
6-10
6-l 1
6-12
6-13
1
00
1500
1100
1900
2100
I
II ’ L
2
0
VT
2
I
I
I
I
I
I
I
I
I
I
I
I
I
I
I
I
I
I
I
bll
b12
6-13
6-14
6-15
6-16
6-17
6-18
6-19
6-20
6-21
6-22
6-23
6-24
I
I
I
I
I
I
I
I
I
I
I
I
I
I
I
I
I
I
I
6-21
6-22
6-23
6-24
6-25
6-26
1500
1700
Vavelength
1900
I" nm
2100
2300
'
4'
I
I
I
I
I
I
I
I
I
I
I
I
I
I
I
I
I
I
I
SAMPLE
#
oc-
oc-
oc
SPECTRAFROM OUTCROP SAMPLES
I
i
-
-
-
=:
“6
%E
mmmmmmmmmmmm
Chemex
To:
Labs Ltd.
KOHIMA
PACIFIC
GOLD
423~6736
HAMPTON
VANCOUVER,
BC
V6T 2G6
Anwkal
chemsts
- Geochemm
- Flegislered Assayers
212 Brooksbank
Ave.
British Columbia
C&da
Narth ‘%%:i
PHONE:
604~96h-0221
FAX: 604-964-9216
Pm@l:
Comments:
m
m
CORPORATlON
(/*
PLACE
THOIN
ATTN:M.POLlQUIN
CERTIFICATE OF ANALYSIS
Be
Ppm
Bi
PPm
t!a
%
Cd
PPm
m
m
m
Page Number
Total Pages
Cerlifzate
Date:
Invoice
No.
P.O. Number
Account
m
: 1-A
:I
1%SEP-1936
: ,98M3!33
:
:OLT
A9830393
Mt
-
PPD
1:
5
wmmmmmmmm
Chemex
Labs Ltd.
AmbQd Chemkts * Geochendsto - Regkterad ksayero
212 Brooksbank Ave.,
North ikmm;;
British Columbia, Canada
PHONE: 604-984-0221
FAX: 504-984-9218
PREP
CODE
To:
!!%A
PA=
GOLDFtPORATlON
423 - 5735 HAMPTON PLACE
~&fiC~UVER. BC
“ST 2G8
Prnjecl :
Comments:
THOIN
AlTNM.POLlQUIN
v.
-mm-
Page Number :1-B
Total Pqles
:1
Certifiite Date: 15SEP.1998
invoice No.
: 19830393
P.O. Number :
Account
:QLl
I
I
I
Appendix C:
Certificate
34
I
I
I
I
I
I
I
I
I
I
I
I
I
I
I
I
I
I
I
I, Morgan J. Poliquin certify that:
1) I received a B.A.Sc. degree in Geological Engineering from U.B.C. in 1994 and a M.Sc. degree io
Geology from the University of Auckland in New Zealand io 1997.
2) I have worked in mineral exploration in Canada, Mexico, Eastern Europe, the South Pacific and the
U.S.A. since graduating.
3) I am a member of the Society of Economic Geologists and the Canadian Institute of Mining,
Metallurgy and Petroleum.
Pacific Gold Corp., which owes the S& 1, Stuart 2 and Stoat 3 claims
lOO?/ointerest in the check-mate claim.
I, J.D. Poliquin certify that:
1) I received a Bachelors degree in Geological Engineering from the Un&sity of Saskatchewan in 1962,
and have been practicing my profession since that time.
2) I am registered as a Professional Enginea in tbe Province of British Colombia.
3) I am a member of the Canadian Institute of Mining, Metallurgy and Petroleum and tbe Society of
mining Engineers.
4) I supervised s-d
b&b field and analytical work described in this report.
A .-_
35
I
I
I
I
I
I
I
I
I
I
I
I
I
I
I
I
I
I
I
Appendix D:
Cost Statements
36
COST STATEMENTS
The work was carried out in two separate petiods of work. Costs for each period are broken down separately
work Pmfod I
item
I
Morgan J. Poliquin, M. SC.
J.D. Polipuin, P.Eng.
G. Peatfie/d, Ph.D., PEng.
Pima Rental
Room and Board
Helicopter
FIBI
Tnmk Rental
Supplies
TOtal
Work
Period
Days/Units
7 man days
i
$1,200.00
$600.00
$1.200.00
$750.00
$300.00
$750.00
$600.00
$700.00
$1,153.89
$246247.17
$500.00
$284.31
$6.63537
$100.00
2
Item
Days/Units
4 man days
$
6.635.37
S 18.648.27
TWOassessment filings were made for this work period
3
4.050.00
Filing 2 was calculated by subrtacting Filing 1 ($4050.00) from the Total work. $ 14,598.27
5 4.379.48
PAC account withdrawals were made, totalling 30% of
FiringZ(Event#)312799(
s 18,9T7.75
$300.00
$600.00
$300.00
$100.00
5
$ 12,012.90
# 3123282)
Cost/Unit
13
4.5
4
TotalCosts
Work Period 1
Work Period 2
TOM
1 (Event
Total
$300.00
$100.00
5
Mofgan J. Poliquin. M.Sc.: 4 field days, 4 P/MA days, 5 report days
J.D Poliquin, P.Eng.: 4 field days, 0.5 days report
P/MA Rental
Room and Board
Helicopter
Apex Air, Beaver
Assays
Truck Rental
Supplies
Photocopies
TOW
Filing
Cost/Unit
4
2
1
2
$100.00
Total
$3.900.00
$2,700.00
$1,200.00
$400.00
$1.609.17
$385.20
$372.04
$500.00
$618.18
$328.31
$12,012.90
1
I
I
I
I
APPENDIX E:
PIMAI MANUAL
I
I
I
38
I
I
II
I
I.
I
I
I
I
I
I
I
I
I
I
~yt+k
PIMA II
Operations Manual
(6th Edition)
Incorporating PIMASPEC Ver. 3.4
@IntegratedSpectronicsPty Ltd 1993
October 1994
Document Ref. No.
ISPL-P2OM-6
Integrated Spectronics Pty Ltd
22 Delhi Road, North Ryde, NSW 2113’
PO Box 437, BaullchamHills, NSW 2153
Australia
.
I
I’
~..
I’
I
I
I
I
I
I
I
I
I
I
I
I
I
I
I
,‘::.
I
PLEASE NOTE
This PIMA II spectrometerhasbeenshippedwith Version 2.4 of the
PIMASPEC operationalsoftware. This software alsomakesuseof a new
wavelengthcalibrationtarget incorporatedin the spectrometer.
For the correct operationof the spectrometer,three (3) calibrationfiles must
be presentin the operatingdirectory of your computer. Thesefiles areused
for wavelengthcalibration,correctionfor light scatteredfrom the sapphire
samplingwindow andfor normalisationof measuredreflectanceto that of a
diffuse gold reflector.
Thesefiles arefactory setand areincludedon your software discsandon the
SRAM card in the HP200LX computer.
More detail canbe found in AppendixA of this manual.
Throughout this manual,referencesaremadeto a trigger on the pistol grip
and the useof this trigger to initiate a measurement.As of January1996,
this feature is not availableand all measurementsmust be startedfrom the
keyboard.
Once a measurementsequencehasstarted,severalsecondsare availableto
position the sampleagainstthe sapphirewindow.
Integrated Spectronics Pty Ltd
January1996
I
I
I’
I
I
I
I
I
I
I
I
I
I
I
I
I
I
I
I’.:
PLEASE NOTE:
THE PIMA SHOULD NOT BE RUN OUT OF “Windows 95”
The PIMA operationfile “PS34.EXE” CANNOT be run out of
“Windows 95”.
If you wish to run the PIMA from a computerthat has“Windows95”
installedyou mustdo so in the “MSDOS Mode”.
This canbe achievedin two ways:
1.
Hit “FS” beforethecomputerenters“Windows 95” whenyou
first start it up.
This shouldbringup the “Microsoft Windows 95 Start up
Menu”.
Select“6. CommandPrompt Only”
From herethe PIMA canbe run in the usualmanner.
or
2.
Start up “Windows 95” in the usualway.
Shutdown“Windows95” selecting“Restart the computer
in MS-DOS mode?“.
From herethePIMA canbe run in the usualmanner.
I
I
I
I
I
I
I
I
I
I
I
I
I
I
I
I
I
:.
I’
PlMA Operation
Note
Feb 1997
Spectral
Measurements
using Petri dishes
Petri dishes and calibration files supplied by Integrated Spectronics are to be used in
accordance with the following procedures.
When a Petri dish is being used, the PIMA operational software is initiated by
selecting the batch file, AAPET*“.BAT where ‘* is the serial number of the
instrument.
This batch file loads calibration files that are used with Petri dishes ONLY.
If no Petri dish is to be used, then the operational software is initiated with the batch
file, AA*“.BAT.
NE: If you change from using a Petri to no Petri dish and vice versa, then you have
to exit the PIMA operations program and start it again using the appropriate batch
file. Failure to observe this requirement will result in spectral distortions.
Warranty
Integrated Spectronics Pty Ltd. (ISPL) warrantsthat this product will be free from defectsin
materials and workmanship for a period of one (I) year from date of shipment. If any product
proves to be defective during this warranty period, ISPL will repair th,edefectiveproductwithout
chargefor parts or labour. ISPL doesnot warrant that the operationof the sofrware,firmware or
hardware shall be uninterruptedor error free.
In order to obtain warranty service on this product,the customermust notify ISPL before
expiration of the warranty period. Customersmust also contactISPL to make suitable
arrangementsfor the performanceof the service.
The customer shall be responsiblefor packing the productfor return to an ISPL servicecentre.
If the warranty service is requiredwithin the first three(3) months after the date of shipment,
ISPL will pay airfreight chargesassociatedwith the return of the product to an ISPL service
centre. Such shipment must be from a major centerservicedby FederalExpress,UPS or DHL
and the customer must contact ISPL to arrangeshipping details. Failure on behalf ofthe
customer to contact ISPL for shipping instructionswill result in the customerbeing responsible
for shipping charges.
If the warranty service is requiredafter the first three (3) months, then the customer shall ship
the product to an ISPL service center with all shipping chargesprepaid.
The customer shall be responsibleunder all circumstancesfor duties, taxes,insuranceand,any
other chargesassociatedwith returning productto an ISPL service centrefor warranty service.
This warranty shall not apply to any defect, failure or damagecausedby improper use,improper
or inadequatemaintenance and care,unauthorisedrepair or attempt to modify the sofhvare,
firmware or hardware of the product.
No other warranty is expressedor implied. ISPL specifically disclaims the implied warrantiesof
mechantability and fitness for a particular purpose.
The remedies provided herein are the customer’s sole and exclusive remedies. ISPL shall not be
liable for any direct, indirect, special, incidental or consequentialdamagesirrespectiveof
whether ISPL has advancenotice of the possibility of such damages.
Integrated Spectronics Pry Ltd
Feb. 1996
Table of Contents
1.
Introduction to PIMA
1
2.
Spectrometer Care
3
3.
Unpacking the Spectrometer
4
3.1
3.2
3.3
4
5
5
4.
5.
6.
7.
Unpacking
SetUp PowerSupply
PowerUp PIMA
Cables and Interconnections
6.
4.1
4.2
4.3
6
6
8
Introduction
PowerSources
RS232Cables
Measuring a Sample
9
5.1
5.2
5.3
5.4
5.5
5.6
5.7
5.8
5.9
9
9
9
11
11
11
12
12
13
Introduction
The HP2OOLXComputer
Invoking ThePIMA Software
Down LoadingDataFiles
Initialisation
Calibration
Measurementof Samples
SavingA Measurement
Viewing And,Zooming
Menus and Operations
14
6.1
6.2
6.3
6.4
6.5
6.6
6.7
6.8
6.9
14
14
14
15
15
15
16
17
18
Introduction
Main Menu And Control
File Menu
MeasureMenu
View
COMM
Options
Utility
System
AccessorySoftware
20
7.1
7.2
20
20
Introduction
PIMAEDTT
PIMA II OperationsManual
Introduction to PIMA
PJMA II is a highly sophisticatedoptical instrumentwhich has
been designedspecifically to meet the needsof geologistsin
obtainingqualityspectraof mineralsandmaterialsin thefield.
The instrument,isenclosedin a small compactcontainerwith a
top sectioncontainingthe controlling computer. At the rear of
the instrumentis the “Back Panel”. Here, variousconnectionsare
made to power supplies,batteries,and computers.Towardsthe
front of the instrument,there is locatedan opticalport wherethe
samplesare placed for measurements. Infrared light passes
through the port and onto the samplewhereit is then reflected
back into the instrument.
The top section of the instrument locatesthe housingfor the
computer, which is a small portable Hewlett Packard PC
(HP2OOLX)runningunder MS-DOS version5.0. Lift the front
cover to unclip the latch. The lid of the computerhousingcan
thenbe openedto revealthe HP200PC.
Located on the bottom of the instrument, a mounting plate
securesthe suppliedpistol grip. This option allows for true one
handoperationof the instrument. A triggermountedon the pistol
grip permits measurementsto be taken without the need for
keystrokeson the HP200PC. Therefore,a samplecanbe held in
the right hand, with the instrument in the left hand, making
measurements
easier.
During the designof the PIMA II, the aims were to make the
instrument light,, portable, and easy to use. The instrument’s
power requirementsare high during a measurement(due to the
internal light source),.and heavy duty batteries are required.
PIMA II is supplied with a waist-mountedbattery pack. The
batteriesare then locatedbehind the user which providesgood
weight distribution and allows for easeof operation.Just one
cableprovidespower to the PIMA from the batteryandthis will
plug into the rearof the instrument.
I
I
I
I”
I
I
I
I
I
I
I
I
I
I
I
I
I
I
I
::.
I~
PIMA II OperationsManual
Usersshouldfind PJMAII easyto travel with, asa dustandwater
proof case is provided with the instrument. Check further
instructionson how to makethe casewaterproof.
PIMA II OperariomManual
2
Spectrometer Care
Care shouldbe taken when handlingthe PIMA andit shouldbe
treated as though it was your favourite camera. PIMA II has
many lensesandother optical components,so like a camera,any
extreme physicaljolts could produce gross mis-alignmentand
evendamage.
Always transport the PIMA in the provided case which is
dustproof andwaterproof.
Always carry the PIMA during field trips with the provided
shoulderstrap.
When travelling between measurementsites by vehicle,ensure
that PIMA is safelystored.
Inform inexperiencedusersof the necessarycare requiredto be
taken,andensurethat they readthis manual.
The batteriessuppliedwith the PIMA are fully chargedleadacid
gel type. Thesebatteriesrequire ventilationto reduceanybuild
up of gas,especiallyduringthe rechargingof thebatteries.
During transport,always check that the terminalsare protected
and cannotshort out with any metal objects. If the batteries‘are
ever shorted,there is an extremelyhigh chanceof fire occurring
and this could be very dangerousduring transport. Always use
the plastic cover provided with the batteriesto ensurecomplete
protection.
It is not recommendedthat mineral samplesare evertransported
in the samecaseasthe PIMA.
IntegratedSpectronicsdoesnot give warrantyto the instrumentif
damagedduring transport,or during field trips. Warrantyonly
covers faulty components from manufacturers and quality
productionof the unit.
3
PIMAII Operations
Mamud
3
Unpacking the
Spectrometer
3.1 Unpacking
On receivingyour brand new PlMA, you should,first checkthe
contentsagainstthe packinglist shownbelow. It is not advisable
to assemblethe unit togetheryet. This manualis designedto step
the user through the correct procedures to avoid any
misunderstanding
of the PIMA.
Remove the casefrom the packing box. Near the main front
handleof the caseis a blackknob which mustbe turnedto release
the pressurein the case.Turn anti-clockwiseto release.Thecase
has four locking clips - two to the front and oneeachside. Lift
theseto openthe lid.
PIMA II PackingList (Field Version)
6 Volt YuasaBattery Pack
PlMA II Spectrometer
PIMA Powersupply
Batterywaist pack
ShoulderStrap
4 Pin Femaleto 4 Pin FemalePowercable
4 Pin to Car Lighter socketPowercable
9 Pin Femaleto 9 Pin MaleRS232cable
HP200PC (mountedon spectrometer)
SRAM card(mountedin HP200PC)
HP200User Manual
PIMA II OperationsManual(this manual)
Operationsdisk (1.44 mbyte)
PimaViewUser ReferenceManual
PimaViewdisk (1.44mbyte)
HP200ConnectivityKit
2
1
1
1
1
1
1
1
1
1
1
1
1
1
1
1
4
I
I
I”
I
I
I
I
I
I
I
I
I
I
I
I
I
I
I
I”
PIMA II Operations Manual
If any of the above is missing please contact Integrated
Spectronics.
Always place the~componentsback in the samesectionsof the
caseasthesepositionsareoptimisedfor easycarryingandweight
distribution.
3.2 Set Up Power
SUPPlY
Removethe spectrometer,power supply, andbatteriesandplace
them on a benchwith plenty of space. Now removethe cables
from the front compartment.The power supply will require a
mainscable. Before plugging in the mainscable,checkthat the
AC voltageselectionis setfor the correctvoltageof yourcountry.
This is locatedat the back of the power supplynearthe ON/OFF
switch. If it requireschanging,then usea screwdriver to unclip
the plasticcover and slide out the fuse. Next, removethe switch
block andselectthe correct voltage. Placethe fusebackandplug
in the mainscable (Do not power up yet).
3.3 Power Up
PIMA
Therearethreesetsof cables- two power cablesandoneRX232
cable.
One power cable provides connectionsbetween the 12 Volt
output of the power supply and the 12 Volt input socketon the
back panelof the spectrometer. This cableis 1 metre long and
hastwo 4 pin female connectorseither end. Locatethe cableand
plug it into the spectrometerfirst, then the powersupply. Turn on
the power supply via the switch locatedat the back of the power
supply. Switch the PIMA on with the ‘POWER ON’ button
locatedat the back of the PIMA. Note that the power supplyhas
a red light which indicates that power is on. The PIMA will
sounda beepwhen poweredup.
The other power cable is used to supply 12~ from a vehicle’s
cigarettelighter.
5
I
I
1~
4
I
I
I
4.1
I
I, 4.2
I
I
I
I
I
I
I
I,
I
I
I”
PIMA Ii Operations Manual
Cables and
Inteticonnections
Introduction
PlMA hasbeendesignedand packagedfor usein manylocations.
It can be usedas a laboratory unit, portablevehicle-boundunit,
and a portablepersonal unit. PIMA comes completewith all
accessories
to carry out any of the mentionedsituations.
POWer
There are three main power sources that the PIMA can be
poweredfrom andtheseare: the city mainsoutlet, 12volt battery
packs,and 12 volt vehicle outlets. There are cablessuppliedfor
eachsituationandtheseare describedbelow.
SOUrCeS
Location 1:
Power:
Cables:
Laboratory
110- 240 Volts AC
2 required.
AC Mains cable(Not suppliedwith unit).
4 Pin femaleto 4 Pin femaleJM socket.
(1 metre long)
Procedure:
Connect the JM 4 pin cablebetweenthe
power supply (12V out) outlet socketand
the PIMA back panel(POWER 12V) inlet
socket. Switch on the Power supply and
the PIMA.
Location 2:
Power:
Cables:
Vehicle
12Volts DC from vehicle
1 required.
CigaretteLighter connectorto 4 Pinfemale
JM socket.(1 metre long)
Procedure:
Connect the JM 4 pin cable betweenthe
PIMA back panel (POWER 12V) inlet
socket andthe cigarettelighteroutlet in the
vehicle.
6
I
I
I’
I
I
I
I
I
I
I
I
I
I~.
:
I
I
I
I
I
‘;:.
I”
PIMA II Operations Manual
WARNING
Pima will only operate from a’ 12 volt
outlet. Check that the cigarettelighter is
12 volts and no other voltage. lf voltages
greater than 13.8 volts is appliedto the
PJMA, serious damagecould be caused
andwarrantywill be void.
Do not leavethe PIMA .poweredon when
startingthe vehiclemotor.
Location 3:
Power:
Cables:
Portable
12Volts DC from oneYuasaBatterypack.
1 required.
Battery with 4 Pin JM female socket. (1
metre long)
Accessories:
I BatteryPack
1BatteryWaist Pack
1 ShoulderStrap
1Pistol Grip assembly
Procedure:
For portable use, the PIMA is supplied
with accessoriesas shown above. Place
one 12 volt battery assemblyin the Battery
Waist Pack. There are two clips which
lock the battery in its compartment. Place
the Waist pack aroundthe waist so that the
batteries are mounted at the rear of the
user. Tighten all straps to make it
comfortableto wear.
Clip the shoulder straps onto the PIMA
handle. This item is not necessary,but
recommended for securing the PIMA
during excursions.
Mount the pistol grip assemblyto the
bottom of the PMA. This assemblylocks
into the metal plate with a centre screw
locatedat the bottom of the handle.
7
I
I,.~:
1~’
I
I
I
I,
I
I
I
I~
I
I,.,I
1~
I
I
I
I
.:,
I;-.
PIMA II Operations Manual
Finally, connect the battery cable to the
PIMA 12V inlet socket mounted on the
backpanel.
4.3
RS232 Cables. PIMA comessuppliedwith oneRS-232cableasdescribedin the
PackingList in section3.1:
A 9 Pin maleto 9 Pin femaleconnectsthe PIMA with a hostIBM
compatiblePC. This option allowsthe userto operatea fasterPC
whetherin the laboratoryor in the back of the vehicle. Use the
suppliedoperationsdisk to load any PC’sthat are requiredto run
the PJMA.
NOTE:
When operating an external PC, check that the
PIMASPEC program running on the HP200 PC
has been terminated. Otherwisethe externalPC
will not communicatewith the PIMA.
8
PIMA II OperationsManual
5
Measuring a. Sample
5.1 Introduction
5.2
The HP 200LX
~Computer
This ”sectionwill take the user through basicoperationsof the
PIMA. The aim is to make a calibrationmeasurement,
make a
samplemeasurement,and save the samplespectrato a file.
Furtherinformationon softwareandcalibrationfiles canbefound
in AppendixA.
PIMA is operatedvia a small personalcomputer,the HP 2OOLX.
ThePC runsunderMS-DOS operatingsystemor HP’sspecialised
Application Manager. This computer is mounted in the top
compartmentof the PIMA and is accessibleby lifting the lid of
this compartment.
Communicationsarewired directly to the PIMA thusreducingthe
numberof externalcablesrequired.
To removethe HP200PC,just lift it out of the compartment.To
the right of the unit is the R.57232cable. Simplydisconnectthe
cable,then lift the PC further upwards. To the left of the PC is a
socketwhich containsthe SRAM card. This holdsall the PEUA
controlprogramsandthespectraldata.
To find out more about the HP2O@PCpleaseread the supplied
manual.
NOTE:
5.3
Invoking the
PIMA
Software
.TheRW232 cablehas a white dot paintedon the
HP plug side. The white dot should be facing
upward.
The PIMA operating software, PIMASPEC, is present as a
compiledfile namedPS34.EXE. The number34 denotesthe
softwareversion- in this releaseit is version3.4.
Thereare two ways of ~operatingthe PIMA control softwareand
this is via the MS-DOS operating system or the HP200
Applicationmanager.
9
I
I
I’
I
I
I
I
I
I
I
I
I
PIMA II Operations Manual
* APPLICATION
MANAGER
When the computer boots from reset (Press
<CTL-ALT-DEb) it will then continue to run the
Application manager. Pressthe (&...) button and then
pressthe ‘F’ key. This will enablethe FILER program
which allows the userto view variousprogramand data
files on the SRAM drives.
Checkthat the PIMA is poweredup.
Select [-A-] drive (SRAM card) as displayedand then
selectAAxxx.bat by movingthe arrow keysup anddown
to the appropriatehighlightedselection.
Pressthe tiNTER> key to invoke thebatchtile.
AAxxx.bat wherexxx is the serialnumber
of thePIMA spectrometer
NOTE:
* MS-DOS
To run underthe MS-DOS operatingsystemsimplypress
the keystroke combination <MENU> <‘A’> <‘T,
~. <ENTER> when in the ApplicationManagermain menu.
This procedurewill terminatethe ApplicationManager
and run MS-DOS. Next, type AAxxx.bat &NTER>
which will invoke the PIMA controller program
PS34.EXE. Note that xxx is the serial number of the
suppliedPIMA.
COMMAND
LINE
If PIMASPECis invokedby itself (e.g. no batchfile) then
two parametersmust be passed.This is the serialnumber
of the spectrometer and the COM port selection.
Examplesare:
I
I
I
PS341234COMl
Selectserial number1234and run
on COMl RSl232port.
PS3423 COM2
Run PlMA with serial number23
on COM2.
I
I
:
10
I
I
I
I
I
I
! ~,
I
I
I
I
I
I i..,
I
I
I
I
I
I
PIMAIIO~eratiomMatucal
If runningunderwindows,it is possibleto run two PIMA
spectrometers
from the samePC, via COMI and COM2
ports
OR alternatively,
Run the spectrometeron COM2 andthe mousedriver on
COMI, thusallowing PimaViewoperation.
5.4 Down Loading
Data Files
The HP 2COJ-Xcomputer is suppliedwith a ‘Connectivitykit’
whichenablesthe userto transferfiles from the HP PC to another
IBM MS-DOSmachine.
The connectivitykit is supplied with the appropriatecables,
softwareanda usermanual.
For further information on the HP 200LX computerconsult the
UserManualsuppliedwith the PJMA.
5.5 Initialisation
On initialisation,the programwill displaya menuat the top of the
screen, a logo, version numbers, and Integrated Spectronics’
address.To activate a menu selection,simply type the letter
shownin uppercase.
For example,typing the letter ‘F’will call the
‘FILE’ menu window to open and a list of submenuswill be
displayed.Always pressthe ‘ESC’key to return backto the main
menu.
5.6 Calibration
To producereliableresults, a calibrationmeasurementmust be
performed.Calibrationsshould be performedbefore any major
batch measurements,
when changingfrom the HP2OOPCto a
compatibleIBM PC, and duringlong periodsof measurements.
Thecalibrationmeasurement
usesa plastictargetwhich is located
in the shutterleavingthe user with no responsibilityfor providing
a target.
Simply pressT’ for sysTemand then ‘c’ for Calib. Note that the
PIMA powersup and the software displaysvariousparameteron
the screen.Theseshow battery voltage,systemtemperature,TE
cooler (detector)temperature,and other scanningparameters.
Now press‘M’ for Measure. The PIMA will start a measurement
II
PIMA II OperationsManual
of the plasticsamplelocatedin the shutter,while the raw datais
displayedsimultaneouslyon the screen. After the plastii:scanis
complete,the softwareinstructsPIMA to proceedwith a second
scan, this being,the referencescan. Finally, the HP2OOPC
calculatesa ratio and resamplesthe data,which is thendisplayed
on the screenasthe spectrumof the plasticsample.
5.7 Measurement
Of Samples
Obtaina quantityof your favourite sampleof kaoliniteandplace
it in a glass(don’tuseplastic!)containerif in powderform.
Locatedto the front of the PlMA is the opticalport whereyour
samplewill be placed.Press‘M’ for Measureon the PC; PlMA
will power up and displaythe systemparametersthen requesta
secondkeystroketo confirm the measurement;press‘M’ again.
The PIMA will now take a raw measurementof the sample
placedat the opticalport. Preventany movementsof the sample
as this could produceincorrect resultsby introducingdistortion
into the data.
Notice that the raw data is displayedin real time during the
samplingprocess.
When the measurement
is complete,the PIMA will sounda beep
vindicatingthat the sampleis not requiredanymore. Removethe
sample from the optical port. PIMA will now carry out the
measurementon the internal reference sample. When the
referencemeasurementis completedthe resultsare displayedon
the HP200PCscreenasthe samplespectrum.
5.8 Saving A
Measurement
To save the currently displayedmeasurementpress the key
sequence‘F’ for FILE, ‘S’for SAVE. On the display,a window
will openshowingvariousoptionsthat canbe entered.
The first optionis the filename,and~ihiscannow be typedin. The
next option is a code option usedfor databasesorting. Simply
pressthe TAB’ key to stepto this option. The final optionis the
commentoption. Once again,pressthe TAB’ key to accessthis
option.Type the requiredcommentandthenpressthe <ENTER>
key. This procedurewill save the measurementto the SRAM
cardas a file: Eachfile savedwill havean extensioncalled‘.DSP
12
PIMA I! OperationsManual
and this identifies the data file as a binary file with header
information.
If the last digit of the filename is a number, then the program
automatically increments this number for each successive
measurement. This can be changedby the user by pressing
cBACKSPACE> to delete unwanted alphanumericsin a file
name.
The headerinformation containsthe comments,databasecodes,
time and date of saving, GPS co-ordinates(if fitted) and many
other parameters. This information can then later be extracted
usingothersoftwaretools providedby IntegratedSpectronics.
5.9 Viewing And
Zooming
It may be requiredto check the wavelengthsor intensitiesof the
sampledspectrumduring a measurementsession. This can be
achievedby pressingthe key ‘V for VIEW. A cursorwill appear
on the screenand locatedto the bottom right of the screen,the
wavelengthand intensity are displayed. Pressthe left and right
arrows to move the cursor up and down the spectrumwith an
incrementof two nanometres.To stepthe cursor,hold down the
‘CTRL’key and,pressthe left andright arrows.
Zooming is performedby pressingthe z’ key for ZOOM. This
function will zoom by a factor of two with the cursor locatedat
the centre. Moving the cursor up and down the spectrumwill
alsoscroll the spectrumat the boundaries.Pressthe ‘ES.7key to
exit the viewingmode.
After any measurement,excepta Calibration,the defaultdisplay
will be the “VIEW” mode. To savethe spectrumjust measured,
press“ESC” to exit to main menuscreenand then select“F” for
File.
13
I
PIMA II Operarims
Mama1
I Menus and Oper%tions
I
I ntroduction
I
This sectionof the manualassumesthat the user is now familiar
with connectingthe PIMA to a power source,the HP200PC, and
cancarry out a samplemeasurement.This sectionwill explainin
more detail the menus provided by the software and their
operations.
I
Main Menu
I And Control
I
The top sectionof the screendisplaysthe main menu for the
PJMASPECprogram. Each menu is selectedby typing the
appropriateletter which is displayedas a capital letter in the text.
Type‘F’for File andT’ for sysTem.
The ‘ESC’key is alwaysusedwhen returningfrom sub-menusand
generallyescapingfrom various routines. This key is almost
standardised
in MS-DOSsoftware.
I
I
To quit the program,pressthe ESC’ key when the programis in
the main menu. The user will be prompted for confirmation:
type ‘y’ or ‘n’for the appropriate,direction
of programflow.
I
File Menu
I”
Pressing‘F’from the mainmenuwill openthe file menu. Thefile
menu hasa sub-listof menuswhich are ‘Save’,‘Open’,‘List’, and
‘Delete’.
I
SAVE -
I
I
I
I
Save a spectrum to disk.
When this menuis active,a window is displayedshowingvarious
options. Use the TAB’ key to select the various options
displayed. The first option is the filename, the secondis an
optional three letter databasecode, and the final option is the
message.When the messagedescriptionof the file is complete,
pressthe&NTE% key to invokesavingof the spectrumto disk.
The file will besavedwith an extensionof ‘.DSP’.
14
PIMAII Operations
Manual
6.7
I
Removethe baselineof thespectrum.
We think of the hull as wrapping a string over the
spectrumfrom the startingto the endingwavelengths.
Hull providesan enhancedvisualpictureof the spectrum
in that it removesthe generalslopefound in majority of
spectra. In mathematicalterms, the hull is a spectrum
with the baselineremoved.
I
I
Pressingthe <SPACE> key, will causea ‘*’ figure to
appearin the menu indicating that the option is now
selected. Pressing‘ESC’ will quit from the menu. All
spectra. displayedwill includedthe hull. Note that the
hull takes longer to compute so it may sometimesbe
necessaryto selectthe hull option off to savecomputing
time.
ZOOM-
Zoomspectradisplayby afactor of 2.
Selectingthis option will enablezoomingof the spectra
by a factor of 2 about the cursor. This is equivalentto
pressingthe z’ key during the view mode.
I
I
I
Pressingthe ‘0’ key will activate this menu.Therearefour submenusrelatingto this option.
HVLL-
I
I
Options
.
COARSE-
Scanthe spectrumdoublespeed.
This option providesfor fast scanningwith the spectrum
beingsampledapproximatelyevery4 nm. This option is
recognisedwhen the raw data being displayedwill not
reachthe endof the screen. This modeis usedwhenlarge
numbersof samplesare requiredor as a first quick look
mode.
I
ENHANCE - Increaseintegrationtime byfactor displayed.
Various samplesreflect light by different amounts.Or,
some mineral samplesare darker than others. When a
dark mineral is being sampled, it may be useful to
16
PIMAII Operations
Manual
increasethe integrationtime by two, threeor four times.
This is easilyachievedby typing the ‘E’ key whenin the
Optionsmenu. Note that when the ‘E’ key is presseda
numberd.isplayedin the menu incrementsfrom 0 to 3.
Where
0
=
I
2
3
=
=
=
Normal mode
Integratefactor 2
Integratefactor 3
Integratefactor 4
If too high an increaseis selected,signal saturationcan
occur. From a technical point of view, this procedure
improvesthe signal to noiseratio. Note that the enhance
optionmustbe off for calibration.
6.8 Utility
Pressingthe ‘u’ key will activatethis menuwith threesub-menus.
For this version of software only the Overlay function is
operational.
GPS -
SaveGPSdata with the spectrum.
[Not implementedin current software]
Thereare two types of GPSunits which can interfaceto
the PIMA spectrometerand these are the Magellanand
Trimbol GPSs. An RS/232 cable connectsbetweenthe
GPSandthe back panelof the PIMA. The RX232 port is
labelled “GPS” and is a DB9 type female connector.
“PimaTap” test software provided by Integrated
Spectronicshasthe capabilityof testingthe GPSinterface.
Futureversionsof PIMASPEC will saveGPSdatain the
headeralongwith the spectrumdata when this option is
toggled.
OVERLAY - Overlaymultiple spectra.
When the overlay function is selected,the directory
window is openedwith a list of spectrumfiles displayed.
Pressthe TAB’ key to the directory window andselecta
spectrumto be overlayedwith the existing spectrumon
17
I
I
I’
I
I
I
I
I
I
I
I
I
1,~
I
I
I
I
I
I’:
PIMA II Operations Manual
the screen. This simple function allows for comparing
multiple spectrawith ease.
PROCESS -
6.9 System
Thisftrnction not active.
Typethe letter T’ andthe systemmenuwill open. Therearethree
submenusdisplayed where two are required for successful
operation.
ZONE -
Reconfigure the Integration, Gains and Zones.
This option must be usedvery carefullyas the parameters
displayedare critical in the operationof the PIMA. Note
that when the zonewindow opensa list of parametersare
displayed. There are 32 numbers in all and theseare
groupedas 4 rows by 8 columns. There are eight zones
where each zone representsa segmentof the spectrum.
For example, zoneo’may cover 1300 nm to 1450 nm,
zone1may cover 1450nm to 16OOnm
andso on. Thestep
range is determinedby two numbersand these are the
STEPS andMEASURES which are shown as the last two
rows of the list. STEPS shouldalwaysequal6 andnever
bechanged.MEASURE canbechangedandusuallyvaries
from 45 to 80. So, when MEASURE = 45 andSTEP = 6
the result is 270 stepsof the grating(opticalcomponent).
The sum of the MEASURES shouldnot be greaterthan
440 (e.g. 55 MeasuresX 8 zones).
To vary the integrationtime, changethe CHOP valueto a
numberthat is a multiple of 6. The value6 means6 chops
for every sample.Therefore, 12 chopswill be twice the
integrationtime of 6 chops,thus each samplewill take
twice aslong. The advantageof increasingthe numberof
chopsis to improve the signal to noise ratio, especially
when dark objectsare sampled.Oncethe zonesareset up
correctly, it is rare that they will need changing. To
increasethe integration time, simply use the OPTION
ENHANCE mode which will automaticallyincreaseeach
zone’schop by the enhancement
factor.
18
PIMA II Operations Manual
The last parameterrow displayedis the GAIN control.
This is usuallyset to 0, andcanbe variedfrom 0 to 3. This
hasthe effect of switching amplifier gain stagesfor each
zone and,is required in reachingthe optimum dynamic
rangein the signal. This proceduredoesnot improve the
signalto noiseratio.
To edit the zone parameters,usethe <ARROW> keys to
move about the array of numbers, use the
(BACKSPACE> key to delete numbersand finally use
the &NTEb key to enter the numberchanged. Press
the&SC> key to return back to the mainmenu.
NOTE:
CALIBRATE -
The zone files are factory set to optimlse
the performance of eachPIMA.
Calibrate thePIMA.
Calibrationdata is requiredby the resamplingalgorithms
which are generated by this menu function. The
calibrationdata aligns the resampleddata to a reference
samplewhich is a piece of plastic locatedin the front of
the shutter. For further details, read section 5.5 on
Calibration.
STATUS- Checkthe PIMA status.
This function will read the temperatureof the system,the
batteryvoltageand displaya few otherparameterssuchas
time anddate.
19
PIMA II OperationsManual
Accessory Software
7.1 Introduction
IntegratedSpectronicsbelievesin ‘total support of its hardware
products with good quality user-friendly software. Section 6
describedthe operationsof the PIMASPECprogramwhich is the
main controlling program for the PIMA. This section will
describethe supportsoftware.
7.2 PIMAEDIT
PimaEdit is a program for converting the spectrumdata files
acquiredby the PIMA to anotherformat. This new format could
be usedfor other software packagessuch as databases,plotting
packagesetc. PimaEditwill also allow the user to modify the
datawith variousfunctions. The functions vary from smoothing
to hull differences. There are a number of optionsfor output.
The outputscan be the original format (.dsp binary riles), ASCII
text outputs,or PCStext output (CSIRO format).
NOTE:
The original spectrum data tiles have a .dsp
extension, therefore the output format can not
have the same extension. This prevents any
accidental overwriting of the original data.
Alwaysmakea backupof the originaldata.
PimaEditoperatessimply by typing ‘PlMAEDlT’&NTER>. The
program will initialise with a window displaying various
parameters.Pressthe LEFT’ and ‘RIGHT’ arrow keysto change
the parameter. Pressthe ‘UP’ and ‘DOWN’ key to move to the
next parameter. Pressthe cENTEF3 key to initialise a batch
conversionas per modified parameters.Pressthe &SC> key to
quit the program.
20
PIMA II
I
Operations
Manual
KEY
I
FUNCTION
ENTER
I
Start conversion
ESC
I
Quit Program
LEFT & RIGHT
ARROW
Changeoptionparameter
UP & DOWN
ARROW
Moveto nextparameter
The following section describeseach option as displayedby
PimaEdit.
REFLECTANCE SCAI;E -
Change the Y component
for ASCII
There are three selectionswhich modify the reflectance
scales
when the output selectedis ASCII The rangesare
O-I, O-100,O-10000. The range O-100is probably the
mostcommonlyusedasit representsa percentagevalue.
WAVELENGTHSCALE -
Change the X component
for ASCII
Thereare three selectionswhich modify the wavelength
scalewhen the output selectedis ASCII. The selections
arechannel,nanometre,micrometre.
HULL FUNCTION -
Removethe baselines
from
spectrum
The hull function has three selectionswhich are disable,
quotient, d$ference. The function of the hull is to
calculatethe slopefound in most spectraandthen ratio or
subtractthis slope from the data. Using the hull will
removeall offsets and normahsethe absorptionfeatures.
This functionworks for all output types. Note that during
a batch process, the hull function requires many
,,
21
I
I
I
I
..~
I’
PIMA II OperationsManual
calculationsso a co-processoris recommended
to increase
processing
speed.
DIFFERENTIAL ORDER -
Calculate
dtzerential
the
1st. 2nd
This function has three selectionsand theseare disable,
1st dtz 2nd diff: The 1st diffcalculatesthe 1stdifferential
which is mathematicallyequivalentto differencebetween
eachdatapoint divided by one. The 2nd difl calculates
the difference between each data point of the 1st
differential. This function is usefulin analysingthe slopes
of the absorptionfeatures,suchthat the greaterthe peaks
in the 1stdifferential, the steeperthe slopsin the original
data.
Thisfunctionworks for all outputtypes.
SMOOTH ORDER -
Smooth the data with n
points
If certaindata is ‘noisy’due to it beinga dark specimen,
thenthis function will reducethe noisecomponentin the
data. Thereare six settingswhich are disable, 5points, 7
points, 9 pOints, 11 points, 13 points. Selectinga 5 point
smoothwill have least smoothingeffect than a 13 point
smooth so check that the points selectedare not ‘over
smoothingthe data. Over smootheddatawill reducethe
resolutioncontent and it may becomeuselesswhenfiner
detailsarebeinganalysed.
OUTPUT FILE TYPE -
Select outputjile
This option will select the output file type which are
ASCII, binary, PCS.
ASCII
This option will output the~dataastext with two columns
and 601 rows. The first column is the wavelength,the
secondcolumn being the reflectance. The output values
are determinedby the scale option settings. For the
wavelength,channel andnanometre areoutput asintegers
22
I
I
I
I
I
I
I
I
I
I
I
I
I
PIMA II OperationsManual
where micrometre output are real numbers. For
reflectance,O-I and O-100areoutput asreal numbersand
O-10000areoutput asintegers.
BINARY
This option will output the databack into the PIMA data
format (.dsp format). The output extensioncan not be a
‘.dsp’as this will cause~overwritingof the original data.
PimaEditusuallyconfiguresthe outputof binarytiles with
anextensionof ‘.bin’.
PCS
~Thisoption will output the dataas text with a format that
wasoriginatedby CSIRO (Australia).
The format for eachtext line is asfollows:
1.
Thefilename.
2.
Theword “LINEAR”
3.
No. points, starting wavelength, ending
wavelength.These numbers for PIMA are 601
13002500.
4.
The next (n points divided by five) lines are the
reflectancevalues.
5.
The last line is again601 13002500.
SOURCE PATH NAME -
The raw data files directory
location.
If no text is entered here then PimaEdit assumesthe
current directory is to be used. Always use the correct
MS-DOS syntax when writing directory paths. For
exampleC:WMAWMAFILES.
23
PIMA II Operations Manual
SOURCE FILE SPEC -
Specify the batch wildcards
This..~textis used for selecting what files are to be
converted to the new format. It uses the MS-DOS
wildcard syntax which allows for a varietyof optionsin
filtering letters and extensionsfor file selection. For
examples the user wants to select all (.dsp) files for
conversion;then type *.DSP. For only one file to be
converted,type; PIMAFILE.DSP, or a selectionof files,
type;PI??????.*
For further information on wildcards,consulta MS-DOS
referencebook;
I
I
DEST. PATH NAME -
The converted datafiles directory
If no text is entered here then PimaEdit assumesthe
currentdirectoryis to be used.
DEST. ASCII FILE EXT. DEST. BINARY FILE EXT. -
The extension for ASCII
orctput
The extension for binary
output
Thesetwo text options specify the output extensionsfor
the ASCII and BINARY files. Usually PimaEdit uses
(.TXT) for ASCII files and(.BIN) for binaryfiles.
REFERENCE
FILENAME
-
Filename for references
Each time PimaEditmakesa conversionof a datafiles, a
reference is made. The filename which defaults to
‘PZMA.REF may be modified for a different batch
process,or the referenceswill be appended
to that file.
I
I
I
.~.
I
The following is a list of the output generatedfor a
referencefile.
HEADER
LOGO -, .:.,
DATE -
Integrated Spectronics logo.
Date and Time of the conversion by
PimaEdit.
24
PIMA II Operations Manual
FILENAME - Name of the Referencefile.
Path name of the sourcefile.
PATH DATA
FILENAME DATE TIME GPS TIME GPSLAT
GPS LONG
GPS ALT
COMMENT -
RUNPIMAVIEW-
Name of the spectrum converted.
Date the spectrum was sampled.
Time the spectrum was sampled.
Location where the data was sampled.
Message about the spectrum made.
Run the PIMA viewing program
PimaViewis a data viewing and analysisprogramwritten
by IntegratedSpectronicsspecificallyfor the PIMA andis
suppliedwith every spectrometer.Consultthe PimaView
manualfor operations.
25