1
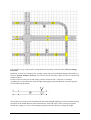
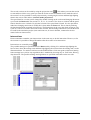
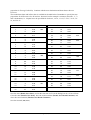
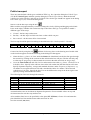
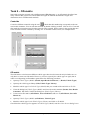
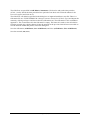
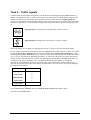
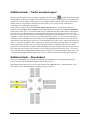
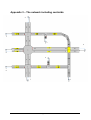
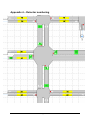
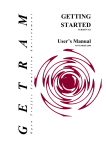
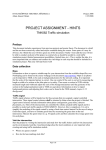
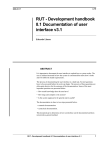
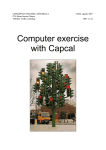
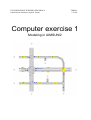
ITN/LINKÖPINGS TEKNISKA HÖGSKOLA
Johan Janson Olstam & Andreas Tapani
TNK082
1/21/08
Computer exercise 1
Modeling in AIMSUN/2
Computer exercise 1 – Description
This computer exercise is an introduction to the traffic simulation tool AIMSUN/2. The tool consists
of an editor called TEDI and a simulation environment called AIMSUN/2. During this exercise you
will get familiar with creating simulation models using the network editor TEDI. Besides the
instructions in this document, there is also a “Get-started” guide available under Transport Simulation
Systems\GETRAM v4.2\Manuals. A complete user manual is available under stud_dir (s:) in the
directory GETRAM-manualer, which also can be reached via internet at
http://www.student.itn.liu.se/kursmaterial/GETRAM%20Manualer/.
In this exercise a model over a fictitious network is to be created. The traffic flow in the network will
be modeled using both turn proportions and by an OD-matrix. The exercise consists of 3 obligatory
tasks and 2 optional tasks. The first task is to code the network and to model route choices using turn
proportions. The second task is to model route choices using an OD-matrix instead of turn proportions.
The third and last obligatory task is to add traffic signal control to one intersection. The optional tasks
are to try to model a vehicle actuated traffic signal and to code a roundabout.
Menu and tab choices will in this document be marked using bold font, e.g. save the network (File,
Save as). Selection or marking of radio buttons or check boxes or writing values in edit boxes will be
marked with italic font, e.g. set the lane width to 3.5 meters by writing 3.5 in Lane Width.
Examination
You have to solve task 1-3 in order to pass the exercise. Present your solutions to the supervisor at the
end of the scheduled class.
Settings in TEDI
Start by open up the TEDI program, there is a short-cut on the start-menu under program\GETRAM
v4.2. Before starting to code the network some vital settings have to be done. Start by creating a new
drawing area (File, New) and save the network (File, Save as). Remember to save continuously during
the computer exercise to avoid loss of data. Another important thing to keep in mind is that writing in
(some) edit boxes has to be completed with ENTER in order for the value to be saved.
Set standard values for lane width and road type
•
Lane width: Edit, Preferences, Sections and set Lane Width to 3,5 meter.
•
Road type: Edit, Preferences, Sections, Types and choose Street as default type by marking
Street and Default Type. Street will now be marked as default (Yes in the last column).
Limit the drawing area to 300×300 meter (Edit, Preferences, Network, Drawing Area and set
Bottom left to 0,0 and Top right to 300,300). Choose a suitable distance between the grid points, e.g.
1.0 meters. The coding gets much easier with the grid turned on (View, Turn autogrid on) and View,
Show grid.
There are several tools available for coding the network, the following is an explanation of the buttons.
Page 1 (12)
Select
Rotate
Selection by area
Zoom
Section
Polysection
Intersection/Junction
Centroid
Controller
Bus Line
Bus Stop
Detector
VMS
Ramp Metering
There are also tools for editing the graphical representation of the environment.
Each section, intersection and centroid is numbered, to show these numbers do View, Show Objects,
and click in the ID column for sections, junctions and centroids. If succeeded, Yes should appear in the
“box” you clicked.
Task 1 – Turn proportions
Code the network
The fictitious network that you will work with is available both below and in appendix 2. A suggestion
is to separate the appendix from the rest of this instruction so that you can easily look at it without
having to turn page.
Sections
The section button is used to code/draw the sections/road segments
.
It will be much easier to complete the exercise if you code the sections in the order as they are
numbered in the picture below! It is possible to change the ID-number afterwards by double clicking
on a section and editing the ID box. It is not possible to change to an ID-number that already is used,
thus it can take awhile to adjust the numbers afterwards.
Page 2 (12)
It is possible to copy sections and to change direction of already created sections (Section, Change
Direction).
Multi-lane sections are created by first creating a single lane section and then changing the number of
lanes by (Section, Number of Lanes). You can also use the short-key CTRL+n, where n is the desired
number of lanes.
Section 14 has an extra lane for left turning vehicles at intersection 2. This lane is created by
”grabbing” the second black box from the right and dragging it upwards until the extra lane appears,
see the following illustration.
The length of a section can also be adjusted by first marking/high-lighting the section and then putting
the mouse in the middle between the two black boxes at the end of the section. The mouse pointer
should now change to a circle, click and drag using the left mouse button to change the length.
Page 3 (12)
The curved sections can be coded by using the polysection tool
. Click where you want the section
to start and then click at every point you want the section to turn and double click to mark the end of
the section. It is also possible to create polysections by creating single sections and then high-lighting
them in the correct order and use (Sections, make polysection).
The speed limit for a section can be changed by double clicking on the section and changing Maximum
speed under the Basics tab. The sections 15, 16, 31, 32, 36 and 37 lies close to a School and the speed
limit is therefore set to 30 km/h. For all other sections is the speed limit 50 km/h. It is also possible to
make lane changing restrictions in TEDI, this is done under the Lanes tab. This is done by marking
the lane that should be restricted in Solid Lines. The Restriction can be set to the whole section or only
a part of it. There are no lane restrictions in this network, but knowledge about how to model them can
be useful in the simulation project (lane restrictions are, at least in Sweden, common for the last
meters before an intersection).
Intersections
Please remember to number your intersections in the same way as in this instruction. However, as for
the sections it is possible to change ID-number after the creation of an intersection.
Intersections are created by using
.
The possible turnings are specified under the Basics tab by clicking New and then high-lighting the
lane or lanes where the turning starts and then high-lighting the section where the turning ends, see the
illustration below. To mark several lanes use the SHIFT button. Click new again to add a new turning.
Some turnings have yield or stop regulation, this is modeled by choosing Stop or Yield in the Warning
drop-down list. The possible turnings and regulations are specified in the table on the next side.
Page 4 (12)
Intersect. From section To section Regulation
1 right
2
1
1
4
1 left
6
3
4
stop
3
6
stop
3
8
stop
5 right
6
5
8
5 left
2
7
8
stop
7
2
stop
7
4
stop
2
3
4 right
4 right
4 left
10 right
10 right
10 left
12 right
12 right
12 left
14 right
14 right
14 left
9
11
13
11
13
5
13
5
9
5
9
11
11 right
11
11 left
16
16
16
18 right
18
18 left
20
20
20
15
17
19
17
19
12
19
12
15
12
15
17
Intersect. From section To section Regulation
32
37
yield
4
32
16
yield
36
16
36
31
15
31
15
37
27
27
27
30 right
30
30 left
40
40
40
9 right
9
9 left
29
33
10
33
10
28
10
28
29
28
29
33
6
26
26
28
28
21
21
27
22
22
25
25
27
7
22
22
24
24
2
2
23
3
3
21
21
23
5
yield
yield
yield
yield
yield
yield
stop
stop
stop
stop
stop
stop
stop
stop
stop
yield
yield
stop
stop
stop
Driving behavior differs between different intersections and different countries. Some drivers enter an
intersection even though they know that they will not be able to leave it within for example the current
green period. Intersections in which the opposite hold, i.e. in which drivers do not enter if they are not
able to leave, should be modeled as a Yellow box intersection. Change intersection 5 to a Yellow box
intersection.
Traffic
AIMSUN offers two possibilities for modeling vehicles’ route choices, either by using turn
proportions or by using an OD-matrix together with a route choice model. We start by modeling the
route choice by turn proportions.
Page 5 (12)
Start by creating a so called result container (Result, New Result Container) and save it (Result,
Save Result Container as).
It is possible to specify different turn proportions for different vehicle types. This network is assumed
to only carry cars. Define the vehicle type car (Result, Vehicle Types) by creating a new vehicle type
(New) and name it Car. Change to the Parameter tab and add the following data:
Name
Length
Width
Max Desired Speed
Max Acceleration
Normal deceleration
Max deceleration
Speed Acceptance
Min Distance Veh
Give Way time
Guidance Acceptance
Mean
4.50
1.70
111.00
2
3.00
9.00
1.15
1.00
8.00
1.00
Deviation
0.30
0.10
11.50
0.30
0.30
0.30
0.10
0.40
2.00
0.00
Min
2.50
1.40
80.00
1.40
1.40
5.00
0.90
0.50
4.00
1.00
Max
7.00
2.10
140.00
3.00
3.00
12.00
1.40
1.50
11.00
1.00
Units
m
m
km/h
m/s2
m/s2
m/s2
m
s
Guided vehicles = 0.00
Cruising Tolerance = 0.80 m/s2
The inflow to the network and the turn proportions can vary between different times during a day.
Inflow and turn proportions for a specific time period are specified in a State (Result, New State, As
Empty). Choose (Result, Sections). For each section is it possible to specify Entrance flow (This is
however of interest only for sections at the edge of the network). It is also possible to specify turn
proportions Turning Probability, i.e. how large proportion of vehicles on the section that will turn
right, left and straight forward. It is possible to use different turn proportions depending on which
section that the vehicles came from (Section Entrances) when entering the present section. One has to
specify the Turning Probability for each combination of Section Entrances and Dest.
Mark a section in the box at the top of the dialog. Then mark an entrance section in Entrances. Specify
any entrance flow in Entrance Flow. Mark a destination in the box Turnings and specify the turn
Page 6 (12)
proportion in Turning Probability. Continue with the next destination and then choose the next
Entrance.
The needed turn share and in flow data is available in the table below. Remember to specify the turn
proportions for all Entrances for all sections. Section 2 has for example 3 entrances (Section 1, 5, 7)
and 2 destinations, i.e. 6 inputs has to be specified for Section 2, 1-2-21, 1-2-23, 7-2-21, 7-2-23, 5-221, and 5-2-23.
From section To section
1
2
1
4
1
6
2
21
2
23
3
4
3
6
3
8
4
9
4
11
4
13
5
6
5
8
5
2
7
8
7
2
7
4
9
28
9
29
9
33
10
11
10
13
10
5
11
15
11
17
11
19
12
13
12
5
12
9
14
5
14
9
14
11
15
31
15
37
Share
0.06
0.94
0.00
0.29
0.71
0.21
0.68
0.11
0.32
0.53
0.15
0.28
0.67
0.05
0.15
0.22
0.63
0.39
0.61
0.00
0.40
0.28
0.32
0.06
0.68
0.26
0.10
0.60
0.30
0.34
0.39
0.27
0.93
0.07
In flow
590
189
347
From section To section
16
17
16
19
16
12
18
19
18
12
18
15
20
12
20
15
20
17
21
25
21
27
22
23
22
3
24
3
24
21
26
27
26
22
27
29
27
33
27
10
28
22
28
25
30
33
30
10
30
28
32
37
32
16
36
16
36
31
40
10
40
28
40
29
Share
0.33
0.07
0.60
0.09
0.88
0.03
0.73
0.06
0.21
0.65
0.35
0.13
0.87
0.71
0.29
0.76
0.24
0.30
0.15
0.55
0.44
0.56
0.01
0.90
0.09
0.29
0.71
0.19
0.81
0.00
0.28
0.72
In flow
530
295
139
186
747
202
Save the state (Result, Save State), and set the start time to 0700 in the dialog box Save Network State.
Close the state (Result, Close State). Save the result container (Result, Save Result Container) and
close the result container (Result, Close Result Container).
Save the network (File, Save).
Page 7 (12)
Public transport
There are some default vehicle types available in TEDI, e.g. bus. Open the dialog box Vehicle Types
(PT) (PT, Vehicle Types) and then open the dialog box Vehicle Types Library. Mark the desired
vehicle type, in this case bus, and click on To Model. The vehicle type should now appear in the dialog
box Vehicle Types (PT). Close both dialog boxes.
.
Start to code the bus stops using the tool
Make each bus stop approximately 15 meters (change the size by clicking and dragging on the black
boxes at the edges). Double click on the bus stop to edit Name and Type. It is possible to model 3
different types of bus stops:
•
Normal – the bus stops on the street
•
Bus Bay – the bus stops in a little extra lane so that vehicle can pass
•
Bus terminal – the bus turns off to a bus terminal
The bus stops should be placed according to the table below (B = Bus Bay and N = Normal):
Section
Type
2
N
3
N
6
N
7
N
9
B
10
B
13
B
14
B
15
N
16
N
19
N
20
N
21
N
22
N
36
N
37
N
(Compare to the picture in appendix 2)
and then click at any place on the drawing area. Double click
Create a bus line by using the tool
on the icon that appears and do the following in the dialog box that appear:
•
Name the line, e.g. line 1, in Name under the Basics tab. Mark then how the bus line goes through
the network by clicking on the sections in that order that the bus will pass. The bus will only stop
at a bus stop if Assign Stop is chosen (mark the section in the table and click on Assign Stop).
•
Go to the Time Tables tab and click on New and name the time table, e.g. Line 1. Click on New at
Schedules Slices. Specify in the edit box down at the left at what time that the first bus will come.
Specify departure frequency, average and standard deviation, under Frequency of Departure, e.g.
10 minutes in average between arrivals and a standard deviation of 1 minute. Choose desired
vehicle type (Veh Type). Specify the Stop Time at the different bus stops in the down-right corner
(Specify average and standard deviation).
The following bus lines runs through the network:
Line
1 – North
1 – South
2 – East
2 – West
3 – East
3 - West
Passed sections
1, 4, 13
14, 5, 8
7, 2, 21, 27 , 33, 34, 35, 36, 16, 19
20, 15, 37, 38, 39, 40, 28, 22, 3, 6
14, 9, 29
30, 10, 13
Bus stops (section numbers)
13
14
7, 2, 21, 36, 16, 19
20, 15, 37, 22, 3, 6
14, 9
10, 13
Dept. frequency
15
15
10
10
20
20
Assume that there are no deviations in departure frequencies. Choose suitable values on stop and
deviation times for each bus stop and bus line.
All created bus lines have to be specified in a bus plan (PT, PT Plans). Choose New and name the
plan. Mark the bus lines and their time tables and click on Add.
Save the network (File, Save).
Page 8 (12)
Task 2 – OD-matrix
Start with saving the network with a different name (File, Save as…). An OD-matrix describes how
many vehicles that want to travel from different origins to different destinations. Origins and
destinations are in TEDI named centriods.
Centroids
Create the different centroids using the tool
. Check that their numbering corresponds to the one
used in this document. You can edit the centroids by double clicking on them. Click on New From and
then mark the section that runs from the network to the centroid. Do the same for the section that runs
to the network from the centroid by clicking New To and then on the section, see example below.
OD-matrix
The OD-matrix varies between different vehicle types but since this network only includes cars we
only have to create one OD-matrix. However, we have to specify the vehicle type car again, but in
order to avoid putting in all numbers again follow the following procedure:
•
Open up Vehicle Types (Model) (Result, Open Result Contaioner) + (Result, Vehicle Types)
•
Open up the vehicle types library (Edit, Vehicle Types Library)
•
Mark the vehicle type Car Vehicle Types (Model) that you created earlier and click on To Lib.
•
Close the dialog box Vehicle Types (Model) and close the result container (Result, Close Result
Container). DO NOT CLOSE! the dialog box Vehicle Types (Library).
•
Create a new OD-matrix (O/D Matrix, New O/D Matrix) and save it (O/D Matrix, Save O/D
Matrix as).
•
Open up Vehicle Types (Model) (O/D Matrix, Vehicle Types)
•
Mark the vehicle type Car in Vehicle Types (Library) and click on To Model.
Check that the vehicle type Car appears in Vehicle Types (Model) and then close the two dialog boxes.
Page 9 (12)
The OD-flows are specified in O/D Matrix, Statements. Click on Set and set the time period to
(07.00 – 09.00). Divide the time period into two periods of one hour each. Write 60 minutes in Set
Interval Length of and click on Set.
The OD-flows can either be specified in the dialog box or imported/read from a text file. There is a
OD-matrix file at s:\TN\K\TNK082\Lab 1 that you can use. Choose Car (Vehicle Type) and import the
matrix by clicking on Import and choose the file (OD-matrix.txt). The OD-matrix is also available in
appendix 1. The second interval in the OD-matrix is empty. This interval is used to clear all vehicles
from the network (the vehicles that travel into the network in the previous interval but was not able to
exit the network within that period). Close the dialog box.
Save the OD-matrix (O/D Matrix, Save O/D Matrix) and close (O/D Matrix, Close O/D Matrix).
Save the network (File, Save).
Page 10 (12)
Task 3 – Traffic signals
Continue with the OD-matrix network but save the network with a different name (File, Save as…).
Remove all regulations, stop or yield, in intersection 2, but add yield on all left turnings. Open up the
intersection and choose None in the Warning drop-down list. Then choose the Signal groups tab.
Click on New and choose desired turnings under Unassigned Turnings (click on Add). The intersection
should be controlled by a 2-mixed phase configuration, see pictures below. Specify the signal groups
as:
Signal group 1: turnings from north and south, section 4 and 12.
Signal group 2: turnings from west and east, section 10 and 14.
When all turnings are assigned to a signal group, the list Unassigned Turnings should be empty.
Now it is time to specify the green times. This is in TEDI done in a traffic control. Create a new traffic
control (Control, New Control) and save it with a suitable name (Control, Save Control as). Open
the dialog box Control, Junctions. Choose junction 2 in the box at the top and then change the control
Type to Fixed. The phases are defined by pressing New. Check the check box Interphase and specify
the green time in the box Duration. Choose the signal groups that should be included in the phase in
the Signal groups box. The safety time is modeled by adding an empty phase, i.e. red for all
approaches. In GETRAM is all phases assumed to have equal amber times, set the amber time to 3
seconds. Specify the green times according to the table below. You can review your signal settings by
pressing the Show button.
Green times (s)
Signal group 1
25
Safety time
6
Signal group 2
23
Safety time
6
Cycle time
60
Save (Control, Save Control) and close (Control, Close Control) the traffic control.
Save the network (File, Save)
Page 11 (12)
Additional task – Traffic actuated signal
Start by positioning detectors according to appendix 4 by clicking on
and then at the position and
the link where the detector should be located. The detectors can be moved along the section at which it
is placed. It is also possible to change the size by dragging with the mouse in the ends of the detector.
Double click on every detector and check the Count and Presence boxes. Name each detector
according to the numbering in appendix 4.
Open up the created traffic control (Control, Open Control) and save it with another name, e.g.
traffic actuated (Control, Save Control). Open up the dialog box Control Plan (Control, Junctions).
Change the control Type to Actuated instead of Fixed. Mark the first phase under Phases, uncheck the
Interphase box. Set the Min time to 4 seconds and the Max time to the old duration time. Go to the
Detector tab. Click on the detectors that should be connected to the present phase (i.e. 41, 42, 121, 122
in phase 1). Set the Extension time to 2.9 seconds for the detectors 42, 122, 102, and 142 (Note! Do
not forget to press ENTER between the inputs. Go to the Actuated tab and choose min in the Recall
drop-down list. Set the Passage time to 0.1 seconds and the Time before reduce equal to the max green
time, i.e. 25 and 23 for phase 1 and 2, respectively. Repeat the settings procedure for the second phase.
Some explanations: Passage time is the time that the green time is extended with for each vehicle
passage. If not all detectors in a phase should extend the green time with the same amount of time, the
Extension time can be used to get a detector to extend the green time with Passage Time + Extension
Time. The Min Recall setting implies that the phase always runs at least the minimum green time. The
No Recall setting implies that the phase only runs if a vehicle has been detected during the red time.
Additional task – Roundabout
There is no roundabout tool available in AIMSUN/2. Roundabouts are instead modeled by using
several sections and linking them together with the junction tool.
Start from the network in task 3. Save it with another name (File, Save as…). Mark junction 2 and
press delete. Create the roundabout according to the figure below.
Page 12 (12)
Appendix 1 – OD-matrix
1
2
3
4
5
6
7
8
9
Sum
1
0.00
60.0
10.0
60.0
30.0
15.0
70.0
20.0
20.0
285
2
50.0
0.00
15.0
100.0
50.0
20.0
200.0
40.0
50.0
525
3
10.0
70.0
0.00
60.0
15.0
5.0
70.0
20.0
40.0
290
4
60.0
180.0
5.0
0.00
50.0
15.0
150.0
180.0
100.0
740
5
30.0
30.0
20.0
30.0
0.00
5.0
10.0
30.0
30.0
185
6
10.0
20.0
5.0
20.0
20.0
0.00
20.0
20.0
20.0
135
7
60.0
200.0
20.0
100.0
20.0
15.0
0.00
60.0
120.0
595
8
10.0
80.0
5.0
100.0
30.0
10.0
80.0
0.00
20.0
335
9
30.0
30.0
20.0
10.0
10.0
25.0
30.0
30.0
0.00
185
Sum
260
670
100
480
225
110
630
400
400
3275
Appendix 1
Appendix 2 – The network
18
17
19
16
36
35
20
15
12
31
37
32
38
34
39
11
40
33
13
10
30
14
9
29
5
4
24
3
22
7
2
21
1
Appendix 2
27
25
26
23
6
8
28
Appendix 3 – The network including centroids
2
1
3
4
8
6
9
7
5
Appendix 3
Appendix 4 – Detector numbering
Appendix 4