1
22
Getting Started
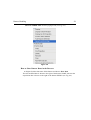
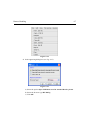
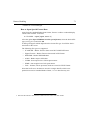
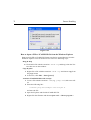
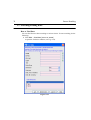
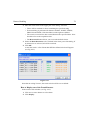
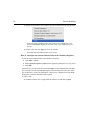
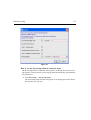
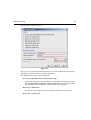
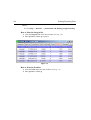
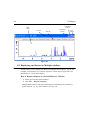
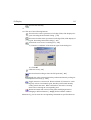
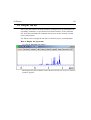
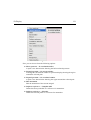
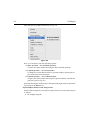
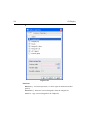
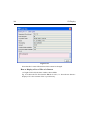
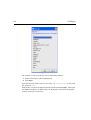
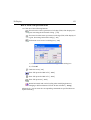
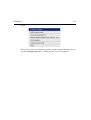
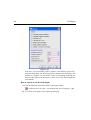
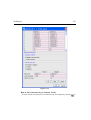
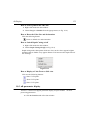
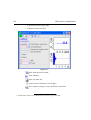
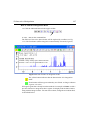
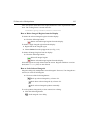
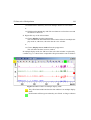
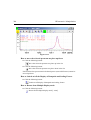
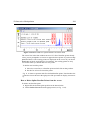
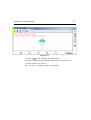
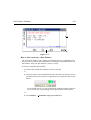
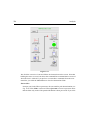
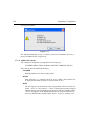
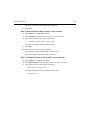
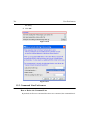
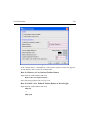
2. Right-click and choose Display Properties... in the popup menu
3. Check the desired items and click OK
INDEX
Please note that the selected items are only shown if they are available. For example, peaks and integrals are onlyDONE
shown if peak picking
INDEXand integration have been
performed, respectively (see also chapter 11). The number of displayed digits for
the integral and peak labels can be set in the User Preferences (click Options
Preferences Spectrum).
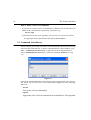
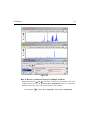
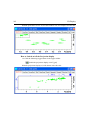
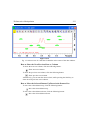
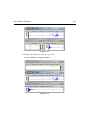
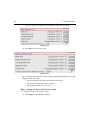
1.9 How to Display Projections/1D Spectra with 2D Spectra
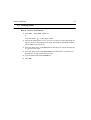
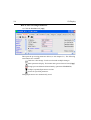
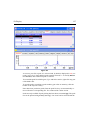
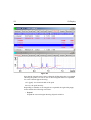
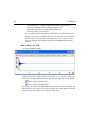
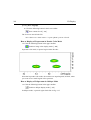
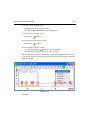
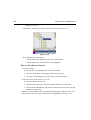
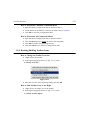
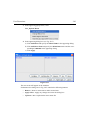
To display projections or 1D spectra in tandem with a 2D spectrum:
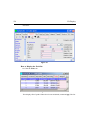
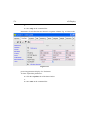
1. Open a 2D spectrum
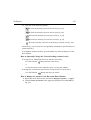
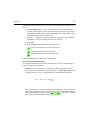
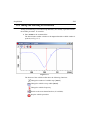
2. If no projections are shown, click the
enter .pr on the command line.
button in the upper toolbar or
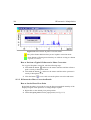
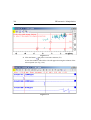
3. Move the cursor into the F1 or F2 projection area.
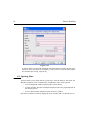
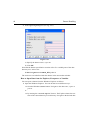
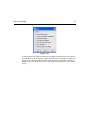
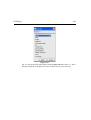
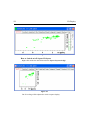
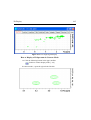
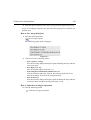
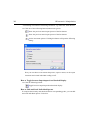
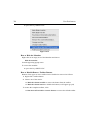
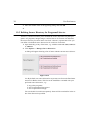
4. Right-click and choose one of the options. With External Projection... an
existing 1D spectrum can be read. This can be a regular 1D spectrum or a
2D projection that was stored as a 1D spectrum. With Internal Projection
the positive projection can be calculated and displayed.
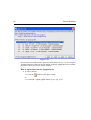
Alternate way to calculate projections is the following:
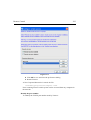
Click Processing
Display Projections...[projd]
or
Right-click on a 1D dataset in the browser and choose:
Display As 2D Projection
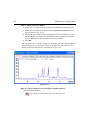
1.10 How to Superimpose Spectra in Multiple Display
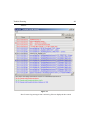
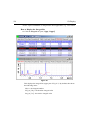
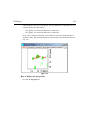
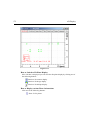
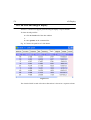
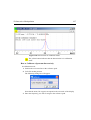
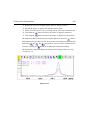
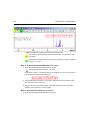
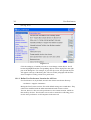
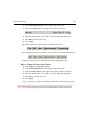
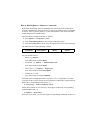
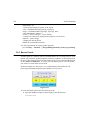
TOPSPIN allows you to compare multiple spectra in Multiple Display mode. To
enter this mode, click the
button in the upper toolbar or enter .md on the command line. When you open a dataset now, for example drag one from the browser,
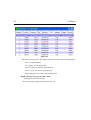
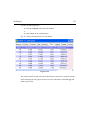
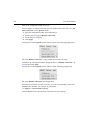
it will be superimposed on the current spectrum rather than replacing it. Several
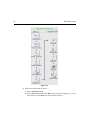
multiple display functions are available now in the data window toolbar. Most
importantly, you can scale and shift each spectrum individually. This allows exact