1
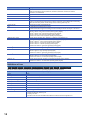
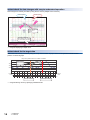
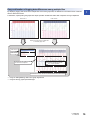
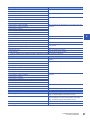
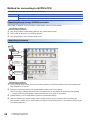
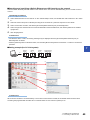
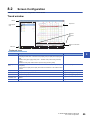
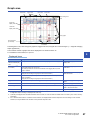
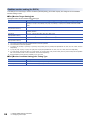
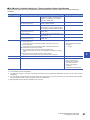
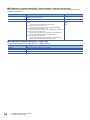
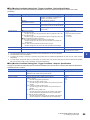
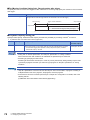
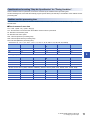
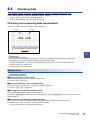
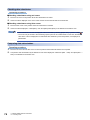
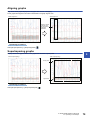
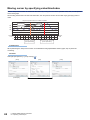
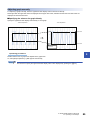
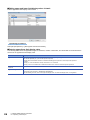
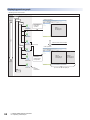
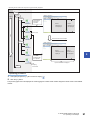
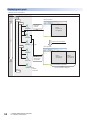
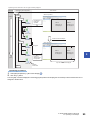
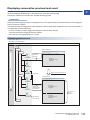
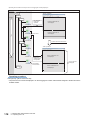
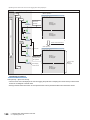
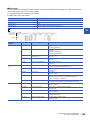
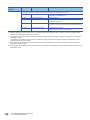
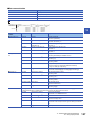
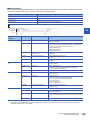
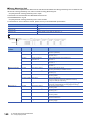
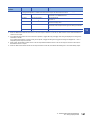
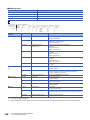
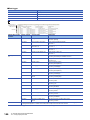
Graph area Data name Trigger mark Blue cursor Red cursor Data missing lines Grid Upper limit display value Lower limit display value Trend graphs Time scale label (X axis label) Cursor label The background color, color and type of graph line, trigger mark color, and grid color can be changed. (Page 98 Changing Graph Appearance) The maximum number of graphs that can be displayed in one trend window is 32. For a realtime monitor window, it is up to 31. 8 Displayed items Item Description Reference Upper limit display value/Lower limit display value Displays a maximum value/minimum value of the display range for each trend graph. Page 84 Specifying upper/lower limit display value Time scale label*1,*3 (X axis label) Displays labels for the time scale. • Time*2/Date*2/Date and Time*2/Index Since Analog module does not have time information in the logging data, only Index display is available. Page 97 Changing display of time scale labels Red cursor A cursor that is displayed as a standard (Displayed at the left edge of the graph area for the first activation.) Page 73 Checking and comparing data values/status Blue cursor A cursor that is displayed for comparison. It is displayed only when the Multiple cursor function is activated. (Displayed at the left edge of the graph area for the first activation.) Trigger mark A mark to indicate the point where a trigger condition (ON/OFF) is satisfied Page 98 Changing color and type of graph Cursor label Displays value/status at the point of intersection between a cursor and graphs. Page 95 Displaying cursor labels Data missing lines Lines to indicate the point where data could not be sampled Page 104 Graph Display for Missing Data or Time Reversed Data Grid Vertical lines/horizontal lines to divide the graph drawing area Page 96 Displaying grid *1 *2 *3 A logging file, in which any of "year", "month", "day", "hour", "minute", or "second" of the data line output format (can be set with Configuration tool) is missing, is displayed with Index only. *(asterisk) is displayed when the date information does not exist, or when the date information does not contain "year, month, and day" information. For a realtime trend window or a realtime monitor window, the displayed date and time depend on the time setting for CPU module. Therefore, it may be different from the time on the personal computer in use. 8 USING TREND GRAPH FUNCTION 8.2 Screen Configuration 57