1
0197-3975188 S3.00 + 0.00
01989 Perpamon Press plc
H A B I T A T I N T L . Vol. 12. No. 4. pp. 171-193.1988
Prlnted in Great Britain.
Urban Data Management Software*
The Growth and Development of Microcomputer Software for
Planning
T. J. CARTWRIGHT,t§ M.R. BROWN$ and H.V. SEAFORTH*
t York University, Toronto, Canada; and $ UN Centre for Human Settlements,
Kenya
For a piece of microcomputer software, Urban Data Management Software
(UDMS) has quite a long history: it is more than 8 years old and has been
through at least 5 major revisions. Few other programs with such a venerable
history (programs such as Wordstar, dBase or Visicalc) have quite such a direct
connection with planning as UDMS.
As such, UDMS provides a good barometer of both the technical developments that have taken place during this period and the social impact which
microcomputers are starting to have on the planning profession in both
industrialised and developing countries. The purpose of this paper is to describe
how UDMS has evolved during the formative years of the microcomputer
"revolution" in order to illustrate, on the one hand, some of the factors involved
in writing planning software and, on the other hand, some of the social and
technical impacts which the microcomputer revolution is having on the planning
profession itself.'
Urban Data Management Software (UDMS) is a polygon-based geographic
information system. UDMS can store, analyse and display data related to points,
areas and networks located on any two-dimensional surface. In its current
version, UDMS can:
calculate standard geographic data such as areas and centroids;
search for points within specified areas or regions;
find the shortest distance between any points on a network;
perform statistical analyses of regional variables, including linear regression
and gravity modelling;
search for the optimum location of facilities in a plane or on a network; and
produce eight different kinds of maps, all subject to enlargement or
reduction of scale according to user requirements.
UDMS was developed by the United Nations Centre for Human Settlements
(Habitat) in 1980 as a means of showing how microcomputers could serve as an
appropriate technology for the planning and management of human settlements
'The authors are indebted to their colleague. Dr Ignacio Armillas. for advice on certain historical points.
However, the views expressed here are the authors' and do not necessarily reflect those of the United Nations
or any of its agencies.
§Address for correspondence: Faculty of Environmental Studies, York University, 4700 Keele Street,
Downsview, Ontario, Canada M3J 2R2.
do he concept of "socio-technical" analysis originated with Eric Trist in his studies of the impact of
technology on coal-mining (Trist and Bamforth, 1951). The idea has been applied widely (Cartwright, 1978), in
situations ranging from textile production in India to electricity generation in Norway.
Downloaded from www.timcart.com.
172
T.J. Carfwright et al.
in developing c ~ u n t r i e sAs
. ~ such, UDMS has always had something of a dual
nature: on the one hand, LTDMS is meant to be sophisticated enough for
planners to be able to use it in real professional situations; on the other hand,
UDMS is meant to be simple enough to be accessible to as many users as
possible. In practice, this has helped create a number of important objectives for
UDMS.
(1) UDMS should be able to run on as wide a variety of microcomputer
equipment as possible.
(2) UDMS should be able to work without the need for specialised
peripherals (such as digitisers or plotters), yet still be able to take
advantage of such devices when they are available.
(3) UDMS should be "friendly" enough for planners with no specialised
knowledge of computers to be able to use and understand without
difficulty.
(4) UDMS should be suitable for use in both operational and training settings;
so its architecture should be open and accessible to anyone interested in
examining it.
In short, the purpose of UDMS has always had both a technical and a social
dimension. On the one hand, UDMS is meant to push microcomputer
technology to its limits in order to show how much can be done with it. On the
other hand, UDMS is also meant to demonstrate that these new capacities can
have an important social impact, for they can be made available to any planner at
relatively little cost in terms of time (for learning) or money (for equipment).
THE ORIGIN AND EVOLUTION OF UDMS
The original version of UDMS was prepared for UNCHS (Habitat) in 1980.
Version 1.00 was written under contract by Dr Vincent Robinson and Ms Wanna
Chin (then of the Department of Geography, Hunter College, New York).
Technical assistance was provided by Dr Jerry Coiner (then also in the
Department of Geography at Hunter College and subsequently Special Adviser
to Habitat). The project was co-ordinated by Dr Ignacio Armillas, a staff
member of UNCHS (Habitat) in Nairobi. UDMS 1.00 was written in CBASIC (a
pseudo-compiled BASIC) on a Vector MZ microcomputer using 5 Y4-inch disks
with 16 "hard" sectors per track (Micropolis format). A preliminary User's
Manual (labelled "Version 0.98" and bound in a green cover) was also released
before the end of 1980.
In early 1981, Robinson and Chin completed a more generic version of the
package (Version 1.01) designed to run on any CP/M-based system capable of
running CBASIC. Over the next several years, Version 1.01 was made available
in appropriate format for many different microcomputers, including various
models of Altos, Compupro, Cromemco, Dynabyte, Godbout, IMS, Morrow,
Northstar, Ohio Scientific, Osborne, SD Systems, TEI, Tandy TRS-80, and
Zenith. UDMS was also installed on several minicomputer systems including a
Wang 2200VP (in Sri Lanka) and an NCR 9000 (in Cyprus); at one point, UDMS
was even running on a VAX 111780.
UDMS and the "green manual" received their "baptism of fire" at a UNCHSsponsored Workshop in Bogota (Colombia) in April 1981. Shortly afterwards,
the entire package and manual were translated into Spanish by the Centro
Habitat de Colombia at the Universidad Nacional de Colombia in Bogota. Over
'The use of microcomputers as an example of '.high technology as appropriate technology" (HTAT) has
been promoted by the United Nations Centre for Human Settlements (Habitat) at least since 1980 (Cartwright,
1985, 1987).
Downloaded from www.timcart.com.
Urban Data Management Software
173
the next few years, this version was used in a series of six more workshops aimed
at improving the qualifications of human settlements planners in Colombia.
Meanwhile, UNCHS (Habitat) organised Workshops in several other
countries, including one in Madras (India) in June 1981 and another in Buenos
Aires (Argentina) in March 1982. During the period from 1981 to 1983. UDMS
was supplied to several planning agencies in the Third World, including the
Urban Development Authority in Colombo (Sri Lanka), the Seychelles Housing
Bank in Male (Seychelles) and (in Serbo-Croatian) the Montenegro Republican
Committee for Planning, Building and Public Works in Titograd (Yugoslavia).
Copies of UDMS were also distributed to numerous individuals in planning
agencies and research institutions around the world.
In early 1983, a slightly revised version of UDMS (Version 1.03) was released.
The new version was supported by extensive documentation (bound this time in
orange covers), including a User's Manual, Program Listing. and an Instructor's
Manual. Among those contributing to these manuals was Professor Jose
Galbinski of the Departamento Urbanismo, Universidade de Brasilia (Brazil).
Later in 1983, the first French edition of UDMS (Version 1.03) was also
released.
Just as UDMS hit its stride in the eight-bit, CP/M environment, however, a
new standard was emerging. This new standard was based on the sixteen-bit Intel
808818086 microprocessor and the Microsoft DOS operating system - both of
which are embodied in the IBM PC and its now numerous compatible "clones" . 3
In one sense, it was easy enough to convert UDMS to run in the new
environment. UDMS had deliberately been written in a highly portable language
(CBASIC). Thus, as soon as a suitable compiler for CBASIC became available
in the new sixteen-bit environment, UDMS could be run on IBM and IBMcompatible microcomputers. Indeed, by early 1984, Robinson and Coiner (then
working on their own) reportedly had a CP/M-86 CBASIC (CB-86) version of
UDMS running. A year later, UNCHS (Habitat) released its own CB-86 version
of UDMS prepared by Herbert Seaforth and others. This version (which became
known as version 1.04) was later translated into Spanish by Ignacio Armillas and
presented at a conference organised by the United Nations Fund for Population
Activity (UNFPA) in Mexico City in February 1986. However, neither the
official nor the unofficial CB-86 version of UDMS was more than just a
translation of the original version. The programs themselves were not changed
and thus still bore the mark of having been written for the old eight-bit
environment.
The problem was that, in another sense, converting UDMS to the sixteen-bit
environment of the IBM PC and compatible was not so simple. For the new
environment provided new powers and capacities - more memory, higher
speed, and video graphics that were beyond the reach of CP/M machines and
even of CBASIC. So although it could be made to run on sixteen-bit machines,
UDMS would clearly not be able to take advantage of the new environment
without a major rewriting.
Consequently, between 1983 and the end of 1985, at least three new versions
of UDMS appeared, all designed to capitalise on the sixteen-bit machines. These
three versions (which became known as UDMS/2, UDMSl3 and UDMSl4
respectively) were produced by:
Dr Richard Langendorf and Katia von Lignau at the Department of Urban
and Regional Planning, University of Miami at Coral Gables (USA);
3There are many sources for technical details of the 16-bit environment: e.g. Morgan and Waite. 1982, for
details of the microprocessor and Norton, 1986, for details of what computers based on that chip can do.
Osborne et al., 1981, is the standard source on CBASIC for microcomputers, while microcomputer
programming in interpreted BASIC is discussed in numerous textbooks and other sources.
Downloaded from www.timcart.com.
174
T.J. Cartwright et al.
Mehmet Icagasi, then a UNCHS (Habitat) consultant to the Ministry of
Public Works and Housing in Dubai (United Arab Emirates); and
UNCHS (Habitat) staff in Nairobi, led by Herbert Seaforth.
All three versions were written in Microsoft interpreted BASIC. Interpreted
BASIC (called BASIC and BASICA on IBM systems and GW-BASIC and
other names on compatibles) is a more powerful but slower and less standardised
version of BASIC than CBASIC; however, the development of compilers for
interpreted BASIC soon justified the abandonment of CBASIC. The other
significant feature of these early DOSIBASIC versions is that they were the
product of quite extensive feedback and communication between users and
authom4
In the end, neither UDMSl2, UDMSl3 nor UDMSl4 was ever officially
distributed by UNCHS (Habitat). For they were overtaken by a decision in
Nairobi early in 1986 to release not just a conversion of UDMS11 but a thorough
revision. The result was UDMSIS, a completely restructured and rewritten
version, incorporating new features, new displays and new algorithms. Version
5.1 was tested in August 1986 at a UNCHS (Habitat) inter-regional workshop at
the Asian Institute of Technology in Bangkok (Thailand). Version 5.2, which
fixed a number of "bugs" in Version 5.1 and added a few more features, was
released in October 1986. The following year, this version was translated into
Spanish by Harry Koppel (a planning consultant based in Bogota) and used in a
national workshop in Santiago (Chile).
Finally, with Version 5.3 released in August 1987, UDMS has come full circle:
the program is once again in compiled form. This has at least three important
advantages (and no real disadvantages).
(1) Loading time is reduced because the whole UDMS program can be held in
memory at once. Microsoft BASIC allows users only 64 Kb of memory; so
large programs like UDMS have to be broken up into less-than-64-Kb
pieces and loaded in and out of memory as required. Modern BASIC
compilers allow users to work with all available memory; so the entire
program can be loaded into memory once and for all.
(2) The program runs much faster because interpretation into machine code is
done before, not during, run-time.5
(3) Modern BASIC compilers also make use of mathematical coprocessors (if
installed), thereby further increasing program execution speed.
Version 5.3 also fixes some "bugs" in previous versions and adds a few new
features.
Copies of UDMSIS have been distributed to hundreds of individuals and
agencies in about 50 countries around the world. With UDMSIS, Habitat also
revised its distribution policy. While Habitat still maintains full copyright on all
versions of UDMS and requires users to sign a licence agreement, this agreement
is now less restrictive than it was. The main reason is that the aim of the
agreement has changed from one of trying to control distribution to one of trying
to encourage it - consistent only with preservation of copyright and protection
against liability. Thus, UDMS can now be copied and distributed almost without
restriction. The only critical conditions are that all copies that are made must
include on the disk a copy of the licence agreement, and that no use can be made
4This assessment differs from that reached by Robinson and Coiner (1986), which seems to be based only
on the period in which they were directly associated with development of UDMS ( i . e . from 1980 to 1983).
5~ssentially.programs written in a compiled language are converted to code understandable by the
computer prior to execution; in fact, it is this compiled version of the program that is then executed, not the
original code written by the programmer. Programs written in an interpreted language, on the other hand, are
converted to machine code by the computer during execution; no separate executable version of the program is
maintained. For UDMS 5.3. we used the TurboBASIC compiler from Borland International.
Downloaded from www.timcart.com.
Urban Data Management Software
175
of the package until that agreement has been signed by a responsible person and
forwarded to Habitat in air obi.^
In this way, the growth and development of UDMS over the last 8 years
reflects much of the general character of the microcomputer revolution. UDMS
has clearly developed with the technology, both in terms of the standards it has
embraced and the features it has offered. UDMS has grown incrementally, along
with technological developments and the increased sophistication of users.
UDMS has found its way into an extraordinary number of situations and
countries and has been run on a great variety of systems - with varying degrees
of success, of course. Finally, and perhaps most significant of all, UDMS has
consistently become more and more "user friendly7' both in terms of the
interface it presents to users and the accessibility of its code. In the next three
sections of this paper, we shall examine these points in more detail by examining
the nature of the UDMS package, how its data files are structured, and what the
program actually does.
THE NATURE AND STRUCTURE OF UDMS
Version 1.01 consisted of 30 separate programs and this same structure was
maintained more or less intact (subject to some consolidation in UDMS/4)
through all subsequent versions prior to UDMSJ.5. Table 1 provides a detailed
breakdown of the nature and size of the original version. In this version (1.01),
UDMS added up to less than 50 Kb of source code and about 80 Kb of
intermediate or object code in CBASIC. When UDMS was converted to
interpreted BASIC in the sixteen-bit/DOS environment, the size of the program
promptly doubled - partly because existing features were made more user
friendly and partly because new features were added.
Moreover, one of the key objectives in the design of UDMS has always been
to produce a program that could run on a minimum system. The original version
of UDMS was written for computers with only 48 Kb of RAM. By the time
CP/M and the CBASIC run-time module (CRUN2) are loaded, this leaves only
just over 40 Kb - the exact amount may vary from one microcomputer to
another - in the transient program area (TPA) for loading and executing
programs, including storing all the constants, variables and arrays used by the
program.' Keeping programs small is thus a matter of critical importance although it could be debated how much of the fragmentation of UDMS/l (see
Table 1) was dictated by hardware limitations and how much was in fact a matter
of programming style.
In any case, the move to the sixteen-bit/DOS environment opened up a variety
of new possibilities for UDMS: rewrite it for CBASIC in the new environment,
rewrite it in interpreted BASIC, or rewrite it in another programming language
altogether (PASCAL and C being the obvious choices). In fact, this last option
was discarded almost immediately. Quite apart from not feeling that the benefits
would justify the costs involved in changing languages, UNCHS had always
wanted UDMS to have an important "demonstration" effect as well as a purely
operational role. Clearly the didactic value of UDMS would be diminished if it
were to be written in a less popular and less widely understood programming
language than BASIC.
The decision to move from compiled to interpreted BASIC was based on a
number of factors. One advantage of CBASIC is that its run-time module
6This is not meant to be an authoritative interpretation of the Licence Agreement, the full text of which is
contained in the file UDMSFORM.DOC on the distribution disk and should be consulted prior to any use of
the package.
'See Osborne et al. (1981).
Downloaded from www.timcart.com.
176
T.J. Cartwl.ight et a1
(CRUN2) can be distributed freely without copyright violation; however, the
almost universal "bundling" of Microsoft BASIC with 16-bit microcomputers has
made this advantage academic. Another advantage of CBASIC is its speed of
execution; however, this argument too has become less persuasive since
compilers for interpreted versions of BASIC have been developed.
On the other hand, CBASIC even in its CB-86 version has nothing like the
graphics capabilities of Microsoft BASIC. In any case, much of the apparent
slowness of UDMSI1 was due to slow disk-access rather than slow programexecution."he
best "fix" for this kind of problem lies not so much in the choice
of programming language as in use of a hard disk and/or a RAM disk. For these
and other reasons, UNCHS decided to convert UDMS from CBASIC to
interpreted BASIC. Specifically, UDMSI5 was written for version 2.0 and higher
of Microsoft BASIC, which includes IBM BASICA, GW-BASIC and several
other version^.^ Only minor modifications were necessary to compile this code in
Version 5.3.
Moving to interpreted BASIC in the sixteen-bit/DOS environment meant an
immediate increase of about 50% in available memory. Microsoft BASIC in all
its various guises is limited to working in only one segment or "page" of memory
(i.e. 64 Kb), even though the microcomputer may in fact have up to ten (or even
more) times as much RAM. However, since most of the operating system and
the interpreter can now be located outside the BASIC work area, this means that
the memory available to programs is now around 60 Kb instead of 40 Kb.
Moreover. Microsoft BASIC includes a built-in function (FRE) that allows a
program routinely to optimise the way in which the work area is being used; this
is commonly referred to as "garbage collection". This in turn allows for larger
programs and/or more efficient execution. Thus, interpreted versions of
UDMSIS will still run on a minimum system (say, 128 Kb RAM and two floppy
disks), although naturally more RAM and a hard disk can improve disk-access
time. But UDMS/5 takes advantage of the greater flexibility of the new
environment in two other important ways.
First of all, the structure of UDMSI5 is much simpler than that of UDMSI1. In
Version 5.2, there are only 6 programs instead of 30 and their average size is
around 20 Kb instead of less than 2 Kb (see Table 2). In compiled form, Version
5.3 consists of a single program of about 180 Kb. In other words, UDMSI5
capabilises on the extra memory available in the new environment to consolidate
its structure.
Second, the overall size of the package has roughly doubled. In part, this is
due to the addition of new features and capabilities, such as file creation under
program control and the ability to "pan" and "zoom" all the maps. But a good
deal of the increase in size is due to a much stronger emphasis in UDMSIS on
"user-friendliness". Earlier versions relied on a hardcopy User's Manual to
explain the nature and operation of each part of the program. ,4s a result, screen
layout and screen prompts were minimal. UDMSI5, by contrast, is designed for
use without a printed manual. Each part of the program incorporates a complete
'In terms of execution time the slowest part of UDMS is the shortest-path al,morithm. In earlier versions of
UDMS, this algorithm might be executed several times for the same network. In UDMSi5 shortest paths are
calculated once for each network as part of the process of creating the network.
'The biggest incompatibility between BASICA and GW-BASIC encountered during the writing of
UDMSl5 involved the use of line 25 for user input. In GW-BASIC. the line-feed caused by pressing ENTER
after responding to an INPUT statement in line 25 can be suppressed by immediately LOCATEing to another
line, even if that line is line 25 again. In BASICA, however. there- does not seem to be any way of preventing
scrolling of the entire screen after responding to an INPUT statement in line 25. As a result. the only safe way
of getting user response in line 25 is by means of the INKEY$ function. which does not require use of the
ENTER key. Of course this means you are restricted to single-keystroke responses. Another apparent
difference between the two BASIC implementations is that, in GW-BASIC. CLS appears to affect the entire
physical screen regardless of any VIEW that may be current. In BASICA, on ihe other hand. the effect of CLS
is limited to the then current VIEW.
Downloaded from www.timcart.com.
Urban Dafa Manageme~zfSoffn,are
Table I . The sfrltcfure and size of C'D1\S:'I.3I
Program name
MAIN
MAINB
CHECK
CORD
NETDIST
SCALE
SORT
BDRY
OVERLAY
MAP
MAPOUT
CIRCLE
CIRCLE1
PSEARCH
INTERSTN
GRID
CLOCK
VARSTAT
REGEOMET
VARREGR
PLOT
REGRAVIT
LOCl
LOCM
NETLOC l
NETLOC2
NETLOC3
SPATHl
SPATH2
SPATH?
Description
)
)
No. of lines
Code
(bytes)
Presents the main menu
Presents a sub-menu for spatial analysis
Checks that polygons are closed and correct
Creates the basic map co-ordinate file
Calculates the link distances in a network
Scales co-ordinates for mapping
Sorts line segments for choropleth mapping
Creates pol!;gon boundary maps
Overlays points:net\vorks on boundary maps
Assigns values to sorted Line segments
Creates choropleth map
Searches for points in a circle
Searches for points in a polygon
Detects intersection of polygons
Overlays a grid on a polygon
Reverses counter-clockwise coding
Calculates variable descriptive statistics
Calculates region centroids. area and perimeter
Performs simple linear regression
Plots results of linear regression
Performs gravity-model calculations
Finds single optimum locations in a plane
Finds multiple optimum locations in a plane
)
)
Finds optimum location(s) in a network
1
1
)
Finds shortest paths between network nodes
I
Total
Average per program
.Source: UNCHS (Habitat). UDMS Programme Lisfing. Version 1.01 (Nairobi: mimeo. June 1983).
According to another UNCHS (Habitat) publication. Technical hrores A'o. 5. the source code compiled to about
80 K b of intermediate code.
description of what it does and how it works. Screen layout and prompts are
detailed and consistent throughout. Detailed technical or background information is provided for those who want it in a ten-page, on-line "disk manual"
that can be "called" from any part of the package or (since it is an ordinary
ASCII file) printed on a printer.
Another objective of the move to the sixteen-bit/DOS environment was the
opportunity to use graphics and colour. For a program which has important
mapping functions, this was an opportunity of major proportions. Thus, on a
system that has the appropriate hardware - a colour graphics adapter (or CGA)
and composite monochrome or colour RGB monitor - the mapping capabilities
of UDMS1.5 are far superior to those in earlier versions. Use of mediumresolution graphics gives 64,000 plotting points (320 by 200) instead of the 1,920
(80 by 24) points available to earlier versions of UDMS. This means that the
resolution of maps in UDMSIS is more than thirty times greater than that of
earlier versions. Similarly, medium resolution permits the use of four different
colours on a colour RGB monitor or four different shades of a single colour on
composite monochrome or LCDlgas-plasma monitors. All of these displays can
be further enhanced by creating "tiles" to add distinct patterns to the colours (or
shades).'' How faithfully all these screen enhancements can be transferred to
'OProcedures for creating "tiles" for the PAINT command are described in various BASIC reference
manuals.
Downloaded from www.timcart.com.
178
T.J. Cartwight et a1
Table 2. The structure a r ~ dsize of UDMSi5.2
ASCII
(bytes)
Code
(bytes)
Program name
Description
UDMS
Introduction to and one-time initialisation of the
package
14!464
12,779
UDMSl
File-creation routines for boundary map.
regions. variables. points. points weights, networks, network distances, shortest paths. node
weights, erc.: calculates geographical characteristics for regions and descriptive statistics of
variables
42.496
35,935
UDMS?
Identifies points in a file that lie either within a
circle of specified radius about a given point o r
within a specified region
16,523
Performs multiple regression and gravity-model
analyses of regional variables
29,183
Finds single o r multiple optimum location(s)
either in a plane or on a network
26,091
Produces eight different kinds of maps (including any combination of variable, points and
network overlays), with o r without grid lines and
regional identification numbers
25,088
Total UDMS program files
Average per program
153,846
131,736
25,641
21,956
Note: In addition to the six programs shown above; the complete UDMSIS package includes a number of text
files and some sample data files. The text files consist of a disk manual called UDMS.MAN (19,840 bytes), a
licence agreement (UDMSFORM.DOC), a short "read-me" file and (in Version 5.2 but not Version 5.3) a file
containing notes on converting UDMSil data files for use with UDMSI5 (UDMSFILE.DOC) and a sample
AUTOEXEC.BAT file.
hard copy depends, of course, on the capabilities of the printer; but the superior
capabilities of UDMSIS can be seen from a comparison of Figs 1 and 2 below."
Still another advantage of the sixteen-bit1DOS environment is that printouts in
UDMSIS can be based completely on the principle of WYSIWYG - or "What
You See Is What You Get". Earlier versions of UDMS relied on two other
approaches: occasionally, the program offered a choice between printing to
screen or printer; but in most cases, users were just advised that pressing
"Control-P" would result in the forthcoming screen display being echoed to the
printer. In UDMSI5, however. all results (whether text, maps or other kinds of
graphics) are displayed first on the screen and then optionally on the printer
(providing it is capable of printing "standard" IBM screen graphics using the
"As far as resolution is concerned, most dot-matrix printers nowadays actually give better than medium
resolution (or Mode 4 as IBM calls it). This has led to at least one ingenious proposal (in Pascal) to match
graphics displays o n the screen with "shadow" displays located somewhere outside the active video page and
plotted to a standard of resolution too high for display on the screen but appropriate for the pin-density of the
printer in use. Under this scheme. a screen-dump would appear to be coming from the screen but would in fact
be generated by the higher-resolution "shadow" screen. For further information. see: Chandler and Faulkner
(1986).
Downloaded from www.timcart.com.
Urban Data Manngement Software
LEGEND
WOULD YOU L I K E ANOTHER COPY?
N
Fig. 1. Unretouched map showing average incorne in three regions drawn using UDMSII. Source:
LIDlCIS, User's Manual, Version 1.03, p. 76. UDMSll was unable to rnap both variables and
networks (as shown in next figure).
DOS program GRAPHICS.COM).'~ The result is that all printouts can be
previewed on the screen and they all have a consistent format and size (25 lines
by 80 columns). Also UDMSIS automatically "stamps" each printout with the
current date and time read from the system clock.
Moreover, UDMS15 contains code that enables it to adjust to the parameters
of its host hardware.13 If there is a colour graphics adapter (CGA) in the system,
for example, UDMSIS detects it without asking the user and uses colour and
mediumlhigh-resolution graphics as and when they are appropriate. If not,
his method is possible thanks to Interrupt 5 in the ROM-BIOS of IBM and compatible microcomputers
(see Norton, 1985). The easiest way to take advantage of this service is to tell users to press SHIFT and the
"PrtSc" key whenever they want a printout. However, this has the disadvantage that everything on the screen
(including the instruction to use the "PrtSc" key itself) is included in the printout. There are several ways to
obtain the same effect under program control - which means that the program can ask whether a printout is
desired and then, if so, erase the query before proceeding with the screen dump. In compiled versions of
BASIC? you can just call the appropriate routine (e.g. CALL INTERRUPT 5 in Turbo-BASIC). In
interpreted versions of BASIC, things are a bit more complicated. According to several sources. the effect of
SHIFT-"PrtSC" can be obtained by storing the value -51973.8 to a single-precision variable (say X!) and then
using the command CALL VARPTR(X!). The effect apparently derives from the manner and location in
which BASIC stores this particular value. However, we were unable to make this routine work consistently in
UDMSI5. So we decided to rely instead on the following assembly-language routine derived from an example
given in the IBM BASIC Reference Manual (Appendix B, page B-9):
DIM PRT(3):FOR I= 1 TO 3:READ PRT(1):NEXTI
DATA &HCD55:&H5DOS,&H90CB
A = VARPTR(PRT(1)):CALL A
I3This approach is exemplified in Rosenblum and Jacobs, 1986. Note that UDMSI5 does not support the
Hercules monochrome standard (720 x 348 pixels).
Downloaded from www.timcart.com.
T.J. Carlwrighf et a1
T R D S RND POPULLTION
,
,.
..
..
,,
.
,
,.
..
,
.
..
.
...
,
ROLDS LND POPULLTION
U a r i a b l e L e g e n d : INCOME
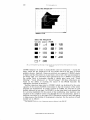
Fig. 2. Unretouched m a p showing average income and road n e f w o r k in fhree regions drabsn lcsing
UDIMS~S.
UDMSIS displays its results in monochrome and low resolution - except for
maps, which are not displayed at all on systems which do not have a colour
graphics adapter. Similarly, whenever printouts are requested, UDMSIS checks
to make sure that the printer is on and ready; only if not is the user prompted to
put things right. In a somewhat more light-hearted vein, UDMSI.5 even checks
the system clock to determine whether it should greet users with "Good
Morning", "Good Afternoon" or "Good Evening"! All these refinements are
based on the ability to examine (by means of the PEEK function) the
appropriate locations in memory. l4
Another important innovation in UDMSI.5 which was facilitated by the extra
capacity of the sixteen-bitlDOS environment is that the structure of the entire
program was standardised. In earlier versions of UDMS, the structure of each
module followed its own logic. In UDMSIS, on the other hand, each module has
five sections identifiable by the system of line numbering. Line numbers were
retained in the compiled version even though they are not necessary, partly to
facilitate conversion (e.g. the same G O T 0 references could be used) and partly
to help preserve the identity of the program's structure. the five sections of each
module are as follows:
14See Schneider (1985) for a list of important memory addresses in the IBM PC.
Downloaded from www.timcart.com.
Urbati Data ~MarzagemerltSoftware
181
Lines 1-99 contain a summary of what the program does and what data
files it needs (input) and creates (output).
Lines 100-999 contain global initialisation statements and sub-routines;
these lines appear in each of the modules in the interpreted version (5.2) but
only once in the compiled version (5.3). Their contents include code for:
displaying and selecting options from the main menu; clearing the screen and
formatting displays; dumping the contents of the screen to the printer; setting
the default disk drive and filename for data files: and accessing the various
pages of the disk manual. The adherence of all modules to these common
routines as well as the improved structure of the whole program obviate the
need to define and pass any COMMON variables from one program to
another - as had been required in UDMSI1. This was a real advantage when
it came to compiling the programs. Since compilers of interpreted BASIC do
not all treat the COMMON command and its parameters in the same way. it
is better to do without that command whenever possible.
Lines 1000-1999 (prefixed by a digit from 1 to 5 in the compiled version to
represent each of the five modules) contain the main menu(s) for each
module. the corresponding assignment statements (ON . . . G O T 0 . . .),
and local subroutines that are common to several parts of the module.
The major substantive sections of each module begin at lines 2000, 3000,
4000. etc. (suitably prefixed by a digit from 1 to 5 for each module).
Finally, lines 9000 to 9999 (also with a suitable prefix for each module)
contain error traps and error routines.
A consistent structure for every module in the program helped make
programming and ',debugging" much easier. A consistent structure should also
help make the program easier for users to understand and (if they so desire) to
customise.
In short, developments in technology have affected the structure and
functioning of UDMS in at least four important ways: from a programming point
of view - (1) a tighter integration of all the various parts of the package and (2) a
closer fit between the software and the capabilities of the hardware; and, from a
user's point of view, (3) the addition of new features and capabilities and (4) the
provision of a more user-friendly interface.
The result is that UDMS has successfully evolved into a smoother and more
sophisticated package. Yet it is still capable of running on a minimum computer
system.
UDMS DATA FILE STRUCTURE
UDMSIS uses up to 15 different types of datafiles (compared to 20 in earlier
versions). The files are all standard "flat" ASCII files, with individual data items
delimited by commas (or spaces) and carriage returns. Datafiles pertain to one of
four basic geographic entities: (1) boundaries (of the map and its regions); (2)
regions (variables and interactions); (3) points (including optionally their
relative "weights9'); and (4) networks (including nodes, links, distances and
"weights").
Table 3 provides a detailed description of the file structure of UDMSI5 in
comparison with earlier versions."
" ~ nfact. there is one other datafile necessitated by the peculiarities of the BASIC PAINT command which is
used to shade map regions to show regional variables. Essentially the PAINT command starts from a given
point and colours the adjacent points until it meets the region boundaries. Thus, to PAINT a region, you must
have a point located within that region: a point on the b o ~ n d a r yor outside the region will not do. For "convex"
regions, the centroid can serve as the starting point; however, in (say) a crescent-shaped region, the centroid
may lie outside the region. UDMS'j therefore requires a special "points" file (called *.PNT) consisting of one
point for each region thai is known to be physically inside that region.
Downloaded from www.timcart.com.
T.J. Cartwright et al.
Table 3. The datafile structure of UDMSIj
Filename
Description of datafile structure
Initial "raw" map datafile created outside UDMS using any appropriate data-entry program
or device; consists of two data elements for each point on the boundary of the map: its X-coordinate and its Y-co-ordinate. (This file has no counterpart in earlier versions of UDMS)
Map co-ordinates file; consists of *.DAT with point-identification numbers and file "header"
and "footer" added by UDMS
Regional co-ordinates file; consists of sequence of points that define each region
Regional variables file; consists of variable names followed by corresponding variable values
by regions
Points co-ordinates file, where "n" is any legal character except "C" (which is reserved for the
regional centroids); consists of co-ordinates of any user-defined set of points. (These files
were called *.PTS and '.CNT respectively in earlier versions of UDMS)
"Paint" co-ordinates file; consists of co-ordinates of points, one for each region, that are
physically located inside a region. (This file was called *CNT.PTS in some earlier versions of
UDMS)
Points weights file, where "n" is the last character of an associated points file; consists of a set
of weights corresponding to each of the points in the associated points file. (This file was
called *.PWF in earlier versions of UDMS)
Interaction-between-centroids file, where "n" is any legal character; consists of any userdefined set of interactions or flows between regional centroids. (This file was called *.ITR in
earlier versions of UDMS)
Network nodes co-ordinates file, where "n" is any legal character; consists of the co-ordinates
of any user-defined set of network nodes. (This file was called *.NOD in earlier versions of
UDMS)
Links definition file, where " ~ n "is any legal character and "n" is the last character of an
associated network nodes file; consists of identification of the beginning node, end node and
direction of each link between the associated network nodes. (This file was called *.LNK in
earlier versions of UDMS)
Network distance file, where "nm" are the last two characters of an associated link definition
file; consists of the beginning node. end node and distance between them for each link in the
associated link file. (This file was called *.DST in earlier versions of UDMS)
'.Xnm
Network distance matrix file: where "nm" are the last two characters of associated link
definition and network distance files; consists of a matrix of the shortest-path distances
between each and every node in the associated network. (This file was called *.DMX in
earlier versions of UDMS)
*. WNn
Nodes weights file, where "n" is the last character of an associated network node definition
file; consists of a set of weights corresponding to each of the nodes in the associated network
file. (This file had no counterpart in earlier versions of UDMS)
Note. The file structure of earlier versions of UDMS was complicated by two factors. First, the use of
filename extensions was in most cases too rigid to permit more than one file of each type; consequently, the
filename itself had to be varied even for files pertaining to the same basic map. In UDMSA; all filenames
pertaining to the same map can have the same filename; only the extension is varied. Second, earlier versions
of UDMS used seven more types of datafiles which are no longer necessary in UDMSI.5. These are: '.LST (a
modified version of *.REG), *.XYA (containing area data), *ROP.VAR (containing data for the gravity
model), *CTR.PTS and *.CTRM.PTS (containing data for optimum location analysis), *.NCF (containing
data on node constraints for optimum location in a network)? *.NSF (containing data on a subset of an existing
network) and ".RGR (containing data for regression analysis). For more details, see the file UDMSFILE.
DOC on the distribution disk version 5.2 only.
UDMS datafiles generally consist of three distinct parts. There is usually a
"header" containing one or two file parameters (such as the number of data
elements) which are used to facilitate reading the file. Of course, datafiles can be
read without this information (e.g by using WHILE NOT EOF . . . WEND),
but it is generally preferable to use a fixed-length loop. Moreover, in cases where
UDMS needs only the total number of data elements and not their details,
Downloaded from www.timcart.com.
Urban Data Management Softwczre
183
having the information at the top of the file obviates the need to read the entire
file.
The main part of a datafile consists of the data themselves. Some of the
datafiles include a sequential identification number for each data element.
Although this number is not used outside the file itself, it has been retained
partly to preserve continuity with earlier versions of UDMS and partly because
having the numbers facilitates inspection and editing of the file. Earlier versions
of UDMS made two other stipulations regarding data-entry that have now been
dropped. In some cases, data had to be entered starting at a particular maximum
value and/or proceeding in counter-clockwise order. Now UDMSI.5 requires
only that data be entered in sequence. Second, earlier versions required that
some sequences of data elements be "closed" by means of repeating the first data
element. UDMSIS provides its own "closing" by means of software.
The third part of a UDMS datafile is a "footer" containing details of the grid
scale used in the map (e.g. 1:.5,000) and the scale units themselves (e.g.
kilometres or miles). This "footer" is added only to some of the files but could
easily be added to others as required.
Earlier versions of UDMS also required that some of the datafiles (notably the
*.COO and *.REG files) contain data pertaining to a so-called "false region".
The "false region7' was the region formed by the outer boundary of the map and
a rectangle drawn around it scaled to suit output to a simple line printer. Now
that all printer output is based on screen dumps and dot-matrix printers, the
"false region" is no longer required. The "false region" was also used in one or
two other routines (e.g. in one of the spatial-search routines); but these
algorithms have also been changed. Consequently, none of the datafiles now
contains any references to a "false region7'.
In earlier versions of UDMS, datafile preparation was done largely outside the
UDMS environment. Of the 20 different datafiles used by the program. eleven
of them had to be created by the user using a text-editor or word-processing
program. This meant that the user had to come to terms with the structure of
each of these files. Accordingly, the original User's Manual contained detailed
instructions on the use of E D (the text editor ty ically associated with CP/M)
and on the structure of the datafiles themselves.
This approach clearly had some desirable effects. It contributed to - indeed,
demanded - a deeper understanding on the part of users as to how UDMS
actually worked. Any user who created the input files would know exactly what
data were being used for what purposes and would therefore be better able to
appreciate the meaning and reliability of the results derived from those data.
Similarly, an intimate knowledge of the structure of the datafiles means that a
user can more easily make minor repairs in or additions to the datafiles.
However, creating datafiles outside CTDMS, where there is virtually no
effective error-trapping, led in practice to extensive problems and delays,
particularly when it came to training beginners in the use of UDMS. Even with
the detailed examples in the User's Manual, it sometimes took literally days
during training workshops for trainees to prepare, enter and test their datafiles
- before they ever got to use UDMS itself. Even with more flexible and userfriendly interfaces than E D (such as Wordstar or Supercalc), errors were still
frequent. Moreover, errors in creating datafiles really have little to do with
UDMS; so they have little didactic value. Worse still, the effect of such problems
is particularly debilitating when one of the purposes is to demonstrate how
microcomputers can make planning easier and more fun!
The solution adopted in UDMSI.5 is something of a hybrid. It was arrived at
partly as a natural evolution from the earlier approach and partly to facilitate
It
16See Section 4 and Appendix I respectively in the User's Manual (1983)
Downloaded from www.timcart.com.
184
T.J. Cartwriphr et al.
automated data-entry (e.g. by digitiser) and incorporation into UDMS of prerecorded maps from other sources.17
In UDMSI5, the basic map file (*.DAT) is still created outside the program
environment, as it was in UDMSI1, using any word processing program or
spreadsheet capable of producing a plain ASCII file. But in UDMSI5, all other
datafiles can be created within the CTDMS environment. Most of these datafiles
can also be created and edited outside UDMS, if that is desired, since all are
plain ASCII files. The only file which must be created within UDMS is the
network file (*.NWn), because UDMS simultaneously creates several other files
required for analysing the network.
To make the * .DAT file as simple and uncomplicated as possible, it consists of
nothing more than a sequence of two data elements for each point on the
boundary of the map: namely, its X-co-ordinate, and its Y-co-ordinate. No other
data are required in the *.DAT file. All the other data required by UDMS (the
file "header7' and "footer" and sequential point-identification numbers) are
added by UDMS when it "converts" the *.DAT file to a corresponding *.COO
file. The latter then becomes the basic map file for the rest of the program; the
former has no further purpose in UDMS and can be erased if desired.
All other datafiles can be created and, when appropriate, edited from within
UDMS. In each case, the process is closely prompted and "error-trapped" by
UDMS, in order to guard as much as possible against mistakes and omissions in
data-entry. Preliminary experience with this approach in workshop settings has
shown a dramatic reduction in the amount of time required by trainees to create
data files.18
The socio-technical impact of microcomputer development and use has once
again been such as to lead to more integration and standardisation in the
structure of UDMS. This in turn helps make its user interface easier to
understand and smoother to operate. The next section of this paper examines
how improvements in the program and data structure of the program have led to
enhanced performance.
THE MAIN FUNCTIONS OF UDMS
UDMS performs four basic functions. These are: (1) spatial search; (2) linear
regression and gravity model; (3) optimum location and shortest path; and (4)
mapping.
In each case, UDMS15 provides improvements in algorithms and displays
compared to those available in earlier versions.
Spatial search
Ironically, the apparently simple task of determining if a given point is located
within a given area turns out to be a very difficult problem. In some cases, of
course, the answer is obvious; but it is difficult to find an algorithm that works
with polygons of any conceivable shape and orientation relative to the given
point.
Searching for a point in a rectangle is a trivial problem. It is necessary only to
determine whether each of the co-ordinates of the point lies between the
respective maximum and minimum values for the rectangle (i. e. its lower left and
upper right corners). A point either of whose co-ordinates exactly equalled the
corresponding maximum or minimum value would, of course, lie on the
boundary of the rectangle.
--
"See Dykstra (1986) and Wiggins (1986)
''See AITIHSDD (1986).
Downloaded from www.timcart.com.
It is also easy enough to determine whether a point lies within a circle of given
radius about a given sectre. If the distance of the point from the centre of the
circle (easily determined by the Pythagorean theorem) is less than the radius,
then the point lies within the circle. Again, a point whose distance from the
centre exactly equalied the radius would lie on the circumference of the circle. It
is also quite straightforward to allow for a search of more than one circle at once,
even if the circles over!ap. For example, you can use the same algorithm to
search for points within a set of linked nodes and their respective areas of
influence.
But it is quite another matter to provide a simple algorithm for searching for
points in a polygon of indeterminate shape. Historically, UDMS has confined
itself to searching for points within one of the map regions rather than any userdefined polygon. Pievertheless, map regions can assume any shape at all; so the
algorithm in the program has to be capable of dealing with any kind of polygon.
The general principle of searching for a point in a polygon is to project a
straight line from the point to either the X-axis or the Y-axis and count the
number of times that line intersects the boundary of the area to be searched.19 If
the line intersects the boundary an odd number of times, the point is presumed
to lie within the search area; if the line intersects the boundary an even number
of times, the point is presumed to lie outside the search area. However, this
algorithm works only if it is supported by a series of tests to detect and allow for a
number of special cases: where the point is at a vertex or on the boundary of the
search area; or where the line projected from the point passes through a vertex
or runs along the boundary of the search area from both inside and outside the
search area. Clearly these tests complicate an otherwise elegant algorithm!
This basic algorithm has been used in all versions of UDMS. However, prior to
version 5 . [!DM§ made no allowance for the possibility of special cases like
those described above. Consequently, results were sometimes wrong. In
UDMSIS, routines were added to test,and, if necessary, correct for each of the
special cases. At the same time. other improvements were made to make this
module of the program more user friendly by providing for: (1) more
standardised prompts and displays and (2) faster repeat testing for the location of
a given point.
Mu/riple-vegressior! cizd gravity model
From the programming point of view. the chief source of difficulty underlying
this part of the program is the very wide range of values that the results can take.
In the end, UDMSl5 refiects the same compromise as earlier versions of the
program: results are displayed in exponential notation. Essentially, this means
sacrificing readability in exchange for the flexibility of being abie to get all the
results on a single screen. This makes it easier to absorb and compare the results.
In the case of graphical displays. the chief question was whether to use lowresolution graphics or "text" mode (to make the results available on microcomputers mithout a colour graphics adapter) or high-resolution graphics. In the
end, to make the package as widely accessible as possible, both capabilities are
provided. UDhZSl5 is equipped to determine whether its host system is capable
of high-resolution. If it is, then the program plots in high resolution; if not, the
program plots iil low resolution.
"The only other approach a.e considered u a s to use the principle of the BASIC PAINT command discussed
above. This could be done either by simulaiing the operation of ihe command or by actually drawing a map in
memory ( e . 8 . using an inactil r "page" of video RAM) and PAINTing from the point. If the colour of the point
matched the colour of the region to be searched (again using the special regional PAINT points discussed
previously), then the point must lie in the region: if not. the point must lie outside the region. In the end. this
method was not used.
Downloaded from www.timcart.com.
186
T.J. Cartwright et al.
In the regression part of the program, the major change has been to replace
the bi-variate model used in earlier versions of UDMS with a multi-variate
model in UDMSI.5. One of the major constraints in this part of the program was
the need to present compact screen displays suitable for dumping to a printer.
Earlier versions of UDMS had printed their results with scant regard for linespacing or page layout. With UDMSI.5, however, the idea was to write so far as
possible for a 24-line "page" and to keep the number of display "pages" to a
minimum. For this reason the maximum number of independent variables was
set at four. While this was done to facilitate screen writing and not for any
technical reason, it was nonetheless felt that most users would not encounter
many situations where they would need to examine more than four independent
variables.
In the gravity-model part of the program, the algorithm from UDMSI1 was
adopted almost intact in UDMSIS. In this approach, UDMS assumes a simple
form of the gravity model in which interactions or flows between centres are a
function of some characteristic of those centres and their distances from each
other. Using a special user-defined interaction matrix file (*.ICn) as well as
variable data from the variables file (".VAR), UDMS transforms the gravity
model into a linear equation in two unknowns. Then, using the regression model
in the first part of the program, UDMS can estimate the parameters of the
regression line using either distance or the selected characteristic as the
independent variable. This is a somewhat unorthodox approach to gravit
modelling and may well be a candidate for more thorough revision in UDMS16."
Another limitation in the gravity model that persists from UDMSll is the fact
that it provides only for interactions between regions. For one thing, the only
variable data that can be accommodated in UDMS are regional; variables cannot
be associated with points in a points file, for example. Similarly, data on
interactions or flows (in the *.ICn file) are associated with regional centroids
(the *.PTC file) but not with any other points. Thus, the gravity model is
effectively limited to analysing interactions between regions and these interactions are assumed to be concentrated at their respective centroids. It is to be
hoped that here too UDMS can be made more flexible and more sophisticated in
its next ~ e r s i o n . ~ '
Optimum location
UDMSI1 provided for finding optimum locations either in a plane or on a
network, and both of these options are preserved in UDMSIS. However, the
algorithms used and their presentation to the user have been significantly
improved in UDMSI.5.
UDMS1.5 finds the optimum location or locations on a plane relative to the
aggregate distance from a set of points stored in a points datafile (*.PTn). If
desired, the points can be "weighted" using values which have been stored in a
points weights datafile (*WPn). The algorithm requires the user to provide a
"first approximation" to the solution, even if it is only a guess. Then what the
program in fact does is to examine all possible improvements on that guess and
choose the best one.
In the case of single-optimum problems, this amounts to finding the optimum
location. But in the case of multiple optima, there is no guarantee that the best
possible improvement on a first approximation is in fact an overall optimum. In
"Compare Ottensman (1985). chapters 7 and 8.
"In fact. there is already a mechanism in UDMSi5 for relating variables to points and nodes: namely. the
weighting procedures. Although these files (".WPn and *.WNn) have only limited use in connection with
optimum locations. they are in principle variable files. and could (with a little modification to the program) be
used for gravity modelling.
Downloaded from www.timcart.com.
Urban Data Management Software
187
fact, in a two-optima case, if you give UDMS two "first approximations" of
which one is completely outside the set of points and the other is inside, the
algorithm will devote itself exclusively to optimising the location of the "better"
guess. Thus, in multiple-optima problems, it is desirable for users to do several
"runs" of the program using different "first approximations" until satisfied that
they are at least close to the overall optimum 10cations.~~
In both cases, UDMSIS finds the optimum location by using an iterative
process. That is, the program keeps looking for a better solution until the
resulting reduction in the aggregate distance from the location(s) to all the points
reaches a certain minimum. This minimum relative change in distance (called the
"convergence7') is set to a default value of one one-thousandth of a percent
(0.00001) but this can be redefined by the user. Naturally, a smaller convergence
results in a more accurate solution; however, more iterations are required and so
computation inevitably takes longer.
A somewhat similar approach is used in finding the optimum location in a
network, but users are here faced with a different kind of problem. Because of
the limits imposed by the structure of the network, we can be confident that the
optimum location found by the program is indeed optimum - but only if there is
an optimum location at all! The cause of this kind of problem is what is called
"directional connectivity".
Every network has to be physically connected in the sense that every node has
to be linked directly or indirectly to every other node. (In fact, network-creation
routines built into UDMSIS do not permit the creation of networks that are
physically unconnected.) However, when a network is created, one of the parameters of each link is its direction. Thus, some links in a network may be unidirectional and not permit movement in both directions. In other words,
although every node in a network must be physically connected to every other
node, movement may not actually be possible from every node to every other
node. Thus, physical connectivity may not always mean directional conne~tivity.~~
Where there is not universal directional connectivity within a network, the
concept of optimum location becomes problematical: can any location on a
network be said to be optimum if it is not accessible to all nodes? Certainly any
calculation of total or mean distances to an optimum location when some of the
distances are effectively infinite is going to be misleading. Unlike earlier
versions, UDMSIS recognises all these difficulties and (if they arise) reports
them to the user.
Here again UDMSIS presents a smoother and more professional face to the
user. Thanks primarily to refinement of suitable microcomputer-based algorithms, UDMSIS is both better and easier to use than earlier versions.
Mapping
Perhaps the most dramatic change in UDMSIS relative to earlier versions is in
terms of its maps -just as the biggest qualitative change in the new 16-bit/DOS
environment relative to its predecessor was in its video graphics and colour
capabilities. Earlier versions of UDMS could provide two different kinds of
maps - a boundary map and a thematic map showing regional variables -with
the option of point and/or network overlays on the boundary map. In UDMSIS,
"This situation is analogous to one of the hoariest problems in operations research, in which the object is to
find the route of least distance for a salesman to travel to every one of a number of cities. As the number of
cities increases. calculation of the distances along all possible routes becomes prohibitively time-consuming?
even with a computer. So more heuristic algorithms have to be found, with all the uncertainty that this entails.
2 3 ~ h i may
s
seem counter-intuitive until you realise that, in gravity-fed hydraulic systems: for example, a
network may be entirely inter-connected in a physical sense; yet water will not flow uphill from lower nodes in
the network to higher ones.
Downloaded from www.timcart.com.
eight possible maps can be produced based on any combination of variable, point
and network overlays. These maps can be drawn with or without regional
boundaries, with or without grid reference lines, and with or without
identification numbers for regions and (in Version 5.3) points.24
Second, all maps make use of colour and (where appropriate) colour tiling.
Variable overlays can display up to nine different classes or categories of data.
Points and networks also make use of different colours andlor different symbols
(dots, squares, crosses, etc.).
Third, all maps can be moved about on the screen and magnified or reduced to
scale. With two key strokes, any map can be "panned" up, down, left or right by
varying amounts. Similarly, any map can be "zoomed" closer or farther away by
varying amounts. Together these two capabilities allow :he user to focus in on
any desired part of a map. There is also a "restore" command that produces an
instant re-drawing of the original map. Map legends appear on subsequent
screens and users can cycle back to the map after seeing the legends, with the
option of adding or deleting region numbers and grid reference lines.
The "pan" and "zoom" features are possible because of the addition of two
important commands to BASIC in the 16-bitlDOS environment: namely, VIEW
and WINDOW. (These commands depend in turn on services 6 and 7 of
Interrupt 16 in the ROM-BIOS, for which there was no equivalent in the eightbitlCP-M environment.) Essentially, VIEW sets the size of the screen or
"viewport", to be used for the display; the default setting is the entire screen.
WINDOW, on the other hand. determines the scale to be used for the display;
the default condition is that the window co-ordinates (or "world co-ordinates",
as Microsoft and IBM prefer to call them) exactly match the physical screen coordinates." The combined effect of these commands is to allow the programmer
to define a VIEW inside the border of the map and, by changing the co-ordinates
of the WINDOW mapped into that VIEW. appear to be moving the map around
in the VIEW or to be enlarging or reducing it. There is no limit to how far a map
can be "panned" and "zoomed" beyond the practical one that all trace of the
map will eventually disappear from the screen if it is moved either too "close" or
too "far away".
The combination of VIEW and WINDOW works very well and effectively,
but it did lead to several other technical difficulties. Of course, the program had
to arrange to "store" the initial WINDOW co-ordinates; so that the original
map could be restored at any time. Second, it was necessary to decide whether
'Tabelling regions and points on a graphics screen is in fact quite difficult to do. If you PRINT a character to
the screen in medium-resolution graphics mode. it appears twice the size of characters in text-mode (doublewidth). This is suitable for labelling regions (of which there might be a dozen or s o ) hut becomes unreadable
when there are a hundred or more points on the screen. Accordingly. points are labe!led by means of a special
routine (adapted from Parsly. 1986) that reads the dot-pattern for each character from the table in R O M
(starting at location F000:FA6E) and prints a half-sire version. Ho~vever.even for the regions with their fullsize labels, there are still difficulties. T o start with. there has to be a point in each region at which to locate :he
label. Once again. the regional centroids will not d o because centroids are not necessaiily inside a region: so we
had to use the special PAINT points discussed above (see Footnote 15). Second. you cannot PRINT a character
on the screen at a location defined in terms o i pixels (or "pels". to use the IBM term). which is hov a!l map
locations are defined when using VIEW and WINDOW. T o use the PRINT command. the on!!. thing you can
do to get the cursor where you want il is to use the L O C A T E command. So what we had 10 do was get the
location of the point at which to PRINT the region number. scale it according to the current VIEW and
WINDOW settings, convert it to row and column poisitions. LOCATE the cursor there. and then PRINT the
region number. Proving once again that it is just as \yell that computers are so fast: they can manage to so
complicate even the simplest of tasks that. were it not for their speed, \ve would never dream of using them for
anything!
"VIEW and WINDOW are easily confused; indeed. the terms might better have been interchanged. 30 it
may help to think of VIEW as being like the size of a porthole you are peering through and WINDOW as being
the property of the glass in the porthole that either magnifies or reduces the image of what you see. Note that
you should always use VIEW in conjunction with WINDOW if you plan to PAIYT parts of the map. For
without the boundaries of a VIEW. you run the risk of PAINT "leaking" out around the edges of the map if
you have any gaps between the map aiid any map border or title that you n a y be using.
Downloaded from www.timcart.com.
Llrbarl Dafa ~MarlagetnentSoftware
189
a user would feel more comfortable "panning" literally or intuitively; in the first
case, panning to the left would move the map to the right, whereas intuitively a
user might expect the opposite. (In the end, UDMS adopted the intuitive rather
than the literal approach!) Third, grid reference lines had to "pan" and "zoom"
in step with the map itself.
Eventually all these problems were solved and UDMS/5 now provides
mapping capabilities superior to those of any of the earlier versions. Few of these
improvements could have occurred without the improved technology provided
by the new 16-bitIDOS environment. Similarly, the more professional quality of
the results in this and other mapping programs is persuading more and more
planners to make use of them. Thus, the last part of this paper looks in more
detail at just how a package like UDMS can be expected to affect planning and
the way planners do their work.
UDMS AND PLANNING
The thesis of this paper has been that the growth and development of UDMS
over the last 8 years reflects both the technological development of microcomputers and the sociological response of the planning profession to the
opportunities that presents. Of course, computers have been used in planning for
decades. But what microcomputers have done - and done in a dramatic way is to increase the scope of those uses and the number of planners who have access
to them. The result is that developments in microcomputer hardware and
software have both fuelled and been fuelled by developments in planning itself.
This same symbiosis can be seen in other professions besides planning, of course,
and in some of these (business and finance, for example), the rate of
development has been even more remarkable. But the impact of microcomputers on planning is none the less important for that, and already some of its
impacts are clearly visible.
One of the most obvious features of UDMS is that it produces maps. Maps
have traditionally played a very important role in planning, especially physical
planning. However, a map is only one way of displaying data, albeit a
particularly useful way of displaying data that have a spatial basis. Nevertheless,
it is important to remember that a map is only a representation of certain
underlying data and that a map may reflect numerous approximations,
interpolations and guesses. However. because paper maps are relatively
inflexible and labour-intensive artifacts, there is a tendency for maps to take on a
reality of their own. As a result, planning sometimes is done "on" and "with"
maps rather than with the underlying reality represented by those maps.
The widespread accessibility of microcomputers and programs similar to
UDMS can help prevent this distortion. The effect will not be to diminish the
importance of maps in planning but it should change the role they play. Because
computers can make mapping so much more flexible and so much less labourintensive, they allow and even encourage planners to work more directly with
the data forming the basis of the maps. The result is that maps should assume a
more illustrative and less substantive position in planning than the one they
sometimes seem to occupy. Similarly some of the traditional emphasis in
planning education given to cartographic techniques can be expected to give way
to training in more general analytical techniques.26 These tendencies are
reflected in two important enhancements to UDMS15 compared to earlier
versions:
First of all, the mapping in UDMSIS is superior to that of earlier versions. The
26See Cartwright (1979)
Downloaded from www.timcart.com.
190
T.J . Cartwrighr et a1
use of colour as well as the "pan" and "zoom7' facilities make for more useful
and flexible maps.
Second, throughout the program, UDMSIS is designed to cater to less
expert but more demanding users than were earlier versions of UDMS.
Thus, for example, users are advised of the capacities and limitations of each
program. Unusual or heuristic algorithms are explained on the screen so that
users can assess their suitability for the specific applications intended. Results
are carefully summarised and annotated so that hard copy output always
provides a full and complete record. In short, UDMS1.5 has evolved into what is
(at least from the planning point of view) a more and more sophisticated
program in which mapping and quantitative techniques reinforce rather than
compete with each other.
Another significant impact of the microcomputer which is reflected in the
evolution of UDMS has to do with the demand for training that it has provoked.
It is tempting to see this demand primarily in terms of computer skills, but that
can be quite misleading. Of course, there are many planners who still need to
learn more about how to use computers as such. But it is just as important for
planners to learn (or re-learn) the kind of techniques that computers can
facilitate -because, without the help of computers, few planners will have been
using such techniques. For example, many planners learned about regression
techniques when they were at school; yet how many remember how and when to
use such techiques years later? The reason is clear enough: without a computer,
the calculations involved in regressions are very tedious; so planners naturally
tend not to use regressions. With a computer, on the other hand, regressions are
very easy to do; so their use in planning, even on a day-to-day basis, becomes
correspondingly more feasible.
The result is that microcomputers have created a demand for training not just
in computers but also in the kind of planning techniques whose use is made more
practicable by access to a computer. In other words, the training needs created
by microcomputers are not primarily computer training needs: they are planning
training needs. In a sense, what the microcomputer revolution reveals is not just
that planners are not as computer literate as they should be but also that they
may not know as much about some aspects of planning as they should either!
Perhaps this is why computers are sometimes perceived as a threat. Perhaps too
this is why a computer "expert" is not always the best person to provide the kind
of training that planners really need.
Thus. UDMS1.5 is pre-eminently a program for ordinary planners using
ordinary microcomputers. It does not require but will take advantage of colour
and graphics; digitiser and plotter routines are not provided but can easily be
added. UDMS1.5 is written in a language (BASIC) and a programming style
deliberately chosen to make the package accessible to naive users and even
novice programmers who want to customise or enhance its various modules and
routines.
Furthermore, in every part of UDMS1.5, the programs deal with the user in an
open and friendly manner, carefully explaining and prompting at every step. In
this way, the user is encouraged to understand exactly what the computer is
doing, so as to be better able to evaluate the answer that the computer provides.
Thus, while UDMS1.5 tries to hide as much of its computer +'facenfrom the user
as possible, it tries to do the opposite with its planning "face". No one can learn
to use UDMSIS without learning something about planning as well.
A third significant way in which UDMS1.5 reflects the changing role of
microcomputers is in terms of accessibility. If there is one major lesson to be
derived from the experience of most organisations in implementing microcomputers, it is that "If you don't have it, you won't use it!" Learning to use a
Downloaded from www.timcart.com.
Urban Data Management Software
191
microcomputer takes skill, but it is a purely functional kind of skill. It has little
aesthetic or scientific value. Memorising the commands of Wordstar, for
example, is about as valuable as memorising telephone numbers. If you use them
every day, learning them is easy and useful. If not - or even if you cannot use
them regularly once you have learned them - these kinds of skills are hard to
acquire and retain. Moreover, there is relatively little incentive to try. In the
same way, manufacturers of software have discovered that copy protection, no
matter how ingenious and transparent they have been able to make it, does not
pay. Anything that come between users and accessibility detracts from the value
of hardware and software.
So here too UDMSIS exhibits a different philosophy from that of earlier
versions. UNCHS (Habitat) now actively encourages distribution of and access
to its software. The Licence Agreement is less restrictive and users are
encouraged (subject to very minimal restrictions) to provide copies of the
package to other interested parties inside and outside their own organisation. In
fact, to make distribution as easy as possible, the entire UDMSIS package
(including disk manual, Licence Agreement and preliminary startup instructions) is included on the distribution disk.
In retrospect, UDMS has evolved in response to its environment. Originally
conceived primarily as a demonstration and training package,27 UDMS has in
fact evolved into a practical tool as well. UDMS began life in a laboratory1
workshop context, where computers have traditionally been used. Later, when
the ordinary-planner-as-user began to emerge, UDMS found itself "installed" in
various operational settings. This imposed new demands on the package, which
led to its eventual rewriting as UDMSIS. In this way, UDMS reflected the
broader trends of the microcomputer "revolution". Eight years ago, while some
people were convinced that microcomputers would be important in planning,
few people had a clear idea of exactly what that would mean. Now there are
established areas of microcomputer use in planning and experienced (if still nonspecialist) users to respond to. UDMS, like other software, is now looking for a
niche in an increasingly competitive market-place in both industrialised and
developing countries. Microcomputers are challenging the way planners use
data, the way planning education is provided, and the way planning resources
are distributed. In each of these respects, UDMSIS provides a small but
instructive illustration of how the planning profession has responded to the
microcomputer revolution.
BIBLIOGRAPHY
American Farmland Trust, Survey of Geographic Information Systems for Natural Resources Decision Making
at the Local Level. Washington: mimeo: August 1985.
Asian Institute of Technology. Human Settlements Development Division (AITIHSDD). "Report on the Joint
Workshop on Microcomputer Applications to Human Settlements Planning and Management Held at AIT.
Bangkok (Thailand) 18-29 August 1986", Kammeier, H.D. et al. (Editors), Bangkok: mimeo, September
1986.
Baxter. R.S., Computer and Statistical Techniques for Planners. Methuen. London, 1976.
Cartwright, T.J., "Information Systems for Planning in Developing Countries: Some Lessons from the
Experience of the United Nations Centre for Human Settlements", Habitat Intl 11(1), 1987.
Cartwright. T.J.. "Microcomputers as Appropriate Technology for Human Settlements Planning", Habitat
News, 1985.
Cartwright, T . J . , "Planning the Education of Planners", Contact 11(2), 45-50, 1979.
Cartwright, T.J.: "Systems Theory and Social Organization: a Special Case of the General Theory", in
Progress in Cybernetics and Systems Research, Trappl, R. and Pask, G. (Editors), pp. 153-160. Hemisphere.
Washington, 1978.
"See Robinson and Coiner (1981). pp. 1-2. reprinted as Annex I11 in UNCHS. Instructor's Manual (1983).
H A B 12:4-M
Downloaded from www.timcart.com.
192
T.J. Cartwright et al.
Chandler, R . and Faulkner, G., "A Virtual Graphics Screen", PC Tech. Journal, pp. 134-185. September
1986.
Dykstra, D . , "Mapping Strategies". PC World, pp. 260-271, October 1986.
International Business Machines (IBM), B A S I C Version 3.10. Personal Computer Hardware Reference
Library. No date.
International Business Machines (IBM). The Guide to Software for Developing Countries. First edition by
Coiner, J.C. et al. IBM, Paris, September 1985.
Kammeier. H.D.; "Microcomputer-Based Assessment of the Accessibility of Central Place Services". The
Asian Geographer, September 1986.
Krueckeberg, D.A. and Silvers, A.L.. Urban Planning Analysis: Methods and Models. John Wiley, New York,
1974.
Landis, J.D., "Electronic Spreadsheets in Planning: the Case of Shiftshare Analysis". A P A Journal 51(2).
216-224, Spring 1985.
Levine, N.. "The Construction of a Population Analysis Program Using a Microcomputer Spreadsheet", A P A
Journal, 51(4). 496-511, Autumn 1985.
"Microcomputer Software Packages Produced by the Organizations of the United Nations System".
Supplement to A C C I S Newsletter, 4(3). September 1986.
Minieka, E . , Optimization Algorithms for Networks and Graphs. Marcel Dekker. New York, 1978.
Morgan, C.L. and Waite, M.. 808618088 16-BitMicroprocessor Primer. BYTEiMcGraw-Hill, Peterborough,
1982.
Norton, P., Inside the IBM Personal Computer. Revised and enlarged edition. Brady, New York, 1986.
Norton. P., Programmer's Guide to the I B M PC. Microsoft, Bellevue. 1985.
Oppenheim. N.. Applied Models in Urban and Regional Analysis. Prentice-Hall, Englewood Cliffs, 1980.
Osborne, A , . Eubanks. G . , J r and McNiff: M.. C B A S I C User Guide. OsborneiMcGraw-Hill. Berkeley, 1981.
Ottensmann. J . R . . B A S I C Microcomputer Programsfor Urban Analysis and Planning. Chapman & Hall: New
York. 1985.
Ottensmann, J.. "Microcomputers in Applied Settings: the Example of Urban Planning", Sociological Methods
in Research 9, 493-501, 1983.
Ottensmann, J.. Using Personal Computers in Public Agencies. John Wiley, New York, 1985.
Parsly, J . , "Using ROM Characters". PC Tech. Journal p. 47, August 1986.
Robinson, V.B. and Coiner. J.C.. "Characteristics and Diffusion of a Microcomputer Geoprocessing System:
the Urban Data Management Software (UDMS) Package", Computers, Environment and Urban Systems, pp.
165-173. 10.314, 1986.
Robinson. V.B. and Coiner, J . C . , .'Microcomputer Geoprocessing as a Minimum Techno!ogy Solution for
Data Management in Developing Countries", Proceedings of the Urban and Regional Information Systems
Association. pp. 214-226, 1981.
Rosenblum, J. and Jacobs, D.. "Performance Programming: Developing a Single Program for a Variety of
IBM PC Compatibles". BYTE. Third Annual Special Issue, pp. 181-194, 1986.
Rushton, G.. Optimal Location of Facilities. COMPress, Wentworth. 1979.
Sawicki, D.S., "Microcomputer Applications in Planning", A P A Journal, 51(2), 209-215, Spring. 1985.
Schneider, D.I.. "PEEKing at Your PC's Memory". Parts 1 and 2. PCMagazine (12 and 26 November), pp.
201-218 and 187-208, 1985.
Trist. E. and Bamforth, K.W.? "Some Social and Psychological Consequences of the Long-Wall Method of
Coal-Getting", Human Relations 4. 1951.
United Nations Centre for %man Settlements (Habitat). "A Microcomputer Physical Planning System for
Habitat". Technical Notes No. 5 . Nairobi: UNCHS, 1982(?).
United Nations Centre for Human Settlements (Habitat). Urban Data Management Software (UDMS).
Instructor's Manual. U N C H S , Nairobi, June 1983.
United Nations Centre for H u m a n Settlements (Habitat), Programrne Listing. Version 1.01 (MarchiApril 1983).
Nairobi: UNCHS. June 1983.
United Nations Centre for Human Settlements (Habitat), User's Manual. Preliminary Draft (Version 0.98).
Nairobi: UNCHS, December 1980. Translated into Spanish as Manual del Usario conjunto Sofnvare para el
Manejo de Datos Urbanos.
United Nations Centre for Human Settlements (Habitat), User's iManual. Second edition (Version 1.03).
U N C H S , Nairobi, January 1983.
United Nations Educational Scientific and Cultural Organization ( U N E S C O ) , Conceptlral Framework and
Guidelines for Establishing Geographic Information Systems. Preliminary version. Erik de Man, W.H.
(Editor)! UNESCO, Paris! August 1984.
Wiggins, L.L., "Three Low-Cost Mapping Packages for Microcomputers", A P A Journal, pp. 480-488,
Autumn 1986.
Downloaded from www.timcart.com.
Urban Data Marlagement Software
193
NOTE ON DISTRIBUTION O F UDMS
The current version of UDMS is distributed without charge. It runs under PCIMS-DOS on IBM or compatible
microcomputers. IBM graphics capability (CGA) or equivalent is required for the mapping routines, but the
rest of the package can be run without graphics. If you have a colour monitor, UDMS will run in colour; if not.
UDMS will run in monochrome. Printouts are optional and are done from the screen; so the package can be
run with or without a printer attached. If you want printouts, you will need a dot-matrix printer capable of
doing a graphics screen dump. Write to UNCHS (Habitat), Box 30030, Nairobi, Kenya, for information on
users in your country from whom you can arrange to get a copy of the UDMS package; or send a 3.5 or 5.25
inch disk and ask for a copy of the package to be mailed to you directly.
Downloaded from www.timcart.com.