1
Axiom H2
Smart Datalogger for Extreme
Environments
User Manual
1.800.548.4264
www.ftshydrology.com
700- H2 Datalogger – Rev. 14, 01 May 2013
Contact information
FTS
1065 Henry Eng Place
Victoria, B.C., V9B 6B2
CANADA
www.ftshydrology.com
Toll-free
Local
Technical support
1-800-548-4264
250-478-5561
support.ftshydrology.com
Table of Contents
Contact information ..................................................................................................................... ii
Table of Figures ........................................................................................................................... 5
Chapter 1
Description ...........................................................................................................10
1.1
General ........................................................................................................................................ 11
1.2 Power connections ....................................................................................................................... 12
1.3
Sensor inputs................................................................................................................................ 13
1.4 Telemetry panel ........................................................................................................................... 15
1.5
User interface ............................................................................................................................... 17
Chapter 2
Quick start guide...................................................................................................21
Chapter 3
Operation .............................................................................................................25
3.1
General ........................................................................................................................................ 27
3.2 USB memory stick information..................................................................................................... 32
3.3
Datalogger status ......................................................................................................................... 34
3.4 Data status ................................................................................................................................... 36
3.5
Telemetry status .......................................................................................................................... 38
Chapter 4
Installation .......................................................................................................... 41
4.1 Preparation .................................................................................................................................. 42
4.2 At the site ..................................................................................................................................... 43
Chapter 5
Maintenance ........................................................................................................ 48
5.1
General ........................................................................................................................................ 49
5.2 Datalogger update ....................................................................................................................... 49
5.3
Site visit ....................................................................................................................................... 50
Chapter 6
Configuration structure .........................................................................................52
6.1 General ........................................................................................................................................ 53
6.2 Operating algorithms ................................................................................................................... 53
Chapter 7
Configuration reference .........................................................................................55
7.1
General ........................................................................................................................................ 58
7.2
Station set-up............................................................................................................................... 58
7.3
Service ......................................................................................................................................... 66
Axiom H2 User Manual
7.4
7.5
7.6
7.7
7.8
7.9
Table of Contents
Sensors ........................................................................................................................................ 77
SDI sensors ................................................................................................................................. 107
Processing ................................................................................................................................... 117
Data ............................................................................................................................................133
Current Conditions ..................................................................................................................... 141
Telemetry................................................................................................................................... 143
Chapter 8
G5 telemetry reference ........................................................................................146
8.1 CS1 and CS2 standards ............................................................................................................... 147
8.2 Status ......................................................................................................................................... 147
Chapter 9
AirTalk guide ...................................................................................................... 173
9.1 Introduction ................................................................................................................................175
9.2 Common configuration tasks...................................................................................................... 185
9.3 Configuration reference ............................................................................................................. 209
9.4 Operational notes....................................................................................................................... 232
Chapter 10
RVT telemetry reference ..................................................................................... 234
10.1 “RVT” vs. “AirTalk” ..................................................................................................................... 235
10.2 Status ......................................................................................................................................... 235
10.3 Editing an RVT configuration ...................................................................................................... 238
Chapter 11
Specifications ..................................................................................................... 240
11.1 Datalogger ................................................................................................................................. 241
11.2 Internal GOES transmitter (OPTIONAL) ..................................................................................... 247
page 4
Table of Figures
Figure 1-1: Axiom H2 Datalogger Front Panel ......................................................................................................... 12
Figure 1-2: Dual External Telemetry Panel ............................................................................................................. 16
Figure 1-3: Internal G5 GOES Transmitter with Single External Telemetry Panel .....................................................17
Figure 1-4: Home screen ........................................................................................................................................ 18
Figure 3-1: Memory Stick File Structure .................................................................................................................. 33
Figure 3-2: Data Status screen ............................................................................................................................... 36
Figure 3-3: Telemetry screen .................................................................................................................................. 38
Figure 3-4: Example Telemetry Status screen......................................................................................................... 39
Figure 4-1: Keyway Enclosure ................................................................................................................................ 43
Figure 6-1: Datalogger Configuration Structure ..................................................................................................... 53
Figure 6-2: Datalogger Operating Algorithms ........................................................................................................ 54
Figure 7-1: Home screen ......................................................................................................................................... 58
Figure 7-2: Station Set-up screen – Site Tab ........................................................................................................... 58
Figure 7-3: Station Set-up screen – Version Tab ..................................................................................................... 59
Figure 7-4: Station Set-up screen – Set-up Tab....................................................................................................... 60
Figure 7-5: Save Configuration File screen .............................................................................................................. 61
Figure 7-6: Load Configuration File screen ............................................................................................................. 62
Figure 7-7: Configuration Summary screen – Sensors tab ....................................................................................... 63
Figure 7-8: Configuration Summary screen – SDI tab ............................................................................................. 64
Figure 7-9: Configuration Summary screen – Processes tab ................................................................................... 64
Figure 7-10: Station Set-up screen – Power Management Tab................................................................................ 65
Figure 7-11: Service screen ..................................................................................................................................... 66
Figure 7-12: Set Date Time screen .......................................................................................................................... 67
Figure 7-13: Set Date Selection .............................................................................................................................. 67
Figure 7-14: Datalogger Update screen .................................................................................................................. 69
Figure 7-15: Application Update screen .................................................................................................................. 70
Axiom H2 User Manual
Table of Contents
Figure 7-16: Sensor Extensions screens ...................................................................................................................71
Figure 7-17: Audit Log screen ..................................................................................................................................73
Figure 7-18: Serial Number Table screen ................................................................................................................ 74
Figure 7-19: Serial Number Update screen ............................................................................................................. 74
Figure 7-20: Start Visit Report screen ..................................................................................................................... 75
Figure 7-21: Save Report - Start.............................................................................................................................. 75
Figure 7-22: End Visit Report screen ....................................................................................................................... 76
Figure 7-23: Save Report - End ............................................................................................................................... 76
Figure 7-24: Sensors screen ..................................................................................................................................... 77
Figure 7-25: Internal Sensor Icons ............................................................................................................................ 77
Figure 7-26: SDI and Dedicated Sensor Icons .......................................................................................................... 77
Figure 7-27: Sensor Extension Icons ........................................................................................................................ 77
Figure 7-28: Battery Sensor Setup screen ............................................................................................................... 79
Figure 7-29: Solar Panel Sensor Setup screen ......................................................................................................... 80
Figure 7-30: Case Temp Sensor Setup screen ......................................................................................................... 80
Figure 7-31: Rain Sensor Set-up screen ................................................................................................................... 81
Figure 7-32: Rain Sensor Display screen ................................................................................................................. 81
Figure 7-33: SDI Sensor Set-up screen .................................................................................................................... 82
Figure 7-34: SDI Sensor Command Set-up screen ................................................................................................... 82
Figure 7-35: SDI Sensor Field Set-up screen ............................................................................................................ 83
Figure 7-36: Stage Sensor Set-up screen – Sensor tab ............................................................................................ 84
Figure 7-37: Stage Sensor Set-up screen – Stage tab .............................................................................................. 85
Figure 7-38: Stage Sensor Extension Set-up screen – Temp tab .............................................................................. 86
Figure 7-39: Stage Sensor Extension Display screen with Stage Offset ................................................................... 86
Figure 7-40: Pressure Transducer Set-up screen – Sensor tab ................................................................................. 87
Figure 7-41: Pressure Transducer Set-up screen – Stage tab ................................................................................... 88
Figure 7-42: Pressure Transducer Set-up screen – Temp tab .................................................................................. 88
Figure 7-43: Pressure Transducer Set-up screen – Conversion tab .......................................................................... 89
Figure 7-44: Pressure Transducer display screen .................................................................................................... 90
Figure 7-45: Shaft Encoder Set-up screen – Sensor tab........................................................................................... 90
Figure 7-46: Shaft Encoder Set-up screen – Stage tab ............................................................................................ 91
Figure 7-47: Shaft Encoder Set-up screen – Optional Field tab................................................................................ 91
Figure 7-48: Shaft Encoder Sensor display screen................................................................................................... 92
Figure 7-49: Tavis Sensor Setup screen - Sensor tab ............................................................................................... 93
Figure 7-50: Tavis Sensor Setup screen - Stage tab................................................................................................. 93
Figure 7-51: Tavis Sensor Setup screen - Temp tab ................................................................................................. 94
Figure 7-52: Tavis Sensor Extension Display screen ................................................................................................ 94
Figure 7-53: Stage Sensor Display screen ............................................................................................................... 95
Figure 7-54: Stage Offset Tool screen (empty) ....................................................................................................... 96
Figure 7-55: Stage Offset Tool screen (example data) ............................................................................................ 96
Figure 7-56: Stage Offset Tool screen (more example data) ................................................................................... 97
Figure 7-57: Stage Sensor Extension Staff Gauge Entry screen ............................................................................... 97
page 6
Axiom H2 User Manual
Table of Contents
Figure 7-58: Stage Sensor Extension Stage Settings Confirmation screen .............................................................. 97
Figure 7-59: SDI-AM Analog Module Set-up screen -- Sensor tab ........................................................................... 98
Figure 7-60: SDI-AM Analog Module Set-up screen -- Sched tab ............................................................................ 99
Figure 7-61: SDI-AM Analog Module Set-up screen - Analog Channel tab............................................................... 99
Figure 7-62: SDI-AM Analog Module Set-up screen - Power Output tab ............................................................... 100
Figure 7-63: SDI-AM Analog Module Set-up screen - Excitation Output tab ......................................................... 100
Figure 7-64: SDI-AM Analog Module Set-up screen - Counter tab .........................................................................101
Figure 7-65: SDI-AM Sensor display screen .......................................................................................................... 102
Figure 7-66: RM Young Setup screen – Sensor tab ........................................................................................... 102
Figure 7-67: RM Young Setup screen – Inst tab .................................................................................................103
Figure 7-68: RM Young Setup screen – Avg tab ................................................................................................103
Figure 7-69: RM Young Setup screen – Pk Read tab ....................................................................................... 104
Figure 7-70: RM Young Setup screen – Pk Reset tab ...................................................................................... 105
Figure 7-71: RM Young Setup screen – Units tab ............................................................................................. 105
Figure 7-72: RM Young Sensor display screen .................................................................................................. 106
Figure 7-73: Delete Sensor screen ......................................................................................................................... 106
Figure 7-74: SDI Sensor Mapping screen ................................................................................................................107
Figure 7-75: SDI Detect dialog ................................................................................................................................107
Figure 7-76: Detected SDI Sensors ....................................................................................................................... 108
Figure 7-77: Change SDI Sensor Address .............................................................................................................. 109
Figure 7-78: Resolved SDI Address Conflict .......................................................................................................... 109
Figure 7-79: SDI Sensor Mapping...........................................................................................................................110
Figure 7-80: Mapped SDI Sensor ...........................................................................................................................110
Figure 7-81: SDI Transparent Mode screen ............................................................................................................ 113
Figure 7-82: Processes screen ................................................................................................................................ 117
Figure 7-83: Process Icons ..................................................................................................................................... 117
Figure 7-84: Max Min Process Set-up screen – General Settings tab ......................................................................118
Figure 7-85: Max Min process sample set timings ...................................................................................................119
Figure 7-86: Max Min Logging Set-up screen – Logging Settings tab.................................................................... 120
Figure 7-87: Max Min Process Example ..................................................................................................................121
Figure 7-88: Timed Peak Process Setup screen ..................................................................................................... 122
Figure 7-89: Peak Process Setup screen ................................................................................................................123
Figure 7-90: Delta Process Setup screen ................................................................................................................123
Figure 7-91: Average Process Setup screen .......................................................................................................... 124
Figure 7-92: Average Process Example ................................................................................................................. 124
Figure 7-93: User Variable Setup screen ............................................................................................................... 125
Figure 7-94: User Variable Process Display screen ................................................................................................ 126
Figure 7-95: Function Setup screen ...................................................................................................................... 126
Figure 7-96: Script Setup screen ........................................................................................................................... 128
Figure 7-97: Script Process Example (IncCount) .................................................................................................... 129
Figure 7-98: Script Process Example (RNIN) ..........................................................................................................130
Figure 7-99: TSampler (threshold sampling process setup) screen.........................................................................130
page 7
Axiom H2 User Manual
Table of Contents
Figure 7-100: Threshold Sampling Process Threshold Set-up screen ..................................................................... 131
Figure 7-101: Threshold Sampling Process Advanced Set-up screen ...................................................................... 131
Figure 7-102: Threshold Sampling Process Display screen .....................................................................................132
Figure 7-103: Data Status screen ........................................................................................................................... 133
Figure 7-104: Logging Intervals screen .................................................................................................................. 133
Figure 7-105: Logging Interval Setup screen ..........................................................................................................134
Figure 7-106: Log Interval Set-up screen – Disable Logging ................................................................................... 135
Figure 7-107: Conditional Logging Set-up screen ................................................................................................... 135
Figure 7-108: Download Data screen .................................................................................................................... 136
Figure 7-109: Download Data Select Variables screen ........................................................................................... 137
Figure 7-110: Confirm Delete Data screen .............................................................................................................138
Figure 7-111: Data Deleted screens ........................................................................................................................138
Figure 7-112: Graph Data screen ........................................................................................................................... 139
Figure 7-113: Graph Set-up screen ........................................................................................................................ 139
Figure 7-114: Display Variable Set-up screen ........................................................................................................ 140
Figure 7-115: Data Table screen ............................................................................................................................ 140
Figure 7-116: Data Advanced Setup screen ............................................................................................................141
Figure 7-117: Current Condition screen ................................................................................................................. 142
Figure 7-118: Current Condition Set-up screen ..................................................................................................... 142
Figure 7-119: Current Condition Timed Refresh screen ..........................................................................................143
Figure 7-120: Telemetry screen (Telem A and Telem B tabs) .................................................................................143
Figure 7-121: Telemetry Device Selection screen .................................................................................................. 144
Figure 7-122: Telemetry Device Selection screen ................................................................................................. 145
Figure 8-1: G5 Status screens ............................................................................................................................. 148
Figure 8-2: G5 Set-up screens -- Transmitter tab .................................................................................................. 150
Figure 8-3: G5 Set-up screens -- Self-Timed tab .................................................................................................... 151
Figure 8-4: G5 Set-up screens -- Pwr Params tab ................................................................................................... 153
Figure 8-5: G5 BLM Message screen ......................................................................................................................155
Figure 8-6: G5 BLM Format String screen ..............................................................................................................155
Figure 8-7: G5 Set-up screen for Time Ordered Format ........................................................................................ 158
Figure 8-8: G5 Time Ordered Message screen ...................................................................................................... 158
Figure 8-9: G5 Time Ordered Message Set-up screen ........................................................................................... 159
Figure 8-10: G5 Time Ordered Random Transmission Set-up screen .................................................................... 160
Figure 8-11: G5 Time Ordered Random Transmission Message Definition screens ................................................161
Figure 8-12: G5 WSC Message screen ....................................................................................................................161
Figure 8-13: G5 WSC Message Set-up screen........................................................................................................ 162
Figure 8-14: G5 WSC Message Order screen ......................................................................................................... 162
Figure 8-15: G5 Set-up screen for Pseudo Binary Format ...................................................................................... 164
Figure 8-16: G5 Pseudo Binary Message screen .................................................................................................... 164
Figure 8-17: G5 Pseudo Binary Message Set-up screen ......................................................................................... 165
Figure 8-18: G5 Pseudo Binary Message Parameter Format screen ...................................................................... 165
Figure 8-19: G5 Pseudo Binary Random Transmission Set-up screen .................................................................... 166
page 8
Axiom H2 User Manual
Table of Contents
Figure 8-20: G5 Pseudo Binary Random Transmission Message Definition screens ...............................................167
Figure 8-21: G5 Tx Stats Log screen ..................................................................................................................... 168
Figure 8-22: G5 Tx Log Examples ......................................................................................................................... 168
Figure 8-23: G5 GPS screen .................................................................................................................................. 169
Figure 8-24: G5 Test Tx screen ..............................................................................................................................170
Figure 9-1: Generic message structure in AirTalk ...................................................................................................176
Figure 9-2: Example message structure ................................................................................................................. 177
Figure 9-3: Generic alert in AirTalk .........................................................................................................................178
Figure 9-4: Example alert structure ........................................................................................................................179
Figure 9-5: Alert triggering behavior on a graph of the alert condition variable value ............................................ 180
Figure 9-6: Home Screen with AirTalk Status .................................................................................................... 209
Figure 9-7: Telemetry screen, Port B, with AirTalk installed ................................................................................. 210
Figure 9-8: AirTalk Status screen ........................................................................................................................211
Figure 9-9: AirTalk History screen ......................................................................................................................213
Figure 9-10: AirTalk Configuration Editor screen – common elements ........................................................... 214
Figure 9-11: AirTalk Configuration Editor screen – Phrases tab .................................................................... 215
Figure 9-12: Phrase Editor screen ...................................................................................................................... 216
Figure 9-13: Example phrasing ...............................................................................................................................217
Figure 9-14: Phrasing Editor screen .................................................................................................................. 218
Figure 9-15: AirTalk Configuration Editor screen – Messages tab ................................................................. 221
Figure 9-16: Message Editor screen ................................................................................................................... 222
Figure 9-17: AirTalk Configuration Editor screen – Alerts tab ........................................................................ 224
Figure 9-18: Alert Editor screen .......................................................................................................................... 226
Figure 9-19: AirTalk Configuration Editor screen – DTMF tab ........................................................................ 229
Figure 9-20: AirTalk Configuration Editor screen – Languages tab .............................................................. 230
Figure 9-21: Set AirTalk Language screen .........................................................................................................231
Figure 10-1: RVT Status screen ............................................................................................................................. 235
Figure 10-2: RVT Get Configuration screen .......................................................................................................... 236
Figure 10-3: RVT Send Configuration screen ........................................................................................................ 236
Figure 10-4: Choose RVT Configuration Save File screen .......................................................................................237
Figure 10-5: RVT Load Configuration screen .........................................................................................................237
page 9
Chapter 1
Description
Chapter contents
1.1
1.2
1.3
1.4
1.5
General ........................................................................................................................................ 11
Power connections ....................................................................................................................... 12
1.2.1
Solar panel
1.2.1.1
Solar charge operation
1.2.2
Battery
Sensor inputs................................................................................................................................ 13
1.3.1
Dedicated rain sensor
1.3.2
SDI ports
1.3.2.1
Optional SDI-AM analog expansion module
1.3.3
Internal sensors
1.3.3.1
Battery
1.3.3.2
Solar panel
1.3.3.3
Case temperature
1.3.3.4
Location
1.3.3.5
Telemetry specific
Telemetry panel ........................................................................................................................... 15
1.4.1.1
Dual external telemetry
1.4.1.2
Internal G5 GOES transmitter with external telemetry
User interface ............................................................................................................................... 17
1.5.1
Touchscreen
1.5.1.1
Backlight
1.5.2
USB ports
1.5.3
GUI Home screen
1.5.3.1
Status indicators
1.5.3.2
Station
1.5.3.3
Sensors icon
1.5.3.4
SDI-12 icon
1.5.3.5
Processes icon
1.5.3.6
Current Conditions icon
1.5.3.7
Telemetry icon
Axiom H2 User Manual
1.1
Chapter 1 Description
General
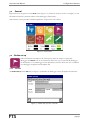
The FTS Axiom H2 datalogger is a robust weatherproof datalogger with a built-in power management system,
support for a variety of sensors and telemetry devices, an industrial grade colour touchscreen display, and
standard USB ports.
The Axiom H2 employs the FTS Quick Touch System which combines a graphical user interface (GUI) with
a colour touchscreen display and USB ports for easy operation. On-site data retrieval, datalogger parameter
optimization, and performance information are simple and intuitive.
The datalogger can store multiple datalogger configurations as well as several years of typical fire weather data.
Data in the Axiom H2 is stored in a circular buffer in non-volatile memory with time tags on each record. The
time tags have a resolution of one second and correctly account for leap years. Non-volatile memory ensures
that data is preserved through power cycles and the circular buffer ensures that the oldest data is overwritten by
the newest data when the memory fills.
The datalogger is watertight, even without connectors attached. Device connectors (sensors and telemetry) are
circular metal shell, bayonet, military style connectors which are uniquely keyed and colour coded to minimize
erroneous connections. The datalogger supports SDI-12 sensors as well as a broad range of meteorological
sensors.
The built-in power management system integrates a SOLAR PANEL input with a BATTERY input to provide a
method of regulating and maintaining the optimal battery charge condition.
Support for two independent telemetry devices is standard with each datalogger. The Axiom H2 datalogger can
be ordered with two external telemetry ports (model Axiom H2-TLM-2) or with an internal G5 GOES
transmitter with one external telemetry port (model Axiom H2-G5-TLM). The Axiom H2 automatically
synchronizes with UTC time if a G5 GOES transmitter is connected either externally or internally to the
datalogger.
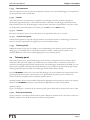
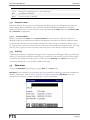
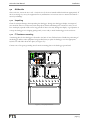
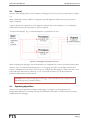
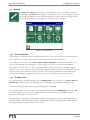
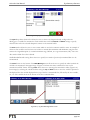
Figure 1-1 identifies the components of the Axiom H2 datalogger front panel. The front panel is divided into
four functional blocks:
Power Connections
Sensor Inputs
Telemetry Panel
User Interface
and BATTERY inputs
colour coded sensor inputs
dual TELEMETRY or internal GOES with single TELEMETRY
touchscreen, stylus, and USB ports
SOLAR PANEL
page 11
Axiom H2 User Manual
Chapter 1 Description
USER
INTERFACE
TELEMETRY
PANEL
H2
DATALOGGER
USB DEVICE
GPS
GOES
USB
TELEMETRY
RAIN
SDI A
SDI C
SOLAR PANEL
GROUND
SDI B
SDI D
BATTERY
SENSOR
INPUTS
POWER
CONNECTIONS
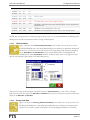
Figure 1-1: Axiom H2 Datalogger Front Panel
1.2
Power connections
Power connections for the Axiom H2 datalogger comprise the SOLAR PANEL input and the BATTERY input.
The BATTERY input is the power source for the datalogger while the SOLAR PANEL input is used by the
internal power management system to charge the 12-volt battery.
1.2.1 Solar panel
The SOLAR PANEL input is colour coded on the datalogger front panel with a black ring around the connector.
The connector is a three terminal, pin (male), bayonet, military style connector which can accept a solar panel
array up to a maximum of 100 Watts. The SOLAR PANEL input has an internal blocking diode to prevent
battery voltage from running back through the power management system and discharging through the solar
panel at night.
page 12
Axiom H2 User Manual
Chapter 1 Description
Normally solar panels are provided by FTS with the appropriate mating connector; however, if required, details
for the solar panel connection can be found in the Specifications section of this manual.
1.2.1.1
Solar charge operation
The SOLAR PANEL input provides power directly to the battery charge control circuits. This allows the internal
power management system to begin to charge the battery attached to the BATTERY input even when there is
not enough battery capacity to run the datalogger (i.e. a completely discharged battery). In addition, once the
datalogger is powered, battery charging is temperature compensated for optimal battery charging.
1.2.2 Battery
The BATTERY connector is colour coded on the datalogger front panel with a black ring around the connector.
The connector is a seven terminal, pin (male), bayonet, military style connector which is designed to connect to
a 12 V, absorbed glass mat, deep cycle battery. The cable connection to the battery includes the main battery
connection as well as voltage sensing leads and a temperature sensing element. This set of connections enables
the datalogger’s power management system to optimize battery charging as it is able to accurately measure the
battery voltage and to temperature compensate the battery charging algorithm.
Details of the battery connection can be found in the Specifications section of this manual.
1.3
Sensor inputs
The Axiom H2 datalogger has several dedicated sensor inputs specifically chosen for Fire Weather data
collection, two independent SDI-121 connection ports, as well as several internal sensors. Sensors used on
FWS-12S, FWS-12 and FWS-11 dataloggers are compatible with the Axiom H2 datalogger.
1.3.1 Dedicated rain sensor
The RAIN input is colour coded on the datalogger front panel with a blue ring around the connector. The
connector is a three terminal, socket (female), bayonet, military style connector which is compatible with
tipping bucket rain gauge sensors.
Normally Rain Gauges are provided by FTS with the appropriate mating connector; however, if required,
details for the RAIN input connection can be found in the Specifications section of this manual.
Rain sensing on the Axiom H2 datalogger is accomplished by counting the number of tips of a calibrated tipper
bucket and then converting the number of tips to a specific rainfall amount.
1.3.2 SDI ports
The Axiom H2 datalogger has four fully independent front panel SDI-12 ports (SDI A, SDI B, SDI C, and SDI
D). The SDI ports are special dedicated sensor connectors as the SDI-12 is a multi-drop interface (more than
one sensor can be connected to a single SDI bus). Four independent SDI ports allow “slow” sensors (sensors
which require a long time to return data) to be placed on a separate bus from quicker SDI sensors. Multiple
ports also offer protection against a damaged sensor disrupting communications to all SDI sensors as the
sensors can be split between two buses.
1
SDI-12 is a serial digital interface standard for microprocessor based sensors (for more information, see
http://www.sdi-12.org.
page 13
Axiom H2 User Manual
Chapter 1 Description
The Axiom H2 is the master on both SDI ports and fully supports the SDI protocol (currently version 1.3).
SDI-12 ports are colour coded on the datalogger front panel with an orange ring around the connector. The
connector is a three terminal, socket (female), bayonet, military style connector which is compatible with all
SDI sensors.
Normally SDI sensors are provided by FTS with the appropriate mating connector; however, if required,
details for the SDI port connections can be found in the Specifications section of this manual.
1.3.2.1
Optional SDI-AM analog expansion module
An optional SDI-AM expansion module for general purpose analog inputs is available for use with the Axiom
H2 datalogger. The SDI-AM is an SDI-12 module designed to provide easy connection to legacy analog
sensors through spring clamp terminal strips. The SDI-AM connects to the Axiom H2 on either of the
datalogger’s SDI ports. The module provides four configurable analog input channels; two switched 12 V
power supply outputs; two excitation voltage outputs; and a general purpose counter input.
Refer to the SDI-AM Operating Manual (FTS Document Number: 700-SDI-AM) for details on the analog
expansion module.
1.3.3 Internal sensors
Internal sensors are sensors which are inside the datalogger case (internal to the datalogger). The purpose of
these sensors is to provide the user additional station operating information.
1.3.3.1
Battery
The internal battery sensor measures parameters of the datalogger’s front panel BATTERY input. The battery
sensor can be configured to measure battery voltage, current, and temperature.
1.3.3.1.1
Battery voltage
Battery voltage is measured in Volts.
1.3.3.1.2
Battery current
Battery current is measured in Amps. A negative reading indicates current is being pulled from the battery (i.e.
the battery is being discharged). A positive reading indicates current is being supplied to the battery (i.e. the
battery is being charged from the solar panel).
1.3.3.1.3
Battery temperature
Battery temperature can be measured in Celsius or Fahrenheit.
1.3.3.2
Solar panel
The internal solar panel sensor measures parameters of the datalogger’s front panel SOLAR PANEL input. This
sensor can be configured to measure solar panel voltage and current.
1.3.3.2.1
Solar panel voltage
Solar panel voltage is measured in Volts.
1.3.3.2.2
Solar panel current
Solar panel current, the current supplied by the solar panel to charge the battery, is measured in Amps.
page 14
Axiom H2 User Manual
1.3.3.3
Chapter 1 Description
Case temperature
The case temperature sensor measures the temperature internal to the Axiom H2 datalogger. Case temperature
can be reported in Celsius or Fahrenheit.
1.3.3.4
Location
Three internal location measurements are available in the datalogger. Elevation, latitude, longitude are
automatically populated if there is a G5 GOES transmitter connected to the datalogger (obtained from the
GPS connected to the G5). If the datalogger is using telemetry other than a G5 transmitter, these three values
can be manually entered through the user interface (on the Site tab of the Station screen).
1.3.3.4.1
Elevation
Elevation is the distance above sea level. Elevation can be reported in metres, feet, or inches.
1.3.3.4.2
Latitude and longitude
Latitude and Longitude are reported in degrees-minutes-seconds (dms) format on the datalogger touchscreen;
however; when these parameters are logged, they are stored in decimal format.
1.3.3.5
Telemetry specific
Additional internal sensors may be available to the user depending on the telemetry device attached to the
datalogger (e.g., Forward Power if a G5 GOES transmitter is used as a telemetry device). Refer to the
Telemetry Reference section of this manual appropriate to your Telemetry device.
1.4
Telemetry panel
The telemetry panel on the Axiom H2 datalogger allows for factory configuration for the telemetry device
connections. The Axiom H2 supports the connection of two telemetry devices. The devices can both be
external to the datalogger (dual external telemetry panel, Axiom datalogger model number: H2-TLM-2) or one
device can be externally connected and a GOES transmitter can be internal to the Axiom H2 (single external
telemetry panel with built-in GOES, Axiom datalogger model number: H2-G5-TLM).
External TELEMETRY connectors on the Axiom H2 datalogger are colour coded on the telemetry panel with a
green ring around the connector. The connector is an eight terminal, pin (male), bayonet, military style
connector which is compatible with existing FTS telemetry devices.
Normally telemetry devices are provided by FTS with the appropriate mating connector; however, if required,
details for the TELEMETRY connector can be found in the Specifications section of this manual.
Telemetry options
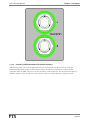
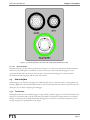
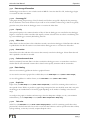
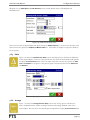
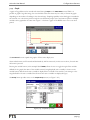
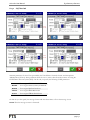
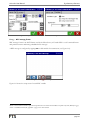
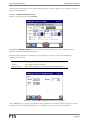
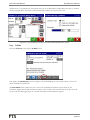
Figure 1-2 and Figure 1-3 illustrate the two telemetry panel options which can be selected at the time of order.
1.4.1.1
Dual external telemetry
The top connector on the dual external telemetry panel is defined as Telemetry Port A. The lower connector is
defined as Telemetry Port B. Both connections are functionally identical.
page 15
Axiom H2 User Manual
Chapter 1 Description
Figure 1-2: Dual External Telemetry Panel
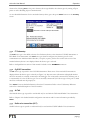
1.4.1.2
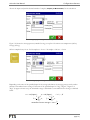
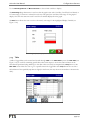
Internal G5 GOES transmitter with external telemetry
This telemetry panel option has the upper telemetry port replaced with two RF connectors: an N-type
connector and an SMA connector. The N-type connector is used for the internal G5 transmit antenna
connection while the SMA connector is the G5 transmitter’s GPS connection. The internal G5 transmitter is
defined as Telemetry Port A while the lower telemetry connector remains defined as Telemetry Port B.
page 16
Axiom H2 User Manual
Chapter 1 Description
Figure 1-3: Internal G5 GOES Transmitter with Single External Telemetry Panel
1.4.1.2.1
GPS connection
The GPS connector on the telemetry panel shown in Figure 1-3 is used by the internal G5 GOES transmitter.
The G5 uses the GPS signal to synchronize its clock to UTC time. The Axiom H2 datalogger is in turn
synchronized with UTC time from the G5 transmitter. The Axiom H2 datalogger also obtains position
information (latitude, longitude, and elevation) from the G5.
1.5
User interface
The datalogger’s user interface incorporates an industrial grade colour touchscreen with a GUI (graphical user
interface) application, and standard USB connectors. This virtually eliminates the need for a personal computer
during site visits or when configuring the datalogger.
1.5.1 Touchscreen
The display used in the Axiom H2 datalogger is a high visibility, industrial grade, 3.5” colour LCD module with
quarter VGA resolution and a built-in touch panel. The display is backlit and is bright and clear even in direct
sunlight. A tethered stylus is supplied with each datalogger for use with the touchscreen although most icons
are large enough to be operated with a bare finger.
page 17
Axiom H2 User Manual
1.5.1.1
Chapter 1 Description
Backlight
The touchscreen’s backlight turns on when the touchscreen is touched and automatically turns off after 60
seconds of non-use (no touches on the touchscreen).
1.5.2 USB ports
Two styles of USB ports are present on the datalogger. The USB DEVICE port is used to connect the datalogger
to a PC while the dual USB HOST port is used to connect USB accessories (mouse, keyboard, memory stick,
etc.) to the datalogger. Both USB port types (USB HOST and USB DEVICE) support USB Basic-Speed data
transfer (low speed of 1.5 Mb/s, and full speed of 12 Mb/s).
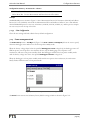
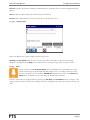
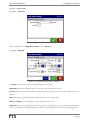
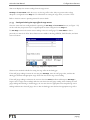
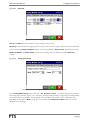
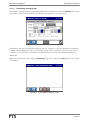
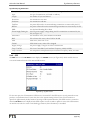
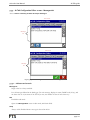
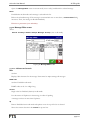
1.5.3 GUI Home screen
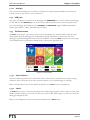
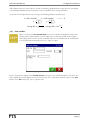
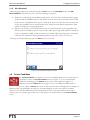
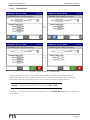
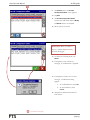
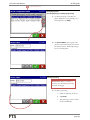
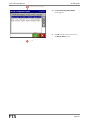
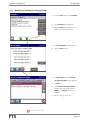
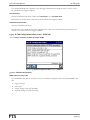
The Home screen (Figure 1-4) is the top-most screen in the graphical user interface (GUI), and is the screen
which appears when the datalogger has completed powering up. Information on the current state of the
datalogger is provided through the Home screen status indicators. From the Home screen the user can navigate
to the desired location or perform the desired action by pressing the appropriate icon.
Figure 1-4: Home screen
1.5.3.1
Status indicators
The status indicators provide cursory information such as sensor activity, transmitter status, battery voltage,
and battery state to allow the user to make a quick assessment as to how the datalogger is operating.
Refer to the Operation section of this manual for specifics on the Home screen status indicators.
1.5.3.2
Station
The Station icon accesses screens that provide the user with datalogger specifics such as software version, serial
number, manufacture date, etc. The user can also enter a station name and description as well as save and load
datalogger configuration files.
Refer to the Configuration section of this manual for details on the Station screen.
page 18
Axiom H2 User Manual
1.5.3.3
Chapter 1 Description
Sensors icon
The Sensors icon accesses screens that provide the user access to sensor definitions. The Sensors screen
allows the user to define new sensors (Internal, Dedicated, or SDI) as well as individually examine existing
sensor operation and configuration.
Refer to the Configuration and Operation sections of this manual for details on sensor set-up and sensor
monitoring respectively.
1.5.3.4
SDI-12 icon
The SDI-12 icon accesses screens that provide the user access to the datalogger’s SDI ports and specifically to
SDI sensor definitions. The SDI Sensor Mapping screen allows the user to define new SDI sensors and
examine their operation, to automatically detect SDI sensors that are connected to the datalogger, and to
manually issue commands over the SDI ports.
Refer to the Configuration and Operation sections of this manual for details on SDI sensor set-up and
operation.
1.5.3.5
Processes icon
The Processes icon accesses screens that enable the user to define mathematical calculations and custom
scripts to manipulate sensor measurements or other processes. A process output is treated the same as a sensor
reading – both are valid datapoints as the datalogger is not concerned about the source of the data. Any
datapoint can be logged, transmitted, displayed, or used in another calculation.
Refer to the Processing section of this manual for details on the various process options.
1.5.3.6
Current Conditions icon
The Current Conditions icon accesses screens that display and configure a set of user selected datapoints to
facilitate easy monitoring of a specific set of data. The user can manually refresh the current condition readings
at any time or have the datalogger automatically update the display (on a one minute interval) with a series of
current condition readings.
Refer to the Operation section of this manual for details on viewing the current conditions.
1.5.3.7
Telemetry icon
The Telemetry icon accesses screens that allow the user to configure the telemetry port for a specific telemetry
device and to retrieve status information from the device. The options are: G5 (FTS G5 GOES satellite
transmitter); RVT (FTS Radio Voice Transmitter); AirTalk (FTS AirTalk); DB9 (simple serial communications);
FTS (all other telemetry types); and None (disabled). Although all options appear in the selector list, only the
following telemetry options are enabled in the Axiom H2: G5, RVT, AirTalk, None.
Refer to the Configuration and Operation sections of this manual for details on telemetry device configuration
and status monitoring.
1.5.3.8
Service icon
The Service icon accesses screens that provide access to datalogger maintenance related items. Through
Service, the user can set the datalogger’s data and time, review and manage the datalogger’s audit log, record
serial numbers of the sensors used by the datalogger, and issue site visit service reports.
page 19
Axiom H2 User Manual
Chapter 1 Description
Refer to the Configuration and Maintenance sections of this manual for service function details.
page 20
Chapter 2
Quick start guide
Axiom H2 User Manual
Chapter 2 Quick start guide
FTS normally configures the datalogger to meet the user’s requirements; however, should it be necessary, the
user can set-up or modify the datalogger’s configuration.
There are three ways to configure a datalogger:
1.
Load and modify an existing Configuration File,
2.
Load and modify an existing Template File, or
3.
Configure the datalogger from start to finish using the touchscreen and GUI.
A basic guide to configure the datalogger is outlined in the steps below. Details on configuration specifics can
be found in the Configuration Reference section of this manual.
4.
Power the datalogger
a.
Attach the battery to the power cable.
b. Plug the power connector into the datalogger.
5.
Set the datalogger’s date, time, and time zone:
a.
Press Service.
b. Press Set Date/Time.
c. Enter date, time, and time zone values.
d. Press OK and then Home when you are finished.
6.
Set the station name and description:
a.
Press Station and select the Site tab.
b. Press Edit.
c. Enter your station name and description
d. Press OK when you are done.
7.
To configure the datalogger from an existing template or configuration file:
a.
On the Home screen, press Station.
b. Select the Setup tab on the Station Set-up screen.
c. Press Load Configuration.
d. Select the template or configuration file.
e. After the datalogger has loaded the desired configuration go to Step 9 to configure/confirm
the telemetry settings. Otherwise press Home and continue with the steps below.
8.
To configure the dedicated and internal sensors:
a.
On the Home screen, press Sensors.
b. Press Add to create the desired sensor and then enter the appropriate parameters.
c. Press OK.
d. Press Home.
9.
To configure the SDI sensors:
page 22
Axiom H2 User Manual
a.
Chapter 2 Quick start guide
On the Home screen, press SDI-12.
b. SDI sensors connected to the datalogger can be automatically detected by pressing Detect.
This will return each sensor’s SDI address as well as information about the sensor
(manufacturer, model, serial number).
c. Press New in the Defined Name column to configure each SDI sensor.
d. Return to the Home screen when you are finished.
10.
To configure mathematical calculations and program scripts (e.g., averages, minimum or maximum
values, custom calculations etc.):
a.
On the Home screen, press Processes.
b. Use Add to create the desired process and then enter the appropriate parameters.
c. Press Home when you are finished.
11.
To log data from each sensor:
a.
On the Home screen, press Data and then the Setup Cog.
b. If the logger was programmed at our factory there will be ready-defined Logging Interval
configuration. To view configuration details, press the icon.
c. If a new logging interval is required:
i. Press Add and then press Edit.
ii. Select a variable name or sensor name and add this to the Logged Variables list on the
right-hand side.
iii. Continue adding to the list until all the variables you want logged appear on the righthand side.
iv. Choose a logging interval time
v. Press OK to save.
d. Return to the Home screen when you are finished.
12.
To display or configure the current telemetry port settings:
a.
On the Home screen, press Telemetry.
b. Setup is required only for G5 GOES transmitter. If the datalogger is connected to a G5
GOES transmitter (internally or externally):
i. Press the port’s Status button to display a summary status screen for the G5
transmitter.
ii. Press the Setup Cog and then Edit to configure your station’s NESID and relevant
GOES parameters.
iii. Navigate to the Self-Timed Tab to set the desired message format.
iv. Press OK after you are done to return to the setup screen.
v. Next, select the desired message format and then press Set Message to configure the
data transmitted on each GOES transmission.
page 23
Axiom H2 User Manual
Chapter 2 Quick start guide
vi. Return to the Home screen when you are finished.
13.
Confirm proper station operation:
a.
On the Home screen, press Current Conditions
b. Press the Setup Cog and choose which datalogger parameters to monitor. Press OK when
finished.
c. Press Refresh on the Current Conditions screen to update the display with the latest sensor
readings.
d. Return to the Home screen when you are finished.
14.
For your records, save the datalogger’s configuration to your USB memory stick:
a.
Plug your memory stick into one of the datalogger’s USB HOST ports.
b. On the Home screen, press Station and then select the Set-up tab.
c. Press Save Configuration and then press OK to save the datalogger’s configuration to the USB
memory stick.
If desired you can also save a template of the datalogger’s configuration to the USB memory
stick (refer the Operation section of this manual for the difference between templates and
configurations).
15.
To graph data:
a.
On the Home screen, press Data.
b. Press Graph.
c. Press the Setup Cog to configure the graph.
16.
To view data:
a.
On the Home screen, press Data.
b. Press Table.
17.
To export data to your USB memory stick:
a.
Plug your memory stick into one of the datalogger’s USB HOST ports.
b. On the Home screen, press Data.
c. Press Download.
d. Select the desired date range and then press Download to download the data.
e. Note that the export process can require some time if a large data range is selected.
page 24
Chapter 3
Operation
Chapter contents
3.1
3.2
3.3
General ........................................................................................................................................ 27
3.1.1
Mouse and keyboard connection
3.1.2
Password protection
3.1.2.1
User level
3.1.2.2
Tech level
3.1.2.3
Logout
3.1.3
Datalogger time
3.1.3.1
Setting the time
3.1.3.2
Operation with a G5 GOES transmitter
3.1.4
Using template and configuration files
3.1.4.1
Configuration files
3.1.4.2
Template files
3.1.5
USB connection to a PC
3.1.5.1
Windows XP
3.1.5.2
Windows 7
3.1.6
Touchscreen considerations
3.1.6.1
Temperature
3.1.6.2
Touch
3.1.6.3
Screen calibration
3.1.7
Telemetry connection to a PC
3.1.7.1
ASCII data download
3.1.8
HDL1 datalogger emulation
USB memory stick information..................................................................................................... 32
3.2.1
Requirements
3.2.2
File structure
3.2.2.1
H2 Data Logger folder
3.2.2.2
SW folder
3.2.2.3
Template folder
3.2.2.4
Station folder
Datalogger status ......................................................................................................................... 34
3.3.1
Home screen status indicators
3.3.1.1
Built-in
Axiom H2 User Manual
3.4
3.5
Operation
3.3.1.2
SDI
3.3.1.3
Trans
3.3.1.4
Tx
3.3.1.5
Battery
3.3.1.6
Telem
3.3.2
Datapoint values
3.3.2.1
Current Condition
3.3.3
Audit log
Data status ................................................................................................................................... 36
3.4.1
Data storage information
3.4.1.1
Percentage full
3.4.1.2
Capacity
3.4.1.3
Oldest data
3.4.1.4
Newest data
3.4.1.5
Estimated overwrite date
3.4.2
Data viewing
3.4.2.1
Graph view
3.4.2.2
Table view
3.4.3
Data operations
3.4.3.1
Downloading stored data
3.4.3.2
Deleting stored data
3.4.4
Remote datalogger communication
Telemetry status .......................................................................................................................... 38
3.5.1
FTS telemetry
3.5.2
G5 GOES transmitter
3.5.3
AirTalk
3.5.4
Radio voice transmitter (RVT)
page 26
Axiom H2 User Manual
3.1
Operation
General
Datalogging is a simple, straightforward process – data is sampled and stored on predefined intervals.
Operation of the datalogger is also quite simple as the datalogger GUI has several facilities (which can be
password protected) to configure the datalogger and to monitor the status of the datalogger and datalogging
system. The user has several options when interfacing with the datalogger. The simplest option is to use the
datalogger’s touchscreen GUI together with a USB memory stick. Alternately, the datalogger can be connected
to a PC as a USB device. Third, the datalogger telemetry port can be connected to a PC through an RS-232
serial port. As well, several telemetry choices exist for remote data collection from the datalogger.
3.1.1 Mouse and keyboard connection
For convenience, a USB mouse and/or keyboard can be connected to the datalogger’s USB HOST ports. The
datalogger’s touchscreen continues to function while the mouse and keyboard are connected.
3.1.2 Password protection
Two levels of password protection can be utilized on the datalogger. A User Level password grants
touchscreen read-only access to the datalogger while a Tech Level password enables the operator to modify the
datalogger configuration. It is the choice of the station operator whether or not to enable password protection
on the datalogger as passwords are not set when the datalogger is shipped from FTS.
3.1.2.1
User level
A User Level password allows the operator read-only access to the datalogger. The operator is able to examine
datalogger status (i.e. view data, read sensors, view telemetry configuration etc.) but cannot change the
configuration of the logger if a Tech Level password is set.
3.1.2.2
Tech level
The purpose of the Tech (technician) Level password is to prevent unauthorized modifications to the
datalogger. A Tech Level password allows the operator full access to the datalogger. The operator is able to
modify datalogger operation (i.e. load new configurations, create and change datalogging intervals, create and
change sensor definitions etc.). There are no restrictions placed on a Tech Level user. If a Tech Level password
is not set then the User Level has access to Tech Level functionality.
3.1.2.3
Logout
Automatic logout from User Level or Tech Level occurs after 20 minutes of touchscreen inactivity. In addition,
a station operator can force a logout by pressing Logout on the Service screen.
3.1.3 Datalogger time
The user can set the datalogger to report the time in whatever time zone they desire. The datalogger continually
displays the time (as per the time zone setting) in the upper right corner of the display. All datalogging and all
audit log entries are recorded with the time of the time zone setting.
3.1.3.1
Setting the time
On the Service screen, press Set Date/Time to set the datalogger date, time and time zone. Check the Enable
Daylight Savings box if you want the datalogger to track daylight savings time.
page 27
Axiom H2 User Manual
3.1.3.2
Operation
Operation with a G5 GOES transmitter
When the datalogger is connected to a G5 GOES transmitter, the datalogger’s time automatically synchronizes
with the high-accuracy, GPS-synchronized clock in the G5 transmitter. Clock synchronization occurs the first
time the G5’s time is synchronized. Clock synchronization also occurs before each test or self-timed G5
transmission and every 24 hours after power on but only if there is a time difference greater than one second
between the datalogger and G5 transmitter. Although the datalogger is synchronized with the G5’s time, the
time zone setting of the datalogger is unaffected. If you want the datalogger time to match the G5 transmitter
time, set the datalogger’s time zone to the UTC setting and do not select the Enable Daylight Savings
checkbox.
3.1.4 Using template and configuration files
Configuration and template files are powerful tools for maintaining a network of dataloggers. Configuration
files allow unique datalogger configurations to be saved or loaded while template files are used to store or
distribute specific data collection algorithms for use in any number of dataloggers.
3.1.4.1
Configuration files
A configuration file encompasses all datalogger details – this includes datalogger specific information such as
site and telemetry parameters as well as general data collection and processing algorithms. Saving the
datalogger’s configuration is useful as it becomes a record which can be used to restore or duplicate a specific
datalogger set-up.
3.1.4.2
Template files
Unlike configuration files, template files do not include datalogger specific information. Template files only
contain the data collection and processing algorithms. This allows a template file to be loaded into several
dataloggers to ensure consistent data sampling on all sites while retaining the specifics of each datalogger. The
datalogger can be preloaded with multiple template files (prior to deployment) so that field selection of the data
collection algorithm can be done through the datalogger’s GUI (no other tools required). Template files can
also be loaded from a USB memory stick or PC.
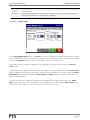
3.1.5 USB connection to a PC
The datalogger can be connected as a slave device through the datalogger’s USB DEVICE port. This section
describes how this feature appears (differently) under Windows XP and Windows 7.
3.1.5.1
Windows XP
The PC automatically senses the datalogger when the connection is made. (A ‘Found New Hardware’ message
appears the first time the datalogger is connected to the PC.)
3.1.5.1.1
Activesync
On a PC running Windows XP, when a datalogger is plugged in, the PC automatically starts an application
called Microsoft ActiveSync. This synchronization program enables the datalogger to function as a USB device
connected to the PC.
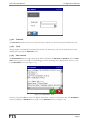
The Microsoft ActiveSync window on the PC should indicate a Guest connection when the datalogger has
been connected to the PC. Choose ‘No’ to partnership on the dialogs which appear shortly after the USB cable
is connected (do not set-up a partnership). If desired, the user can minimize or close the PC’s ActiveSync
page 28
Axiom H2 User Manual
Operation
window. Once the ActiveSync connection is in place, the datalogger appears as ‘Mobile Device’ in Windows
Explorer.
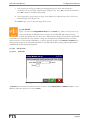
WARNING: FTS strongly recommends against modifying any files in the datalogger accessed
through the ActiveSync connection. Doing so may cause severe problems in the datalogger.
3.1.5.1.2
Remote Display
Once an ActiveSync connection is established with the datalogger, you can use Microsoft’s Remote Display
program to interact with the datalogger GUI through the PC instead of using the datalogger’s touchscreen.
This is an ideal tool to use if the datalogger’s touchscreen has been damaged or if the ambient temperature is
below -20 C and the display is not readable (see the Touchscreen Considerations section of this manual). The
drawback to this tool is that it is slower than using the built-in datalogger touchscreen.
Remote Display requires certain settings for best performance with the datalogger. A customized Remote
Desktop application is available from FTS which has settings preconfigured for optimal use – please contact
FTS for a free copy of the Remote Display application.
3.1.5.2
Windows 7
The PC automatically senses the datalogger when the connection is made. (A ‘Found New Hardware’ message
appears the first time the datalogger is connected to the PC.)
3.1.5.2.1
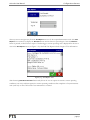
Windows Mobile Device Center
On a PC running Windows 7, an application called Windows Mobile Device Center is available. It does not
start automatically when a datalogger (or other mobile device) is plugged in. It must be started manually, and it
is usually best to start it before plugging in the datalogger.
When Windows Mobile Device Center is running and the datalogger is plugged in, Windows Mobile Device
Center usually (but not always, for reasons not understood) detects it and notifies the user. When it does so, the
datalogger appears as a "WindowsCE" device in Windows Explorer.
WARNING: FTS strongly recommends against modifying any files in the datalogger accessed
through the Windows Mobile Device Center connection. Doing so may cause severe
problems in the datalogger.
3.1.5.2.2
No Windows 7 equivalent of Remote Display
Even though Windows Mobile Center is described as a replacement for Microsoft ActiveSync, it does not
provide exactly the same features and Microsoft Remote Display does not work with it (nor is Remote Display
provided with Windows 7). There is currently no program that provides the same functionality of Remote
Display on Windows 7.
3.1.6 Touchscreen considerations
3.1.6.1
Temperature
When the datalogger is operated at low temperatures (lower than -20 Celsius), the display responds more slowly
than it does at room temperature. Also, the display becomes faint or has low contrast. This is normal for the
display. Although the official specification for low temperature operation of the display is -20 Celsius, we have
page 29
Axiom H2 User Manual
Operation
found that typically the display remains readable until approximately -30 Celsius. When performing a site visit
at temperatures colder than -20 Celsius, the user should bring along a laptop computer so that they can
remotely connect to the datalogger. Note that although the display becomes unreadable at cold temperatures,
this does not affect the datalogger’s operation. The datalogger continues to log the required data and as the
temperature rises, the datalogger display once again becomes readable.
3.1.6.2
Touch
The datalogger’s touchscreen is a sensitive membrane – only the attached stylus or a bare finger should be used
to touch the screen (i.e. do not use a screwdriver, pen, pliers, pocket knife, etc. in place of a stylus).
3.1.6.3
Screen calibration
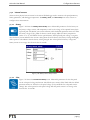
The datalogger’s touchscreen is factory calibrated; however, if you notice that the presses on the touchscreen
do not register in the correct location, then the touchscreen may need to be recalibrated. To recalibrate the
touchscreen, go to the Service screen and press Screen Calibration.
3.1.7 Telemetry connection to a PC
The datalogger can be connected to a PC’s RS-232 port using a CBL-F6H2-TLM-CP cable (available from
FTS) to establish a serial connection (9600 baud, no parity, 8 data bits, 1 stop bit) to the datalogger’s
TELEMETRY port. The serial connection can be used by FTS software (i.e. AutoCaller, StreamTrac, etc.) or by
terminal software (i.e. HyperTerminal) to retrieve data from the datalogger. The TELEMETRY port connection
is not intended for datalogger maintenance (i.e. uploading of datalogger configurations or application software).
The primary purpose of the TELEMETRY port is for telemetry device connections.
3.1.7.1
ASCII data download
Data can be retrieved from the datalogger over using a command line, text based interface. The getdatarange
command can be used to retrieve all data or a range of data stored in the datalogger. Password protection over
the command line interface mirrors password protection in the datalogger. That is, if password protection has
been set in the datalogger then the user is required to enter the appropriate password over the command line in
order to gain access to the logger’s data. The date format specified in the getdatarange command determines
the format of the date field in the returned data (see examples below).
page 30
Axiom H2 User Manual
Operation
Example 1 – mm/dd/yyyy format
C/R
Cmd
Resp
String
getdatarange 10/02/2009 10/04/2009
Data From: H1 at FTS Date: 10/02/2009,00:00:00 to:
10/04/2009,00:00:00
Date,Time,HG
MM/DD/YYYY,HH:MM:SS,m
10/02/2009,18:08:03,1.432
10/02/2009,18:09:04,1.433
10/02/2009,18:10:05,1.43
…
Example 2 – yyyy/mm/dd format
C/R
Cmd
Resp
String
getdatarange 2009/10/02
Data From: H1 at FTS Date: 2009/10/02,00:00:00 to:
9999/12/31,23:59:59
Date,Time,HG
YYYY/MM/DD,HH:MM:SS,m
2009/10/02,18:08:03,1.432
2009/10/02,18:09:04,1.433
2009/10/02,18:10:05,1.435
…
Notes
the getdatarange command does not require that an end date be specified
pressing Ctrl+C on the keyboard during data retrieval will terminate the download
3.1.8 HDL1 datalogger emulation
It is possible for the user to connect to an Axiom H2 datalogger using AutoCaller, StreamTrac, Fire Weather
Plus, Terra Plus, or Toolbox software with the datalogger type set to an HDL1 as the Axiom H2 emulates
certain functions of the HDL1 .
HDL1 calls supported by the Axiom H2 are:
page 31
Axiom H2 User Manual
Operation
logger information request
current conditions request
data request
set date/time request
get date/time request
physical info request
stored data info request
sensor set information request
program information request
get data by tag name
get audit log info
get all audit log messages
get all audit log messages since
get list of user variables
get list of SDI variables
get list of built-in variables
get list of used built-in variables
Note: The Axiom H2 does not use an HDL1 style DLP (Data Logger Program). For this reason it is not
possible to download or upload datalogger configurations to the Axiom H2 datalogger while emulating an
FWS-12 datalogger.
3.2
USB memory stick information
The datalogger has two USB HOST ports which are both capable of interfacing to a USB memory stick (or
keyboard or mouse). A memory stick can be used to save datalogger information as well as provide the
datalogger with application software upgrades.
3.2.1 Requirements
Although data and configuration files are quite small, a minimum 2 GB USB memory stick is recommended for
use with the datalogger as the large capacity ensures ample room for data from many station visits. Any USB
memory stick is compatible with the datalogger’s USB HOST port.
3.2.2 File structure
The Axiom H2 datalogger uses a defined file structure on the memory stick to help with file housekeeping. The
memory stick file structure used by the Axiom H2 datalogger is shown in Figure 3-1.
page 32
Axiom H2 User Manual
Operation
Figure 3-1: Memory Stick File Structure
3.2.2.1
H2 Data Logger folder
The H2 Data Logger folder in the root of the USB memory is the folder in which all Axiom H2 datalogger
information is stored.
3.2.2.2
SW folder
The SW (software) folder is the folder the datalogger examines when the user updates the datalogger’s
application software. A typical application update file would be named F6H2_v229.CAB.
3.2.2.2.1
Custom devices
The Custom Devices subfolder is the folder the datalogger examines when the user updates the datalogger’s
sensor extensions. The sensor extension file for the SDI-AM module is named AmModDll.dll.
3.2.2.3
Template folder
The Template folder is the directory used by the Axiom H2 datalogger when saving or loading template files
from a USB memory stick. A typical default name for a template file is Template-2009-4-9-15-28.xml (format
Template-YYYY-MM-DD-hh-mm); however, the user can specify a filename during the save template process.
3.2.2.4
Station folder
The station folder is the default folder used by the Axiom H2 datalogger if the datalogger’s Station name has
not been specified (i.e. the Station field on the Site tab on the Station Set-up screen is blank). This means that
the default station folder could contain data from several stations (i.e. data from every datalogger whose Station
name has been left blank). If the datalogger has been assigned a Station name, then the datalogger creates a
folder on the memory stick with the same name as the datalogger’s Station name. This way every named
datalogger site has its own station folder in the main Axiom H2 Data Logger folder.
3.2.2.4.1
Config folder
The Config (configuration) subfolder is the directory used by the Axiom H2 datalogger when saving or loading
configuration files from a USB memory stick. A typical default name for a configuration file is Configuration2009-4-9-15-28.xml (format Configuration-YYYY-MM-DD-hh-mm); however, the user can specify a filename
during the save configuration process.
3.2.2.4.2
Data folder
The Data subfolder is the directory used by the Axiom H2 datalogger when exporting data, audit logs, and G5
transmission history files to a USB memory stick. Default file names are as follows:
page 33
Axiom H2 User Manual
Operation
Audit Logs:
AuditLog-YYYY-MM-DD-hh-mm.txt
G5 Tx History TelemA- YYYY-MM-DD-hh-mm.txt
Exported Data <Station Name>-YYYY-MM-DD-hh-mm.csv
3.2.2.4.3
Visit Report folder
The Visit Report subfolder is the directory used by the Axiom H2 datalogger for storing site visit reports and
configuration summary reports to a USB memory stick. Typical file names are as follows:
Start Visit:
StartVisitReport_2009-4-9-13-28.txt
End Visit:
EndVisitReport_2009-4-9-13-57.txt
Configuration Summary: ConfigSummary_2010-8-19-14-47.csv
Note: timestamp format is YYYY-MM-DD-hh-mm format. E.g., 2009-4-9-13-28 denotes April 9, 2009 at
13:28
3.3
Datalogger status
The Axiom H2 datalogger’s Quick Touch System allows the user to quickly assess the datalogger. Status
indicators on the Home screen provide a snapshot of datalogger’s current operating state. The Home screen
also provides easy access to more detailed datalogger status information such as datapoint values (sensor
readings and processing calculations), as well as an audit log file. Additionally, the datalogger time is always
displayed in the upper right corner of the touchscreen to show that the datalogger is functioning.
3.3.1 Home screen status indicators
Home screen status indicators provide information such as sensor activity, transmitter status, battery voltage,
and battery state to allow the user to make a quick assessment as to how the datalogger is operating. The six
status indicators at the bottom of the Home screen are: Built-in, SDI, Trans, Tx, Battery, and Telem (see Figure
1-4).
3.3.1.1
Colour
Meaning
Green
Black
dedicated front panel sensors or internal sensors are being read by the datalogger
no sensor reading activity
3.3.1.2
SDI
Built-in
SDI
is actually two indicators in one, split left and right, for SDI A and SDI B sensor inputs respectively.
Colour
Meaning
Green
Black
SDI A (left) or SDI B (right) sensors are being read by the datalogger
no sensor reading activity
Detailed information on a specific SDI sensor is available through that SDI sensor’s definition screen.
page 34
Axiom H2 User Manual
3.3.1.3
Operation
Trans
indicates G5 GOES transmitter status. This indicator refers to the status of an internal or an externally
connected G5 transmitter.
Trans
Colour
Meaning
Black
Yellow
Green
Red
no status available
the G5’s GPS receiver is on and looking for a GPS fix
G5 is operational
G5 has an error (refer to the Telemetry status screen for more details)
Detailed information on the G5 transmitter is available through the Telemetry G5 Status screen (Home >
Telemetry > Status).
3.3.1.4
Tx
Tx
indicatesthe transmission status of the (internally or externally) connected G5 GOES transmitter.
Colour
Meaning
Black
Red
Green
no G5 transmitter attached or G5 status not available
no G5 transmissions have occurred
data loaded into G5 transmit buffer (black text on green background indicates the combined
number of bytes loaded for self-timed and random transmissions)
Detailed information on the G5 transmitter is available through the G5 Status button in the Telemetry G5
Status screen (Home > Telemetry > Status).
3.3.1.5
Battery
The Battery status indicator has black text which displays the voltage of the battery connected to the
datalogger’s BATTERY input while the background colour displays the charging status of the battery.
Background colours for the Battery indicator are:
Colour
Meaning
Black
Yellow
Green
no status available
the battery is being discharged
the battery is being charged
Detailed information on the BATTERY and SOLAR PANEL inputs are available through their respective
definition screens.
3.3.1.6
Telem
is actually two indicators in one, split left and right, for the Telemetry A and Telemetry B ports
respectively.
Telem
page 35
Axiom H2 User Manual
Operation
Colour
Meaning
Green
Red
Black
datalogger is supplying power to the telemetry port
port power is turned off
power to the port is disabled
3.3.2 Datapoint values
Datapoint values are another source for confirming proper datalogger operation. Datapoints encompass all
sensor readings, Built-in and SDI, as well as all process calculations. Individual datapoints are viewed by
selecting the desired sensor or process from the screens accessed from the Home screen through Sensors, SDI12, or Processes, as appropriate .
3.3.2.1
Current Condition
Screens accessed from the Home screen Current Conditions icon allow the user to define a custom set of
datapoints which can be simultaneously displayed. The datapoints selected for the Current Conditions display
can be manually refreshed or be automatically refreshed every minute (for up to 60 minutes). Built-in sensors
are read every time a manual or automatic refresh event occurs whereas SDI sensors displays the last value read
from the sensor. A process returns the current value of the process at the time the refresh was selected.
3.3.3 Audit log
A chronological summary of significant datalogger events is captured in the datalogger’s audit log text file. The
Audit log is a circular file in which the newest message overwrites the oldest message once the file has reached
its maximum size (20 kB). The audit log file is viewed by pressing Audit Log on the Service screen. The user
can clear the audit log file or save the file to a USB memory stick.
3.4
Data status
To access the Data Status screen (Figure 3-2), press Data on the Home screen.
shows a summary of the data which has been recorded in the datalogger and allows examination of
that data. (“Data Status” does not refer to the quality of the data collected.) The Data Status screen also
provides the user options to configure datalogging or examine recorded data.
Data Status
Figure 3-2: Data Status screen
page 36
Axiom H2 User Manual
Operation
3.4.1 Data storage information
The datalogger stores data in a non-volatile circular 14 MB file. Once the data file is full, the datalogger begins
to overwrite the oldest stored data.
3.4.1.1
Percentage full
A bar graph showing the percentage of the file already used for data storage full is displayed. The percentage
full is a calculation of the actual number of bytes used out of the available for data storage. This bar is typically
green but turns yellow when the datalogger starts to overwrite the oldest data.
3.4.1.2
Capacity
The reported capacity is the estimated number of days of data the datalogger can stored before the datalogger
begins to overwrite the oldest stored data. The capacity estimate is based on the record size stored during each
log event and datalogger’s currently defined Log Intervals.
3.4.1.3
Oldest data
Oldest Data is the date and time of the oldest data currently stored in the datalogger. Oldest Data date and time
is updated when the data file reaches its size limit and the datalogger starts to overwrite the oldest data.
3.4.1.4
Newest data
Newest Data is the date and time of the newest data currently stored in the datalogger. Newest Data date and
time is updated as new data is recorded.
3.4.1.5
Estimated overwrite date
The Est (estimated) Overwrite Date is the date on which the datalogger starts to overwrite data stored in its
circular data file. The estimated overwrite date is based on the capacity estimation and the current date.
3.4.2 Data viewing
The user can examine logged data in tabular or graphical format.
To view and to customize a graph of the available data, use the Data Graph screen (Home > Data > Graph).
To view all logged data in a tabular format, use the Data Table screen (Home > Data > Table).
3.4.2.1
Graph view
Graph View (the Data Graph screen; Home > Data > Graph Data ) is useful for examining a data trend over a
short period of time. While it is possible to graph a large time period, the user should be aware that it may take
the datalogger an extended time to format the graph depending on the number of readings in the selected
range.
To configure the graph (set the date and time range, select the datapoints to display, set the y-axis minimum
and maximum), use the Graph Setup screen (Home > Data > Graph Data > Setup Cog).
3.4.2.2
Table view
Table View (the Data Table screen; Home > Data > Display Table)is useful for examining specific data values,
presented in a tabular format. The user is able to resize the data columns as well as reposition the data columns,
by drag and drop, so that they can easily compare datapoint values.
page 37
Axiom H2 User Manual
Operation
The Jump button on the Data Table screen allows the user to go to a specific time in the logged data.
3.4.3 Data operations
To export selected logged data to a USB memory stick, or to delete the datalogger’s logged data file, use the
Download Data screen (Home > Data > Download Data).
3.4.3.1
Downloading stored data
To download data, use the Download Data screen (Home > Data > Download Data). Specify the date range and
file format (either CSV or binary) to save to a USB memory stick. The requested data is downloaded (saved) to
the memory stick inserted in the USB HOST port when Download is pressed.
The download process does not delete the original data from the datalogger.
3.4.3.2
Deleting stored data
To delete the datalogger’s stored data, press Delete on the Data Status screen (Home > Data). The user is
prompted to confirm the data deletion after Delete is pressed.
WARNING ! Deleting the data PERMANENTLY removes the data from the datalogger.
3.4.4 Remote datalogger communication
Data and datalogger information can also be remotely retrieved from the datalogger using a variety of telemetry
devices. Please contact FTS for assistance in choosing the telemetry option appropriate for your application.
3.5
Telemetry status
The datalogger has two Telemetry ports (A and B) which support simultaneous connection of two telemetry
devices. To view a summary of device status for both telemetry ports (Figure 3-3) use the Telemetry screen
(Home > Telemetry). The displayed status depends on the telemetry port’s Device Type setting.
Figure 3-3: Telemetry screen
There are several telemetry devices that are supported: a generic device type named FTS; a specific device type
for the G5 GOES Transmitter named G5, a specific device type for AirTalk named RVT2, and a specific device
type for the Radio Voice Transmitter named RVT. The option of None is also available in the Device Type
page 38
Axiom H2 User Manual
Operation
selection list. Selecting None as the port’s telemetry device type disables the telemetry port by turning off port
power as well as disabling all port communications.
To view detailed information for the attached telemetry device, press the port’s Status button on the Telemetry
screen.
Figure 3-4: Example Telemetry Status screen
3.5.1 FTS telemetry
The FTS device type is the default selection for all telemetry devices other than the G5 GOES Transmitter or
RVT Radio Voice Transmitter. The FTS device type selection configures the telemetry port for serial
communications at 9600 baud with 8 data bits, 1 stop bit, no parity, and no flow control. The status of the
attached telemetry device is not displayed when this device type is selected.
Refer to the Specifications section of this manual for details on the TELEMETRY connector.
3.5.2 G5 GOES transmitter
The G5 device type is specific to the G5 GOES Transmitter. Basic status of the attached G5 transmitter is
displayed when this device type is selected (see Figure 3-4). The same status information is displayed whether
the G5 is internally or externally connected to the datalogger. For an internally connected G5, telemetry port A
is automatically set to the G5 device type. For an externally connected G5, the device type on the port to which
the G5 is connected must be properly set.
Press Status for more detailed information from the G5 transmitter. Refer to the G5 Telemetry Reference
section for a detailed description of the G5 interface.
3.5.3 AirTalk
The AirTalk device type is specific to and should only be used with the FTS AirTalk Radio Voice Transmitter.
Refer to Chapter 9 for detailed AirTalk configuration instructions and for status information provided by
Status.
3.5.4 Radio voice transmitter (RVT)
The RVT device type is specific to and should only be used with the FTS RVT Radio Voice Transmitter.
page 39
Axiom H2 User Manual
Operation
Refer to Chapter 9 for detailed RVT configuration and status information provided by Status.
page 40
Chapter 4
Installation
Chapter contents
4.1
4.2
Preparation .................................................................................................................................. 42
At the site ..................................................................................................................................... 43
4.2.1
Unpacking
4.2.2
FTS enclosure mounting
4.2.2.1
Other enclosures
4.2.2.2
Grounding
4.2.3
Sensor and telemetry connections
4.2.3.1
Connecting the dedicated rain sensor
4.2.3.2
Connecting SDI sensors
4.2.3.3
Connecting telemetry
4.2.4
Power connections
4.2.4.1
Battery connection
4.2.4.2
Solar panel connection
4.2.4.3
Datalogger power cycling sequence
4.2.5
Operational check
Axiom H2 User Manual
4.1
Installation
Preparation
Preparation is the best way to ensure a smooth field installation. Time spent in the confines of a clean, dry,
warm office preparing for your installation trip ensures that you are familiar with your datalogger configuration
and that you have all of the necessary cables and equipment. Not only is proper preparation more desirable
than performing last minute on-site changes, proper preparation should eliminate the need for a second site
visit to repair or install something that was overlooked.
Before you go
There are several steps that should be performed prior to deploying the datalogger to an existing site or
installing the datalogger as part of a new station.
1.
Develop a pre-trip checklist and a toolkit checklist and update the lists as necessary.
2.
Develop an on-site activity checklist to ensure all tasks are completed. It is always easy to feel pressure
to complete on-site work as quickly as possible (i.e. a helicopter is waiting, light is fading, weather is
coming, etc.), an on-site checklist will help ensure that, in the rush, nothing was forgotten.
3.
Record the site’s magnetic declination as this information is required for antenna and sensor
orientation.
4.
If you are installing a datalogger with a GOES transmitter (internal or external), ensure you have the
required GOES parameters for your assignment (NESID, channel number, East or West satellite,
transmit interval, and transmit offset).
5.
Unpack and inspect the equipment for obvious mechanical damage (i.e. was it damaged during
shipping).
6.
Power the datalogger and confirm the datalogger’s configuration and operation. When possible, attach
a full suite of sensors and telemetry devices and then call/monitor the datalogger through the attached
telemetry (i.e. monitor a few GOES transmissions to confirm operation). This will help you ensure
that all the required cables and equipment has been identified and that the datalogger, sensors, and
telemetry are configured and are operational and are working to your expectations.
7.
Record the model and serial numbers of your datalogger and other equipment that will be field
deployed and enter the serial numbers of the equipment into the datalogger’s serial number table. Also
record the software version in each device. Contact FTS if you suspect or are unsure if a software
upgrade is required for a particular device.
8.
If deploying the datalogger to an existing site, check the condition of the site’s battery. Check the
battery install date to see if the battery is due for replacement and examine existing battery data to
check the condition of the unit.
9.
After your office testing is complete, pack the datalogger and other equipment appropriately for
transport to the field site.
10.
Check forecasted weather for the site.
11.
Arrange for standby personnel to check/verify telemetry transmissions while you are on-site.
12.
Update your checklists with any of your findings
page 42
Axiom H2 User Manual
4.2
Installation
At the site
Once at the site, ensure the site is safe – check the site for obvious hazards and deal with them appropriately. If
this is an existing site, survey the equipment for any malfunctions or incorrect sensor or antenna orientations –
record your findings.
4.2.1 Unpacking
Check for transport damage when unpacking the datalogger. Though the datalogger’s display is waterproof,
care should be taken to avoid contact with sharp objects which could damage the touchscreen. Also, do not
leave the display exposed in full sun for long periods of time as this may damage the display. A good practice is
to keep the datalogger in its shipping package until you are ready to install the datalogger in the enclosure.
4.2.2 FTS enclosure mounting
A mounting plate for the datalogger is fastened to the back of most FTS enclosures. Decide the positioning of
the datalogger and the other equipment being installed, then just place the datalogger over the appropriate
keyhole slots and slide it down into place (see Figure 4-1).
Connect one of the green grounding wires from the mounting plate to the datalogger ground stud.
G5 HDR
GOES TRANSMITTER
H2
DATALOGGER
A
USB DEVICE
TELEMETRY
SYNCHRONIZING CLOCK TO GPS
USB
DATA IN BUFFER
B
TRANSMITTING
FAULT
DIAGNOSTICS
RAIN
SDI A
SDI C
SOLAR PANEL
GROUND
SDI B
SDI D
BATTERY
GPS
ANTENNA
TELEMETRY
GOES
ANTENNA
GROUND
RMX MODEM
RADIO TRANSCEIVER
GND
0-5V
EX 2
(20mA max)
COUNTER
GND
COUNT
EX 1
(20mA max)
GND
0-5V
NETWORK DETECT
CARRIER DETECT
4 - 20 mA
V+
VGND
4 - 20 mA
ANALOG 1
V-
ANALOG 3
V+
GND
SYNCHRONIZATION DETECT
TRANSMIT
GND
12 V
POWER 1
(0.5A max)
12 V
POWER 2
(0.5A max)
GND
DISPLAY CONTROL
4 - 20 mA
V+
VGND
4 - 20 mA
ANALOG 2
V-
ANALOG 4
V+
GND
SDI-AM
RF ANTENNA
MODEM
DATALOGGER
POWER
4 CHANNEL
ANALOG
INPUT MODULE
GND
Figure 4-1: Keyway Enclosure
page 43
Axiom H2 User Manual
4.2.2.1
Installation
Other enclosures
Depending on the nature of the enclosure, the datalogger can be mounted to either a keyhole mounting panel
which is fastened to one wall of the enclosure or the datalogger can be directly mounted to the enclosure wall.
Contact FTS to determine which option, keyway panel (FTS part number 993-UCMT-PNL-x) or mounting
adapter (FTS part number 993-UCASE-BKT) would best suit your needs.
4.2.2.2
Grounding
The Axiom H2 datalogger has built-in lightning protection circuitry. This protection can be aided by the
connection from the datalogger chassis to a single point ground. There is a ground stud on the datalogger that
accepts one of the one of the green grounding wires from the mounting plate. The enclosure’s ground lug
(located on the outside at the back of the enclosure) should be connected to the nearest ground or radial
connection. The enclosure’s ground cable should always be run as low as possible and be free of any kinks or
sharp bends (refer to your local code requirements).
All FTS Forest Technology Systems sensors used shielded cable. If the datalogger chassis is well grounded, the
sensor cables is shielded as well.
4.2.3 Sensor and telemetry connections
The datalogger is watertight, even without connectors attached. Device connectors (sensors and telemetry) are
circular metal shell, bayonet, military style connectors which are uniquely keyed and colour coded to minimize
erroneous connections. When connecting the various devices to the datalogger, ensure that the connectors are
dry and free of debris so that no water or dirt gets trapped between the connectors. Connector pin-outs and
sensor input specifications are defined in Specification section of this manual.
4.2.3.1
Connecting the dedicated rain sensor
The Axiom H2 datalogger has a dedicated rain gauge input on the datalogger front panel (colour coded with a
blue ring around the connector). Normally rain gauges are provided by FTS with the appropriate mating
connector; however, if required, details for the RAIN input connection can be found in the Specifications
section of this manual.
4.2.3.2
Connecting SDI sensors
SDI sensors from a variety of manufacturers are supported. If the sensor was supplied by FTS with a
datalogger then it will be programmed with its final parameters and system address. Otherwise you must
remember to program the sensor to its final address and set up any programmable characteristics that you need.
The procedure to do this varies from manufacturer to manufacturer. Alternately, you can arrange to send your
sensor to FTS for programming and connector installation.
Remember, to avoid incorrect or missing sensor readings, set the sensor address, command, and reading field
information in the datalogger’s SDI sensor configuration for the desired sensor reading.
SDI sensors supplied by FTS have a colour coded, three pin, waterproof, military style connector attached, so
all that is necessary is to connect the sensor to the datalogger and set the sensor’s configuration in the
datalogger.
If you have a sensor with bare wires, it is necessary to solder the correct connector to the cable. See the
Specifications section for the correct connector and pin-out.
page 44
Axiom H2 User Manual
Installation
If you are using junction blocks for signal and power distribution, it is very important that any junctions be in a
dry, condensation free environment. If the junction is in a damp location, then there is accelerated corrosion of
the wires and connections, and the communications with the sensors becomes unreliable or fail.
4.2.3.3
Connecting telemetry
The Axiom H2 datalogger has a built-in power management system which provides power to the telemetry
device connected to either front panel TELEMETRY port. Connector pin-out and signal definitions are defined
in Specification section of this manual.
4.2.3.3.1
Existing telemetry devices
When upgrading a site to an Axiom H2 datalogger, telemetry devices existing at the site might be powered
from the battery. These telemetry devices can have their military connector connected to an Axiom H2 front
panel TELEMETRY port. Directly powering the telemetry device from the battery and then connecting it to the
Axiom H2 will not cause any damage as the Axiom H2 has blocking diodes on both ports to isolate telemetry
port power.
4.2.4 Power connections
As previously mentioned, power connections for the Axiom H2 datalogger are the SOLAR PANEL input and
the BATTERY input. The BATTERY input is the power source for the datalogger while the SOLAR PANEL input
is used by the internal power management system to charge the connected 12V battery.
4.2.4.1
Battery connection
The system’s 12V battery is connected to the datalogger’s front panel BATTERY connector by a custom battery
cable available from FTS. The BATTERY connector is the power source for the datalogger. The battery cable’s
ring terminals should always be connected to the battery before the battery cable is connected to the datalogger.
Also, to ensure proper power-up, the battery should always be connected to the datalogger before connecting
the solar panel. The battery connection procedure is outlined below.
WARNING ! The battery cable fuse will blow if the battery connections are reversed.
The correct procedure for connecting the battery power is as follows:
1.
Connect the battery cable to the battery by bolting each of the cable ring terminals to the appropriate
battery terminal. The ring terminal with the red wire and the fuse holder goes to the positive (+) side
of the battery. The other ring terminal with the black and white wires goes to the (-) side of the battery.
Contact FTS to discuss cabling considerations for the parallel connection of batteries if dual batteries
are required at the site.
2.
Mount the temperature sensor to the battery by taping it to the top of the battery using foam tape or
duct seal putty. The sensor is mounted between the two battery posts.
3.
Route the cable around behind the shelf above the battery, and plug the cable’s military connector into
the datalogger’s BATTERY input. The datalogger backlight should illuminate and the datalogger will
start-up (note that the datalogger requires about 90 seconds to start). Verify that the battery is
connected properly by observing the battery voltage reading on the datalogger GUI. If the backlight
does not come on and the datalogger does not start, then disconnect the battery power connector
from the datalogger front panel and check the battery cable fuse and connections.
page 45
Axiom H2 User Manual
4.
Installation
Once the battery is connected properly, connect the solar panel to the solar panel input. Use the
datalogger GUI to verify proper solar panel operation by reading the battery and solar panel voltage
and current. Also, the battery voltage is displayed on the home screen battery status indicator.
4.2.4.2 Solar panel connection
The system’s solar panel is connected to the datalogger’s front panel SOLAR PANEL connector. The solar panel
connector is the power source for recharging the battery connected to the datalogger. To ensure proper
datalogger power-up, the solar panel should always be connected to the datalogger after the datalogger’s battery
connection has been made.
Normally solar panels are provided by FTS with the appropriate mating connector. If required, details for the
solar panel connection can be found in the Specifications section of this manual.
4.2.4.3
Datalogger power cycling sequence
The power source for the datalogger is the battery that is connected to the datalogger’s front panel BATTERY
input. That being said, it is possible to power the datalogger from the datalogger’s front panel SOLAR PANEL
input; however, this practice is not advisable as power from the solar panel is intermittent. Because the
datalogger has two inputs which can power the datalogger, there is a proper procedure for power cycling the
datalogger to ensure proper start-up and shutdown.
4.2.4.3.1
Start-up Power Sequence
The correct power on sequence for the datalogger is:
1.
Ensure the battery cable is properly connected to the battery.
2.
Connect the battery cable to the datalogger’s BATTERY input.
3.
Connect the solar panel cable to the datalogger’s SOLAR PANEL input.
4.2.4.3.2
Shutdown power sequence
The correct power off sequence for the datalogger is:
1.
Disconnect the solar panel cable from the datalogger’s SOLAR PANEL input.
2.
Disconnect the battery cable from the datalogger’s BATTERY input.
3.
If power cycling the datalogger, wait a minimum of 5 seconds before reconnecting the datalogger’s
BATTERY input.
4.2.5 Operational check
Perform an operational check of the equipment once the datalogger and ancillary equipment has been installed.
The operational check should include:
1.
Check to confirm that the datalogger’s date and time is correct.
2.
Read each of the sensors by observing their displayed sensor reading.
3.
Check to ensure data is being logged by observing logged data in the data table.
4.
Perform a telemetry test to ensure each telemetry device is functional.
page 46
Axiom H2 User Manual
5.
Installation
Save a visit report to your USB memory stick so that you have a record of the serial numbers of the
equipment currently installed at the site (assuming you have populated the serial number table in the
datalogger).
page 47
Chapter 5
Maintenance
Chapter contents
5.1
5.2
5.3
General ........................................................................................................................................ 49
5.1.1
Battery type
5.1.2
Touchscreen care
5.1.3
Touchscreen recalibration
5.1.4
Datalogger shipping
Datalogger update ....................................................................................................................... 49
5.2.1
Application
5.2.2
Sensor extensions
Site visit ....................................................................................................................................... 50
5.3.1
Site visit procedure
5.3.2
Serial number table
5.3.3
Visit report
5.3.3.1
Start/end visit
5.3.3.2
Technician
5.3.3.3
Trip number
Axiom H2 User Manual
5.1
Maintenance
General
Very little maintenance is required for the Axiom H2 datalogger. Do not remove the front panel as there are no
user serviceable parts inside the datalogger. All software upgrades can be performed externally using the
datalogger’s USB HOST ports. The user should ensure that the battery is in good condition and that the
touchscreen is free of debris.
Please contact FTS Technical Support if the datalogger fails to operate properly.
5.1.1 Battery type
A 12 V, absorbed glass mat, deep cycle battery rated at 90 to 105 Amp Hours capacity is recommended for use
with the datalogger. Deep-cycle batteries are designed to be deeply discharged and then recharged without
damage. Automotive type batteries are not suitable for remote environmental monitoring. Battery life cycle
management (we recommend that you replace the battery every 5 years) helps your station provide years of
reliable operation.
5.1.2 Touchscreen care
Do not use any solvents on the touchscreen. To clean the touchscreen, wipe the touchscreen with a soft, dry
cloth. Only the stylus attached to the datalogger or your bare finger should be used to touch the screen.
5.1.3 Touchscreen recalibration
The datalogger’s touchscreen is factory calibrated; however, if you notice that the presses on the touchscreen
do not register in the correct location, then the touchscreen may need to be recalibrated. To recalibrate the
touchscreen press Screen Calibration on the Service screen.
5.1.4 Datalogger shipping
In the event the datalogger needs to be returned to FTS, take precautions to protect the datalogger’s display
during shipping. Whenever possible, return the datalogger using the original factory packaging.
5.2
Datalogger update
To update software in the datalogger from a USB memory stick, press Home > Service > Datalogger Update.
Application software, used to run the datalogger, and Sensor Extensions, which provide advanced sensor setup functionality, can be independently updated from the Datalogger Update screen.
5.2.1 Application
The Application is the program which runs the datalogger and provides the GUI and the functionality for the
user to configure the datalogger to their requirements. The version of the application currently running the
datalogger is displayed in the Version tab of the Station Set-up screen (Home > Station).
Refer to the Datalogger Update portion of the Configuration Reference section for details on upgrading the
datalogger’s Application Software.
5.2.2 Sensor extensions
Each Sensor Extension provides advanced set-up functionality for a specific sensor. For example, the sensor
extension for Forest Technology System’s SDI-AM 4 channel analog module provides a convenient set-up
page 49
Axiom H2 User Manual
Maintenance
GUI which allows the user to configure the sensor without needing to learn the module’s low level SDI-12
commands. Sensor extensions are automatically installed on the datalogger during an application update; sensor
extensions can also be added incrementally as they are developed.
To update, remove, or add sensor extensions, use the Sensor Extensions screen (Home > Service > Datalogger
Update > Sensor Extensions).
Refer to the Datalogger Update portion of the Configuration Reference section for Sensor Extension details.
5.3
Site visit
Facilities exist to help ensure information gathered from the station during a site visit is complete. The
datalogger has an internal serial number table which can be used to record serial numbers of the equipment
used at the site. Also a visit report feature allows the user to download a log of relevant datalogger information
at the start and end of the site visit.
5.3.1 Site visit procedure
The following procedure is recommended when visiting the site:
1.
Survey the site to ensure the site is safe - check the site for obvious hazards and deal with them
appropriately.
2.
Survey the equipment for any malfunctions or incorrect sensor or antenna orientations and record
your findings.
3.
Insert your memory stick into one of the datalogger’s USB HOST ports.
4.
Go to the Visit Report screen (Home > Service > Visit Report), enter your name in the technician box
and press the Start Visit button. This will record the station’s current operating state.
5.
Perform the required service work and have a colleague at the office ensure telemetry transmissions are
functional.
6.
Update the Serial Number Table in the datalogger (Home > Service >Serial # Table) to accurately
reflect the equipment installed on the site.
7.
Go to the Visit Report screen (Home > Service > Visit Report) and press the End Visit button. This will
record station’s operating state at the end of your visit.
5.3.2 Serial number table
The Serial Number Table (Home > Service >Serial # Table), allows the user to enter serial numbers of the
sensors, telemetry, and other equipment associated with the site. The serial number table is a convenient way of
tracking equipment used at the site as it is automatically included in visit reports.
The datalogger can automatically load the serial number from devices which are capable of reporting their serial
number (i.e., some SDI sensors and telemetry equipment). Serial numbers of devices which are not capable of
automatic reporting can be entered manually.
To remove a sensor from the serial number table, press the delete button then select the desired device in the
list. Confirm that this is the serial number you wish to remove.
Refer to the Serial Number Table portion of the Configuration Reference section for details.
page 50
Axiom H2 User Manual
Maintenance
5.3.3 Visit report
The Visit Report screen (Home > Service > Visit Report) allows the user to save the station’s current operating
state to an automatically chosen station folder on the connected USB memory stick.
The information saved in the station’s folder on the memory stick includes:
A time-stamped text report of the datalogger’s current operating state.
A time-stamped datalogger configuration file.
A time-stamped download of the datalogger’s audit log file.
A time-stamped configuration summary report in CSV format.
If applicable, a time-stamped download of the transmission history (Tx Log) of the attached G5
transmitter.
In addition, the current operating state text report is displayed for the user each time the Start/End Visit button
is pressed. The text report includes the following:
5.3.3.1
Visit details (i.e. technician, trip number, and date)
Datalogger details (i.e. station name, model, version information, etc.)
Power supply information (i.e. battery voltage, battery current, solar panel voltage etc.)
Serial number table
Telemetry information
Current conditions
Start/end visit
The Start / End Visit button on the Service Report screen toggles between Start Visit and End Visit as a
reminder to the user of where they are in the site visit process. The same information is saved for both reports
(the exception is that the length of the visit is included in the End Visit text report).
5.3.3.2
Technician
The Technician box allows the user to enter their name or initials as a record of who performed the site visit.
5.3.3.3
Trip number
The trip number automatically increments from the last visit. If this number is not correct, the user can
manually enter a trip number before pressing the Start Visit button.
page 51
Chapter 6
Configuration structure
Chapter contents
6.1
6.2
General ........................................................................................................................................ 53
Operating algorithms ................................................................................................................... 53
Axiom H2 User Manual
6.1
Configuration structure
General
The three basic building blocks used to configure the datalogger are sensors, processes, and outputs (see Figure
6-1).
Sensors (dedicated, internal, or SDI) are configured to provide datapoints which then can be processed or
output as required.
A process performs an operation on select datapoints and then creates a new datapoint or set of datapoints
which then can then be processed again or output as required.
An output either displays, logs, or transmits datapoints as specified by the user.
Figure 6-1: Datalogger Configuration Structure
When configuring the datalogger sensors should always be configured first as sensors provide the primary data.
The next step is to configure the desired processes (i.e. averaging, max/min, user variables, functions and
scripts) to manipulate the sensor data. The last step is to configure the datalogging (i.e. define what data is to be
stored and when) and telemetry parameters (i.e. for a G5 GOES transmitter, set-up the transmission
parameters and the data to be transmitted).
IMPORTANT ! When configuring the datalogger, sensors should always be configured first,
followed by processes, and lastly outputs.
6.2
Operating algorithms
There are five separate algorithms running in the datalogger (see Figure 6-2). Each algorithm runs
independently and with its own timing. The algorithms determine when data is collected and how the data is
handled within the datalogger.
page 53
Axiom H2 User Manual
Configuration structure
DATA ACQUISITION LOOP
SDI LOOP
DISPLAY LOOP
TRANSMIT LOOP
CURRENT CONDITIONS LOOP
Figure 6-2: Datalogger Operating Algorithms
The Data Acquisition Loop performs the following tasks in the order they are listed:
1.
Read the datalogger’s Internal and Dedicated sensors
2.
Run the datalogger’s processes
3.
Log the data
4.
Write data to the Transmit buffer
The timing of the Data Acquisition Loop is set by the most frequent process, log interval, or transmit message
interval.
The SDI Sensor Loop reads the defined SDI sensors. The timing of the SDI Sensor Loop is set by the SDI
sensor which is read most often.
The Transmit Loop is responsible for G5 GOES data transmission. The Transmit Loop sends the contents of
the transmit buffer to the G5 transmitter 90 seconds prior to the G5 transmit time. The timing of the Transmit
Loop is set by the G5 transmission frequency. In order to meet timing requirements for transmission, data
should be sent to the transmitted buffer at least two minutes prior to the G5 transmit time.
The Display Loop is updates the displayed sensor values approximately every 5 seconds.
The Current Conditions Loop is run as needed. The loop is run when Refresh on the Current Conditions
screen is pressed or when a Current Conditions telemetry request is received.
page 54
Chapter 7
Configuration reference
Chapter contents
7.1
7.2
7.3
General ........................................................................................................................................ 58
Station set-up............................................................................................................................... 58
7.2.1
Site tab
7.2.1.1
Station
7.2.1.2
Description
7.2.1.3
Location
7.2.2
Version tab
7.2.2.1
Model
7.2.2.2
Serial number
7.2.2.3
Date of manufacture
7.2.2.4
Application version
7.2.2.5
Operating system version
7.2.3
Set-up Tab
7.2.3.1
Save configuration
7.2.3.2
Load configuration
7.2.3.3
View configuration summary
7.2.3.4
Clear Configuration
7.2.4
Power management tab
Service ......................................................................................................................................... 66
7.3.1
Screen calibration
7.3.2
Set date / time
7.3.2.1
Date
7.3.2.2
Time
7.3.2.3
Time zone
7.3.2.4
Enable daylight savings
7.3.2.5
G5 GOES transmitter time synchronization
7.3.3
Passwords
7.3.3.1
User level
7.3.3.2
Tech level
7.3.4
Logout
7.3.5
Datalogger update
7.3.5.1
Application
7.3.5.2
Sensor extensions
Axiom H2 User Manual
Configuration reference
7.3.6
7.4
7.5
7.6
Audit log
7.3.6.1
Save
7.3.6.2
Delete
7.3.7
Serial number table
7.3.8
Visit report
7.3.8.1
Technician
7.3.8.2
Trip #
7.3.8.3
Start / end visit
Sensors ........................................................................................................................................ 77
7.4.1
Restrictions on sensor datapoint names
7.4.2
Internal sensors
7.4.2.1
Battery
7.4.2.2
Solar
7.4.2.3
Case temperature
7.4.3
Dedicated sensors
7.4.3.1
Rain
7.4.4
SDI sensors
7.4.5
Sensor extensions
7.4.5.1
Stage
7.4.5.2
SDI-PT (Pressure Transducer)
7.4.5.3
Shaft Encoder
7.4.5.4
Tavis
7.4.5.5
Setting and clearing the stage offset in stage sensors
7.4.5.6
SDI-AM
7.4.5.7
SDI-RMY
7.4.6
Deleting sensors
SDI sensors ................................................................................................................................. 107
7.5.1
Detecting SDI sensors
7.5.2
SDI sensor problem resolution
7.5.2.1
Changing a detected SDI sensor’s address
7.5.2.2
Mapping SDI sensors
7.5.2.3
Configuring a new SDI sensor
7.5.3
Recognized SDI sensors
7.5.3.1
FTS manufactured sensors
7.5.3.2
Other sensors
7.5.4
SDI transparent mode
7.5.4.1
Notation for SDI commands
7.5.4.2
Common SDI commands
Processing ................................................................................................................................... 117
7.6.1
Built-in date and time datapoints
7.6.2
Restrictions on process (datapoint) names
7.6.3
Maximum and minimum
7.6.3.1
Setup screen
7.6.3.2
Example
7.6.4
Peak wind
7.6.4.1
Timed Peak Wind
7.6.4.2
Running Peak Wind
7.6.5
Delta
7.6.6
Average
7.6.7
User variable
7.6.8
Function
7.6.8.1
Built-in mathematical operators
7.6.8.2
Loading from a file
7.6.9
Script
page 56
Axiom H2 User Manual
Configuration reference
7.6.9.1
Built-in logical operators
Threshold sampling
7.6.10.1 Threshold sampling user variables
Data ............................................................................................................................................133
7.6.10
7.7
page 57
Axiom H2 User Manual
7.1
Configuration reference
General
Eight menu icons are present on the Home screen (Figure 7-1). Each icon accesses screens to configure or view
information related to a particular subarea of the datalogger’s functionality.
This reference section provides a detailed explanation of options for each subarea.
Figure 7-1: Home screen
7.2 Station set-up
Station information encompasses all of the aspects which are unique to a particular
datalogger. The Station icon on the touchscreen allows the user to view and edit datalogger
site information, to view datalogger version information, and also allows the user to load and
save datalogger configuration and template files.
7.2.1 Site tab
The Station Set-up screen Site tab (see Figure 7-2) identifies the datalogger’s name, description and location.
Figure 7-2: Station Set-up screen – Site Tab
page 58
Axiom H2 User Manual
7.2.1.1
Configuration reference
Station
Although every datalogger is identified by its serial number, the operator can enter a station name and a
description specific to the site or type of station deployment. Virtually any alpha-numeric text string can be a
station name. The datalogger displays a single line of 15 to 22 characters (depending on which characters are
used) for the station name.
7.2.1.2
Description
Like the station name, station description is also a text field. The datalogger displays three lines of characters in
a scrollable textbox for the station description.
7.2.1.3
Location
Station location fields include latitude, longitude, elevation and declination. If the datalogger is attached to an
FTS G5 GOES transmitter then the station location fields are read-only fields as this information is provided
by the G5 transmitter. If the datalogger is not connected to a G5 transmitter, the user can manually enter the
appropriate information.
7.2.1.3.1
Latitude and longitude
Station latitude and longitude are entered and reported in degrees-minutes-seconds (dms) format of ddº mm”
ss.s’ D where D is either N or S for latitude or E or W for longitude.
7.2.1.3.2
Elevation
Station elevation is entered and reported in metres, feet, or inches (the units are user selectable).
7.2.2 Version tab
The Station Set-up screen Version tab (see Figure 7-3) displays read-only details such as the datalogger’s model
and serial number as well as software versions. These fields are populated automatically by the datalogger.
Figure 7-3: Station Set-up screen – Version Tab
7.2.2.1
Model
This is the model assigned to the datalogger during the manufacturing process.
7.2.2.2
Serial number
This is the serial number assigned to the datalogger during the manufacturing process.
page 59
Axiom H2 User Manual
7.2.2.3
Configuration reference
Date of manufacture
The manufacturer date identifies when the datalogger was produced at FTS. The Date of Manufacture is
reported in MM / DD / YYYY format.
7.2.2.4
Application version
The Application Version identifies the datalogger’s application software – it does not identify how the
datalogger is configured (i.e. which sensors are attached, what data is logged, or what telemetry is attached,
etc.). Application software can be field updated via a USB memory stick (refer to the Maintenance section of
this manual for details).
7.2.2.5
Operating system version
The datalogger uses Microsoft Windows CE as its operating system (OS). The OS version identifies which of
the Windows CE components were put together for the operating system running on the datalogger. The user
is not able to update the datalogger’s OS; however, OS upgrades can be done at the factory or by FTS field
service personnel.
7.2.3 Set-up Tab
The Station Set-up screen Set-up tab (see Figure 7-4) enables the user to save and load a datalogger set-up.
There are two types of set-up files: configurations and templates. The difference between a configuration and a
template is that a configuration contains datalogger site specific information (i.e. a station name and position as
well as telemetry specific parameters) along with the general set-up information (i.e. sensor and processing
definitions, datalogging intervals, transmit message, etc.) while a template only contains the general set-up
information. Both file types contain all the information required for data collection but only the Configuration
file contains the extra information required to uniquely identify the datalogger and enable GOES transmissions.
The Set-up tab also provides the ability to view a summary of the datalogger’s configuration and the ability to
clear a configuration.
Figure 7-4: Station Set-up screen – Set-up Tab
7.2.3.1
Save configuration
To save the datalogger’s active configuration or to save the active configuration as a template, use the Save
Configuration File screen (Figure 7-5; Home > Station > Set-up tab > Save Configuration).
page 60
Axiom H2 User Manual
Configuration reference
Figure 7-5: Save Configuration File screen
7.2.3.1.1
Save file name
The Save File Name box specifies a name for the file to be saved. Configuration files is given a default name of
Configuration-YYYY-MM-DD-hh-mm-ss.xml. Template files are given a default name of Template-YYYYMM-DD-hh-mm-ss.xml. The file name changes to the default name each time a different save option is
selected. The default name automatically populated in the Save File Name box can be overridden by the user.
7.2.3.1.2
Save to USB station folder
The Save to USB Station Folder option (default selection) automatically saves the configuration file in the
Station’s Config folder on the USB memory stick. The station folder on the memory stick has the same name
as the datalogger. If the datalogger does not have a station name (i.e. the station name is blank), then the name
‘station’ is used as the folder name. The file that is saved has the file name entered in the Save File Name box.
7.2.3.1.3
Save to USB template folder
The Save to USB Template Folder option automatically saves a template file in the Template folder on the USB
memory stick. The file that is saved has the file name entered in the Save File Name box.
7.2.3.1.4
Save to local template folder
The Save to Local Template Folder option automatically saves a template file in the datalogger’s internal
template folder. The file that is saved has the file name entered in the Save File Name box.
7.2.3.2
Load configuration
To load a template that is stored on the datalogger or load a configuration or template from a USB memory
stick, use the Load Configuration File screen (Figure 7-6; Home > Station > Set-up tab > Load Configuration).
The screen automatically displays the contents of folder appropriate to the Load From … option selected. To
search for and select any file in the datalogger or on USB, press Browse .
page 61
Axiom H2 User Manual
Configuration reference
Figure 7-6: Load Configuration File screen
7.2.3.2.1
Load from USB station folder
The Load from USB Station Folder option (default selection) automatically examines the station’s Config folder
on the USB memory stick. If the datalogger does not have a station name (i.e. the station name is blank), then
the name ‘station’ is used as a default station name. The file selection box lists the configuration files available.
Typically the station’s Config folder on the USB device contains configuration files previously saved from this
datalogger. Select the configuration to load and press OK.
7.2.3.2.2
Load from USB template folder
The Load from USB Template Folder option automatically looks in the Template folder on the USB memory
stick. The file selection box lists the template files available. Select the template to load and press OK. Typically
the template folder on the USB device contains templates for different datalogger configurations.
Remember templates do not contain site specific datalogger information. Loading a template does not affect
site specific information already in the datalogger but, if configuring the datalogger for the first time, the user
must enter the required site specific information.
7.2.3.2.3
Load from local template folder
The Load from Local Template Folder option works the same as the Load from USB Template Folder option
except that the file selection box automatically points to the datalogger’s internal Template folder.
7.2.3.2.4
Browse
When loading a file, Browse allows the user to select a specific file located outside of the preselected folder.
7.2.3.3
View configuration summary
The Configuration Summary screen (Home > Station > Set-up tab > View Config Summary) provides the user
with a basic configuration summary of the sensors and processes defined in the datalogger (see Figure 7-7,
Figure 7-8, and Figure 7-9).
Note that when the user performs a site visit, the information displayed on the configuration summary screens
is written to a time-stamped csv file in the station’s folder on the USB memory stick along with the other site
visit files.
page 62
Axiom H2 User Manual
7.2.3.3.1
Configuration reference
Sensors
The Configuration Summary screen – Sensors tab provides information on the datalogger’s dedicated and
internal sensors. Sensors and their datapoint names and values as well as if the datapoint is being logged or
transmitted are shown (see Figure 7-8).
Figure 7-7: Configuration Summary screen – Sensors tab
Column heading
Contents
Name
Sensor Name
- an X preceding the sensor name indicates the sensor is Inactive
Sensor Datapoint (variable) Name
Sensor Datapoint Reading
Time of the Sensor Datapoint Reading
Datalogging Time Interval
- a C preceding the log interval time indicates a conditional datalog
- a D preceding the log interval time indicates a disabled datalog
: Indicates if the Datapoint is defined as part of a GOES transmission
- a Y indicates the datapoint is to be transmitted in the GOES message
- an N indicates the datapoint is not transmitted
Var
Value
Time
Log Invl
GOES
7.2.3.3.2
SDI sensors
The Configuration Summary screen – SDI tab provides information on the datalogger’s SDI sensors (see Figure
7-8). SDI command details are shown in addition to the headings displayed on the Sensor tab.
page 63
Axiom H2 User Manual
Configuration reference
Figure 7-8: Configuration Summary screen – SDI tab
Configuration Summary – SDI tab – columns
Column heading
Contents
Cmd
Invl
Offset
the SDI command sent to the sensor
SDI Command Time Interval
SDI Command Time Offset
Example
An Interval of 01:00:00 and an Offset of 00:05:00 indicated that the datalogger sends the shown SDI command
to the sensor every hour at five minutes past the hour (00:05:00, 01:05:00, 02:05:00, 03:05:00 ...).
7.2.3.3.3
Processes
The Configuration Summary screen – Process tab provides information on the various processes defined in
the datalogger (see Figure 7-9). Process details are shown in addition to the headings displayed on the Sensor
tab.
Figure 7-9: Configuration Summary screen – Processes tab
page 64
Axiom H2 User Manual
Configuration reference
Configuration Summary – Processes tab – columns
Invl: Meas/Rst
Process Measurement and Reset Interval Times
Offset: Meas/Rst Process Measurement and Reset Interval Offset Times
Example
The RhMaxMin process shown in Figure 7-9 has a Measurement Interval of 10 minutes (00:10:00) and a Reset
Interval of 1 hour (01:00:00). Also both the Measurement Offset and the Reset Offset are zero. This indicates
that the RhMaxMin process is run every 10 minutes (xx:00:00, xx:10:00, xx:20:00, etc.) and the process outputs
are reset every hour at the top of the hour.
7.2.3.4
Clear Configuration
Clears all user settings and loads a blank factory default configuration
7.2.4 Power management tab
The Station Set-up screen – Pwr Mgt tab (Figure 7-10; Home > Station > Pwr Mgt tab) allows the user to specify
when the datalogger enters and recovers from low power standby mode.
When the battery voltage drops below the specified Datalogger V Cut-off voltage level, the datalogger turns off
SDI bus power, turn off power to the telemetry devices, stop all datalogging, turn off power to the
touchscreen, and enter a low power standby mode. The datalogger remains in the low power standby mode
until the battery voltage rises above the specified Datalogger V Resume voltage level.
When the datalogger is in low power standby mode and the user presses the touchscreen, the touchscreen
briefly flashes and then returns to low power mode.
Figure 7-10: Station Set-up screen – Power Management Tab
The Reset button restores the Telemetry factory default settings, which are shown in Figure 7-10.
page 65
Axiom H2 User Manual
Configuration reference
7.3 Service
The Home screen Service icon is used to access maintenance and service utilities available in
the datalogger. The Service screen (Figure 7-11) allows the user to set the datalogger’s date and
time, enable password protection, update the datalogger software, view the datalogger’s audit
log, record serial numbers of site equipment, as well as create service reports.
Figure 7-11: Service screen
7.3.1 Screen calibration
The datalogger’s touchscreen is factory calibrated; however, if you notice that the presses on the touchscreen
do not register in the correct location, then the touchscreen may need to be recalibrated.
To recalibrate the touchscreen, press Home > Service > Screen Calibration and follow the instructions . Use
only the stylus attached to the datalogger or your bare finger to touch the screen. Follow the displayed
instructions to touch the cursor (+ sign) at the center and four corners of the screen, conclude by tapping
anywhere on the screen. This ensures the touchscreen is properly calibrated. Be careful to accurately touch each
location as this ensures optimum touchscreen operation. The touchscreen calibration routine monitors the
accuracy of the calibration attempt and requests you try again if you inadvertently miscalibrate a point.
7.3.2 Set date / time
To set the datalogger’s local date and time, open the Set Date Time screen (see Figure 7-12; Home > Service >
Set Date Time). This sets the time the datalogger uses to timestamp its logged data and audit log entries.
To leave the datalogger’s Date/Time settings unchanged, press the Cancel .
To set the Date, Time, and Time zone to the currently entered values on the Set Date Time screen, press OK .
To set time precisely, enter a time that is slightly ahead of the current time, then press OK at the precise
moment corresponding to the entered time.
If the datalogger is connected to a G5 GOES transmitter, the datalogger has its time synchronized with the
G5’s high accuracy, GPS based clock; however, the datalogger’s time zone setting remains unaffected and the
datalogger continues to operate based on its local time.
page 66
Axiom H2 User Manual
Configuration reference
Figure 7-12: Set Date Time screen
7.3.2.1
Date
Set the desired date by using the drop-down menu (the down arrow on the right side of the Date box). The
left/right arrows in the drop down menu step backwards and forwards through the months. To step through
the years, click on the year and then use the up/down arrows which appear to select the desired year. (See
Figure 7-13.)
Figure 7-13: Set Date Selection
7.3.2.2
Time
Set the desired time by using the left/right arrows in the Time box to select the desired hours, minutes, and
seconds.
7.3.2.3
Time zone
Select the desired time zone from the list provided by the time zone drop-down menu (the arrow on the right
side of the Timezone box). When changing the datalogger’s time zone, ensure that the Date and Time fields are
also correct as the datalogger’s Date, Time, and Time zone information are all updated when OK is pressed.
7.3.2.4
Enable daylight savings
Check the Enable Daylight Savings box if you want the datalogger to track daylight savings time.
page 67
Axiom H2 User Manual
7.3.2.5
Configuration reference
G5 GOES transmitter time synchronization
If the datalogger is connected to a G5 GOES transmitter, then datalogger time synchronization with the
GOES transmitter occurs in the following cases:
1.
When the datalogger is first powered on and the GOES transmitter obtains a GPS fix.
2.
After the operator manually sets the datalogger date, time, or time zone.
3.
Prior to each GOES transmission.
The datalogger’s clock is adjusted if the time difference between the datalogger and the G5 GOES transmitter
is more than 1 second. If the time difference is greater than 20 seconds, then, in addition to the datalogger’s
clock being resynchronized, the contents of the datalogger’s transmit buffer is cleared to ensure incorrect data
is not transmitted.
7.3.3 Passwords
Two levels of password protection are available in the datalogger – User Level and Tech Level. Each level can
be individually enabled. User Level password provides protection against unauthorized access of the datalogger
whereas the Tech Level password provides protection against unauthorized changes to the operation of the
datalogger.
7.3.3.1
User level
A User Level password allows the operator read-only access to the datalogger. The operator is able to examine
datalogger status (i.e. view data, read sensors, view telemetry configuration etc.) but cannot change the
configuration of the logger if a Tech Level password is set.
7.3.3.2
Tech level
The purpose of the Tech Level password is to prevent unauthorized modifications to the datalogger. A Tech
Level password allows the operator full access to the datalogger. The operator is able to modify datalogger
operation (i.e. load new configurations, create and change datalogging intervals, create and change sensor
definitions etc.). There are no restrictions placed on a Tech Level user. If a Tech Level password is not set then
the User Level has access to Tech Level functionality.
7.3.4 Logout
Automatic logout from User Level or Tech Level occurs after 20 minutes of touchscreen inactivity. In addition,
a station operator can use the Logout icon to force a logout.
7.3.5 Datalogger update
The Datalogger Update icon, found on the Service screen, enables the user to update software in the
datalogger from a USB memory stick. Application software, which is used to run the datalogger, and Sensor
Extensions, which provides advanced sensor set-up functionality, both can be independently updated from the
Datalogger Update screen (see Figure 7-14).
page 68
Axiom H2 User Manual
Configuration reference
Figure 7-14: Datalogger Update screen
7.3.5.1
Application
The Application is the program which runs the datalogger and provides the GUI and the functionality for the
user to configure the datalogger to their requirements. The version of the Application currently running the
datalogger is displayed in the Version tab of the Station Set-up screen (Home > Station). The Application
button on the Datalogger Update screen begins the Application update process.
7.3.5.1.1
Update procedure
Follow the steps below to update the datalogger’s Application software:
1.
Obtain the latest application software release from FTS. The file will have a .CAB extension (i.e.
F6H2_v230.CAB for datalogger application software version 2.30).
2.
Place the CAB file on a memory stick in the default folder H2 Data Logger\SW (create this folder
structure if it does not exist – refer to Figure 3-1). Alternately, you can place the file in any folder you
wish but then you will need to browse to the file when updating the datalogger’s application software.
3.
Insert the memory stick into either of the datalogger’s USB HOST ports.
4.
Press Home > Service > Datalogger Update > Application.
5.
The datalogger displays the Application Update screen (Figure 7-15). The Current Version of the
application currently running on the datalogger as well as the Latest Version Available (as found in the
Axiom H2 Data Logger\SW folder on the memory stick) is shown.
page 69
Axiom H2 User Manual
Configuration reference
Figure 7-15: Application Update screen
6.
Press OK to accept the Latest Version Available file selection to proceed with the application software
update or press Cancel to abort the operation. Alternately, the Adv (advanced) button can be used to
browse to and choose a specific file outside of the default folder location
7.
If OK was pressed, the following steps occur (this process takes about a minute):
a.
The datalogger displays a Please Wait message.
b. The current application automatically stops.
c. The datalogger displays an Update Successful message.
d. Remove the memory stick from the USB HOST port and then press OK
e. The updated application software automatically starts.
8.
The datalogger will begin operating with its previous configuration – no user action is required
9.
Datalogger application software update is complete. Confirm by checking the Application Version
number shown on Home > Station > Version tab.
7.3.5.2
Sensor extensions
A Sensor Extension provides advanced set-up functionality for a specific sensor.
Error! Reference source not found. shows the datalogger’s Sensor Extensions screen
Error! Reference source not found. shows, in the bottom listbox, that there is a Sensor Extension named
mModDll.dll already installed on the datalogger (installed on the datalogger in the datalogger’s Program
Files\CustomDevices folder).
Error! Reference source not found. also shows, in the top listbox, that there is a USB memory stick plugged
nto the datalogger and that the memory stick has two sensor extensions which can be installed to the
datalogger.
The Add and Delete buttons on the left side of the Sensor Extensions screen are used to install and remove
extensions from the datalogger.
page 70
Axiom H2 User Manual
Configuration reference
Figure 7-16: Sensor Extensions screens
7.3.5.2.1
Adding or updating a sensor extension
The Add button is used to install or update datalogger Sensor Extensions. A new extension can be directly
added to the datalogger; however, when updating an extension, the datalogger’s application software needs to
be restarted. Restarting the application software cycles the power to the telemetry devices attached to the
datalogger. For instance, if you have a G5 transmitter attached to the datalogger and the datalogger’s
application is restarted, then the G5 transmitter is power cycled and the G5 needs to reacquire the GPS
almanac in order to validate its real time clock before any GOES transmissions can occur (note to acquire the
GPS almanac can take up to 20 minutes). The process is the same for adding or updating a sensor extension.
When updating an extension, the existing extension on the datalogger is overwritten.
To add or update Sensor Extensions on the datalogger:
1.
Obtain the latest sensor extensions from FTS. Sensor Extension filenames have a .dll suffix (i.e.
AmModDll.dll for the SDI-AM module extension).
2.
The sensor extension dll file must be placed on the memory stick’s Axiom H2 Data
Logger\SW\CustomDevices folder (you must create this folder structure if it does not exist or else the
datalogger will not be able to find the new dll files).
3.
Insert the memory stick into either of the datalogger’s USB HOST ports.
4.
Press Home > Service > Datalogger Update > Sensor Extension.
5.
The datalogger displays the sensor extensions currently installed on the datalogger in the lower listbox
and the sensor extensions available to be installed from the USB memory stick in the upper listbox.
6.
Select the sensor extension you wish to install in the upper listbox
7.
Press Add.
8.
The datalogger moves the selected file to the lower listbox. If there was already a sensor extension
with the same name installed on the datalogger, then the extension in the lower listbox will be moved
to the upper listbox (note that the two extensions have different file paths).
9.
Press OK to complete the sensor extension add/update process or press Cancel to abort the operation.
page 71
Axiom H2 User Manual
Configuration reference
IMPORTANT ! The datalogger’s application software needs to be restarted after updating a
sensor extension from the datalogger. Restarting the application software cycles the power to
the telemetry devices attached to the datalogger.
7.3.5.2.2
Removing a sensor extension
The Delete button is used to uninstall Sensor Extensions from the datalogger. It is important to note that
when removing Sensor Extensions, the datalogger’s application software needs to be restarted. Restarting the
application software cycles the power to the telemetry devices attached to the datalogger. For instance, if you
have a G5 transmitter attached to the datalogger and the datalogger’s application is restarted, then the G5
transmitter is power cycled and the G5 needs to reacquire the GPS almanac in order to validate its real time
clock before any GOES transmissions can occur (note to acquire the GPS almanac can take up to 20 minutes).
To remove a Sensor Extension from the datalogger:
1.
Ensure that there is no memory stick connected to either USB HOST port.
2.
Press Home > Service > Datalogger Update > Sensor Extension.
3.
The datalogger will display the sensor extensions currently installed on the datalogger in the lower
listbox.
4.
Select the sensor extension you wish to remove in the lower listbox
5.
Press Delete.
6.
The datalogger moves the selected file to the upper listbox.
7.
Press OK to complete the sensor extension removal process. The datalogger will prompt you for
confirmation and then the datalogger application will automatically restart.
Press Cancel to abort the operation.
IMPORTANT ! The datalogger’s application software needs to be restarted when removing
a Sensor Extension from the datalogger. Restarting the application software cycles the power
tothe telemetry devices attached to the datalogger.
7.3.6 Audit log
To view the datalogger’s Audit Log, use the Audit Log screen (Figure 7-17; Home > Service > Audit Log). The
Audit Log is a circular text file (maximum size 20 kB) in which the datalogger stores time-stamped entries of
anomalous events or events of importance. On the Audit Log screen, the user can scroll through the log entries
as well as clear the file or save the Audit Log file to a USB memory stick.
page 72
Axiom H2 User Manual
Configuration reference
Figure 7-17: Audit Log screen
7.3.6.1
Save
The Save button allows the user to write the datalogger’s Audit Log file to the USB memory stick.
The audit log is automatically saved in the station folder on the memory stick memory stick. The full folder and
file name is: Axiom H2 Data Logger\<station name>\Data\AuditLog-YYYY-MM-DD-hh-mm-ss.txt (where
<station name> is the datalogger’s station name and YYYY-MM-DD-hh-mm-ss is year-month-day-hourminute-second). The datalogger’s Audit Log file is not altered by writing the file to a memory stick.
7.3.6.2
Delete
The Delete button allows the user to erase the datalogger’s Audit Log file. The user is prompted to confirm the
deletion of the log entries as the log entries cannot be recovered once they have been deleted.
7.3.7 Serial number table
The Serial Number screen (Figure 7-18; Home > Service > Serial # Table) allows the user to enter serial
numbers of the sensors, telemetry, and other equipment associated with the site. A device whose serial number
needs to be manually entered is shown with a beige background (e.g., Rain in Figure 7-18). A device capable of
reporting its serial number is identified with a yellow background (e.g., G5 Port A in Figure 7-18). Devices
whose serial numbers have not been entered or detected are shown with a red background. The Last Update
column is automatically populated with the time the serial number of the device was entered.
To auto-detect or to manually enter a serial number, touch the name of the device in the serial number table.
The Serial Number Update screen opens (see Figure 7-19). If the device is not capable of reporting its serial
number then the Auto Detect button is absent. The user can manually edit a serial number which was auto
detected.
When a sensor or telemetry is added to the datalogger, it is automatically added to the serial number table;
however, the user can also add a device to the serial number table by selecting the Add button. The user can
then give the device a name and manually enter its serial number.
To remove a sensor from the serial number table select the Delete button, a new screen will appear where you
can select which device in the serial number table you would like to remove from the list.
page 73
Axiom H2 User Manual
Configuration reference
Figure 7-18: Serial Number Table screen
Figure 7-19: Serial Number Update screen
7.3.8 Visit report
The Visit Report provides the user with a convenient tool which saves the station’s current operating state at
the start and end of each site visit. The Visit Report also ensures consistency in the data that is saved for every
site visit. Visit report information is always saved to the station’s folder on a USB memory stick inserted into
one of the datalogger’s USB HOST ports. Information saved for each visit report (start and end of visit)
includes:
A time-stamped text report of the datalogger’s current operating state.
A time-stamped datalogger configuration file.
A time-stamped download of the datalogger’s audit log file.
A time-stamped configuration summary report in csv format.
if applicable, a time-stamped download of the transmission history (Tx Log) of the attached G5
transmitter.
The Visit Report screen (Figure 7-20; Home > Service > Visit Report) has two textboxes which should be
correctly set prior to pressing the Start Visit button .
page 74
Axiom H2 User Manual
Configuration reference
Figure 7-20: Start Visit Report screen
7.3.8.1
Technician
The Technician box allows the user to enter their name or initials as a record of who performed the site visit.
7.3.8.2
Trip #
The trip number automatically increments from the last visit; alternatively, the user can manually enter a trip
number before pressing the Start Visit button.
7.3.8.3
Start / end visit
The Start / End Visit button toggles between the labels (and functions) Start Visit and End Visit. After the Start
Visit button is pressed, a text report of the datalogger’s current operating state is displayed for the user to view
in the Save Report screen (see Figure 7-21).
Figure 7-21: Save Report - Start
Once the user presses OK, the entire Visit Report information is written to the memory stick. The Visit Report
screen now displays an End Visit button in place of the Start Visit button (see Figure 7-22).
page 75
Axiom H2 User Manual
Configuration reference
Figure 7-22: End Visit Report screen
The user can now navigate away from the Visit Report screen to do the required maintenance work. The Visit
Report Screen continues to display the End Visit button until the button is pressed again. Once the End Visit
button is pressed, an End Visit text report of the datalogger’s current operating state is displayed for the user to
view in the Save Report screen (see Figure 7-23). The End Visit Report includes Length of Visit information.
Figure 7-23: Save Report - End
This alternating Start Visit / End Visit functionality allows the user to capture the station’s current operating
conditions (start visit) and then capture the stations operating conditions after completion of any maintenance
work (end visit) so that a full record of site maintenance is retained.
page 76
Axiom H2 User Manual
Configuration reference
7.4 Sensors
The Sensors icon opens the Sensors screen, which enables the user to configure sensors for
the Axiom H2 datalogger. Figure 7-24 shows the Sensors screen for a blank datalogger (no
sensors configured) – the only option for the user is to add a new sensor. Normally the
datalogger would be preconfigured by FTS and several sensors would be visible on the Sensor
screen (see Figures 28, 29, and 30).
Figure 7-24: Sensors screen
Pressing the Add button allows the user to configure a new sensor for the datalogger. The new sensor can be
one of the datalogger’s internal sensors (see Figure 7-25) or an external sensor connected to a dedicated or SDI
input (see Figure 7-26) or a Sensor Extension (see Figure 7-27).
Figure 7-25: Internal Sensor Icons
Figure 7-26: SDI and Dedicated Sensor Icons
Figure 7-27: Sensor Extension Icons
When configuring sensors, the user can override the default parameter name. If a parameter name is left blank,
then that parameter is not monitored and is not available as a datapoint in the datalogger.
page 77
Axiom H2 User Manual
Configuration reference
After a sensor has been configured, its icon appears on the Sensors screen (Figure 7-24). The sensor displays
its parameters when the sensor’s icon is pressed as well as its Time To Next Acquisition. Time To Next
Acquisition is a countdown timer to the next time that the sensor is logged, processed, or transmitted.
All sensor set-up screens have a checkbox titled Active. If the Active checkbox is unchecked (left blank), then
the sensor is not read by the datalogger and any calculations or processes that use the sensor reading will report
an error.
7.4.1 Restrictions on sensor datapoint names
Each sensor defines one or more named datapoints. These names must conform to the following rules:
The name must contain only upper- or lower-case letters, digits, or the underscore character ("_").
The name must start with a letter.
The name cannot be any of the following reserved names:
o ABS
o ACOS
o ASIN
o AT
o ATAN
o CMD
o COS
o ELSE
o ERR
o EXP
o FRAC
o IF
o INT
o LN
o MAX
o MIN
o MOD
o PI
o POW
o SIN
o SQRT
o SteinhC
o t_DySince
o t_DySYr
o t_HrSince
o t_HrSYr
o t_IsLeap
o t_MnSince
o t_MnSYr
o t_SeSince
o TAN
page 78
Axiom H2 User Manual
Configuration reference
7.4.2 Internal sensors
There are three physical sensors internal to the Axiom H2 datalogger used to measure solar panel parameters,
battery parameters, and datalogger temperature. The Battery, Solar, and Case Temp icons access screens to
configure these measurements.
7.4.2.1
Battery
Figure 7-28 shows the Battery Sensor Setup screen. Measurable parameters for the battery are
the battery voltage, current, and temperature as well as the voltage of the optional battery backup D-cell pack. The default sensor name is Battery while the default parameter names are VBatt
for battery voltage (Volts), IBatt for battery current (Amps), TBatt for battery temperature
(either ºC or ºF), and VDCell for the optional battery back-up D-cell pack voltage. A negative
value for battery current indicates that current is being drawn from the battery (the battery is being discharged)
while a positive value indicates that the battery is being charged. The value reported in battery voltage and
battery current is an average value from the last 10 seconds.
Figure 7-28: Battery Sensor Setup screen
7.4.2.2
Solar
Figure 7-29 shows the Solar Sensor Setup screen. Measurable parameters for the solar panel
are the solar panel voltage and current. The default sensor name is Solar Panel while the default
parameter names are VSolar for solar panel voltage (Volts) and ISolar for solar panel current
(Amps). The value reported in solar panel voltage and solar panel current is an average value
from the last 10 seconds.
page 79
Axiom H2 User Manual
Configuration reference
Figure 7-29: Solar Panel Sensor Setup screen
7.4.2.3
Case temperature
Figure 7-30 shows the Case Temp Sensor Setup screen (for the datalogger’s internal case
temperature sensor). The default parameter name for this sensor is TCase and the user can
select units of Celsius or Fahrenheit.
Figure 7-30: Case Temp Sensor Setup screen
7.4.3 Dedicated sensors
Dedicated sensors are sensors which have a specifically labeled (i.e., not SDI) datalogger front panel connector.
7.4.3.1
Rain
Figure 7-31 shows the Rain Sensor Setup screen. The default parameter name for this sensor is
RNIN and the user can specify any units they desire (typically inches, mm, or counts – default
of inches). The tip increment defaults to 0.01 but this value can be overridden by the user. The
tip increment is the amount of rain measured by one rain gauge contact closure.
page 80
Axiom H2 User Manual
Configuration reference
Figure 7-31: Rain Sensor Set-up screen
The Auto Reset checkbox, if checked, allows the user to specify a rain counter reset date. The rain counter is
reset at the beginning of the day specified.
The Zero At Power Up checkbox, if checked, causes the datalogger to set the rain counter to zero every time the
datalogger is powered on.
The Rollover checkbox, if checked, causes the datalogger to reset the rain counter to zero once the rollover
value is surpassed.
Figure 7-32 shows the Rain Sensor screen after the sensor has been configured. The rain counter is currently at
4.12 inches. The Set and Zero boxes allow the user to set a specific value or to zero the rain count.
Figure 7-32: Rain Sensor Display screen
page 81
Axiom H2 User Manual
Configuration reference
7.4.4 SDI sensors
Figure 7-33 shows the SDI Sensor Set-up screen, which is the main set-up screen for any SDI
sensor. The configuration of an SDI sensor is more involved than a dedicated or internal
sensor because each SDI sensor must have a unique address and also because each type of SDI
sensor returns a unique set of values for each supported command. Refer to your SDI sensor’s
operating manual when configuring the datalogger for your SDI sensor.
Figure 7-33: SDI Sensor Set-up screen
Note that entering or changing the Address field does not change the address of an attached SDI sensor. The
Address field defines the expected address of the sensor in the datalogger’s configuration. The actual address of
the sensor is dependent on the sensor connected to the datalogger.
The SDI Sensor Set-up screen (Figure 7-33) requires the user to specify a unique sensor name and address. The
Test button allows the user to confirm the address entered for the sensor is correct. The Add button opens the
SDI Command Setup screen (Figure 7-34), which enables the user to define a command for the SDI sensor.
Multiple commands can be defined for a single sensor.
Figure 7-34: SDI Sensor Command Set-up screen
The SDI Command Set-up screen (Figure 7-34) allows the user to specify the sensor command (default is the M
command) and requires the user to set a command interval and offset. The M, MC, C, CC, R, RC and V
page 82
Axiom H2 User Manual
Configuration reference
commands are supported as per the SDI-12 specification (version 1.3). The datalogger automatically sends D
commands if needed to retrieve the measured values.
The Interval is in hour:minute:second format and specifies how often the specified command is sent to the
sensor. The Offset is also in hour:minute:second format and specifies how long after midnight the first
command is sent to the sensor. The specified Offset must be less than the specified Interval.
IMPORTANT ! Interval and Offset specify the time the command to the SDI sensor is
initiated. When configuring the sensor, the user must consider the sensor’s measurement
response time so that the data returned from the sensor is available to the datalogger prior to
the desired log, process, or transmission time.
Example
An Interval of 01:00:00 and an Offset of 00:59:30 configures the datalogger to send the specified command to
the sensor every hour at fifty nine minutes and thirty seconds past the hour (00:59:30, 01:59:30, 02:59:30,
03:59:30, etc.). Assuming that this SDI sensor only requires a few seconds to return its data, then the data from
this command is available to the datalogger for logging, processing, or transmission at the top of the hour.
The Test button sends the specified command to the sensor and displays the returned fields (values).
The Add button on the SDI Command Setup Screen (Figure 7-34) launches the SDI Field Setup Screen which
enables the user to define datapoints for the values returned by the command.. Multiple fields can be defined
for each command as a single SDI command can return several values. Figure 7-35 shows the SDI Field Setup
screen for defining an SDI field.
Figure 7-35: SDI Sensor Field Set-up screen
The SDI Field Set-up screen (Figure 7-35) allows the user to specify a unique field name for the selected field
number. The user can also specify the units and precision (number of decimal places) for this field. Not all
fields returned by an SDI command need to be defined. Only those fields which have been defined in an SDI
Field Set-up screen appear as datapoints in the datalogger.
The Read button generates a sensor measurement and then display the formatted field value, as specified by
Field Number and Precision, next to the Readout text.
page 83
Axiom H2 User Manual
Configuration reference
7.4.5 Sensor extensions
Sensor extensions are designed to ease the set-up of certain SDI sensors by minimizing or eliminating the need
for the user to know the sensor’s specific SDI protocols. Currently the following sensor extensions are
available for use on the datalogger.
Stage
SDI-PT
Shaft
Tavis
SDI-AM
SDIRMY
a generic set-up useful for configuring a variety of stage sensors
specifically designed for pressure sensor stage sensors
specifically designed for shaft encoder stage sensors
specifically designed for the Tavis DISI-1200 Water Stage sensor
specifically designed for the FTS SDI-AM 4 channel analog module
specifically designed for the FTS SDI-WS-RMY-1/2/3 wind sensor with smart SDI-12
interface
Note that sensor extensions write configuration parameters to the attached sensor and that any previously configured sensor parameters are
overwritten.
7.4.5.1
Stage
Figure 7-36 shows the Stage Sensor Set-up screen (Stage tab), with default settings, that is
provided by the Stage sensor extension. The Stage extension is special in that it is always
present in the datalogger. This extension predefines a stage datapoint of HG and an auxiliary
water temperature datapoint of TW. The Stage extension is generic so knowledge of the
specific attached stage sensor’s SDI commands may be required to appropriately configure it.
Refer to the sensor’s operating manual for sensor command and data details.
7.4.5.1.1
7.4.5.1.1.1
Set-up screen
Sensor tab
Figure 7-36: Stage Sensor Set-up screen – Sensor tab
The Sensor tab contains basic information about the sensor: Enter Sensor Name and Address (address on the
SDI bus), and select whether it is currently Active.
page 84
Axiom H2 User Manual
7.4.5.1.1.2
Configuration reference
Stage tab
Figure 7-37: Stage Sensor Set-up screen – Stage tab
The Stage tab controls the stage (water depth) function of the sensor.
Stage Name
Precision
specifies the datapoint name for the stage value returned by the sensor.
specifies the precision (number of decimal places) in the stage value to be used in computations and
displays.
Units
specifies the units label used in displays of stage values.
Use SDI-PT Calc specifies
whether or not to enable the SDI-PT calculation which converts stage value from
PSI to the units specified.
specifies the sensor's stage SDI command. (You may need to consult the sensor manual to determine the
correct command.)
Cmd
specifies which field the stage value is returned in the sensor's data response to Cmd. (You may need to
consult the sensor manual to determine the correct field.)
Field #
Interval
and Offset specify the schedule of stage readings on this sensor.
activates the burst averaging feature for stage values. A burst average is formed at each measurement
event by collecting Number of Samples samples at intervals specified by Sample Period, and taking the average.
Burst Avg
Number of Samples
and Sample Period control burst averaging. They are enabled only when Burst Avg is
selected.
page 85
Axiom H2 User Manual
7.4.5.1.1.3
Configuration reference
Temp tab
Figure 7-38: Stage Sensor Extension Set-up screen – Temp tab
The Temp tab (Figure 7-38) allows the user to specify an auxiliary water temperature measurement.
specifies the datapoint name for the temperature value returned by the sensor. If no temperature
measurement is desired, Temp Name should be blank.
Temp Name
specifies the precision (number of decimal places) in the temperature value to be used in
computations and displays.
Precision
Units
(radio buttons) specifies the units in which the sensor returns temperature values.
If Use Stage Cmd is selected, the water temperature measurement uses the same SDI command and command
timing as is used for the stage measurement – the user only needs to specify the field number of the returned
water temperature data in Field #. In this case, burst averaging for temperatures is also determined by the
settings on the Stage tab.
If Use Stage Cmd is deselected, a separate SDI command, command timing, and burst averaging (see Stage
tab, above) for the water temperature measurement can be specified.
7.4.5.1.2
Display screen
Figure 7-39: Stage Sensor Extension Display screen with Stage Offset
page 86
Axiom H2 User Manual
Configuration reference
This screen displays the current readings from the stage sensor.
and Clear Offset enable the user to set the stage offset value. They are present when a Stage
datapoint is configured on the Stage tab. For information on setting the stage offset, see section 7.4.5.5.
Set Stage
7.4.5.2
SDI-PT (Pressure Transducer)
Figure 7-40 shows the Pressure Transducer Sensor Set-up screen (Sensor tab), with default
settings, that is provided by the SDI-PT (pressure transducer) sensor extension. The SDI-PT
extension is always present in the datalogger. This extension predefines a stage datapoint of
HG and an auxiliary water temperature datapoint of TW. The SDI-PT extension is generic so
knowledge of the specific attached pressure transducer sensor’s SDI commands may be
required to appropriately configure it. Refer to the sensor’s operating manual for sensor command and data
details.
7.4.5.2.1
7.4.5.2.1.1
Set-up screen
Sensor tab
Figure 7-40: Pressure Transducer Set-up screen – Sensor tab
This tab is identical to the Stage Sensor Set-up screen – Sensor tab.
page 87
Axiom H2 User Manual
7.4.5.2.1.2
Configuration reference
Stage tab
Figure 7-41: Pressure Transducer Set-up screen – Stage tab
This tab is identical to the Stage Sensor Set-up screen – Stage tab except that there are now two different
selections for Units.
Units (dropdown) specifies the units in which the sensor returns the stage values
Units (textbox) specifies the units label used in displays of the stage values
7.4.5.2.1.3
Temp tab
Figure 7-42: Pressure Transducer Set-up screen – Temp tab
The Temp tab (Figure 7-42) allows the user to specify an auxiliary water temperature measurement.
specifies the datapoint name for the temperature value returned by the sensor. If no temperature
measurement is desired, Temp Name should be blank.
Temp Name
specifies the precision (number of decimal places) in the temperature value to be used in
computations and displays.
Precision
Units
(radio buttons) specifies the units in which the sensor returns temperature values.
page 88
Axiom H2 User Manual
7.4.5.2.1.4
Configuration reference
Conversion tab
Figure 7-43: Pressure Transducer Set-up screen – Conversion tab
The Pressure Transducer Set-up screen – Conversion tab (Figure 7-43) sets up the equation used to convert
measured water pressure to estimated water depth. This is the value given to the datapoint defined on the
Stage tab.
The equation used is:
where
is estimated water depth,
is measured water pressure,
is water density (Water; default 1000 kg/m3),
is the local acceleration of gravity (Gravity; default 9.80665 m/s2),
Reset
resets the parameters on this screen to their default values.
page 89
Axiom H2 User Manual
7.4.5.2.2
Configuration reference
Display screen
Figure 7-44: Pressure Transducer display screen
This screen displays the current readings from the stage sensor.
and Clear Offset enable the user to set the stage offset value. They are present when a Stage
datapoint is configured on the Stage tab. For information on setting the stage offset, see section 7.4.5.5.
Set Stage
7.4.5.3
Shaft Encoder
Figure 7-45 shows the Shaft Encoder Set-up screen (Sensor tab), with default settings, that is
provided by the Shaft (shaft encoder) sensor extension. The Shaft extension is always present in
the datalogger. This extension predefines a stage datapoint of HG. The Shaft extension is
generic so knowledge of the specific attached shaft encoder sensor’s SDI commands may be
required to appropriately configure it. Refer to the sensor’s operating manual for sensor
command and data details.
7.4.5.3.1
7.4.5.3.1.1
Set-up screen
Sensor tab
Figure 7-45: Shaft Encoder Set-up screen – Sensor tab
page 90
Axiom H2 User Manual
Configuration reference
This tab is identical to the Stage Sensor Set-up screen – Sensor tab.
7.4.5.3.1.2
Stage tab
Figure 7-46: Shaft Encoder Set-up screen – Stage tab
This tab is identical to the Stage Sensor Set-up screen – Stage tab except that there are now two different
selections for Units.
Units (dropdown) specifies the units in which the sensor returns the stage values
Units (textbox) specifies the units label used in displays of the stage values
7.4.5.3.1.3
Optional Field tab
Figure 7-47: Shaft Encoder Set-up screen – Optional Field tab
The Optional Field tab enables the user to define a datalogger datapoint for any field returned by the shaft
encoder. A typical use is to collect the error code (field #5) from measurement responses.
Field Name
specifies the datapoint name.
page 91
Axiom H2 User Manual
Precision
Configuration reference
specifies the precision (number of decimal places) in the field value to be used in computations and
displays.
Units
specifies the units in which the sensor returns the field value.
Field #
specifies field number to extract from the data returned by the sensor.
7.4.5.3.2
Display screen
Figure 7-48: Shaft Encoder Sensor display screen
This screen displays the current readings from the stage sensor.
and Clear Offset enable the user to set the stage offset value. They are present when a Stage
datapoint is configured on the Stage tab. For information on setting the stage offset, see section 7.4.5.5.
Set Stage
7.4.5.4
Tavis
Figure 7-49 shows the Tavis Sensor Setup screen, with default values, provided by the Tavis
sensor extension for the Tavis DISI-1200 Water Stage sensor. To configure the Tavis sensor,
the user only needs to set the module’s SDI Address and when the sensor is read (Interval and
Offset times). If desired, the user can change the default names and units.
Once the sensor has been configured and is operating, the Set Stage and Clear Offset buttons (see Figure 7-52)
can be used to match the current sensor reading to the site’s staff gauge and to clear a previously set water level
offset.
page 92
Axiom H2 User Manual
7.4.5.4.1
Configuration reference
Set-up screen
7.4.5.4.1.1
Sensor tab
Figure 7-49: Tavis Sensor Setup screen - Sensor tab
This tab is identical to the Stage Sensor Set-up screen – Sensor tab.
7.4.5.4.1.2
Stage tab
Figure 7-50: Tavis Sensor Setup screen - Stage tab
The Stage tab controls the stage (water depth) function of the sensor.
Stage Name
Precision
specifies the datapoint name for the stage value returned by the sensor.
specifies the precision (number of decimal places) in the stage value to be used in computations and
displays.
Units
(radio buttons) specifies the units in which the sensor returns stage values.
Interval
and Offset specify the schedule of stage readings on this sensor.
activates the averaging feature for stage values. Averaging causes average, minimum, and maximum
values over a specified time period (beginning at the time of measurement) to be returned. Averaging does not
Enable Avg
page 93
Axiom H2 User Manual
Configuration reference
apply to temperature values. When Enable Avg is checked, stage values are averaged according the following
parameters.
specifies the time period over which the stage (depth) average, minimum and maximum
are computed.
Avg Time Period
Avg Min Name
specifies the name for the minimum value datapoint.
Avg Max Name
specifies the name for the maximum value datapoint.
7.4.5.4.1.3
Temp tab
Figure 7-51: Tavis Sensor Setup screen - Temp tab
The Temp tab controls the temperature measurement function of the Tavis sensor.
Temp Name
Precision
Units
specifies the name of the datapoint for temperature values from the sensor.
specifies the number of decimal places that temperature values are displayed and processed with.
specifies the units that temperature values are measured in.
7.4.5.4.2
Display screen
Figure 7-52: Tavis Sensor Extension Display screen
page 94
Axiom H2 User Manual
Configuration reference
This screen displays the current readings from the stage sensor.
and Clear Offset enable the user to set the stage offset value. They are present when a Stage
datapoint is configured on the Stage tab. For information on setting the stage offset, see section 7.4.5.5.
Set Stage
Refer to the Tavis sensor’s operating manual for sensor details.
7.4.5.5
Setting and clearing the stage offset in stage sensors
Once the sensor has been configured and is operating, the Set Stage and Clear Offset buttons (see Figure 7-53)
can be used. They are present only if a stage datapoint has been configured on the Stage tab.
Use Set Stage to match the current sensor reading to the site’s staff gauge. Use Clear Offset to clear a
previously set water level offset. These functions are available in the Stage, SDI-PT, Shaft Encoder, and Tavis
sensor extensions.
Figure 7-53: Stage Sensor Display screen
There are two methods available for setting the stage offset in the datalogger.
If the staff gauge reading is known the user can press Set Stage, enter the staff gauge value, and then the
datalogger calculates and appropriate stage offset from the current stage sensor reading.
If the staff gauge reading is unknown, the user can select the Polled checkbox and then press Set Stage to
begin a series of stage sensor readings while the user checks the staff gauge reading. After checking the staff
gauge reading and returning to the datalogger, the user can select the appropriate time stamped stage sensor
reading and then enter the staff gauge value so that the datalogger can calculate the appropriate stage offset.
page 95
Axiom H2 User Manual
Configuration reference
A Polled mode stage offset sequence follows:
1.
Select the Polled checkbox and then press Set. The Stage Polled Values screen opens (Figure
7-54).
Figure 7-54: Stage Offset Tool screen (empty)
2.
Set the stage sensor poll interval and sample size (for averaging) and then press Start. The
datalogger starts to record stage sensor values, and the Start button is replaced by the Stop button.
3.
Synchronize your watch to the datalogger time and go read the staff gauge. Note the time and the
staff gauge reading.
Figure 7-55: Stage Offset Tool screen (example data)
4.
Press Stop after reading the staff gauge (Figure 7-55).
page 96
Axiom H2 User Manual
Configuration reference
Figure 7-56: Stage Offset Tool screen (more example data)
5.
Scroll through the stage sensor readings, highlight the reading which corresponds with the time of
the staff gauge reading, and then press Select (Figure 7-56).
Figure 7-57: Stage Sensor Extension Staff Gauge Entry screen
6.
Enter the staff gauge reading (Figure 7-57).
Figure 7-58: Stage Sensor Extension Stage Settings Confirmation screen
page 97
Axiom H2 User Manual
Configuration reference
7.
After entering the staff gauge reading the datalogger display the offset data and requests
confirmation of the new stage offset calculation (Figure 7-58). Press Yes to accept the calculation.
Press No to decline it and abort polled mode.
8.
After accepting the stage settings, the stage sensor displays the adjusted stage value as well as the
calculated stage offset (Figure 7-39).
Press Clear (Figure 7-39) to return the stage offset to zero.
7.4.5.6 SDI-AM
Figure 7-59 shows the Analog Module Set-up screen (Sensor tab), which is the top level set-up
screen provided by the SDI-AM sensor extension for the FTS SDI-AM 4 channel analog
module. The default name for this sensor is SDI_AM. Knowledge of the module’s specific SDI
commands is not required as all of the module’s settings are encompassed in the SDI-AM sensor extension.
The user needs to set the module’s SDI address, to specify when the module is read (Interval and Offset times),
and to provide names for the measured fields. Refer to the SDI-AM module operating manual, FTS number
700-SDI-AM, for SDI-AM operating details.
7.4.5.6.1
7.4.5.6.1.1
Set-up screen
Sensor tab
Figure 7-59: SDI-AM Analog Module Set-up screen -- Sensor tab
The Sensor tab contains basic information about the sensor: Enter Sensor Name and Address (address on the
SDI bus), and select whether it is currently Active.
page 98
Axiom H2 User Manual
7.4.5.6.1.2
Configuration reference
Sched tab
Figure 7-60: SDI-AM Analog Module Set-up screen -- Sched tab
Interval
and Offset specify the schedule of stage readings on this sensor.
activates the burst averaging feature for stage values. A burst average is formed at each measurement
event by collecting Number of Samples samples at intervals specified by Sample Period, and taking the average.
Burst Avg
Number of Samples
and Sample Period control burst averaging. They are enabled only when Burst Avg is
selected.
7.4.5.6.1.3
Analog input settings
Figure 7-61: SDI-AM Analog Module Set-up screen - Analog Channel tab
On the Analog Module Set-up screen, four tabs – An1, An2, An3, and An4 – are used to configure the module’s
four analog input channels (Figure 7-61). The name, operating mode, and input voltage range are independently
set for each of the four channels. Analog channel values are reported in millivolts (mV) or milliamps (mA)
depending on the channel’s Mode setting. The text entered in the Analog Channel Name textbox is used as a
datapoint in the datalogger.
page 99
Axiom H2 User Manual
7.4.5.6.1.4
Configuration reference
Power output settings
Figure 7-62: SDI-AM Analog Module Set-up screen - Power Output tab
On the Analog Module Set-up screen, two tabs – P1 and P2 – are used to configure the module’s two power
outputs (see Figure 7-62). The two tabs are only used to configure the SDI-AM module power outputs – the
power outputs do not appear as datapoints in the datalogger. The power outputs can be configured as:
Disabled
Enabled
Warm-up
Cycle
7.4.5.6.1.5
always off
always on
only on for the specified time at the start of any analog channel measurement
continually power cycle with the specified On Time and Period
Excitation output settings
Figure 7-63: SDI-AM Analog Module Set-up screen - Excitation Output tab
On the Analog Module Set-up screen, two tabs – Ex1 and Ex2 – are used to configure the module’s two
excitation outputs (see Figure 7-63). The two tabs are only used to control the SDI-AM module excitation
outputs – the excitation outputs do not appear as datapoints in the datalogger. The voltage of each excitation
output is independently set and each output can be configured as:
page 100
Axiom H2 User Manual
Configuration reference
Disabled
Enabled
Warm-up
always turned-off,
always turned-on,
turned-on the specified time (in seconds) at the start of any analog channel measurement
and then turned-off after the measurement is complete
The SetPoint textbox specifies the excitation output voltage (range of 0.000 to 5.000 Volts).
7.4.5.6.1.6
Counter settings
Figure 7-64: SDI-AM Analog Module Set-up screen - Counter tab
On the Analog Module Set-up screen, the Count tab is used to configure the module’s counter input (see Figure
7-64). The SDI-AM counter input can report a running count, a period count, and a counter input state (Switch
Name). The Set Global button is used to set the running counter to an absolute value.
The running counter is enabled as a datapoint in the datalogger by entering a unique name in the Running
Count textbox.
The period counter is enabled as a datapoint in the datalogger by entering a unique name in the Periodic Count
textbox. Additionally the period counter can be configured to be periodically set to zero by ticking the Periodic
Reset Enabled checkbox and specifying the Reset Interval and Offset. Resetting the period counter does not
affect the running counter.
The counter input state is enabled as a datapoint in the datalogger by entering a unique name in the Switch
Name textbox. The units for the switch name can be specified by the user. In the Figure, Switch Name default
units are “On” for a high level of ‘1’ (3 V) and “Off” for a low level of ‘0’ (0 V).
page 101
Axiom H2 User Manual
7.4.5.6.2
Configuration reference
Display screen
Figure 7-65: SDI-AM Sensor display screen
This screen displays the current readings from the SDI-AM sensor. Note that only configured analog input and
count datapoints are displayed; also, the power and excitation configurations do not define datapoints and so
are not shown in any way here.
7.4.5.7
SDI-RMY
Figure 7-66 shows the RM Young Set-up screen (Sensor tab), the SDI-RMY sensor extension
for the FTS SDI-WS-RMY wind sensor with smart SDI-12 interface. Knowledge of the
module’s specific SDI commands is not required as all of the module’s settings are
encompassed in the SDI-RMY sensor extension.
The following subsections describe how to configure the various features of the SDI-RMY sensor. For SDIRMY operating details, refer to the SDI-RMY module operating manual, FTS number 700-SDI-RMY.
7.4.5.7.1
7.4.5.7.1.1
Set-up screen
Sensor tab
Figure 7-66: RM Young Setup screen – Sensor tab
Ensure the Active box is checked.
page 102
Axiom H2 User Manual
Configuration reference
Default settings are as shown.
7.4.5.7.1.2
Inst tab - Instantaneous wind speed and direction
Figure 7-67: RM Young Setup screen – Inst tab
The SDI-RMY sensor can measure instantaneous wind speed and direction.
Specify if instantaneous readings are enabled (Enabled).
Provide datapoint names for the measured instantaneous fields (Wind Speed, Wind Direction and Status).
Specify when the module is read (Interval and Offset times) for these fields.
Default settings are as shown.
7.4.5.7.1.3
Avg tab - Scalar and/or vector averaging settings
The sensor can compute scalar and vector average wind speeds. (For details, see SDI-RMY module operating
manual, FTS number 700-SDI-RMY.)
Figure 7-68: RM Young Setup screen – Avg tab
Specify if average readings are enabled (Enabled)
page 103
Axiom H2 User Manual
Configuration reference
Provide datapoint names for the measured scalar and vector averaging fields (Scalar and Vector Wind Speed
and Wind Direction, Count, and Status). Set values for the controlling scalar and vector averaging: number of
samples per average (Samples per Avg) and the interval between averaged samples(Sample Interval).
Specify when the module is read (Interval and Offset times) for these fields.
Default settings are as shown
7.4.5.7.1.4
Pk Read tab - Peak readings settings
The sensor can calculate and return two different values for peak wind speed, with direction. These two values
differ only depending on when they are reset to zero. (A peak is the highest wind speed detected since the last
peak reset, together the corresponding direction. For details, see SDI-RMY module operating manual, FTS
number 700-SDI-RMY.)
Figure 7-69: RM Young Setup screen – Pk Read tab
Specify if peak readings are enabled (Enabled).
Provide names for the measured peak readings fields (Peak 1 and Peak 2 Wind Speed, Wind Direction and Peak
Status). Set the time over which peaks are averaged (Peak Avg Time).
Specify when the module is read (Interval and Offset times) for these fields.
page 104
Axiom H2 User Manual
7.4.5.7.1.5
Configuration reference
Pk Reset tab - Peak reset intervals settings
Computations for the two peak values can be reset to zero on independent schedules.(For details, see SDIRMY module operating manual, FTS number 700-SDI-RMY.)
Figure 7-70: RM Young Setup screen – Pk Reset tab
Specify whether each peak is to be reset periodically (Peak 1 Reset Enabled, Peak 2 Reset Enabled), and if yes,
provide its reset schedule (Interval and Offset times).
7.4.5.7.1.6
Units tab
Figure 7-71: RM Young Setup screen – Units tab
Select the internal sensor wind speed units (Internal Units).
Define the unit labels (Wind Speed Units and Wind Direction Units). You can choose to use the factory wind
speed units (m/s, kph, mph, knots) or define your own. Only the Internal Units have any effect on the actual
measurements. The Display Units text is used only to label displays of measurement values.
Define the precision of the measurements (Wind Speed Precision and Wind Direction Precision).
page 105
Axiom H2 User Manual
7.4.5.7.2
Configuration reference
SDI-RMY sensor display screen
Once the SDI-RMY sensor extension has been installed, the RM Young Sensor display screen is available from
the Sensors screen.
Figure 7-72: RM Young Sensor display screen
The Setup button opens the RM Young Setup screen (described above). PgUp and PgDwn buttons scroll the
display of SDI-RMY variables with their current values and defined label units, which often can run to more
than a single screen can hold.
7.4.6 Deleting sensors
To delete a sensor from the datalogger, go to the Sensors screen and then press the Delete button. A list of
available sensors appears (as shown in Figure 7-73). Select the sensor to delete. The user is prompted to
confirm the deletion of the sensor.
Figure 7-73: Delete Sensor screen
page 106
Axiom H2 User Manual
7.5
Configuration reference
SDI sensors
The SDI-12 icon displays a mapping of the SDI sensors currently configured in the datalogger
to the SDI sensors actually connected to the datalogger. In Figure 7-74, the Defined table is a
list of sensors configured in the datalogger while the Detected table is a list of sensors that the
datalogger found connected to one of its SDI ports.
Figure 7-74: SDI Sensor Mapping screen
7.5.1 Detecting SDI sensors
The user can connect SDI sensors to either of the datalogger SDI ports and then press Detect on the SDI
Sensor Mapping screen (Home > SDI Sensors) to begin the sensor definition process. Detection automatically
determines whether SDI sensors are connected. For each detected SDI sensor, the datalogger displays on
which SDI port the sensor was detected (SDI A, SDI B, SDI C, or SDI D), the sensor’s address, and the
information string returned from the sensor (see Figure 7-76).
When Detect is pressed, the SDI Detect dialog box appears (Figure 7-75).
Figure 7-75: SDI Detect dialog
The Include alpha in search check box should only be checked if you suspect you have an SDI sensor with a
non-numeric address (i.e. an address that isn’t 0 to 9). The detection process takes longer if the check box is
enabled since the datalogger must now also search for sensors at the non-numeric addresses (addresses a to z
and A to Z).
Figure 7-76 shows that an SDI-AM module has been defined in the datalogger at address 7 and the datalogger
has detected two SDI sensors (one sensor on SDI A and one sensor on SDI B); furthermore, both detected
sensors have the same SDI address (address = 3)! The Axiom H2 datalogger can resolve SDI sensors with the
page 107
Axiom H2 User Manual
Configuration reference
same address as long as these sensors are not connected on the same SDI port; however, it is good practice to
give each SDI sensor a unique address.
IMPORTANT! To avoid potential problems, each SDI sensor connected to the datalogger
must have a unique SDI address.
The red background on several of the fields in Figure 7-76 indicates that there are problems which need to be
resolved. The problems in Figure 7-76 are:
1.
Two detected sensors both have the same SDI address (3).
2.
An SDI-AM module was detected at address 3 but the sensor configuration is not defined.
3.
A Gill Ultrasonic wind sensor was detected at address 3 but a configuration is not defined.
4.
The SDI-AM module defined at address 7 could not be found.
Figure 7-76: Detected SDI Sensors
7.5.2 SDI sensor problem resolution
The main problem in Figure 7-76 is that there are two sensors with the same SDI address. The address of one
sensor must be changed. Secondary is mapping the defined SDI-AM module (address 7) to the detected SDIAM module (address 3). Lastly, is creating a new sensor configuration for the detected Gill sensor.
7.5.2.1
Changing a detected SDI sensor’s address
Press the Detected Addr field of the Gill sensor to change the address of the Gill sensor detected at address 3.
The Change Sensor Address dialog box appears (see Figure 7-77), which allows the user to select a new
address for the sensor. Press OK to write the new address to the sensor. The datalogger uses the SDI change
address command to write the new address to the sensor. The datalogger displays an error message if the
sensors address cannot be changed. Figure 7-78 shows the Gill sensor with the newly selected address of 4.
page 108
Axiom H2 User Manual
Configuration reference
Figure 7-77: Change SDI Sensor Address
Figure 7-78: Resolved SDI Address Conflict
The sensors detected by the datalogger no longer have an address conflict so the Detected Addr fields now
appear with a yellow background signifying no more address conflict problems.
7.5.2.2
Mapping SDI sensors
Touch the Vendor/Serial field of the detected SDI-AM module (“FTS ------ SDI-AM 035294”) to match the
defined and detected SDI-AM module. The Sensor Mapping dialog box appears (see Figure 7-79), which
allows the user to select which defined sensor is mapped to the detected sensor. Choose the SDI-AM sensor
from the drop down menu and then press OK to complete the mapping (see Figure 7-80).
page 109
Axiom H2 User Manual
Configuration reference
Figure 7-79: SDI Sensor Mapping
Figure 7-80: Mapped SDI Sensor
Alternately, the user could have edited the address of the defined SDI-AM module (originally at address 7) to
match that of the detected module (address 3) and then pressed Refresh to achieve the same result. Another
option is to create a new sensor configuration for the SDI-AM module detected at address 3 and then either
delete the SDI-AM defined at address 7 or connect a second SDI-AM module whose address is 7.
7.5.2.3
Configuring a new SDI sensor
The NEW field in the Defined list’s Name column or the Add button allows the user to create a new SDI sensor
configuration. New will appear if there is an associated detected sensor. Pressing NEW causes different
responses depending on whether the sensor is ‘recognized’ (see Recognized SDI Sensor section) by the
datalogger. Press Add if there is no associated detected sensor. The user can then define a new sensor based on
the standard SDI sensor or one of the datalogger’s built-in sensor extensions.
If NEW has a red background (meaning there is an associated detected sensor), and the sensor is not
‘recognized’ by the datalogger, the user can define a new sensor based on the standard SDI sensor or one of
the datalogger’s built-in sensor extensions. In this case the sensor’s SDI address is populated in whichever SDI
style sensor was selected.
page 110
Axiom H2 User Manual
Configuration reference
If NEW has a red background (meaning there is an associated detected sensor), and the sensor is ‘recognized’ by
the datalogger, then the datalogger automaticallys select the appropriate sensor definition and populate the
detected sensors SDI address.
7.5.3 Recognized SDI sensors
Several sensors can be automatically recognized by the datalogger. The Axiom H2 has built-in support for SDI
sensors manufactured by FTS as well as several sensors from other manufacturers. To have a sensor
recognized, the user must first use Detect on the SDI Sensor screen (see Figure 7-74) to detect the sensor and
then press the corresponding NEW field for the detected sensor (see Figure 7-80) to configure the sensor.
7.5.3.1
FTS manufactured sensors
There are two sensors manufactured by FTS which can be recognized by the datalogger.
7.5.3.1.1
SDI-AM 4 channel analog input module
When the datalogger recognizes an SDI-AM module, the datalogger uses the SDI-AM sensor extension (see
Figure 7-61) to configure the module.
Refer to the SDI-AM sensor extension section for SDI-AM module configuration details.
7.5.3.1.2
DTS-12 turbidity sensor
When the datalogger recognizes a DTS-12 turbidity sensor, the datalogger uses the following configuration for
the DTS-12.
Sensor Name: DTS-12
Command: M1 (sensor does not wipe its window prior to the measurement)
Field name
Field #
Precision
Units
TurbMeanNw
TurbVarNw
TurbMedNw
TurbBesNw
TurbMinNw
TurbMaxNw
WatTempNw
1
2
3
4
5
6
7
1
2
1
1
1
1
1
NTU
NTU
NTU
NTU
NTU
C
Command: M2 (sensor does a wipe of the its window prior to the measurement)
page 111
Axiom H2 User Manual
Configuration reference
Field name
Field #
Precision
Units
TurbMeanWw
TurbVarWw
TurbMedWw
TurbBesWw
TurbMinWw
TurbMaxWw
WatTempWw
1
2
3
4
5
6
7
1
2
1
1
1
1
1
NTU
NTU
NTU
NTU
NTU
C
The user needs to specify measurement Interval and Offset values for the M1 and M2 commands.
Refer to the sensor’s operating manual (FTS document 700-DTS-12) for configuration details.
7.5.3.2
Other sensors
The following sensors, made by manufacturers other than FTS, can also be recognized by the datalogger.
7.5.3.2.1
Gill instruments windsonic
The datalogger uses the following configuration when a Gill Windsonic Wind Speed and Direction Sensor is
recognized.
Sensor Name: Gill
Command: M
Field name
Field #
Precision
Units
UWD
UWS
UWStatus1
1
2
3
0
1
0
deg
m/s
Field name
Field #
Precision
Units
UWNS
UWEW
UWStatus2
1
2
3
1
1
0
m/s
m/s
Command: M1
The user needs to specify a measurement Interval and an Offset value for the M and M1 commands.
Refer to the sensor’s operating manual for configuration details.
7.5.3.2.2
Tavis corporation DISI-1200 water stage sensor
When the datalogger recognizes a Tavis DISI-1200 stage sensor, the datalogger uses the Tavis sensor extension
(see section 0) to configure the sensor.
Refer to the sensor’s operating manual for configuration details.
page 112
Axiom H2 User Manual
7.5.3.2.3
Configuration reference
GEMS sensor
When the datalogger recognizes a GEMS 9500 series pressure transducer, the datalogger uses its built-in Stage
sensor extension (see section 7.4.5.1) to configure the sensor.
Refer to the sensor’s operating manual for configuration details.
7.5.3.2.4
Sutron barometric pressure sensor
The datalogger uses the following configuration when a Sutron ACCUBAR® Barometric Pressure
Sensor is recognized.
Sensor Name: Sutron
Command: M
Field name
Field #
Precision
BP
1
1
Units
The user needs to specify a measurement Interval and Offset value for the M command.
Refer to the sensor’s operating manual for configuration details.
7.5.4 SDI transparent mode
The Transparent button at the bottom of the SDI Sensors Screen allows the user to send SDI commands on
the datalogger’s SDI ports (see Figure 7-81). The user must select from the Port drop down menu the
datalogger port on which they wish to communicate. Also, to use this feature, the user must have knowledge of
the sensor’s SDI commands as well as the SDI command syntax.
Figure 7-81: SDI Transparent Mode screen
Commands are sent to the specified port when the ‘!’ character is entered. ABC and NUM can be used to display
alternate keypads for entering command characters not shown on the SDI keypad.
page 113
Axiom H2 User Manual
Configuration reference
WARNING: When you send an SDI command which configures a device, you are
circumventing the datalogger's user interface and the datalogger does not know about the
changed configuration. The new configuration is not reflected in the UI and the datalogger
continues to function as if the previous configuration is still in force.
FTS strongly recommends against reconfiguring devices using SDI transparent mode.
This mode is intended only for diagnostic purposes and its use should be limited to checking
that a device is functioning and to retrieving information from it.
Several common SDI-12 version 1.3 commands follow.
7.5.4.1
Notation for SDI commands
In the end, SDI commands are just strings of characters sent to the SDI device. The format of those strings is
important, of course, and to specify the format of SDI commands we use different typefaces. All commands
(and the replies from the device) are represented in a monospaced font, thus. Different parts of a command are
represented with variants on this text format.
Item
Meaning
Command literal
Part of a command that must be
reproduced literally as it appears;
Part of a command that must be filled in
with an appropriate value
Command
parameter
7.5.4.2
7.5.4.2.1
Text representation
X
data
Common SDI commands
Address Query
This command requests the address of the SDI sensor.
C/R
Cmd
Resp
7.5.4.2.2
String
?!
0
Note
request the (single) device on this bus to report its address
the sensor is configured for address 0
Note: only one SDI device can be connected to the bus
when using this command
Acknowledge Active
This command queries whether a sensor is present on the SDI bus at the specified address.
C/R
Cmd
Resp
7.5.4.2.3
String
0!
0
Note
request the device at address 0 to confirm it is active
a device is active at address 0
Change Address
This command changes a sensor’s SDI address.
page 114
Axiom H2 User Manual
C/R
Cmd
Resp
7.5.4.2.4
Configuration reference
String
0A3!
Note
change the address of the device at SDI address 0 to 3
device address (response confirms change)
3
Send Identification
This command requests detailed identification information from the addressed sensor.
C/R
Cmd
Resp
7.5.4.2.5
String
3I!
313FTS-----WTMP-v134567
Note
device SDI address
compatible with SDI-12 version 1.3
FTS
manufacturer’s identifier
WTMP sensor model
-v1
version 1 of sensor firmware
34567 sensor serial number
3
13
Measurement command
Measurement, or “M,” commands (M, M1, M2, …, M9) are used trigger a measurement on the addressed sensor.
The sensor nots return data, instead the sensor returns the duration of the measurement (in seconds) as well as
the number of data points returned by the measurement. The data is read using a subsequent Send Data (“D”)
command. Refer to the sensor’s operating manual for specifics of each M command.
Command
format
aMb!
Explanation
a
M
b
!
device SDI address
command code (literal)
command number (omitted, or digit 0 – 9)
command terminator (literal)
Example
C/R
Cmd
Resp
7.5.4.2.6
String
3M!
30038
Note
start a measurement on sensor at address 3
3
device SDI address
003
measurement delay (until data is ready; seconds)
8
number of data points returned
Send data command
Send Data, or “D,” commands (D0, D1, D2, …, D9) request data generated by the preceding measurement
command. A D0 command is always the first command sent to request the data regardless of which
measurement command was sent. If all of the data points are not retrieved by the D0 command then a D1
command must be sent followed by a D2 command etc. etc., up to a D9 command (see the example below).
page 115
Axiom H2 User Manual
Configuration reference
Command
format
Explanation
aDb!
a
D
b
!
device SDI address
command code (literal)
command number (digit 0 – 9)
command terminator (literal)
Example
Following the measurement command example above (which indicated we are expecting 8 data points to be
returned):
C/R
Cmd
String
3D0!
Resp
3+709.315+0+459.4809+0+684.4509+0
Cmd
3D1!
Resp
3+459.9899+2
Note
request first block of data points from sensor at
address 3
3
sensor SDI address is 3
+709.315
data point 1
+0
data point 2
+459.4809
data point 3
+0
data point 4
+684.4509
data point 5
+0
data point 6
request second block of data points from
sensor at address 3
3
sensor SDI address is 3
+459.9899
data point 7
+2
data point 8
page 116
Axiom H2 User Manual
7.6
Configuration reference
Processing
The Processing icon accesses screens that enable the user to define mathematical calculations
and custom scripts to manipulate sensor measurements or other processes. . Figure 7-82 shows
the Processes screen for a datalogger with no configured processes – the only option for the
user is to add a new process. Normally the datalogger would be preconfigured by FTS and
several processes may be visible on the Processes screen (see Figure 7-83).
Figure 7-82: Processes screen
Pressing the Add button allows the user to configure a new process for the datalogger. A process may have
zero, one, or multiple inputs and outputs. In fact, it is possible for a process to have no inputs and no outputs.
When configuring a process, the user can override the default output names. If an output name is left blank,
then that output will not be available as a datapoint in the datalogger.
Figure 7-83: Process Icons
After a process has been configured, its icon appears on the Processes screen (Figure 7-82). The process
displays its outputs when its icon is pressed.
IMPORTANT ! When a process is run, the latest available value for a process input is used
for the process calculation.
When a process is run, the latest available value for a process input is used for the process calculation.
Internal and dedicated sensors values are updated every second by the datalogger so that the last value for these
sensors is never more than one second old; however, SDI sensors are only read on their programmed interval.
page 117
Axiom H2 User Manual
Configuration reference
This means that, if an SDI sensor is only read every ten minutes, and if that SDI sensor’s output is used as an
input to a process, and if the process is calculated every minute, then the process uses the same SDI sensor
output value for ten consecutive calculations.
7.6.1 Built-in date and time datapoints
In addition to datapoints defined by configuring sensors and processes, Axiom dataloggers also provide built-in
datapoints that give users access to the current date and time. These can be useful when defining processes,
particularly functions and scripts. The date and time datapoints are defined as follows:
Datapoint name
Description
TBD
TBD
7.6.2 Restrictions on process (datapoint) names
The same restrictions that apply to sensor datapoint names apply to process datapoint names. See section 7.4.1.
7.6.3 Maximum and minimum
Figure 7-84 shows the Max Min Process Set-up screen (General Settings tab).
The Max/Min process calculates the maximum and minimum value of the selected input.
Datapoints for the maximum and minimum values can be created (default names of Max and
Min) and can be time stamped with their respective time of occurrence.
7.6.3.1
Setup screen
Figure 7-84: Max Min Process Set-up screen – General Settings tab
7.6.3.1.1
General Settings tab
Name
specifies a name for the process, which must be unique amongst processes.
Input
selects which of the available datapoints is to be the subject of the max-min computation in this process.
and Name of Min, when non-blank, specify the names of datapoints that are created in the
datalogger to hold the latest computed maximum and minimum values respectively. These datapoints are
available just like any other datapoint in the datalogger, and can be used for logging, telemetry, further process
computations, and other purposes.
Name of Max
page 118
Axiom H2 User Manual
Configuration reference
Process Interval, Start Time, and Duration
determine when and how the minimum and maximum values are
computed.
specifies the length of time that the maximum and minimum are calculated over. For example, if
Duration is 60 minutes, then the process calculates the maximum and minimum of the Input value over
60-minute blocks of time.
Duration
specifies how often the Input value is examined (sampled) to compute the maximum and
minimum. Shorter intervals (more frequent samples) give more accurate results. Process Interval must
be less than Duration, and should be chosen to result in enough samples to yield reliable maximum and
minimum values over the Duration period. For example, with a Duration of 60 minutes, a reasonable
Process Interval might be between 10 seconds and 5 minutes, causing the process to examine Input
between 360 and 12 times (respectively) during each 60-minute computation block.
Process Interval
specifies the offset of the Duration cycles from midnight (00:00). The first cycle starts at
midnight + Start Time each day, regardless of whether Duration is a whole fraction of 24 hours or not.
However, note that the first sample (in the first set) is taken at midnight + Start Time + Interval (see
explanation below).
Start Time
The following diagram shows how these three parameters determine the sample sets over which minimum and
maximum values are computed.
Figure 7-85: Max Min process sample set timings
In the above diagram:
A “sample set” is a set of values over which one maximum and/or minimum is calculated.
Sample set contains samples occurring at times
(
)
where
is the value of Start Time,
is the value of Duration,
is the value of Process Interval,
,
page 119
Axiom H2 User Manual
Configuration reference
Note that the first sample in each set does not occur on a Duration boundary, but is the first one
following that boundary. If you wish the first sample to occur on a Duration boundary, then you must set
Start Time to Duration – Interval.
Timestamp with time of occurrence
determines how logged maximum and minimum datapoints are
timestamped (see next section).
7.6.3.1.2
Logging Settings tab
Figure 7-86: Max Min Logging Set-up screen – Logging Settings tab
The Logging Settings tab allows you to establish logging (in the same sense as other data logging established in
separate logs) within the process configuration. Aside from convenience, this allows some special features to be
incorporated that cannot be provided through ordinary logs.
determines whether the maximum and minimum datapoints specified on the General
Settings tab are logged. If checked, these max/min datapoints (if given non-blank names) are written to the log
at the end of each Duration period.
Log Process Outputs
The Log with Input checkboxes specify whether maximum and/or minimum values are to be logged under the
Input name. If checked, the Input value is logged with the computed maximum and/or minimum value.
Timestamp with time of occurrence determines the timestamp of these logged values. When checked, the
calculated minimum and maximum Input values are stamped with the time the minimum or maximum
occurred. If the checkbox is not selected, then the minimums and maximums are be logged with the time of
the end of the process interval.
7.6.3.2
Example
The following example (see Figure 7-87) shows a Max/Min process named CaseMax that calculates five minute
maximum and minimum values for case temperature (TCase). Case temperature is sampled every 30 seconds
and the maximum and minimum values are stored inline with the TCase values. Also, a maximum case
temperature datapoint (TCmax) is created and logged at the time of occurrence during the process interval.
TCase is logged every minute for the sample output data shown.
page 120
Axiom H2 User Manual
Configuration reference
Figure 7-87: Max Min Process Example
Time
TCase
10:05:00 22.4
10:04:30 22.6
TCmax
22.6
10:04:00 22.5
10:03:00 22.4
10:02:30 22.2
inline logged max & logged at time of occurrence
inline logged min
10:02:00 22.3
10:01:00 22.4
7.6.4 Peak wind
The Peak Wind processes calculate the maximum wind speed and capture the corresponding wind direction.
There are two types of Peak Wind processes: Timed Peak Wind and Running Peak Wind. The difference
between these two is that the Timed Peak Wind process is reset at the end of every period whereas the
Running Peak Wind process uses a running “window” which discards old values to make room for new, but is
never reset.
An example is as follows:
WS is the current wind speed read from the sensor, TPeak is the Timed Peak Process results and RPeak is the
Running Peak Process results. TPeak resets every 20 seconds. RPeak has a window size of five samples. Both
processes run every five seconds.
page 121
Axiom H2 User Manual
Time
WS
TPeak
Configuration reference
RPeak
10:00:00 0.7 0.7
10:00:05 0.6 0.7
10:00:10 0.74 0.74
0.7
0.7
0.74
First Peak
10:00:15 0.5 0.74
10:00:20 0.63 0.74
0.74
0.74
TPeak Reset occurs (after sample is taken )
10:00:25 0.4
0.74
TPeak is calculated only using 10:00:25; RPeak is now calculated on
10:00:05 to :25
10:00:30 0.44 0.44
0.74
RPeak is now calculated on :10 to :30
10:00:35 0.35 0.44
0.63
RPeak is now calculated on :15 to :35, so :20 is the new Peak.
0.4
NOTE: The Average process is a running average (is never reset), so it is recommended that the Running Peak
Wind process be used in conjunction with the Average of Wind Speed.
7.6.4.1
Timed Peak Wind
Figure 7-88 shows the Timed Peak Process Setup screen, which is the set-up screen for the
Timed Peak Wind process. The Timed Peak Wind process calculates the maximum wind speed
direction over a fixed duration of time and captures the corresponding wind. If desired, datapoints
for the Peak Speed and Peak Direction can be created (default names of tPeakSpeed and
tPeakDirection). The Log with Input checkbox enables the peak values to be logged as entries
with the selected input’s data (similar to the Max/Min process).
Figure 7-88: Timed Peak Process Setup screen
The user must select the desired input and specify the input’s Process Interval (i.e., how often is the input
read). The user must also specify the Start Time and Duration for the process. The process repeats continuously
based on the Start Time and Duration.
7.6.4.2
Running Peak Wind
Figure 7-89 shows the Running Peak Process Setup screen, which is the set-up screen for the
Running Peak Wind process. The Running Peak Wind process calculates the maximum wind
speed over a fixed number of samples and captures the corresponding wind direction. If desired,
page 122
Axiom H2 User Manual
Configuration reference
datapoints for the Peak Speed and Peak Direction can be created (default names of rPeakSpeed and
rPeakDirection).
Figure 7-89: Peak Process Setup screen
The user must select the desired input and specify the input’s Sample Interval (i.e., how often is the input read).
The user must also specify the Samples per Measurement (i.e., the number of samples to keep in the window)
for the process.
7.6.5 Delta
Figure 7-90 shows the Delta Process Setup screen. The Delta process calculates the difference
of the selected Input’s value over a time period. The user selects the desired input and specifies
the input’s Process Interval (how often is the input read). The user must also specify the Start
Time and Duration for the process. The process repeats continuously based on the Start Time
and Duration.
Figure 7-90: Delta Process Setup screen
7.6.6 Average
Figure 7-91 shows the Average Process Setup screen. The Average process calculates the
mean, standard deviation, median, running maximum, and running minimum value of the
selected input. The user selects the desired input and specifies the input’s Process Interval (how
page 123
Axiom H2 User Manual
Configuration reference
often is the input read) and the desired number of samples, Samples per Measurement, for the calculation.
Figure 7-91: Average Process Setup screen
Figure 7-92 shows the Average process (named CaseAvg) set-up for a five minute case temperature (TCase)
average (TCavg).
TCase is sampled every 10 sec. for 30 samples so: 10 sec. * 30 samples = 300 sec. = 5 min.
Figure 7-92: Average Process Example
Depending on the units of the specified input for the average calculation, the Average process can be used to
calculate a normalized vector average. If the units of the specified input are "deg", "degree", "degrees" or
"degs" (in upper or lower case), the calculated average is calculated as a normalized vector average, as defined
below.
(
)
̂
∑
(
)
̂
∑
̂
̂
page 124
Axiom H2 User Manual
Configuration reference
This calculation takes the 'north' rollover account if calculating a wind direction average; however, wind speed
at the individual wind direction measurements is not accounted for in the average calculation.
To account for wind speed in the vector average, the following definition would be used:
(
)
̂
(
∑
√̂
̂
)
∑
̂
̂
̂
7.6.7 User variable
Figure 7-93 shows the User Variable Setup screen. User variables are datapoints which can be
assigned values (either manually or by the script process). The user variable can be assigned
units and precision as well as a power-on default value. A User Variable must be created before
it can be referenced in another process (i.e. a script) or output.
Figure 7-93: User Variable Setup screen
Figure 7-94 shows the display screen (UserVar Process screen) for a user variable named Test_Var (units of ft
were assigned). The screen displays the current value of Test_Var (-4.2) and also allows the user to clear (Zero
button) or set (Set button) Test_Var to a specific value.
page 125
Axiom H2 User Manual
Configuration reference
Figure 7-94: User Variable Process Display screen
7.6.8 Function
Figure 7-95 shows the Function Setup screen. A Function process evaluates a single-valued
function expression. The function name (default of Func) is also used as a datapoint name for
the values of the function’s output. The user must enter a single equation for the function
which evaluates to a floating point number and can specify the function’s units and precision. A
list of mathematical operators supported by the Function process is given below (nested
operations are supported).
Figure 7-95: Function Setup screen
7.6.8.1 Built-in mathematical operators
Mathematical operators supported by the Function process are:
page 126
Axiom H2 User Manual
Configuration reference
Operator
Meaning
+
*
/
=
MAX(A,B)
MIN(A,B)
SQRT(x)
LN(x)
EXP(x)
POW(A,B)
PI
ABS(x)
FRAC(x)
INT(x)
MOD(A,B)
SIN(x)
COS(x)
TAN(x)
ASIN(x)
ACOS(x)
ATAN(x)
ATAN2(y,x)
SteinhC(x)
addition
subtraction
multiplication
division
equal to
maximum of A or B
minimum of A or B
square root
natural logarithm
natural antilog
A raised to power of B, AB
pi
absolute value
fractional part of x
integer part of x
modulus of A / B
sine (in radians)
cosine (in radians)
tangent (in radians)
arcsine (in radians)
arcos (in radians)
arctan (in radians)
arctan (in radians), this operator preserves the quadrant of the result.
calculates the temperature of a thermistor (in Celsius) from its resistance using the
simplified Steinhart - Hart equation (see below).
Simplified Steinhart - Hart equation
(
Symbol
Meaning/Value
)
Note
temperature (C)
thermistor resistance (Ω)
1.0295 x 10 -3
coefficient for YSI 44006 thermistor
2.3910 x 10 -4
coefficient for YSI 44006 thermistor
1.5680 x 10 -7
coefficient for YSI 44006 thermistor
7.6.8.2 Loading from a file
The Load button allows the user to load a function from an XML file. The file can be loaded from the
datalogger’s internal memory or from a USB memory stick. All datapoints used in the function must be defined
in the datalogger prior to loading the function.
page 127
Axiom H2 User Manual
Configuration reference
In the following example file, the function Temp_F is defined. Temp_F is a formula to convert temperature
from Celsius to Fahrenheit. The Temp_C datapoint must already be defined in the datalogger in order for the
function load to be successful.
<?xml version="1.0" encoding="UTF-8"?>
<XMLRoot>
<Processes>
<Temp_F ProcessType="FuncProcess" Units="F" Equation="32+Temp_C*9/5"
Precision="1" />
</Processes>
</XMLRoot>
7.6.9 Script
Figure 7-96 shows the Script Setup screen. The Script process executes a script (short
computer program written in a simple programming language). The Script Name (default of
Script) is only used to name the script. The script does not create any new datapoints – all
datapoints used in a script must already exist in the datalogger. The user may enter a multi-line
program for the script which can read several inputs and have several outputs. In fact, it is
possible for a Script not to have any input or outputs. The script is run in accordance with the specified Interval
and Offset (note that the minimum script Interval is one minute).
Figure 7-96: Script Setup screen
The Script process supports all of the Function’s mathematical operators as well as the logical operators given
below (nested operations are supported).
7.6.9.1 Built-in logical operators
The following are the logical operators supported by the Script process.
page 128
Axiom H2 User Manual
Configuration reference
Operator
Meaning
IF()
ELSE IF()
ELSE
||
&&
==
!=
<
>
<=
>=
logical or
logical and
equal
not equal
less than
greater than
less than or equal
greater than or equal
In addition to the logical operators above, the following command is supported by the script process.
CMD()
send a command to the SDI ports (the command is sent on all ports).
As well, Load allows the user to load a script from the datalogger’s internal memory or from a USB memory
stick.
Figure 7-97 shows a Script process (named IncCount). The script is run hourly at 15 minutes past the hour.
The script increments a user variable named Count and then clears Count if Count is greater than or equal to
five.
Figure 7-97: Script Process Example (IncCount)
Figure 7-98 shows a slightly more complicated script (named RNIN123). The script is run every minute and
sets a user variable named Result to one, two, or three depending on the value of sensor RNIN.
page 129
Axiom H2 User Manual
Configuration reference
Figure 7-98: Script Process Example (RNIN)
7.6.10 Threshold sampling
Figure 7-99 shows the TSampler (threshold sampling process setup) screen. Threshold
sampling is a process for the automatic collection of water samples. Water samples are taken as
certain conditions of the specified Trigger are met. The user must enter the Sample Interval and
Offset which control how often the threshold process is run as well as the Trigger input (usually
a DTS-12 turbidity sensor) and the appropriate sensors to measure stage and water
temperature. Sampler 1 and Sampler 2 specify the water samplers (usually an ISCO 6712 series).
Figure 7-99: TSampler (threshold sampling process setup) screen
Figure 7-100 displays the default threshold settings (Setup Cog – Thresholds Tab) used for the trigger sensor.
Samples can be triggered by rising or falling values.
page 130
Axiom H2 User Manual
Configuration reference
Figure 7-100: Threshold Sampling Process Threshold Set-up screen
Figure 7-101 displays the advanced settings (Setup Cog - Advanced Tab) used for the Trigger sensor. These
settings outline the hysteresis for the thresholds as well minimum interval settings.
Figure 7-101: Threshold Sampling Process Advanced Set-up screen
Figure 7-102 shows the Threshold Sampling (TSampler) screen. This screen displays current readings for the
process and allows the user to suspend sampling (Disable button) or manually trigger a water sample.
page 131
Axiom H2 User Manual
Configuration reference
Figure 7-102: Threshold Sampling Process Display screen
Two types of water samples can be triggered; a Depth Integrated Sample or an Auxiliary Sample. In both cases
a water sample is taken but the samples are tagged differently in the smp_code variable. Smp_code is a user
variable automatically created by the Threshold Sampling process. A DI Sample is normally used to correlate
depth integrated sediment samples taken manually on site with data and physical samples recorded by the
datalogger. Similarly an Aux. Sample is used to manually trigger an auxiliary sample as a test or if the operator
wants an additional sample for some other reason.
7.6.10.1 Threshold sampling user variables
The following is a list of user variables automatically created by the threshold sampling process.
Variable name
Value
Meaning
Threshold code (thr_code)
0
1
2
3
0
1
2
3
4
5
Baseflow
Rising trigger value
Falling trigger value
Unknown trigger value, not yet defined as rising or falling
No sample collected
Threshold sample
Depth-integrated sample (DI)
Auxiliary sample (AUX)
Start-up sample
Overflow sample, turbidity above maximum; samples every
third interval
-3
-2
Bottle not filled: SDI voltage < 9 V
Sampler did not return a slot value, OR
Bottle not filled: sampler is full or disconnected
Bottle not filled: something else is wrong
no bottle filled
slot number where bottle filled
Sampling code (smp_code)
Sample bottle number (slot)
-1
0
1 to 48
page 132
Axiom H2 User Manual
Configuration reference
These values are logged along with the trigger value every sample interval and in response to a manually
triggered DI Sample or Aux. Sample.
7.7 Data
The Data Status screen (see Figure 7-103) displays data storage information and enables the
user to configure datalogging (Setup Cog) as well as export and delete data (Download and
Delete Data buttons), or examine the datalogger’s recorded data (Graph or Table view).
Setup
Table
Graph
Delete
Figure 7-103: Data Status screen
7.7.1 Log set-up
Datalogging is configured through the Setup Cog button on the Data Status screen. Figure 7-104 shows the
Logging Intervals screen (currently there are no datalogging intervals configured).
Figure 7-104: Logging Intervals screen
page 133
Axiom H2 User Manual
Configuration reference
Press Add to configure a logging interval (see Figure 7-105). After a Log Interval is configured, it appears on
the Logging Intervals screen. Multiple Log Intervals can be configured in the datalogger.
To delete a Logging Interval, tap Delete. A Delete Item screen will appear. Click on the item you wish to
delete and then confirm the deletion to remove the log interval from the datalogger. Repeat for each item you
wish to delete and then click the Back or Home button to leave the Delete Item screen. Deleting Log Intervals
does not delete data stored in the datalogger.
Note: Deleting Log Intervals does not delete data stored in the datalogger.
7.7.1.1
Logging interval
Figure 7-105: Logging Interval Setup screen
To configure a Log Interval, the user must set how often and when the data is logged and specify what data is
to be stored. Press Edit to enable datapoint selection (labeled Variables in Figure 7-105) and use the Move Right
Arrow and Move Left Arrow to specify which datapoints is logged. Interval and Offset determine how often and
when the data is logged.
page 134
Axiom H2 User Manual
Configuration reference
Example
An Interval of 01:00:00 and an Offset of 00:05:00 configures the datalogger to log the specified Variables every
hour at five minutes past the hour (00:05:00, 01:05:00, 02:05:00, 03:05:00, etc.).
Once a datapoint has been selected to be logged (e.g., TCase and MBV variables in Figure 7-106), the user can
disable logging of individual datapoints. Figure 7-106 shows that TCase logging has been disabled. To disable
and re-enable logging of a datapoint, select the datapoint in the Logged Variables list and then use the
Disable/Enable toggle button to select the desired action.
Figure 7-106: Log Interval Set-up screen – Disable Logging
7.7.1.1.1
Conditional logging
Figure 7-107: Conditional Logging Set-up screen
The Conditional Logging tab of the Logging Intervals screen is used for conditional datalogging. If the Enable
Conditional Logging checkbox is selected (see Figure 7-107), then the Variables specified on the Interval tab
(Figure 7-106) will only be logged if the Condition Type and Expression on the Conditional Logging tab
(Figure 7-107) are satisfied.
page 135
Axiom H2 User Manual
Configuration reference
Condition type
Meaning
Value
Only log if the value of the variable selected in the Expression drop down
satisfies the Expression.
Only log if the difference between the value of the variable selected in the
Expression drop down and the last logged value of the variable satisfies
the Expression.
Only log if the difference of the value of the variable selected in the
Expression drop down over the last logging interval satisfies the
Expression.
Change Since Last Logged
Value
Change in Last 00:00:00
The Expression input selection is limited to one variable. Valid operators for the Expression are:
>
>=
<
<=
=
greater than
greater than or equal to
less than
less than or equal to
equal to
7.7.2 Download
The Download button on the Data Status screen allows the user to export data to a USB memory stick or erase
the data stored in the datalogger.
Figure 7-108: Download Data screen
7.7.2.1
Exporting stored data
The Download Data screen allows the user to export a copy of the logged data to a USB memory stick (see
Figure 7-108). The user can select the date and time range of the data to be exported as well as the data format
(either CSV or binary) of the export. The downloaded data file is time-stamped and haves the following naming
format: station name-yyyy-mm-dd-hh-ss with either a .csv or .bin extension.
IMPORTANT ! Datalogger binary exports are much quicker than CSV exports; however,
CSV exports have the advantage of being readable by text or spreadsheet programs
page 136
Axiom H2 User Manual
7.7.2.1.1
Configuration reference
CSV and CSV-SHEF output formats
Selecting CSV output format causes the exported file to be written in standard ASCII text Comma-Separated
Value format.
Selecting CSV-SHEF causes the exported file to be written in a CSV-like format based on the Standard
Hydrologic Exchange Format.
If CSV or CSV-SHEF format is selected, the user can specify the Date and Time Format used in the export file
and also specify whether to include the variables’ units under the variable names in the file.
Format codes for date and time components are detailed in the table below.
Format
code
Output
yyyy
MM
MMM
dd
HH
hh
mm
ss
tt
,
year
month in numerical format (e.g., 01 for January)
month in text format (e.g., JAN for January)
day
hour in 24 hour format
hour in 12 hour format
minute
second
am / pm
commas inserted in the Date Time Format will result in commas inserted in the output data
file
The user can also select which datapoints (variables) to export by enabling the Only Export Selected Variables
checkbox. The list of variables exported is built using the Select Variables screen (Figure 7-109), opened by
pressing Select Variables on the Download Data screen.
Move one right
Move all right
Move all left
Move one left
Figure 7-109: Download Data Select Variables screen
page 137
Axiom H2 User Manual
7.7.2.1.2
Configuration reference
Binary format
Data export in binary format is the quickest way to download data from the datalogger to the USB memory
stick. After downloading data in binary format, the FTS Logger Data Conversion Tool can be used to place the
data from the binary data file saved on the USB memory stick directly into an FTS database or to convert the
data to a CSV file.
7.7.3 Deleting stored data
The Delete Data button on the Data Status screen permanently deletes all data stored in the datalogger. Once
deleted, the data cannot be recovered. After the Delete Data button is pressed, the user is prompted to confirm
the delete operation (see Figure 7-110).
Figure 7-110: Confirm Delete Data screen
IMPORTANT ! Clearing the data permanently deletes the data from the datalogger.
A ‘Data Cleared’ message is displayed once the data has been deleted from the datalogger (see Figure 7-111).
Press OK to continue.
Figure 7-111: Data Deleted screens
page 138
Axiom H2 User Manual
Configuration reference
7.7.4 Graph
A graph of logged data can be created and viewed through Graph on the Data Status screen. While it is
possible to graph a large date range, the user should be aware that there may be a delay to format the graph
depending on the number of readings in the selected range. Graphing capability in the datalogger is intended to
show trends over a short time period to help the user determine proper sensor and station operation. Multiple
variables can be graphed at the same time. Figure 7-112 shows a graph of the RNIN sensor over a two hour
period.
Figure 7-112: Graph Data screen
The Full Screen button expands the graph to fill the entire display area.
The < and > buttons scroll forwards and backwards by half the time scale (in this case one hour) for each time
the button is pressed.
Pressing the variable button, in this example labeled RNIN, allows the user to toggle through all the variables
defined for the graph. The name of the variable currently being displayed (active variable) is shown on the
variable button. Data from the active variable is displayed in its selected colour and the y-axis changes to the
range defined for the active variable. Data from the non-active variables are displayed in grey.
The Setup button provides access to the Graph Set-up screen (see Figure 7-113).
Figure 7-113: Graph Set-up screen
page 139
Axiom H2 User Manual
Configuration reference
Use the Move Right Arrow and Move Left Arrow to select which variables to display.
The Date Range drop down menu is used to select the graph’s time scale (Last Day, Last Week, Last Month, or
a Custom range). If Custom is selected, then the user can specify the exact date/time range for the graph to
display. Note that the same time scale is used for all variables displayed on the graph.
The Edit button allows the user to set the colour and y-axis range for the highlighted Display Variable (see
Figure 7-114).
Figure 7-114: Display Variable Set-up screen
7.7.5 Table
A table of logged data can be created and viewed through Table on the Data Status screen. The Data Table (see
Figure 7-115) is useful for examining specific data values with respect to each other. Data columns can be
resized and repositioned (drag and drop) so that data values can easily be compared. The Jump button on the
Data Table screen allows the user to go to a specific time in the logged data. The Jump button also acts like a
refresh button if the specified jump time is slightly in the future (this way the most current data is shown in the
table).
Figure 7-115: Data Table screen
page 140
Axiom H2 User Manual
Configuration reference
7.7.6 Adv (Advanced)
Advanced logging options are configured through the Adv button on the Data Status screen. The Data
Advanced Setup screen allows the user to select the following two options:
Enable 30 second caching (10 min default): Decrease the size of the cache used between data logging
operations and the NandFlash memory. The default cache size stores about 10 minutes worth of data
between writes to NandFlash. If this option is selected, the cache stores only about 30 seconds worth
of data. The NandFlash is thus written 20 times more often than in the default configuration, which
reduces its lifespan by a corresponding factor.
Enable 8 year Log File (2 year default): Increase the size of file allocated to storing logged data. The
default log file is 13.4 MB, enough for 2 years of data under typical usage. If this option is selected, the
log file is expanded to 54 MB, enough for about 8 years of data under typical usage. The consequence
is that the time required for indexing and deleting data is increased by a factor of at least 10.
To change the advanced data setup, press the Edit button on the screen.
Figure 7-116: Data Advanced Setup screen
7.8 Current Conditions
The Current Conditions icon displays a set of user selected datapoints for easy monitoring of a
specified set of data. The Current Condition screen (see Figure 7-117) is not automatically
updated by the datalogger. The Refresh button can be used to update the display. It is
important to note that Refresh does not trigger a new set of readings from SDI sensors or
process outputs – Refresh only causes the last measured value to be displayed. For example, an
SDI sensor that is programmed to be read every 10 minutes displays the same value until the 10 minute
rollover occurs and a new SDI measurement is performed. Note that a Current Condition call through a
telemetry device or telemetry port connection to a PC operates in a similar manner as the Current Condition
screen.
page 141
Axiom H2 User Manual
Configuration reference
Figure 7-117: Current Condition screen
7.8.1 Set-up
The Setup button provides access to configure the data displayed on the Current Condition screen. After Edit is
pressed on the Current Condition Set-up screen (see Figure 7-118), the user can use the Move Right Arrow and
Move Left Arrow to select which variables are displayed.
Figure 7-118: Current Condition Set-up screen
7.8.2 Timed refresh
An alternative to manually refreshing the screen is to place the datalogger in Timed Refresh mode (see Figure
7-119). The Timed Refresh button updates the Current Condition screen every minute (up to a maximum of 60
min) from the time the Timed Refresh button was pressed. Using the slider bars, the user is able to scroll back
through the list of timed screen updates. Pressing Exit terminates Timed Refresh mode and return the user to
the manually refreshed Current Condition screen.
page 142
Axiom H2 User Manual
Configuration reference
Figure 7-119: Current Condition Timed Refresh screen
7.9 Telemetry
The Telemetry screen (see Figure 7-120) displays the configuration of the datalogger’s two
telemetry ports.
Status information shown on the Telemetry screen includes the port’s device type and a status
summary of the attached telemetry device.
The coloured rectangle beneath the Port (A or B) label indicates the power status of the port:
Green
Black
power on
power off
Figure 7-120 is an Axiom H2-G5-TLM’s Telemetry screen, showing the tabs for Telem A (port A) and Telem
B (port B). Port A is fixed at a Device Type of G5 (the F6-G5-TLM has an integral G5 transmitter). Port A’s
device type is user selectable for dual external Telemetry port dataloggers (i.e. H2-TLM-2).
The Status buttons associated with Port A and Port B provide detailed status information on the connected
telemetry device (see the appropriate Telemetry Device in the following Device Type section).
Figure 7-120: Telemetry screen (Telem A and Telem B tabs)
page 143
Axiom H2 User Manual
Configuration reference
7.9.1 Device type
The Dev Type (Device Type) button is used to configure the datalogger for the device attached to the
associated telemetry port. See Figure 7-121.
G5
RVT
AirTalk
FTS
None
specific for the FTS G5 GOES Transmitter
specific for the FTS Radio Voice Transmitter (version 1)
specific for AirTalk (FTS Radio Voice Transmitter, version 2)
generic port setting
disables the Telemetry port
Figure 7-121: Telemetry Device Selection screen
7.9.1.1
FTS telemetry device
The FTS device type sets the telemetry port settings to 9600 baud, no parity, 8 data bits, and, 1 stop bit.
Currently, the datalogger’s port should be configured to a Port Type of FTS for all telemetry devices other that
an FTS G5 GOES Transmitter or an FTS RVT Radio Voice Transmitter.
7.9.1.2
G5 telemetry device
The G5 device type is specific to and should only be used with the FTS G5 GOES Transmitter. G5 status
information reported on the Telemetry screen includes:
NesID
Failsafe
Timed Tx Info
RTC
Standard
the G5’s current NESDIS identification number
the state of the G5’s failsafe circuit
the number of bytes to be sent at the next timed transmission time
the status of the G5’s real time clock
the standard (CS1 or CS2) that the G5 implements
Refer to the G5 Telemetry Reference section for detailed G5 configuration and status information provided by
Status.
7.9.1.3
RVT telemetry device
The RVT device type is specific to and should only be used with the FTS RVT Radio Voice Transmitter.
page 144
Axiom H2 User Manual
Configuration reference
Refer to the RVT Telemetry Reference section for detailed RVT configuration and status information provided
by Status.
7.9.1.4
AirTalk telemetry device
The AirTalk device type is specific to and should only be used with the FTS AirTalk radio voice transmitter.
Refer to Chapter 9 AirTalk guide for detailed configuration instructions and for status information provided by
Status.
7.9.1.5
No telemetry device
Selecting None as the port’s telemetry device type disables the telemetry port by turning off port power as well
as disabling all port communications.
7.9.2 Power Management
The Pwr Mgt button opens the Port Setup screen for setting power management options.
When the battery voltage drops below the specified Cut-off Voltage, the datalogger turns off power to the
telemetry device The datalogger keeps the power to the telemetry device turned off until the battery voltage
rises above the specified Resume Voltage.
Figure 7-122: Telemetry Device Selection screen
Cut-off Voltage
must be at least the station cut-off voltage (shown on the screen).
Resume Voltage
must be at least the station resume voltage (shown on the screen). The maximum value is 15
V.
The Reset button clears the Cut-off Voltage and Resume Voltage controls.
page 145
Axiom H2 User Manual
Chapter 8
G5 telemetry reference
G5 telemetry reference
Chapter contents
8.1
8.2
CS1 and CS2 standards ............................................................................................................... 147
Status ......................................................................................................................................... 147
8.2.1
View
8.2.2
Trip / Clear
8.2.3
Set-up
8.2.3.1
Transmitter tab
8.2.3.2
Self-Timed tab
8.2.3.3
Pwr Params tab
8.2.4
Message formats
8.2.4.1
BLM message format
8.2.4.2
Time ordered message format
8.2.4.3
WSC message format
8.2.4.4
Pseudo binary message format
8.2.5
Tx Stats
8.2.6
GPS
8.2.7
Test Tx
8.2.7.1
Sample fixed message test transmission
page 146
Axiom H2 User Manual
8.1
G5 telemetry reference
CS1 and CS2 standards
The U.S. National Oceanographic and Atmospheric Administration operates the GOES satellite system, and
sets the communications standards for them. The current standard is called CS1. NOAA is in the process of
introducing a new standard, CS2, which will eventually replace CS1. Key dates in the replacement process are:
May 2012
May 2013
Mid-2023
Any new GOES transmitters purchased (including products which integrate a GOES
transmitter) must be CS2-capable. They will be backwards compatible with the CS1
standard.
All NESDIS assignments by NOAA are CS2 only.
CS1 standard is no longer supported. Any GOES transmitters without CS2 capability will
no longer transmit.
Key differences between the CS1 and CS2 standards are:
CS1
CS2
Channel numbers
1-266
Bit rates
Bit rate/channel
restrictions
100, 300, 1200
100 bps, channels 1-266
300 bps, channels 1-266
1200 bps, channels 1-133
RF power level
fixed
1-266, 301-566
300, 1200 (no 100)
100 bps not permitted
300 bps, channels 1-266 and 301-566
1200 bps, every third channel from 3-264 (i.e.,
3,6,9...264) and from 301-565 (i.e., 301,304,...565)
30–40.5 dBm, variable
8.2
Status
The G5 Status screen is displayed (see Figure 8-1) when the Status button associated with the G5 transmitter
on the Telemetry screen is pressed. Variant screens are presented depending on the standard (CS1 or CS2)
implemented by the installed G5. The G5 Status screens provide detailed status information on the G5 and
allow the user to configure the G5 transmitter.
page 147
Axiom H2 User Manual
G5 telemetry reference
Failsafe
OK
Failsafe
tripped
Figure 8-1: G5 Status screens
G5 physical parameters, operational status, and deployment information is provided.
page 148
Axiom H2 User Manual
G5 telemetry reference
Physical Parameters
G5 SW Ver the G5’s firmware version
G5 Serial # the G5’s serial number
Operational Information
NESID
Time to
Next Tx
RTC
Failsafe
Self Timed
Random
The G5’s current NESDIS identifier
Countdown timer to the next G5 transmission
State of the G5’s real time clock
State of the G5’s failsafe circuit
The number of bytes queued in the Self Timed Transmit buffer for the next timed transmission.
Additionally, VIEW displays the contents of the Self Timed Transmit buffer.
The number of bytes queued in the Random Transmit buffer for the next random transmission.
Additionally, VIEW displays the contents of the Random Transmit buffer. Note that Random
transmissions are only enabled when the G5 has been configured for Time Ordered or Pseudo
Binary transmission message format.
Deployment Information
GPS
Antenna Inclination
Antenna Bearing
Status of the G5’s internal GPS unit
inclination to be used for antenna mounting
true north and compass bearing to be used for antenna mounting
8.2.1 View
The View button on the G5 Status screen allows the user to examine the current contents of the transmit
buffer. The contents of the transmit buffer are delivered to the G5 transmitter approximately 90 seconds prior
to the G5 transmit time. In order to meet timing requirements for transmission, data should be sent to the
transmitted buffer at least two minutes prior to the G5 transmit time.
8.2.2 Trip / Clear
For CS2 standard G5's, there is a button on the G5-CS2 Status screen to the right of the Failsafe status. When
the failsafe status is OK, this button is labeled Trip; when it is TRIPPED or unknown, the button is labeled
Clear.
The Trip button causes the transmitter failsafe to trip. The Clear button causes the failsafe to be cleared (to
return to OK status).
8.2.3 Set-up
The Set-up button on the G5 Status screen displays the G5 Setup screen which enables the user to set the
appropriate G5 transmitter parameters.
page 149
Axiom H2 User Manual
8.2.3.1
G5 telemetry reference
Transmitter tab
View
mode
Edit
mode
Figure 8-2: G5 Set-up screens -- Transmitter tab
Transmit parameters for the G5 are provided by the United States National Oceanic and Atmospheric
Administration (NOAA). These parameters allow the user to retrieve data from their remote site using the
GOES Data Collection System (DCS). On this tab you specify the following GOES parameters:
NESID
Satellite
: The ADDRESS (an eight character identifier) for your assignment.
: The GOES satellite used for your assignment (East or West).
You can also view and, in the case of a CS2 standard G5, set, the Transmit Power Levels for each available data
rate on the G5.
page 150
Axiom H2 User Manual
8.2.3.2
G5 telemetry reference
Self-Timed tab
View
mode
Edit
mode
Figure 8-3: G5 Set-up screens -- Self-Timed tab
Transmit parameters for the G5 are provided by the United States’ National Oceanic and Atmospheric
Administration (NOAA). These parameters allow the user to retrieve data from their remote site using the
GOES Data Collection System (DCS). On this tab you specify the following GOES parameters:
Channel
Window
Bit Rate
Interval
First Tx
: Your assigned PRIME CHANNEL
: Your assigned XMT (transmit) WINDOW
: Your assigned platform baud rate
: Your assigned REPORT RATE
: Your assigned FIRST TRANS time
On this tab you also specify the message format and other determiners of how the message is sent:
Format:
How the message content is formatted.
page 151
Axiom H2 User Manual
Time Ordered
BLM
WSC
Pseudo Binary
G5 telemetry reference
an ASCII format used to transmit time-stamped data; allows for GOES random
transmissions
format specified by the U.S. Bureau of Land Management; an ASCII format commonly
used in fire weather applications
format specified by Water Surveys Canada; a self contained ASCII format with
parameter names and timing embedded in the message
a bit packed modified ASCII transmission format; allows for GOES random
transmissions
The Set Message button is used to configure the contents of the message. This button is disabled in edit mode,
but enabled otherwise.
The Message should always be set after the Message Type has changed!!
For details on message formats and how to set them up, see section 8.2.4 Message formats.
If selected, the Message Centering checkbox causes the G5 to transmit its data centered in the middle of its
transmission window instead of transmitting right at the start of its transmission time.
If selected, the Send “no data” If Buffer Empty checkbox causes the G5 to transmit a message of “NO DATA
AVAILABLE FOR TRANSMISSION” at its transmission time if the datalogger has not provided the G5
transmitter with data. This feature ensures that a transmission occurs at every transmit interval.
The user can disable GOES transmissions by deselecting the Enable Transmission checkbox. If the
transmission is disabled, all functions in the datalogger occurs in normal preparation for a GOES transmission;
however, no data is transmitted.
Note that the Self-Timed checkbox must remain selected when using BLM or WSC message format. If using
Time Ordered or Pseudo Binary format then the Self-Timed checkbox can be deselected if only Random
transmissions are desired.
page 152
Axiom H2 User Manual
8.2.3.3
G5 telemetry reference
Pwr Params tab
View
mode
Edit
mode
Figure 8-4: G5 Set-up screens -- Pwr Params tab
The datapoints defined on this tab appear as internal sensors in the datalogger. Forward Power, Reflected
Power, SWR (Standing Wave Ratio), and Power Supply During Tx are parameters updated by the G5
transmitter after each GOES transmission.
The default name for each parameter is shown. They may be changed if desired.
If selected, the Timestamp with time of occurrence checkbox records the parameters with the time the GOES
transmission occurred. If the checkbox is not selected, then the parameters are not associated with a
transmission time.
8.2.3.3.1
Forward power
Forward Power is a measurement (units of dBm) of the G5 GOES transmitter’s RF output power during the
last transmission.
8.2.3.3.1.1
Reflected power
is a measurement (units of dBm) of the RF power reflected back to the G5 GOES transmitter
from the antenna connection during the last transmission.
Reflected Power
page 153
Axiom H2 User Manual
8.2.3.3.1.2
G5 telemetry reference
SWR
Standing Wave Ratio (SWR) is a calculation based on the forward and reflected power (see formula below).
SWR is a measure of impedance mismatch between the output of the G5 transmitter and the connected
antenna. An SWR of 1 indicates an ideal match and signifies that maximum RF power is transferred to the
antenna. SWR values greater than 1 indicate an impedance mismatch between the G5 transmitter and the
connected antenna. Typically SWR values of less than 1.5 are acceptable. An SWR of 1.5 indicates that 4% of
the transmitter power is being reflected from the antenna. SWR is defined as:
1
SWR
1
Pref
Pfwd
Pref
Pfwd
where
Pref
reflected power (W)
Pfwd
forward (transmitted) power (W)
8.2.3.3.1.3
Power supply during tx
is a measurement (units of Volts) of the G5’s supply voltage made by the G5 during a
GOES transmission. Essentially Power Supply During Tx is a measurement of battery voltage under load.
Power Supply During Tx
Note: Power Supply During Tx replaces the Vload parameter used in datalogger application versions prior to
version 2.32 build 5.
8.2.4 Message formats
The Format drop-down menu (see Figure 8-3) is used to select the format of the transmitted GOES message.
The Set Message button is used to configure the contents of the message.
8.2.4.1 BLM message format
BLM message format is an ASCII format commonly used in fire weather applications. BLM message format is
configured by adding variables in the order you want them transmitted (see Figure 8-5).
The Up and Down buttons can be used to adjust the order of the Transmit Variables. The Format button is
used to set the number of characters for each Transmit Variable (see Figure 8-6).
and Offset settings are used to specify how often the selected Transmit Variables are written to the
transmit buffer. Transmit Variables need to be written to the transmit buffer at least two minutes prior to the
G5 transmit time in order for them to be included in the G5’s transmission.
Interval
page 154
Axiom H2 User Manual
G5 telemetry reference
Figure 8-5: G5 BLM Message screen
Figure 8-6: G5 BLM Format String screen
8.2.4.1.1
BLM single sample example
An example of a typical hourly BLM message transmission is shown below. In this example the data is sampled
two minutes prior to the GOES transmission.
Message timing
Parameter
Value
Meaning
Message Interval
Message Offset
01:00:00
00:51:00
data is sampled every hour …
… at 51 minutes and 0 seconds after the top of the hour(see Figure 85a)
note that the message timing is set at two minutes prior to the GOES
transmission (see Figure 83)
page 155
Axiom H2 User Manual
G5 telemetry reference
Datalogger parameter information
Parameter
Meaning
Format
RNIN
WSM
WDD
ATF
FTF
RHP
MBV
FMP
WDDP
WSMP
SR
Rainfall
Wind Speed
Wind Direction
Air Temperature
Fuel Stick Temperature
Relative Humidity
Main Battery Voltage
Fuel Stick Moisture
Peak Wind Direction
Peak Wind Speed
Solar Radiation
00.00
000
000
000
000
000
00.0
000.0
000
000
00000
GOES transmission
Value
Meaning
001044E409131142033G43+0NN195EUB00056
00.41
001
201
053
055
081
13.4
009.9
089
003
00153
GOES Header
Rainfall
Wind Speed
Wind Direction
Air Temperature
Fuel Stick Temperature
Relative Humidity
Main Battery Voltage
Fuel Stick Moisture
Peak Wind Direction
Peak Wind Speed
Solar Radiation
8.2.4.1.2
BLM multiple sample example
An example of an hourly BLM message transmission is shown below. In this example the data is sampled every
15 minutes so four sets of data are transmitted (i.e. at 14:20:33, data from 13:30:00, 13:45:00, 14:00:00, and
14:15:00 is transmitted).
Message Timing
Parameter
Value
Meaning
Message Interval
Message Offset
- .
00:15:00
00:00:00
data is sampled every 15 minutes …
… at hour + 00, 15, 30, and 45 minutes (+ 0)
page 156
Axiom H2 User Manual
G5 telemetry reference
Datalogger Parameter Information
Parameter
Meaning
Format
RNIN
WSM
WDD
ATF
FTF
RHP
MBV
FMP
WDDP
WSMP
SR
Rainfall
Wind Speed
Wind Direction
Air Temperature
Fuel Stick Temperature
Relative Humidity
Main Battery Voltage
Fuel Stick Moisture
Peak Wind Direction
Peak Wind Speed
Solar Radiation
00.00
000
000
000
000
000
00.0
000.0
000
000
00000
GOES Transmission
Value
Meaning
001044E409132142033G43+0NN195EUB00220
00.41 00.41 00.41 00.41
002 001 002 001
091 138 221 245
050 050 049 049
050 050 050 049
081 083 083 084
13.4 13.4 13.4 13.4
009.9 010.1 010.1 010.1
092 077 100 267
005 004 005 008
00153 00087 00063 00030
GOES Header
Rainfall
Wind Speed
Wind Direction
Air Temperature
Fuel Stick Temperature
Relative Humidity
Main Battery Voltage
Fuel Stick Moisture
Peak Wind Direction
Peak Wind Speed
Solar Radiation
- note that the GOES transmission time is still at 20 minutes and 33 seconds after the top of the hour.
page 157
Axiom H2 User Manual
G5 telemetry reference
8.2.4.2 Time ordered message format
Time Ordered message format is an ASCII format used to transmit time-stamped data. The G5 Setup screen
when Time Ordered format is selected allows for GOES random transmissions (see Figure 8-7).
Figure 8-7: G5 Set-up screen for Time Ordered Format
Time Ordered messages are configured by defining sensor sets. A sensor set is a group of datapoints
transmitted in a defined ordered. Multiple sensor sets can be defined for Time Ordered transmission (up to 100
unique sensor sets – numbers 0 to 99). Each sensor set transmission includes the Sensor Set’s ID number
followed by a time-stamp and then the defined data.
Press the Set Message button (Figure 8-7) and then press tap New (Figure 8-8) to define a new sensor set
(Figure 8-9).
Figure 8-8: G5 Time Ordered Message screen
The Up and Down buttons can be used to adjust the order of the Transmit Variables within a specific sensor
set. Interval and Offset settings are used to specify how often a Sensor Set is written to the transmit buffer.
Sensor Sets need to be written to the transmit buffer at least two minutes prior to the G5 transmit time in
order for them to be included in the G5’s transmission.
page 158
Axiom H2 User Manual
G5 telemetry reference
Figure 8-9: G5 Time Ordered Message Set-up screen
8.2.4.2.1
Time ordered example
An example of a Time Ordered message transmission is shown below.
GOES Transmission
Value
Meaning
001044E409130003031G34+1NN196WUB00342
0 16:30:00 0.67,4.7,206.4,78.3,77.0,30,13.3,7.4,199.9,5.5,2
0 16:40:00 0.67,5.1,201.1,78.4,77.1,30,13.4,7.4,199.7,5.4,3
0 16:50:00 0.67,4.5,209.3,78.4,77.1,30,13.4,7.4,202.7,5.8,2
0 17:00:00 0.67,4.9,203.7,78.4,77.2,30,13.3,7.4,198.4,5.4,2
4 17:00:00 13.2,19.4
0 17:10:00 0.67,4.9,203.7,78.4,77.2,30,13.3,7.4,199.9,5.4,2
0 17:20:00 0.67,4.5,205.5,78.4,77.2,30,13.3,7.4,199.9,5.4,2
GOES Header
Sensor set 0, 16:30 data
Sensor set 0, 16:40 data
Sensor set 0, 16:50 data
Sensor set 0, 17:00 data
Sensor set 4, 17:00 data
Sensor set 0, 17:10 data
Sensor set 0, 17:20 data
Note that the transmission time is 00:30:31 UTC (the GOES Header is always in UTC) whereas the transmitted
data is in local time as the datalogger is set to PDT. Also note that the datalogger’s 17:30 data was not included
in this transmission as the data was not available at the required two minutes prior to the transmit time.
8.2.4.2.2
Random transmission set-up
From the G5 Setup screen, tap Random to display the G5 Random Setup screen (see Figure 8-10) which
enables the user to configure transmit parameters for GOES random transmissions.
page 159
Axiom H2 User Manual
G5 telemetry reference
Random channel parameters are provided by the United States’ National Oceanic and Atmospheric
Administration (NOAA).
Channel
Bit Rate
Repeat Count
Your assigned random channel
Your assigned platform baud rate
The number of times the G5 transmits the random messages
The Random checkbox when selected enables random transmissions. The Setup button allows the user to
configure the Random message (see Figure 8-11).
Figure 8-10: G5 Time Ordered Random Transmission Set-up screen
Similar to self timed messages, random messages are also configured by defining sensor sets (multiple sensor
sets are also allowed for Random transmissions). A combined total of 100 unique sensor sets can be defined
for Time Ordered messages. A random message is prepared for transmission when the defined condition is
met.
page 160
Axiom H2 User Manual
G5 telemetry reference
Figure 8-11: G5 Time Ordered Random Transmission Message Definition screens
8.2.4.3 WSC message format
WSC message format is an ASCII format used by the Water Survey of Canada. WSC is a self contained format
with parameter names and timing embedded in the message2.
A WSC message is configured by tapping New to add variables for transmission (see Figure 8-12).
Figure 8-12: G5 WSC Message screen
Figure 8-13 shows the setup screen for each WSC variable.
2
Refer to Environment Canada’s Operational Specifications for Environmental Data Acquisition System (EDAS) Logger,
Annex A of KM055-045105/B, appendix A, page 15 for more details.
page 161
Axiom H2 User Manual
G5 telemetry reference
Figure 8-13: G5 WSC Message Set-up screen
The Input drop-down selection box allows the user to choose any datapoint already configured in the
datalogger as a variable for transmission. Each variable has associated Interval and Offset settings to specify
when and how often the selected datapoint is written to the transmit buffer.
The Alias textbox allows the user to enter a name which is used as the transmit variable’s name. An example of
where an alias would be used is when a user wishes to transmit data maximum and minimums using the same
name as the original datapoint (i.e. transmit minimum stage, HGmin, as a stage measurement, HG). Leave the
Alias textbox blank if no alias is desired.
The Redundant Records setting allows the user to specify how much of previously transmitted data is to be
retransmitted.
The Order button on the bottom of the WSC Message screen allows the user to specify the order in which the
variables are transmitted. The upper image of Figure 8-14 shows that three variables have been set for
transmission in WSC format. Pressing Order allows the user to rearrange the transmission order (Figure 8-14,
lower image) by selecting the variable and then using the Up and Down icons to move the variable’s position in
the displayed list. The variable displayed at the top of the list is transmitted first, followed by the next variable,
etc., etc.. The variable shown at the bottom of the list is transmitted last
.
Figure 8-14: G5 WSC Message Order screen
page 162
Axiom H2 User Manual
8.2.4.3.1
G5 telemetry reference
WSC message example
An example of a WSC message transmission is shown below.
Message Timing
Parameter
Value
Meaning
Message Interval
Message Offset
- s
: 00:30:00
: 00:15:20
transmission occurs every 30 minutes …
… starting at 15 minutes and 20 seconds past the top of the hour
Datalogger parameter information
Parameter
Meaning
Notes
VB
Battery Voltage
HG
Stage
sampled every 30 minutes from the top of the hour
zero redundant records
sampled every five minutes from the top of the hour
six redundant record
GOES transmission
0010217209127184520G34+0NN195EUB00101 :VB 15 #30 13.2 :HG 05 #05 5.379 5.925 6.472 7.019
7.565 8.112 8.659 9.206 9.753 9.800 9.846 9.994
Notes:
1.
the transmission time is 18:45:20 UTC (the GOES Header is always in UTC)
2.
Battery Voltage parameter (VB) was sampled 15 minutes prior to transmission (15) on a 30 minute
interval (#30), so the value of VB at 18:30:00 UTC was 13.2 Volts.
3.
Stage parameter (HG) was sampled five minutes prior to transmission (05) on a 5 minute interval
(#05), so the values of HG are:
HG value
Time
Note
5.379
5.925
6.472
7.019
7.565
8.112
8.659
9.206
9.753
9.800
9.846
9.994
18:40:00 UTC
18:35:00 UTC
18:30:00 UTC
18:25:00 UTC
18:20:00 UTC
18:15:00 UTC
18:10:00 UTC
18:05:00 UTC
18:00:00 UTC
17:55:00 UTC
17:50:00 UTC
17:45:00 UTC
this is redundant record 1
this is redundant record 2
this is redundant record 3
this is redundant record 4
this is redundant record 5
this is redundant record 6
page 163
Axiom H2 User Manual
G5 telemetry reference
8.2.4.4 Pseudo binary message format
Pseudo Binary message format is a bit packed modified ASCII transmission format. The G5 Setup screen when
Pseudo Binary format is selected allows for GOES random transmissions (see Figure 8-15).
Figure 8-15: G5 Set-up screen for Pseudo Binary Format
Pseudo Binary messages are configured by defining data sets. A data set is a group of datapoints transmitted in
a defined ordered. Multiple data sets can be defined for Pseudo Binary transmission (up to 64 unique data sets
– numbers 0 to 63). Each data set transmission includes the Data Set’s Format ID number followed by the
defined data.
While in view mode (not in edit mode), tap Set Message (Figure 8-15) and then tap New (Figure 8-16) to define
a new data set.
Figure 8-16: G5 Pseudo Binary Message screen
page 164
Axiom H2 User Manual
G5 telemetry reference
Figure 8-17: G5 Pseudo Binary Message Set-up screen
Figure 8-17 shows the , Interval and Offset settings are used to specify how often a Sensor Set is written to the
transmit buffer. Sensor Sets need to be written to the transmit buffer at least two minutes prior to the G5
transmit time in order for them to be included in the G5’s transmission.
The Up and Down buttons can be used to adjust the order of the Transmit Variables within a specific data set.
The Format button sets the precision of the transmitted datapoint (see Figure 8-18). The minimum and
maximum value that can be encoded in pseudo binary format is displayed on the Format screen.
Figure 8-18: G5 Pseudo Binary Message Parameter Format screen
8.2.4.4.1
Pseudo binary example
An example of a Pseudo Binary message transmission is shown below.
GOES Transmission
001044E410301160501G35+0NN195EXE00027bBXbPBXbWaETZ• AuEUf***BXb\
001044E410301160501G35+0NN195EXE00027
bBXbPBXbWaETZ• AuEUf***BXb\
: GOES Header
: Data
page 165
Axiom H2 User Manual
G5 telemetry reference
Note that the transmitted data is not human readable and that a software decode tool is required to extract the
data from the transmission.
8.2.4.4.2
Random transmission set-up
Return to the Setup screen and tap Random.
the G5 Random Setup screen (see Figure 8-19) which enables the user to configure transmit
parameters for GOES random transmissions.
This opens
Random channel parameters are provided by the United States’ National Oceanic and Atmospheric
Administration (NOAA).
Channel
Bit Rate
Repeat Count
Your assigned RANDOM CHANNEL
Your assigned platform baud rate
The number of times the G5 transmits the random messages
Figure 8-19: G5 Pseudo Binary Random Transmission Set-up screen
Tap the Setup button to configure the Radom message. Similar to self timed transmission messages, random
messages are also configured by defining data sets (multiple data sets are also allowed for random
page 166
Axiom H2 User Manual
G5 telemetry reference
transmissions). A combined total of 64 unique data sets can be defined for Pseudo Binary messages. A random
message is prepared for transmission when the defined condition (see Figure 8-20) is met.
Figure 8-20: G5 Pseudo Binary Random Transmission Message Definition screens
8.2.5 Tx Stats
From the G5 Status screen tap the Tx Stats button.
This displays the G5 Stats Log screen (see Figure 8-21) which displays the success/fail statistics of the most
recent G5 GOES transmissions.
The View Details button enables the user to look at the individual transmission reports from the G5
transmitter. Approximately 500 transmission reports can be stored in the circular telemetry log file. Once the
log file is full, the datalogger begins to overwrite the oldest stored transmission reports.
page 167
Axiom H2 User Manual
G5 telemetry reference
Figure 8-21: G5 Tx Stats Log screen
Example transmission reports are shown in Figure 8-22. The log entry shown on the left is typical of a
successful transmission while the log entry shown on the right is that of an unsuccessful transmission.
First
Previous
Next
Last
Figure 8-22: G5 Tx Log Examples
The First, Last, Previous, and Next buttons are used to navigate through the log entries. The Save button
writes the telemetry log file to the USB memory stick in the Axiom H2 Data Logger\<station name>\Data
folder. The Clear button erases all entries in the telemetry file and reset the entry number counter.
Parameters displayed in the transmission reports are different for successful and unsuccessful transmissions.
An explanation for each parameter follows.
page 168
Axiom H2 User Manual
G5 telemetry reference
G5 Telemetry Log Parameters
Entry Number
Type
Length
Start Time
End Time
Fwd Pwr
Rfl Pwr
SWR
Power Supply During Tx
Transmitter
RTC
GPS
Failsafe
Supply Voltage
Freq: F-OCXO:
Freq: F-TCXO:
a unique entry number which is reset when the log is cleared.
the type of transmission (self timed or random)
the number of bytes transmitted
the transmission start time
the transmission end time
the power delivered to the antenna during transmission as measured by the G5
the power reflected from the antenna during transmission as measured by the G5
the calculated Standing Wave Ratio
the G5’s power supply voltage during the G5’s transmission as measured by the
G5 (see Figure 74)
G5 transmitter status, either Enabled or Disabled
G5 real time clock status, either Valid or Invalid
GPS status, either Off or On
GPS failsafe status, either OK or Tripped
G5 power supply voltage at the time of transmission
G5 Oven Controlled Crystal Oscillator Frequency, ideally 10 MHz
G5 Temperature Compensated Crystal Oscillator Frequency, ideally 43.2 kHz.
8.2.6 GPS
The GPS button on the G5 Status screen displays the G5 GPS screen (see Figure 8-23) which enables the user
to view information from the G5’s internal GPS receiver.
Figure 8-23: G5 GPS screen
For the most part, the G5 transmitter’s GPS receiver is turned off. The GPS receiver is only powered on once
per day to resynchronize the G5 (note that, due to the accurate timing in the G5, the G5 can continue to
operate for approximately 28 days without receiving a GPS resynchronization). The GPS receiver is turned on
when the G5 GPS screen is displayed. The GPS requires several seconds to update its status. The GPS remains
on until the user exits the screen or the datalogger timeout (about 20 minutes) is exceeded.
page 169
Axiom H2 User Manual
G5 telemetry reference
GPS Parameters
Antenna
GPS Fix Status
Almanac Received
UTC Offset
# Satellites in View
Avg Signal Strength
GPS antenna connection status (OK, Disconnected, or Shorted).
GPS receiver state information.
True or false indicating whether or not the GPS has received almanac information.
Displays the time offset between UTC and GPS time. This time difference is
automatically accounted for when synchronizing the G5 and the datalogger to UTC
time.
Displays the number of satellites from which the GPS is receiving information.
The average signal strength from the # Satellites in View.
8.2.7 Test Tx
The Test Tx button on the G5 Status screen displays the G5 Test Tx screen (see Figure 8-24) which enables the
user to trigger a G5 test transmission. Currently the user can select the test type (RF Carrier or Fixed message),
NESID, Bit Rate (100, 3000 or 1200 baud), and the DCS channel number.
Figure 8-24: G5 Test Tx screen
A test transmission report (similar to a Tx Log) is displayed after the test transmission has completed.
8.2.7.1
Sample fixed message test transmission
The following is a sample of a fixed message test transmission downloaded from Wallops Island Command
and Data Acquisition Station. The message consists of a header (added by the GOES Data Collection System)
and message data from the test transmission.
001014E809124191542G47-0NN195EFF00396
Operator Initiated Test Transmission:
Operator Initiated Test Transmission:
Operator Initiated Test Transmission:
Operator Initiated Test Transmission:
Operator Initiated Test Transmission:
Operator Initiated Test Transmission:
8.2.7.1.1
GOES DCS header decoding
The header from the previous fixed message test transmission sample is decoded below.
page 170
Axiom H2 User Manual
G5 telemetry reference
Code
Meaning
001014E8 09 124 19 15 42 G 47 -0 N N 195 E FF 00396□
001014E8
Full header
09
124
19
15
42
G
47
-0
N
N
195
E
FF
00396
□
DCP Address (NESDIS
ID)
Year
Day of Year
Hour
Minute
Second
Message Code (see below)
Signal Strength, 33 to 57
dBm (normal is 44 to 49)
Frequency Offset in Hz
Modulation Index (N =
normal, L = low, H = high)
Data Quality (N = normal,
F = fair, P = poor)
Channel Number
Satellite (West, East)
Uplink Carrier Status
Number of Data Characters
Flag word, 8 bits (see
below)
Message codes
G
?
W
D
A
T
U
M
N
good message
message received with parity errors
message received on wrong channel
message received on multiple channels (duplicate)
message received with address errors (correctable)
message received early or late (time error)
unexpected message received (>2 min early or late of assigned time)
Scheduled message is missing
PDT is incomplete
page 171
Axiom H2 User Manual
G5 telemetry reference
Flag word definition
LSB
MSB
Bit #
Meaning
1
2
3
4
5
6&7
8
undefined
clock update since last transmission (1 = update, 0 = not)
Data Compression (1 = on, 0 = off); future enhancement
Reed Solomon (1 = on, 0 = off); future enhancement
undefined
ASCII = 10, Pseudo binary = 11, Binary = 01 (bit 6 / bit 7)
odd parity for ASCII formatted data
page 172
Axiom H2 User Manual
Chapter 9
AirTalk guide
AirTalk guide
Chapter contents
9.1
9.2
9.3
Introduction ................................................................................................................................175
9.1.1
Purpose and features
9.1.2
“AirTalk” vs. “RVT”
9.1.3
Principles of operation
9.1.3.1
Messages
9.1.3.2
Alerts
9.1.3.3
Alert triggering
9.1.3.4
Controlling whether alerts are transmitted
9.1.4
Practical considerations
9.1.4.1
Quick review of AirTalk alert and message structure
9.1.4.2
Using the threshold tracker variable
Common configuration tasks...................................................................................................... 185
9.2.1
Creating a new phrase and associated phrasings
9.2.2
Creating a new message
9.2.3
Creating a new alert
9.2.4
Modifying or deleting an existing phrase or phrasing
9.2.5
Modifying or deleting an existing message
9.2.6
Modifying or deleting an existing alert
9.2.7
Selecting the current language
Configuration reference ............................................................................................................. 209
9.3.1
Home screen (parts related to AirTalk)
9.3.1.1
Indicators and controls
9.3.2
Telemetry screen
9.3.2.1
Indicators and controls
9.3.3
AirTalk Status screen
9.3.3.1
Indicators and controls
9.3.4
AirTalk History screen
9.3.4.1
Indicators and controls
9.3.5
AirTalk Configuration Editor screen – common elements
9.3.5.1
Indicators and controls
9.3.6
AirTalk Configuration Editor screen – Phrases tab
9.3.6.1
Indicators and controls
page 173
Axiom H2 User Manual
AirTalk guide
9.3.7
9.4
Phrase Editor screen
9.3.7.1
Indicators and controls
9.3.8
Phrasing Editor screen
9.3.8.1
Indicators and controls
9.3.8.2
Validity conditions
9.3.8.3
Constant values
9.3.9
AirTalk Configuration Editor screen – Messages tab
9.3.9.1
Indicators and controls
9.3.10 Message Editor screen
9.3.10.1 Indicators and controls
9.3.11
AirTalk Configuration Editor screen – Alerts tab
9.3.11.1 Indicators and controls
9.3.12 Alert Editor screen
9.3.12.1 Indicators and controls
9.3.12.2 Validity conditions
9.3.13 Alert Trigger Editor screen
9.3.13.1 Indicators and controls
9.3.14 AirTalk Configuration Editor screen – DTMF tab
9.3.14.1 Indicators and controls
9.3.15 AirTalk Configuration Editor screen – Languages tab
9.3.15.1 Indicators and controls
9.3.16 Set AirTalk Language screen
9.3.16.1 Indicators and controls
9.3.17
Visit Report
Operational notes....................................................................................................................... 232
9.4.1
DTMF codes
9.4.1.1
Description
9.4.1.2
Sending DTMF codes from a radio
9.4.1.3
How AirTalk processes DTMF codes
9.4.1.4
How the system responds to DTMF codes
page 174
Axiom H2 User Manual
AirTalk guide
9.1 Introduction
9.1.1 Purpose and features
AirTalk enables a datalogger to broadcast voice messages over radio about important conditions in the
datalogger. Messages can contain values measured and recorded by the datalogger. Messages can be sent either
in response to radio-transmitted demands or automatically when the datalogger detects a user-defined alert
condition.
AirTalk is compatible with any PTT (push-to-talk) radio, on any band.
AirTalk can be configured for multiple languages and can manage many messages and alert conditions. All
messages and conditions are defined by the user.
9.1.2 “AirTalk” vs. “RVT”
AirTalk is the latest generation of FTS radio voice messaging services for the Axiom dataloggers. The first
generation of this technology was known as RVT (for “Radio Voice Transmission”)3.
If you have the first-generation RVT system, please see Chapter 9.
9.1.3 Principles of operation
The key elements in the AirTalk system are:
9.1.3.1
Alert: A condition together with a message to be transmitted when the condition is detected by the
datalogger.
Message: A complete unit of voice transmission that can be transmitted.
Phrase: Part of a message.
Phrasing: Instructions for how to express a phrase in a particular language. The phrase may include
data extracted from the datalogger at the moment of message transmission.
DTMF codes: A touch-tone code transmitted by radio to request a message action: either speak a
message or cancel one that is currently speaking. DTMF codes are specified as parts of messages.
Messages
Figure 9-1 shows how Message, Phrase, and Phrasing, and Datapoint objects fit together to define a message
which can be transmitted in any of several languages. A message is made up of a sequence of phrases, which
are strung together in order. Each phrase has one or more phrasings, which are pronounceable texts, possibly
containing place-holders for datalogger values (datapoints) to be inserted at the time of message transmission.
When a message is transmitted, the phrasings are pronounced, one after the other in order, presumably
forming an intelligible message to the human listener.
3
AirTalk was developed with the internal name “RVT2” (RVT version 2). A few last traces of this name remain in the
product, mainly in the AirTalk audit log.
page 175
Axiom H2 User Manual
AirTalk guide
Figure 9-1: Generic message structure in AirTalk
page 176
Axiom H2 User Manual
AirTalk guide
Figure 9-2 shows how an example message for reporting current atmospheric conditions would be set up. This
message can be transmitted in English, Spanish or French. (Note: These languages are used for example only.
Your system may have different languages installed.) The order of phrases for this message is (1) current
temperature, (2) current wind speed, and (3) current wind direction.
Note that other messages in the system can also use some of the same phrase definitions. For example, a windonly message could use just the “current ws” (wind speed) and “current wd” (wind direction) phrases. A phrase
can be used in any number of messages.
Figure 9-2: Example message structure
page 177
Axiom H2 User Manual
9.1.3.2
AirTalk guide
Alerts
Figure 9-3 shows the components of an alert. An alert consists of a condition and a message. The condition is
evaluated according to the Variable, Relation, and Threshold, together with the Dead Zone and Snooze Time
attributes of the Alert. The message is simply any message defined in the system, as described above. (An
automatically created datapoint called a threshold tracker variable simplifies defining messages that mention the
threshold value.)
Figure 9-3: Generic alert in AirTalk
Figure shows how an example alert would be set up. The message in this example would likely include the
value of the threshold tracker variable (e.g., “Air temperature is over XX degrees.”).
page 178
Axiom H2 User Manual
AirTalk guide
Figure 9-4: Example alert structure
9.1.3.3
Alert triggering
The alert condition is defined by a Variable, a Relation and a Threshold.
Variable refers to a datapoint defined in the datalogger.
Threshold is a value to which the Variable is compared. A Threshold may be either:
o a fixed constant, or
o a datapoint in the datalogger (normally a User Variable process, which makes it easy to a
change an alerting parameter and to share one threshold value between several related alerts).
Relation is the comparison: it is one of the standard arithmetic comparisons < (less than), <= (less
than or equal), = (equal), != (not equal), >= (greater than or equal), or > (greater than).
The alert condition is evaluated using the value of Variable rounded to the user-specified
precision specified for that variable. This is particularly important for understanding the
behaviour of the = (equal) and != (not equal) conditions.
The alert is triggered when the alert condition changes from false to true and the following additional
conditions are also true:
at least Snooze Time seconds have passed since the last time the condition changed from true to false;
at least once during the Snooze Time, Variable took on a value at least Dead Zone away from Value
(see table below; Dead Zone does not apply to operator !=)
page 179
Axiom H2 User Manual
Operator
Additional condition
<
<=
>
>=
=
Variable >= Value + Dead Zone
Variable > Value + Dead Zone
Variable <= Value – Dead Zone
Variable < Value – Dead Zone
Variable <= Value – Dead Zone OR
Variable >= Value + Dead Zone
n/a
!=
AirTalk guide
When the alert is triggered, the associated message is broadcast (Repeat Count + 1) times, with an interval of
Repeat Interval seconds between each rebroadcast.
If the alert condition changes from true to false before Repeat Count broadcasts of the alert message have been
made, the broadcasts for that triggering of the alert are stopped immediately.
If the user sends the Cancellation DTMF code to AirTalk and the Alert is currently broadcasting, the remaining
repeat count is set to zero and the Alert is in exactly the same state it would be in if all messages has been
broadcast. In other words, a cancellation has no other effect than to stop the broadcasting. Condition
evaluation continues as usual.
Figure 9-5 shows key behaviours of an alert (with operator > or >=) relative to a graph of the alert condition
variable’s value.
Figure 9-5: Alert triggering behavior on a graph of the alert condition variable value
9.1.3.4
Controlling whether alerts are transmitted
Alerts can be controlled in two ways:
By suspending and resuming alerting (all alerts)
By enabling and disabling individual alerts
page 180
Axiom H2 User Manual
9.1.3.4.1
AirTalk guide
Suspending and resuming alerting
Alerting as a whole can be suspended (turned off) or resumed (turned on). When alerting is suspended, no
alert will send a message, and all messages queued to be sent are removed. When alerting is resumed, those
alerts that are enabled(see below) can once again send their messages when they are triggered by current
conditions. (Messages cleared at the time of suspension are removed and are not restarted when alerting
resumes.)
Suspending and resuming does not affect the enabled/disabled status of any individual alert. It only prevents or
allows the enabled alerts to send their messages.
To suspend alerting:
click the Suspend Alerting button on the AirTalk Configuration Editor screen– Alerts tab, or
send the DTMF code 9999 to the datalogger via radio
To resume alerting:
click the Resume Alerting button on the AirTalk Configuration Editor screen – Alerts tab, or
send the DTMF code 8888 to the datalogger via radio
To control the suspend/resume state that datalogger starts with after powering up:
use the Suspend Alerting on Power Up control on the AirTalk Configuration Editor screen– Alerts tab
(See section 9.3.11, AirTalk Configuration Editor screen – Alerts tab).
9.1.3.4.2
Enabling and disabling individual alerts
Each alert can be enabled (turned off)or disabled (turned on) independently of all other alerts. An enabled alert
sends its message when its trigger conditions are satisfied and alerting is active. A disabled alert never sends a
message, regardless of conditions.
Enabling and disabling individual alerts does not affect whether the alerting system as a whole is suspended or
active (resumed). It only affects whether an individual alert will send messages when alerting is active.
To enable or disable an alert, modify the Enabled/Disabled setting on the Alert Editor page.
9.1.4 Practical considerations
Most users’ final goal is to build an alert. To reach that goal, the message building blocks – phrasings, phrases,
and messages – have to be set up, normally in that order.
Just one complication intervenes: Many alert messages need to state the value of the threshold in the condition
that triggered the alert. In some cases it is necessary to define the alert before the message content (phrasings)
stating the value of the threshold can be set up. However, to define the alert, the message and its content must
be defined. Fortunately this apparent roadblock has a straightforward solution, which is described below.
9.1.4.1 Quick review of AirTalk alert and message structure
When constructing alerts, it’s helpful to keep this structure in mind. Particularly important is the fact that the
phrasing datapoint and the condition threshold tracker datapoint may be the same.
page 181
Axiom H2 User Manual
AirTalk guide
In words:
An alert is triggered by a condition, which depends on one or two datapoints (the trigger variable and
the trigger threshold, which may be a variable or a constant).
An alert, when triggered, sends a message, which is composed of one or more phrases, each of which
uses one or more phrasings, each of which may include a datapoint value.
Sometimes a phrasing includes a special datapoint created by and for the alert condition called the
threshold tracker variable. See below for instructions on using it.
9.1.4.2 Using the threshold tracker variable
Whenever you define an alert, a special datapoint called a threshold tracker variable is also automatically
defined in the datalogger. The threshold tracker variable mirrors (tracks) the threshold value, whether it is set
by a constant or by a variable. Whenever the threshold value is changed, the value of the threshold tracker
variable also changes. The threshold value can change as a result of several different actions:
a constant threshold value is used, and someone changes the constant
a variable threshold value is used, and someone changes which variable (datapoint) supplies the value
a variable threshold value is used, and someone or something changes the value of the variable
a constant threshold value is changed to a variable value, or vice versa
The threshold tracker variable is a single, reliable source for the value used in the alert trigger condition, no
matter how it is defined or changed. Its utility is in constructing the phrase(s) that make up the message that
the alert triggers.
Example
Suppose you are setting up a portable (Quick Deploy) station for use in controlled burn or firefighting
situations. You need to define an alert condition based on air temperature. In each different deployment of the
station, the threshold temperature for triggering the alert will be different. In some situations it might be 30°C,
in others 33°C, in others 35°C or 40°C. Personnel will need change this threshold in the field to account for
changing conditions.
Your desired alert message is: “Alert, Alert. Air temperature is over XX degrees,” and XX must be whatever
the current alert trigger threshold is (that is, the message must change whenever the threshold is changed). You
could accomplish this by editing the phrasing(s) in the message that state the threshold (XX) every time the
threshold is changed, but that is laborious and error-prone, particularly in the field. It would be easy to change
the threshold but forget to change the phrasing(s), or to enter an incorrect value.
The most robust solution to this problem uses two datapoints:
page 182
Axiom H2 User Manual
AirTalk guide
1.
Threshold variable. Define a User Var process to hold the threshold value, and define your alert
trigger condition using this datapoint. This datapoint (User Var) can easily be changed in the field,
and the alert triggering changes with it.
2.
Threshold tracker variable. This variable (datapoint) is automatically defined for you when you
define your alert. It reflects the value of the threshold variable, which may be changed from time
to time. Use it in the phrasing(s) used in the message emitted by the alert.
The threshold tracker variable could be viewed as redundant in this example, since the threshold variable also
supplies the current value of the threshold. But if the alert trigger condition was later modified to use a
constant trigger value (unlikely but possible) or to use a different threshold variable (a different User Var), then
the alert message would be rendered incorrect unless the tracker variable, which always reflects the threshold
value no matter what its source, was used. It is this fidelity to the actual threshold value in use, regardless of
source, that justifies the existence of the threshold tracker variable.
Application
Some pre-planning makes applying the example above much easier.
First, it’s important to know that you cannot use a variable (datapoint) before it is defined. This applies to both
the threshold variable that you define directly and the threshold tracker variable that is automatically defined
when you define an alert. This fact has two implications, one simple and one more complicated:
1.
Threshold variable. Define this variable (with a User Var process) before you begin defining your
alert. (You can use the placeholder technique described below in this case, too, but you don’t have
to if you remember to define your threshold variable first.)
2.
Threshold tracker variable.
Problem: The threshold tracker variable is not defined until you define the alert, and the alert
cannot be fully defined until you define a phrasing that uses the threshold tracker variable.
Solution: Use one of the following “placeholder” techniques:
a.
Placeholder message:
i. Initially define the alert using any message as a placeholder. If you have no
messages defined yet, first define one that has no content.
ii. Define the phrasing(s) to be used in the alert message, using the threshold tracker
variable that now exists because you defined the alert.
iii. Define the phrase(s) and finally the actual message to be used in the alert.
iv. Go back to the alert and change the placeholder message to the actual message
you just defined.
b. Placeholder threshold:
i. Define the phrasing(s) that will be used in the alert. Initially use a temporary
placeholder value for the threshold value. The placeholder value can be a
constant (probably easiest) or any existing datapoint. (You cannot refer to the
threshold tracker datapooint yet because it is not defined until the alert is
defined.)
page 183
Axiom H2 User Manual
AirTalk guide
ii. Follow the standard sequence for defining an alert: Define a phrase using the
phrasing(s), a message using the phrase, and then the alert using the message.
iii. Go back to the placeholder phrasing(s) and change them to use the threshold
tracker variable that now exists because you defined the alert.
Solution (a) is usually the simpler of the two. It is the method used in the detailed instructions
below.
A second consideration is to use only a User Var as a threshold variable, or if you need to be especially clever, a
process output variable that derives only from User Var values. In particular:
WARNING: Do not define a trigger threshold using any variable (datapoint) that changes
often.
AirTalk must do a lot of work to adjust to changes in the threshold value. A quickly changing
threshold value would tie up system resources in constantly readjusting to the new values. The
likely outcome is that the datalogger will function sluggishly or not at all.
Precision and units of the threshold tracker variable
The threshold tracker variable (datapoint) is defined automatically by AirTalk. You can change its name, but
AirTalk determines all its other properties, including precision and units. Precision and units are determined by
the following rule:
If the threshold is a
the Threshold Tracker Variable
precision and units are the
same as the
Constant Value
Trigger Variable
Variable Value
Threshold Variable
page 184
Axiom H2 User Manual
AirTalk guide
9.2 Common configuration tasks
9.2.1 Creating a new phrase and associated phrasings
1.
On the Home screen, tap Telemetry.
2.
The Telemetry screen appears.
3.
Navigate to appropriate Telem tab
(AirTalk is commonly on Telem port
B)
4.
Tap the Status button next to the
Radio Voice Transmitter port.
5.
The AirTalk Status screen appears.
6.
Tap the Setup button.
7.
The Messages tab of the AirTalk
Configuration Editor screen appears.
8.
Tap the Phrases tab.
page 185
Axiom H2 User Manual
AirTalk guide
9.
The Phrases tab of the AirTalk
Configuration Editor screen appears.
10.
Tap Edit.
11.
The AirTalk Configuration Editor
screen enters edit mode and the New
button is enabled.
12.
Tap New.
13.
The Phrase Editor screen opens with
all data controls blank.
14.
Enter a short, descriptive name for the
new phrase in the Name field.
15.
Add phrasings in various languages as
needed. To add a new phrasing:
a.
Tap New.
Note: the New button is disabled if
there are already phrasings for all
available languages.
b. The Phrasing Editor screen
opens with all fields blank.
c. Select the language for the
phrasing. No more than one
phrasing in each language can
be defined for a given phrase.
d. Select elements of the
phrasing: Preamble, Measured
Item, Comparator, Value, and
Units. If you wish an element
to be omitted from the
phrasing, select <none>.
e. To test the phrasing, tap Talk:
The phrasing is spoken on the
AirTalk.
f.
Tap OK.
continued on next page
page 186
Axiom H2 User Manual
AirTalk guide
continued from prev page
g. The phrasing just defined is
saved.
h. The Phrase Editor screen
appears, with the new phrasing
listed.
16.
When all required phrasings have been
added, tap OK.
17.
The AirTalk Configuration Editor
screen appears, with the new phrase
listed.
18.
Tap OK to exit edit mode and return to
the AirTalk Status screen.
end
page 187
Axiom H2 User Manual
AirTalk guide
9.2.2 Creating a new message
1.
On the Home screen, tap
Telemetry.
2.
The Telemetry screen appears.
3.
Navigate to appropriate Telem tab
(AirTalk is commonly on Telem port
B)
4.
Tap the Status button next to the
Radio Voice Transmitter port.
5.
The AirTalk Status screen appears.
6.
Tap the Setup button.
7.
The Messages tab of the AirTalk
Configuration Editor screen appears.
8.
Tap Edit.
9.
The AirTalk Configuration Editor
screen enters edit mode and the New
button is enabled.
10.
Tap New.
continued on next page
page 188
Axiom H2 User Manual
AirTalk guide
continued from prev page
11.
The Message Editor screen opens with
all data controls blank.
12.
Enter a short, descriptive name for the
message in the Name field.
13.
Optionally, enter a 2-, 3-, or 4-digit
DTMF Code used to command that this
message be broadcast.
14.
Add phrases to the message. Normally
they are added in the order they are to
be spoken in the message, but their
ordering can be modified later if
necessary. To add a phrase to the
message:
a.
Select a desired phrase in the
Available Phrases list.
b. Tap Move Right Arrow.
a
b
c. If no item is selected in the
Content list, the phrase is
added to the end of the
Content list. If an item is
selected in the Content list, the
phrase is added before (above)
it. A phrase can be added more
than once to the same
message.
c
d. A message can have no more
than 15 phrases.
15.
Optionally, remove phrases from the
message. To remove a phrase:
a.
a
Select the phrase to be
removed in the Content list.
b. Tap Move Left Arrow.
b
continued on next
pagecontinued on next
page 189
Axiom H2 User Manual
AirTalk guide
continued from prev page
16.
Optionally, change the order of
phrases. To change the position of a
phrase in the Content list:
a.
Select the phrase.
b. To move it up (earlier) in the
list, tap Up.
c. To move it down (later) in the
list, tap Down.
a
b
c
17.
To test the message, tap Talk: The
message is spoken on the AirTalk.
18.
When all phrases for the message have
been entered and ordered correctly, tap
OK
19.
The AirTalk Configuration Editor
screen appears, with the new message
listed (not shown in this image).
20.
Tap OK to exit edit mode and return to
the AirTalk Status screen.
endc
ontin
page 190
Axiom H2 User Manual
AirTalk guide
9.2.3 Creating a new alert
If you plan to use a variable threshold value in the
trigger, and the variable has not yet been defined
1.
On the Home screen, tap Processing.
2.
The Processes screen opens.
3.
Tap New Process.
4.
The Please Select Process Type screen
opens.
5.
Tap User Var.
6.
The User Var Setup screen appears.
7.
Enter the name, units, precision, and a
default value(applied on power-up and
when you click OK on this screen) for
the User Var.
8.
Tap OK.
continued on next page
page 191
Axiom H2 User Manual
AirTalk guide
continued from prev page
9.
The Processing screen reopens,
showing the newly created User Var
process.
10.
Tap Home.
11.
The Home screen appears. Tap
Telemetry.
page 192
Axiom H2 User Manual
AirTalk guide
continued from prev page
12.
The Telemetry screen appears.
13.
Navigate to appropriate Telem tab
(AirTalk is commonly on Telem port
B)
14.
Tap the Status button next to the
Radio Voice Transmitter port.
Alternately, tap the Alerts button. This
takes the user to the Configuration
Editor with the Alerts tab already
selected.
15.
The AirTalk Status screen appears.
16.
Tap the Setup button.
17.
The Messages tab of the AirTalk
Configuration Editor screen appears.
18.
If no messages have yet been defined,
define a placeholder message with no
content now (see section 9.2.2,
Creating a new message).
To understand the reason for defining
a placeholder message, see section
9.1.4.2.
19.
Tap the Alerts tab.
continued on next page
page 193
Axiom H2 User Manual
AirTalk guide
continued from prev page
20.
The Alerts tab of the AirTalk
Configuration Editor screen appears.
21.
Tap Edit.
22.
The AirTalk Configuration Editor
screen enters edit mode and the New
button is enabled.
23.
Tap New.
24.
The Alert Editor screen opens with all
data controls in their default setting.
25.
Enter a short, descriptive Name for the
alert.
26.
In Message, select the message that
this alert should send when triggered.
In some circumstances, you may wish
to use placeholder message: see section
9.1.4.2 for details.
27.
Enter the number of message Repeats
(repeat count), and the repeat Interval.
28.
Enter the Dead Zone if relevant for the
chosen comparison operator and if
desired (a dead zone of 0 is permitted).
29.
Enter the Snooze Time.
30.
Enter a 2-, 3-, or 4-digit Cancellation
DTMF Code if desired.
31.
Click Change… to define the trigger
condition.
32.
The Alert Trigger Editor screen opens
with all data controls in their default
settings:
33.
Select the Trigger Variable and Relation
34.
Select the Threshold type.
a.
If you select a Constant Value
(the default), enter a Threshold
Value. A constant value can
only be changed from this
screen.
continued on next page
page 194
Axiom H2 User Manual
AirTalk guide
continued from prev page
b. If you select a Variable Value,
select a Threshold Variable to
supply that value.
is initially
set to the name of the alert followed by
_Thld. Edit this value if you wish to
use a different tracking variable name.
(Only the name changes; the variable
itself is the same.)
35. Threshold Tracker Variable
36.
Tap OK.
37.
The Alert Editor screen reopens.
38.
Tap OK.
39.
The AirTalk Configuration Editor
screen appears, with the new alert
listed.
end
page 195
Axiom H2 User Manual
AirTalk guide
9.2.4 Modifying or deleting an existing phrase or phrasing
1.
On the Home screen, tap Telemetry.
2.
The Telemetry screen appears.
3.
Navigate to appropriate Telem tab
(AirTalk is commonly on Telem port
B)
4.
Tap the Status button next to the
Radio Voice Transmitter port.
5.
The AirTalk Status screen appears.
6.
Tap the Setup button.
7.
The Messages tab of the AirTalk
Configuration Editor screen appears.
8.
Tap the Phrases tab.
continued on next page
page 196
Axiom H2 User Manual
AirTalk guide
9.
The Phrases tab of the AirTalk
Configuration Editor screen appears.
10.
Tap Edit.
11.
The AirTalk Configuration Editor
screen enters edit mode and the Modify
and Delete buttons are enabled.
12.
Select a phrase in the list.
Deleting a phrase
WARNING: When you delete a
phrase, it is deleted permanently
from the datalogger.
13.
To delete the selected phrase, tap
Delete.
14.
If the phrase is not used in any
messages, no confirmation is required.
15.
If the phrase is used in one or more
messages, a confirmation dialog
appears.
a.
To confirm deletion, click OK.
b. To cancel deletion, click
Cancel.
16.
The phrase is deleted and removed
from the list.
continued on next page
page 197
Axiom H2 User Manual
AirTalk guide
continued from prev
pagecontinued from prev
Modifying a phrase
(including deleting or modifying a phrasing)
17.
To delete phrasings or modify the
phrase definition or the phrasings of a
selected phrase, tap Setup.
18.
The Phrase Editor screen opens with
the data controls filled with the current
information (name, defined phrasings)
for the selected phrase.
Deleting a phrasing
WARNING: When you delete a
phrasing, it is deleted permanently
from the datalogger.
19.
To delete a phrasing:
a.
Select the phrasing in the list.
b. Tap Delete.
c. The phrasing is removed from
the list immediately.
page 198
Axiom H2 User Manual
AirTalk guide
continued from prev page
Modifying a phrasing
20.
The Phrase Editor screen opens with
the data controls filled with the current
information (name, defined phrasings)
for the selected phrase.
21.
To modify a phrasing:
a.
Select the phrasing in the list.
b. Tap Setup
22.
The Phrasing Editor screen opens with
the data controls filled with the current
information for the selected phrasing.
23.
Modify phrasing elements using the
controls.
24.
You can click Talk to have the
modified phrasing spoken on the
connected AirTalk.
25.
To save your changes, click OK.
26.
Alternately, to abandon your changes,
click Cancel.
27.
The Phrase Editor screen appears.
28.
To save all changes to the phrase, tap
OK.
29.
To abandon all changes to the phrase,
tap Cancel.
continued on next page
page 199
Axiom H2 User Manual
AirTalk guide
continued from prev page
30.
The AirTalk Configuration Editor
screen appears.
31.
Tap OK exit edit mode and return to
the AirTalk Status screen.
end
page 200
Axiom H2 User Manual
AirTalk guide
9.2.5 Modifying or deleting an existing message
1.
On the Home screen, tap Telemetry.
2.
The Telemetry screen appears.
3.
Tap the Status button next to the
Radio Voice Transmitter port.
4.
The AirTalk Status screen appears.
5.
Tap the Setup button.
6.
The Messages tab of the AirTalk
Configuration Editor screen appears.
7.
Tap Edit.
8.
The AirTalk Configuration Editor
screen enters edit mode and the
Modify… and Delete buttons are
enabled.
9.
Select a message in the list.
continued on next page
page 201
Axiom H2 User Manual
AirTalk guide
continued on prev page
Deleting
WARNING: When you delete a
message, it is deleted permanently
from the datalogger.
10.
To delete the selected message, tap
Delete.
11.
If the message is not used in any alerts,
no confirmation is required.
12.
If the message is used in one or more
alerts, a confirmation dialog appears.
a.
To confirm deletion, click OK.
b. To cancel deletion, click
Cancel.
13.
The message is deleted and removed
from the list.
Modifying
14.
To modify the selected message, tap
Setup.
continued on next page
page 202
Axiom H2 User Manual
AirTalk guide
continued from prev page
15.
The Message Editor screen opens filled
with the current information (name,
defined phrasings) for the selected
phrase.
16.
You can change the Name, DTMF Code
and the phrases and their ordering.
This is done exactly as described in
section 9.2.2, Creating a new message.
17.
When all changes are complete:
a.
Tap OK to save them.
b. If you do not wish to save, tap
Cancel to abandon your
changes.
18.
The AirTalk Configuration Editor
screen appears, with the modified
message listed.
19.
Tap OK exit edit mode and return to
the AirTalk Status screen.
end
page 203
Axiom H2 User Manual
AirTalk guide
9.2.6 Modifying or deleting an existing alert
1.
On the Home screen, tap Telemetry.
2.
The Telemetry screen appears.
3.
Navigate to appropriate Telem tab
(AirTalk is commonly on Telem port
B)
4.
Tap the Status button next to the
Radio Voice Transmitter port.
Alternately, tap the Alerts button. This
takes the user to the Configuration
Editor with the Alerts tab already
selected.
5.
The AirTalk Status screen appears.
6.
Tap the Setup button.
7.
The Messages tab of the AirTalk
Configuration Editor screen appears.
8.
Tap the Alerts tab.
continued on next page
page 204
Axiom H2 User Manual
AirTalk guide
continued from prev page
9.
The Alerts tab of the AirTalk
Configuration Editor screen appears.
10.
Tap Edit.
11.
The AirTalk Configuration Editor
screen enters edit mode and the Setup
and Delete buttons are enabled.
12.
Select an alert from the list.
Deleting
WARNING: When you delete an
alert, it is deleted immediately
and permanently from the
datalogger.
13.
To delete the selected alert, tap Delete.
14.
The alert is deleted immediately,
without any intervening confirmation
step.
Modifying
15.
To modify the selected alert, tap Setup.
continued on next page
page 205
Axiom H2 User Manual
AirTalk guide
continued from prev page
16.
The Alert Editor screen opens with data
controls filled with the current
information for the selected alert.
17.
Change the information defining the
alert.
18.
When all changes are complete:
a.
To save your changes, click
OK.
b. Alternately, to abandon your
changes, click Cancel.
19.
The AirTalk Configuration Editor
screen appears.
20.
Tap OK or Home to close the AirTalk
Configuration Editor and return to the
AirTalk Status screen or the datalogger
Home screen, respectively.
end
page 206
Axiom H2 User Manual
AirTalk guide
9.2.7 Selecting the current language
1.
On the Home screen, tap
Telemetry.
2.
The Telemetry screen appears.
3.
Navigate to appropriate Telem tab
(AirTalk is commonly on Telem port
B)
4.
Tap the Status button next to the
Radio Voice Transmitter port.
5.
The AirTalk Status screen appears.
6.
Tap the Setup button.
7.
The Messages tab of the AirTalk
Configuration Editor screen appears.
8.
Tap the Languages tab.
continued on next page
page 207
Axiom H2 User Manual
AirTalk guide
continued from prev page
9.
The Languages tab of the AirTalk
Configuration Editor screen appears.
10.
Tap Edit.
11.
The AirTalk Configuration Editor
screen enters edit mode and the Set
Lang button is enabled.
12.
Tap Set Lang.
13.
The Set AirTalk Language screen
appears.
14.
Tap to select a language from the list.
15.
Tap OK.
16.
The AirTalk Configuration Editor
screen appears.
17.
Tap OK exit edit mode and return to
the AirTalk Status screen.
end
page 208
Axiom H2 User Manual
AirTalk guide
9.3 Configuration reference
9.3.1 Home screen (parts related to AirTalk)
Access: Home
Note: The
Home screen has many functions. This section discusses only functions related to AirTalk.
Alerts active (resumed)
Alerts suspended
Figure 9-6: Home Screen with AirTalk Status
9.3.1.1
Indicators and controls
Alert suspend status
Display text in screen title. Visible when alerts are suspended (see section 9.1.3.4.1).
Telem
Status indicator. Always visible. Displays power information for the telemetry devices.
When the AirTalk extension is installed, the right half of this indicator shows power status for the AirTalk
hardware (on the right, since AirTalk is always attached to Telemetry Port B).
Colour
Meaning
Green
Red
Black
Datalogger is supplying power to the AirTalk port
Port power is turned off
Port power is disabled
page 209
Axiom H2 User Manual
AirTalk guide
9.3.2 Telemetry screen
Access: Home ► Telemetry
The Telemetry screen shows a summary of the telemetry devices connected to the datalogger in a tabbed
format.
When the AirTalk extension is installed the applicable tab (usually Port B) displays a brief summary of AirTalk
status, as shown in the figure below.
Status summary
Power status
indicator
Figure 9-7: Telemetry screen, Port B, with AirTalk installed
9.3.2.1
Indicators and controls
Power status indicator
Coloured display box. Always visible.
Colours as for Telem status indicator on Home screen (see section 9.3).
Status summary
Display text. Always visible.
Summarizes configuration and current or recent events on AirTalk:
Device Type:
indicates an AirTalk device is connected to this port, followed optionally by a word
describing its current state (initializing, stopped) if different than running normally.
Language: Currently selected language (see section 9.3.15).
Last DTMF Code rec’d: Displays the last DTMF code received via radio. If the DTMF code is not used
(unassigned) in the current AirTalk configuration, the annotation “not used” appears in parentheses
following the code.
Radio Type: Displays the type of radio connected to the AirTalk hardware (set in the Factory Settings
screen, not normally modified by the user).
Cutoff: Telemetry port power supply voltage cutoff value (see section 7.9.2).
Resume: Telemetry port power supply voltage resume value (see section 7.9.2).
Pwr Mgt
page 210
Axiom H2 User Manual
AirTalk guide
Button. Always enabled.
Opens the Power Management screen for the telemetry port.
Status
Button. Always enabled.
Opens the AirTalk Status screen.
Alerts
Button. Always enabled.
Opens the AirTalk Configuration Editor screen – Alerts tab, for quick access to the Alerts Editor.
9.3.3 AirTalk Status screen
Access: Home ► Telemetry ► Status
Alerts active (resumed)
Event
summary
Alerts suspended
Event
summary
Figure 9-8: AirTalk Status screen
page 211
Axiom H2 User Manual
9.3.3.1
AirTalk guide
Indicators and controls
Alert suspend status
Display text in screen title. Visible when alerts are suspended (see section 9.1.3.4.1).
Event summary
Display text.
Displays statistics on message events that have occurred on AirTalk since the last time the system was reset
or the last time the Reset button was pressed. If a message is currently being spoken by AirTalk, further
message requests are queued. Messages are spoken in the order they are queued. When the queue is empty,
AirTalk stops transmitting.
Reset
Button. Always enabled.
Resets the “messages spoken” counts.
Back
Button. Always enabled.
Returns to the Telemetry screen.
Setup
Button. Always enabled.
Opens the AirTalk Configuration Editor screen.
History
Button. Always enabled.
Opens the AirTalk History screen.
Home
Button. Always enabled.
Returns to the Home screen.
page 212
Axiom H2 User Manual
AirTalk guide
9.3.4 AirTalk History screen
Access: Home ► Telemetry ► Status ► History
This screen displays a log of AirTalk activity.
Figure 9-9: AirTalk History screen
9.3.4.1
Indicators and controls
OK
Button. Always enabled.
Returns to the AirTalk Status screen.
Home
Button. Always enabled.
Returns to the Home screen.
9.3.5 AirTalk Configuration Editor screen – common elements
Access: Home ► Telemetry ► Status ► Setup
The AirTalk Configuration Editor screen consists of a set of tabs and a set of common controls. This section
describes the common controls and features.
All AirTalk Configuration Editor screens (tabs) are either in view mode or edit mode. When a screen is in view
mode, the user can see information but not modify it. When in edit mode, the user can modify it.
page 213
Axiom H2 User Manual
AirTalk guide
Tabs
Figure 9-10: AirTalk Configuration Editor screen – common elements
9.3.5.1
Indicators and controls
Tabs
Opens the selected tab.
OK
Button. Always enabled.
Returns to the AirTalk Status screen.
Edit
Button. Enabled when the user has edit permission.
Places the screen (including tab contents) in edit mode.
Home
Button. Always enabled.
Returns to the Home screen.
page 214
Axiom H2 User Manual
AirTalk guide
9.3.6 AirTalk Configuration Editor screen – Phrases tab
Access: Home ► Telemetry ► Status ► Setup ► Phrases
View mode
Phrase
list
Edit mode
Phrase
list
Figure 9-11: AirTalk Configuration Editor screen – Phrases tab
9.3.6.1 Indicators and controls
Phrase list
Single-select list. Always enabled.
Lists all phrases defined in the datalogger. For each phrase, the phrase’s name and its (possibly abbreviated)
content (in the AirTalk’s current language) are displayed.
New
Enabled in edit mode.
Opens the Phrase Editor screen in edit mode, with blank fields.
Setup
Visible in view mode. Enabled when a phrase is selected in the list.
page 215
Axiom H2 User Manual
AirTalk guide
Opens the Phrase Editor screen in current mode (view or edit), loaded with the selected phrase.
Delete
Enabled when in edit mode and a phrase is selected in the list.
Deletes the selected phrase . If the phrase is associated with one or more messages, a Confirm Delete dialog
intervenes. If not, the phrase is deleted immediately.
Deletion is permanent (not undoable).
9.3.7
Phrase Editor screen
Access:
Home ► Telemetry ► Status ► Setup ► Phrases ► Setup
(view or edit mode)
View mode
Edit mode
Figure 9-12: Phrase Editor screen
9.3.7.1
Indicators and controls
Name
Textbox.
Displays/edits the name for the phrase. Name must be unique amongst all phrases.
Phrasings
Single-select list. Always enabled.
Lists the names of all currently defined phrasings for the phrase. The language of each phrasing is shown as
well as its (possibly abbreviated) content.
New
Enabled in edit mode.
Opens the Phrasing Editor screen in edit mode, with blank fields.
Setup
Enabled when a phrasing is selected in the list.
Opens the Phrasing Editor screen in current mode (view or edit), loaded with the selected phrasing .
page 216
Axiom H2 User Manual
AirTalk guide
Delete
Enabled when in edit mode and a phrasing is selected in the list.
Deletes the selected phrasing immediately (no confirmation dialog).
Deletion is permanent (not undoable).
OK
Button. Always enabled.
Commits changes made in this dialog by adding, changing or deleting phrasings, and returns to the AirTalk
Configuration Editor – Phrases screen. Changes are not committed until this button is pressed.
Cancel
Button. Always enabled.
Cancels all changes made in this dialog and returns to the AirTalk Configuration Editor – Phrases screen.
9.3.8 Phrasing Editor screen
Access:
Home ► Telemetry ► Status ► Setup ► Phrases ► Setup ► Setup
(view or edit mode)
Each of Preamble, Measured Item, Comparator, Value, and Units corresponds to one “part” of the vocabulary.
Each of these controls is initialized to contain its part of the vocabulary, along with the additional entry
“<none>”. If the phrasing contains an item of that part, that item is selected in the combo box. Otherwise
“<none>” is selected.
In English, a phrasing defined on this screen is spoken in the following form:
<Preamble>. <Measured Item> <Comparator> <Value> <Units>.
Example:
Alert Alert. Air temperature is greater than thirty Celsius.
Preamble
Measured
item
Comparator
Value
Units
Figure 9-13: Example phrasing
page 217
Axiom H2 User Manual
AirTalk guide
Variable value
Constant value
Figure 9-14: Phrasing Editor screen
9.3.8.1 Indicators and controls
Language
Drop-down selector. Enabled when and only when creating a new phrasing.
Displays/edits the language for this phrasing. When editing (creating a new phrasing), the selections are
limited to those languages for which a phrasing does not already exist for the parent phrase.
When the user changes this value, Preamble, Measured Item, Comparator, Value, and Units are set to
<none>.
Preamble
Drop-down selector. Enabled when in edit mode.
Measured Item
Drop-down selector. Enabled when in edit mode.
This item should correspond to Value on this screen (e.g. AIR TEMPERATURE and AirTemp). This
condition cannot be checked automatically, so the user must ensure Measured Item and Value are consistent
with each other.
Comparator
Drop-down selector. Enabled when in edit mode.
Variable Value / Constant Value
Radio buttons. Enabled when in edit mode.
Selects the type of Value, and the control for it.
Variable Value
Value control.
causes Value to be retrieved from a datapoint in the datalogger memory, selected by the
causes Value to be determined by a fixed sequence of numbers or phonetic alphabet letters
(“Alpha,” “Bravo,” “Charlie,” etc.), entered in the Value control.
Constant Value
Value
page 218
Axiom H2 User Manual
AirTalk guide
Enabled when in edit mode. Drop-down selector when Data Point Value selected. Text box when Constant
Value selected.
When Constant Value is selected, the user must enter a space-separated sequence of one or more numbers
or words. See notes below for details.
Speak Digits
Checkbox. Enabled when in edit mode.
When selected, numeric values are spoken as separate digits. Example: 137 is spoken as “one three seven.”
When unselected, numeric values are spoken as compound words. Example: 137 is spoken as “one hundred
thirty-seven.”
Units
Drop-down selector. Enabled when in edit mode.
OK
Button. Always enabled.
Accepts but does not commit changes made in this dialog and returns to the Phrase Editor screen. Changes
are not committed until the OK button in the Phrase Editor screen is pressed.
Talk
Button. Always enabled.
If the phrasing is valid, sends the Phrasing to the AirTalk hardware, on which it is spoken. If the phrasing is
invalid, the user is informed and the Phrasing is not spoken.
Cancel
Button. Always enabled.
Cancels all changes made in this dialog and returns to the Phrase Editor screen.
9.3.8.2 Validity conditions
A Phrasing must have at least either a Preamble part or both a Measured Item part and a Value part. It may
have anything in addition to these minimums.
9.3.8.3
Constant values
A constant value is a sequence of one or more numbers or words separated by spaces.
A number is any decimal number possibly prefixed by a minus sign. (Plus signs are allowed but not spoken.)
Numbers are spoken just as they are spoken as data values (including the effect of the "Check Digits" box.)
A word is a sequence of one or more letters and/or digits, without spaces. It must contain at least one letter (or
else it's considered a number.) If the word happens to be a NATO phonetic alphabet member (e.g. “bravo”;
see below) that word is spoken. Otherwise, the individual letters are spoken as phonetic alphabet letters. Digits
are spoken individually (even if there's a sequence of them.)
page 219
Axiom H2 User Manual
AirTalk guide
Examples
alfa 23.25 hotel
alfa 23.25 hotel
fts
fts23
1635 maple
alfa twenty-three point two five hotel (if Speak Digits is not checked)
alfa two three point two five hotel (if Speak Digits is checked)
foxtrot tango sierra
foxtrot tango sierra two three (regardless of the setting of Speak Digits)
one six three five mike alfa papa lima echo (if Speak Digits is checked)
NATO phonetic letters:
A — Alfa
B — Bravo
C — Charlie
D — Delta
E — Echo
F — Foxtrot
G — Golf
H — Hotel
I — India
J — Juliet
K — Kilo
L — Lima
M — Mike
N — November
O — Oscar
P — Papa
Q — Quebec
R — Romeo
S — Sierra
T — Tango
U — Uniform
V — Victor
W — Whiskey
X — Xray
Y — Yankee
Z — Zulu
page 220
Axiom H2 User Manual
AirTalk guide
9.3.9 AirTalk Configuration Editor screen – Messages tab
Access: Home ► Telemetry ► Status ► Setup ► Messages
View mode
Message
list
Edit mode
Message
list
Figure 9-15: AirTalk Configuration Editor screen – Messages tab
9.3.9.1 Indicators and controls
Message list
Single-select list. Always enabled.
Lists all messages defined in the datalogger. For each message, displays its name, DTMF code (if any), and
the alerts that use it (the name of the alert if just one; the number of alerts if more than one).
New
Enabled in edit mode.
Opens the Message Editor screen in edit mode, with blank fields.
Setup
Always visible. Enabled when a message is selected in the list.
page 221
Axiom H2 User Manual
AirTalk guide
Opens the Message Editor screen in current mode (view or edit), loaded with the selected message.
Delete
Enabled when in edit mode and a message is selected in the list.
Deletes the selected message. If the message is associated with one or more alerts, a Confirm Delete dialog
intervenes. If not, the message is deleted immediately.
Deletion is permanent (not undoable).
9.3.10 Message Editor screen
Access:
Home ► Telemetry ► Status ► Setup ► Messages ► Setup
(view or edit mode)
Figure 9-16: Message Editor screen
9.3.10.1 Indicators and controls
Name
Textbox.
Displays/edits the name for the message. Name must be unique amongst all messages.
DTMF Code
Textbox. Enabled in edit mode.
DTMF codes can be 2 to 4 digits long.
Content
Single-select list. Enabled (selection) in edit mode.
Lists the names of all phrases in the message, in order of speaking.
A message can have no more than 15 phrases.
Up
Button. Enabled when in edit mode and a phrase not at the top of the list is selected.
Moves the current selection in the Content list up one line.
page 222
Axiom H2 User Manual
AirTalk guide
Down
Button. Enabled when in edit mode and a phrase not at the bottom of the list is selected.
Moves the current selection in the Content list down one line.
Available Phrases
Single-select list. Enabled (selection) in edit mode.
Lists all phrases available for use in messages. For each phrase, the phrase name and a possibly abbreviated
text string representing the message in the current language are listed.
Move Right Arrow
Button. Enabled when in edit mode and a phrase is selected in Available Phrases.
Adds the current selection in Available Phrases to Content. If no item is selected in Content , the phrase is
added to the end of Content. If an item is selected in Content, the phrase is added before (above) it.
Available Phrases
remains unchanged. A phrase can be added more than once to the same message.
Move Left Arrow
Button. Enabled when in edit mode and a phrase is selected in Content.
Removes the selected item from Content. Available Phrases remains unchanged.
page 223
Axiom H2 User Manual
AirTalk guide
9.3.11 AirTalk Configuration Editor screen – Alerts tab
Access: Home ► Telemetry ► Status ► Setup ► Alerts
View mode
Alerts
list
Suspend
status
Suspend /
Resume
Edit mode
Figure 9-17: AirTalk Configuration Editor screen – Alerts tab
9.3.11.1 Indicators and controls
Alerts list
Single-select list. Always enabled.
Lists all alerts defined in the datalogger. For each alert, the alert’s name and its trigger condition are
displayed.
Disable Alerts
Button. Visible when alerts are globally enabled.
Deactivates all alerts whose activation setting is “Use Global Setting.” Any currently firing alerts that are
deactivated by this action are immediately stopped.
This setting is recorded in the datalogger configuration, and so will persist between datalogger reboots.
page 224
Axiom H2 User Manual
AirTalk guide
Suspend Alerting
Button. Visible when alerting is active.
Suspends alerting and is replaced by Resume Alerting button.
Resume Alerting
Button. Visible when alerting is suspended.
Resumes (activates) alerting and is replaced by Suspend Alerting button.
Suspend Alerting on Power Up
Checkbox. Enabled in edit mode.
Sets the initial behaviour for alerting (active or suspended) when the datalogger powers up.
New
Button. Enabled in edit mode.
Opens the Alert Editor screen in edit mode, loaded with default values.
Setup
Button. Always visible. Enabled when an alert is selected in the list.
Opens the Alert Editor screen in current mode (view or edit), loaded with the selected alert.
Delete
Button. Enabled when in edit mode and an alert is selected in the list.
Deletes the selected alert immediately (no Confirm Delete dialog intervenes).
Deletion is permanent (not undoable).
9.3.12 Alert Editor screen
Access:
Home ► Telemetry ► Status ► Setup ► Alerts ► Setup
(view or edit mode)
For an explanation of the meanings of Trigger Condition, Repeats, Interval, Dead Zone, and Snooze Time, see
section 9.1.3.2 Alerts.
page 225
Axiom H2 User Manual
AirTalk guide
Trigger Condition
Enablement setting
Figure 9-18: Alert Editor screen
9.3.12.1 Indicators and controls
Name
Textbox.
Displays/edits the name for the alert. Name must be unique amongst all alerts.
Message
Drop-down selector. Enabled when in edit mode.
Lists all defined messages in the datalogger.
Trigger Condition
Display. Always visible.
Displays the current trigger condition. (To modify, click Change…).
Change…
Button. Always enabled.
Opens the Alert Trigger Editor screen.
Repeats
Textbox with spinners. Enabled when in edit mode.
Displays/edits number of times to repeat transmission of the message when the alert is triggered.
Interval
Textbox. Enabled when in edit mode.
Displays/edits the time interval (in seconds) between repeat transmissions of the message when the alert is
triggered.
Dead Zone
Textbox. Enabled when in edit mode.
Displays/edits dead zone value (floating point number) for alert triggering evaluation.
page 226
Axiom H2 User Manual
AirTalk guide
Snooze Time
Textbox. Enabled when in edit mode.
Displays/edits snooze time (seconds) for alert triggering evaluation.
Cancellation DTMF Code
Textbox. Enabled when in edit mode.
Displays/edits DTMF code used to cancel alert message repeat transmissions.
DTMF codes must be 2 to 4 digits long. Alerts can share a common cancellation code. However a
cancellation code cannot be the same as a message transmission code.
Enabled / Disabled
Radio button group. Always enabled.
Enablement setting for the alert.
Enabled: The
alert is enabled.
Disabled: The
alert is disabled.
For information about enabling and disabling alerts, see section 9.1.3.4, Controlling whether alerts are
transmitted.
OK
Button. Always enabled.
Commits changes made in this dialog and returns to the AirTalk Configuration Editor – Alerts screen,
providing the defined alert is valid (see below). Changes are not committed until this button is pressed.
Cancel
Button. Always enabled.
Cancels all changes made in this dialog and returns to the AirTalk Configuration Editor – Alerts screen.
9.3.12.2 Validity conditions
Name
must not be the name of any other defined alert.
Selections must be made in Message, Trigger Condition.
Snooze Time
Interval
must be either empty or an integer at least 0 (seconds).
must be integer at least 20 (seconds); if Repeat Count is zero, then Interval may be blank.
Dead Zone
must be either empty or a floating point number at least 0.
Cancellation DTMF Code
must be either empty or between two and four digits.
page 227
Axiom H2 User Manual
AirTalk guide
9.3.13 Alert Trigger Editor screen
Access: Home ► Telemetry ► Status ► Setup ► Alerts ► Edit ► Alert Editor ► Change…
For an explanation of the meanings of Trigger Variable, Relation, and Threshold, see section 9.1.3.2 Alerts.
Briefly, this screen defines the condition on which an alert may be triggered (depending also on additional
conditions; see section 9.1.3.2). The condition has the form of an arithmetic comparison (less, greater, equals,
etc.):
Variable Relation Threshold
example: VB (Variable) < (Relation) 13 (Threshold) (shown below in constant threshold screen shot).
and is satisfied when the value of Variable satisfies the specified relation to Threshold.
Variable threshold
Constant threshold
9.3.13.1 Indicators and controls
Trigger Variable
Drop-down list. Enabled in edit mode. Lists all defined datapoints (variables) in the datalogger.
Determines the variable in the trigger condition.
Relation
Drop-down list. Enabled in edit mode. Lists all arithmetic relations (less, greater, equal and their negations).
Determines the relation in the trigger condition.
Threshold
Radio button set.
displays the controls for selecting a variable defined in the datalogger as the threshold in
the trigger condition.
Variable Value
Constant Value
displays the controls for setting a constant value as the threshold in the trigger condition.
Threshold Variable
Drop-down list. Enabled in edit mode. Visible when Threshold is set to Variable Value.
page 228
Axiom H2 User Manual
AirTalk guide
Lists all defined datapoints (variables) in the datalogger. Determines the datapoint whose value is used as
the threshold in the trigger condition.
Threshold Value
Textbox. Enabled in edit mode. Visible when Threshold is set to Constant Value.
Determines the fixed constant value used as the threshold in the trigger condition.
Threshold Tracker Variable
Textbox. Enabled in edit mode.
Sets the name of the datapoint that tracks (duplicates) the value of the threshold setting (whether set by a
variable or constant) used in the trigger condition.
9.3.14 AirTalk Configuration Editor screen – DTMF tab
Access: Home ► Telemetry ► Status ► Setup ► DTMF
Figure 9-19: AirTalk Configuration Editor screen – DTMF tab
9.3.14.1 Indicators and controls
DTMF Codes Currently in Use
Lists all DTMF codes that are currently in use by the AirTalk configuration. The list includes DTMF codes
that
trigger messages
cancel alerts
resume alerting (reserved code 8888)
suspend alerting (reserved code 9999)
page 229
Axiom H2 User Manual
AirTalk guide
9.3.15 AirTalk Configuration Editor screen – Languages tab
Access: Home ► Telemetry ► Status ► Setup ► Languages
View mode
Edit mode
Figure 9-20: AirTalk Configuration Editor screen – Languages tab
9.3.15.1 Indicators and controls
Current Language
Display text.
Displays the currently selected language for AirTalk transmissions.
Set Lang
Button. Enabled in edit mode.
Opens the Set AirTalk Language dialog.
Current Language Priority
Enabled (selection) in edit mode.
A single-select list showing all supported languages in priority order.
Up
Button. Enabled when in edit mode and a language not at the top of the list is selected.
Moves the current selection in the Current Language Priority list up one line.
Down
Button. Enabled when in edit mode and a language not at the bottom of the list is selected.
Moves the current selection in the Current Language Priority list down one line.
page 230
Axiom H2 User Manual
AirTalk guide
9.3.16 Set AirTalk Language screen
Access: Home ► Telemetry ► Status ► Setup ► Edit ► Languages ► Set Lang
Languages list
Figure 9-21: Set AirTalk Language screen
9.3.16.1 Indicators and controls
Languages list
Single-select list. Always enabled.
Displays/selects the current language for AirTalk messages.
OK
Button. Always enabled.
Commits changes made in this dialog and returns to the AirTalk Configuration Editor – Languages screen.
Changes are not committed until this button is pressed.
Commit includes sending the necessary language sound files to the AirTalk hardware if they are not already
loaded.
If the commit fails (AirTalk hardware returns a failure code), some indication of this is presented to the user
and the dialog is not dismissed. The user may retry with OK or tap Cancel to abandon.
Cancel
Button. Always enabled.
Cancels all changes made in this dialog and returns to the AirTalk Configuration Editor – Languages screen.
9.3.17 Visit Report
AirTalk maintains a history log (viewable via Home ► Telemetry ► Status ► History). This log is downloaded
from the AirTalk hardware and included in the Visit Report when a Visit Report is requested by a user.
page 231
Axiom H2 User Manual
AirTalk guide
9.4 Operational notes
9.4.1 DTMF codes
9.4.1.1 Description
DTMF (dual-tone, multi-frequency) is the name for the tone coding used on telephone touch-tone keypads,
including the keypads on the two-way radios used with AirTalk.
AirTalk can be configured to respond to DTMF codes sent from users’ radios. A DTMF code can serve one of
the following functions:
request a message to be spoken, or
request a currently repeating message to stop repeating (be cancelled)
request alerting to be suspended (reserved code 9999)
request alerting to be resumed (reserved code 8888)
(For details on configuring DTMF codes in AirTalk, see section 9.2.2, Creating a new message.)
9.4.1.2 Sending DTMF codes from a radio
No other traffic
A DTMF code can only be sent when there is no other traffic on the channel.
If AirTalk (or another person) is transmitting on the frequency, then you must wait until the transmission
completes before sending a DTMF code. In particular, a currently transmitting message cannot be cancelled
until its current repeat has finished being spoken. Because AirTalk has a non-receptive “blank period” of about
1 second after each transmission, cancelling may be difficult if the repeat interval (time between repeats) is
short, and impossible if the repeat interval is very short.
Do not send a DTMF code if you can hear another person sending one at the same time.
Speed of keying
When you send a DTMF code, you must key it in reasonably quickly.
Approximately stated (details below), the digits in a code must be pressed no more than one second apart.
Having a time limit enables the system to determine if you are sending a 2-, 3-, or 4-digit code. (AirTalk can
have 2-digit or 3-digit codes that are the same as the beginning of one or more longer codes. Therefore the
datalogger has to wait to see which one you meant.) Having the time limit set at one second allows the system
to decide what is happening and respond to it reasonably quickly.
A more precise description of the one-second keying constraint needs a little more explanation:
When you press a button on the keypad, the tone begins sending as soon as the button contact is
closed. The tone continues until you release the button and the button contact opens. So each tone has
a beginning and an end.
The exact requirements on speed of DTMF keying are this: You must begin sending the next DTMF
digit no more than one second after the beginning of the previous one (not after the end, which would
be a looser condition).
page 232
Axiom H2 User Manual
9.4.1.3
AirTalk guide
How AirTalk processes DTMF codes
If you key in a single digit and no further digit within one second, AirTalk ignores the digit.
If you key in two or three digits with no more than one second between digit starts, and no further digit within
one second after the last one, AirTalk sends the two- or three-digit code to the datalogger for processing.
If you key in four digits within four seconds, AirTalk sends the four-digit code immediately to the datalogger
for processing.
If you continue keying digits after keying in four digits within four seconds:
AirTalk dispatches the first four digits to the datalogger for processing.
AirTalk continues storing any following digits it receives until the datalogger tells AirTalk to transmit a
message and AirTalk actually begins transmitting. (While AirTalk is transmitting, it cannot receive any
digits.)
The additional digits stored are subject to the processing rules above (one-second rule, etc.). They are
treated as another DTMF code, and may therefore cause the system to respond.
The number of digits stored depends on how fast you key them in and how soon AirTalk begins
transmitting the message. Therefore the number of digits stored is unpredictable, and so entering more
than four digits in succession could result in unexpected behaviour.
FTS recommends that you key in only one DTMF code at a time, and that you wait for the
response to a code before keying in another code.
9.4.1.4 How the system responds to DTMF codes
When the datalogger receives a code, it compares it to all configured DTMF codes (transmit codes, cancel
codes, and suspend/resume codes).
Updates the Last Received display on the Telemetry Status screen with this code.
If it finds a match, the datalogger takes the appropriate action (triggers or cancels a message
transmission, or suspends or resumes alerting).
If the code received does not match any configured code, the datalogger does nothing except to
indicate on the Telemetry Status screen that the last received code was unused (not defined in
AirTalk).
page 233
Axiom H2 User Manual
Chapter 10
RVT telemetry reference
RVT telemetry reference
page 234
Axiom H2 User Manual
RVT telemetry reference
10.1 “RVT” vs. “AirTalk”
RVT is the first (and quite different) release of the FTS radio voice messaging system whose current release is
known as AirTalk. This chapter documents the first-generation RVT system for those customers who have it.
If you have AirTalk, please see , Chapter 9 AirTalk guide.
10.2 Status
The RVT Status screen is displayed (Figure 10-1) when Status associated with the RVT transmitter on the
Telemetry screen (usually on tab Telem B) is pressed. The RVT Status screen provides an interface for the user
to configure the RVT settings. The Get and Send buttons are used to download and upload configuration files
to the RVT. The Save and Load buttons are used to store and retrieve configuration files from a USB flash
drive or the datalogger memory.
Figure 10-1: RVT Status screen
10.2.1 Get configuration
The Get button on the RVT Status screen is used to download the connected RVT’s current configuration file
to the datalogger. The retrieved configuration is displayed on the RVT Status screen as shown in Figure 10-2. It
is recommended that the retrieved RVT configuration be saved to a file (either on the datalogger or on a USB
memory stick) so that the user can revert to the original configuration if required.
page 235
Axiom H2 User Manual
RVT telemetry reference
Figure 10-2: RVT Get Configuration screen
10.2.2 Send configuration
The Send button is used to upload the configuration file displayed on the RVT Status screen to the connected
RVT. When uploading the file to the connected RVT a ‘please wait’ message is displayed followed by the
message shown in Figure 10-3. If an error is displayed, the user should re-try the upload process. The error may
be due to the tight timing requirements between the RVT and the datalogger and this timing may have been
affected by normal datalogger or RVT operation.
Figure 10-3: RVT Send Configuration screen
10.2.3 Save configuration
The Save button on the RVT Status screen is used to store the retrieved RVT configuration to a file on the
USB memory stick or datalogger memory. The user is required to specify a filename after pressing Save (see
Figure 10-4). The Save process defaults to the USB memory stick if a memory stick has been inserted in the
datalogger.
page 236
Axiom H2 User Manual
RVT telemetry reference
Figure 10-4: Choose RVT Configuration Save File screen
10.2.4 Load configuration
The Load button is used to retrieve an RVT configuration file from the USB memory stick or datalogger
memory. The user is required to select a file after pressing Load (see Figure 10-5). The Load process defaults to
the USB memory stick if a memory stick has been inserted in the datalogger. The newly loaded file appears on
the RVT Status screen, it can then be uploaded to the RVT using Send.
Figure 10-5: RVT Load Configuration screen
page 237
Axiom H2 User Manual
10.3
RVT telemetry reference
Editing an RVT configuration
An RVT configuration file can be edited on the datalogger or the file can be edited externally using any text
editor. The RVT configuration makes reference to variables in the datalogger program. In order to configure
the RVT you should have a working knowledge of the datalogger’s operation. RVT response to DTMF codes
can be easily modified or added. Also, new Alerts can be defined in conjunction with the datalogger
configuration.
10.3.1 RVT configuration file format
A typical RVT configuration file is shown below. The file is divided into four sections: Configuration; Phrases;
Responses; and Alerts.
[Configuration]
RadioStrobeEnable=off
RadioStrobeRepeatTime=500
RadioStrobeOnTime=100
RadioStrobeWarmUpTime=100
RadioRepeaterDelay=500
WordPacing=50
InterPhraseDelay=60
AlertSampleTime=30000
[Phrases:English]
SN=STATION NUMBER (Station)
AT=AIR TEMPERATURE (Temp) DEGREES
RH=HUMIDITY (Rh) %
WS=WIND SPEED (Wspd) MILES PER HOUR
WD=WIND DIRECTION (Dir) DEGREES
FM=FUEL MOISTURE (FSM) %
FT=FUEL TEMPERATURE (FST) DEGREES
PWS=PEAK WIND SPEED (PkWS) MILES PER HOUR
PWD=PEAK WIND DIRECTION (PkWD) DEGREES
RN=RAIN (RNIN) INCHES
SR=SOLAR RADIATION (PYRSR) WATTS PER SQUARE METER
MB=MAIN BATTERY (Telem) VOLTS
ALERT=ALERT ALERT
RHAL1=HUMIDITY (Rh) %
PKWSAL1=PEAK WIND SPEED (PkWs10m) MILES PER HOUR
WSAL1=WIND SPEED (Wspd) MILES PER HOUR
[Responses]
1234=AT RH WS WD FM FT PWS PWD SR RN MB
1235=AT RH WS WD
1236=WS WD
[Alerts]
al1=(RhAl > 0) ALERT SN RHAL1 RHAL1
al2=(PkWsAl > 0) ALERT SN PKWSAL1 PKWSAL1
al3=(WspdAl > 0) ALERT SN WSAL1 WSAL1
10.3.1.1 Configuration section
This portion of the RVT configuration files contains parameters specific to the internal operation of the RVT.
These parameters should not be altered.
page 238
Axiom H2 User Manual
RVT telemetry reference
10.3.1.2 Phrases section
This portion of the RVT configuration files contains phrases that the RVT uses to respond to DTMF
information requests. Normally phrases nots need to be added or modified. Refer to the RVT operating
manual for phrase details if a new phrase is required.
10.3.1.3 Responses section
This portion of the RVT configuration files defines the RVT response to the received DTMF sequence. For
instance, in the sample RVT configuration file, the RVT responds with the wind speed and wind direction
when a DTMF sequence of 1 2 3 6 is received. Response can be edited or added to the configuration file. The
format of the response follows that shown in the sample RVT configuration file.
10.3.1.4 Alerts section
This portion of the RVT configuration files defines when the RVT broadcasts an Alert. The alert flags must be
defined in the datalogger (i.e. RhAl, PkWsAl, and WspdAl) as it is the datalogger which determines if there is
an alert condition. Alerts are numbered sequentially (i.e. al1, al2, and al3) and the format of the alert follows
that shown in the sample RVT configuration file.
page 239
Chapter 11
Specifications
Error! Bookmark not defined.
Axiom H2 User Manual
Specifications
11.1 Datalogger
11.1.1 General
11.1.1.1 Protection
Inputs are lightning / static protected
Connectors are metal shell circular waterproof types
Built-in case temperature sensor
11.1.1.2 Physical
Size:
Weight:
25 cm wide, 20 cm high. 15 cm deep (10” x 8” x 6”)
3.3 kgs (7.3 lbs)
4.2 kgs (9.2 lbs) with optional internal G5 GOES Transmitter
11.1.1.3 Environmental
Operating Temperature Range
Storage Temperature Range
Enclosure
-40 ºC to 60 ºC (refer to the display specification for the display’s
operating temperature range)
-50 ºC to 70 ºC
watertight, even without connectors attached
11.1.1.4 Power management
9.6 Vdc to 20 Vdc operating voltage
Internal solar panel voltage and current measurement
Internal battery voltage, current, and temperature measurement
Internal, temperature compensated battery charge regulator
11.1.1.5 Power consumption
Current draw
State
without internal
GOES transmitter
with internal GOES
transmitter
page 241
Axiom H2 User Manual
Idle
Active
Display On
Transmit
Specifications
3 mA with )
10 mA
60 mA
n/a
8 mA
15 mA
65 mA
2.6 A max
11.1.1.6 Memory
RAM
non-volatile flash storage
memory allocations
64M
256M
14 MB circular memory file for data
20 kB circular audit log, transmit log
70 kB circular transmit log
11.1.1.7 Real time clock
Battery backed clock
Synchronized to optional GPS
Clock accuracy: ±1 second if connected to a G5 GOES transmitter.
Otherwise, maximum drift of 2 sec/day (room temperature).
11.1.2 User interface
11.1.2.1 Display / user interface
Display
Operating Temperature
Range
Functions
Built-in quarter VGA colour display, 7 cm wide x 5.5 cm high (2.8” x
2.125”) with touchscreen user interface.
-20 ºC to 60 ºC
System status; Stored data (tables and graphs); System configuration;
Troubleshooting/diagnostics.
11.1.2.2 USB device port
1 waterproof front panel connector
USB (full-speed, 12Mbps)
Automatic PC detection
11.1.2.3 USB host ports
2 waterproof front panel connectors
USB (full-speed, 12Mbps)
Supports 1.5Mbps and 12Mbps USB devices including memory sticks, mouse and keyboard.
11.1.3 Connectors
The connectors used on the datalogger are commercial versions of the MIL-C-26482 Series 1 family of
connectors and are compatible with their military equivalents.
page 242
Axiom H2 User Manual
Specifications
All pin-out diagrams on the following pages show the face of the chassis connector. This is the same as the
back of the mating cable connector.
There are several different manufacturers of connectors that mates with the datalogger connectors, but not all
manufacturers make all of the pin-out variations. The part numbers we specify below are for Souriau
connectors with solder cup connections. Crimp connections are also available, but do not order these unless
you have the proper assembly tools.
Be particularly aware of problems in the 8-3 family, there are some variations that look like they should mate,
but the pins are in slightly different positions.
There are several different styles of environmental sealing, depending on the type of wire used. The part
numbers we have specified are for sealing to jacketed cables. There are also types that are for loose wire
bundles and thus seal the individual wires, or are intended for potting. Not all manufacturers make all
variations in sealing, so check the catalog very carefully before ordering a different brand. The true military
equivalents usually do not seal to jacketed cable -- check with your supplier. Note that individual wire seals
require wires of a specific diameter to work.
Delivery can be slow from the suppliers -- there are so many possible variations of these military style
connectors that the suppliers often stock the raw parts and then assemble the ordered combination when they
get an order.
WARNING ! If you are soldering wires to the connector, make sure you clean the flux off
the connector after soldering. Any moisture present inside the connector will combine with
the flux and cause corrosion eventually resulting in a connection failure.
Part number example
Part number: 851-06JC10-6PN50
851
06
JC
10
6
P
N
50
Souriau series designation for this family of connectors
cable connecting plug (i.e., plugs into the datalogger connectors)
seals to jacketed cable, with cable clamp
shell size (connector diameter)
contact arrangement (6 pins in hexagon)
pins (as opposed to sockets)
normal - insert not rotated (this is left out of the part number)
Souriau series index
In general, all of the connectors is of the form 851-06JCxx-xxYN50 where xx-xx is the shell size and contact
arrangement, and Y is the pin (P) or socket (S) descriptor. This cable end connector is equivalent to
MS3116Fxx-xxYN except that the military has individual wire seals instead of sealing to jacketed cable. Check
with your supplier to see if a jacket seal is available.
page 243
Axiom H2 User Manual
Specifications
11.1.3.1 Battery
Mating Connector:
FTS Part Number:
851-06JC10-7S50
521-107S
PIN
Function
A
B
C
D
E
F
G
Signal ground
Battery negative sense
Battery negative (Chassis ground)
Battery positive sense
Battery positive
Temperature input
Optional battery back-up input
Signal input
9.6 VDC to 20 VDC operating voltage
Internal battery voltage, current (+ or -), and temperature measurement
page 244
Axiom H2 User Manual
Specifications
11.1.3.2 Solar panel
Mating Connector:
FTS Part Number:
PIN
Function
A
B
C
Power positive
Power negative
Chassis ground
851-06JC8-3AS50
520-83AS
Signal input
100 W (25 Vdc, 7A) maximum input
Internal solar panel voltage and current measurement
Internal, temperature compensated battery charge regulator
11.1.3.3 Rain
Mating Connector:
FTS Part Number:
PIN
Function
A
B
C
Chassis ground
Signal input
Signal ground
851-06JC8-3AP50
520-83AP
Signal input
Contact closure to ground or 0 to 3 V
10 k pull-up to 3 Vdc internally
0 to-400 Hz at 50% duty cycle
Minimum closure (low level) duration 1 ms
Compatible with any tipping bucket rain gauge with contact closure.
53 bit counter (floating point, double precision)
Configurable units and tip increment
Optional reset date for automatic resetting of rain accumulation
page 245
Axiom H2 User Manual
Specifications
11.1.3.4 SDI
Mating Connector:
FTS Part Number:
PIN
Function
A
B
C
SDI power out
SDI data
SDI ground
851-06JC8-3AP50
520-83AP
Signal input
Two independent SDI-12 version 1.3 ports
Supports M, C and R measurements with or without CRC error control.
CMOS Signal Levels
SDI over-voltage
Current limited to approximately 750 mA. Short duration transients of higher current can be supplied
without triggering the limit.
11.1.3.5 Telemetry
Mating Connector:
FTS Part Number:
851-06JC12-8S50
520-128S
PIN
Function
A
B
C
D
E
F
G
H
CTS (to datalogger)
Chassis ground
RXD (to datalogger)
TXD (from datalogger)
RTS (from datalogger)
Signal ground
Power from datalogger
Transmit enable
Signal input
Two ports factory configured as either:
o one internal GOES transmitter and one external connector, or
o two external connectors
Signal Levels: RS232C
Flow control may be enabled, depending on port configuration
Port settings are preserved through power failures
page 246
Axiom H2 User Manual
11.2
Specifications
Internal GOES transmitter (OPTIONAL)
11.2.1 Transmission data rates
100, 300 and 1200 BPS
Self-timed and Random transmissions
11.2.2 Output
Antenna: 11 dBi, right hand circular polarization
Connector: N-Type female
RF Power:
Data rate
Power
100 BPS
300 BPS
1200 BPS
5.6 W
5.6 W
11.2 W
11.2.3 Frequency range
401.701MHz – 402.09850 MHz
11.2.4 Frequency stability
Initial Accuracy: ±20 Hz disciplined to GPS
Short term drift: ±0.04 Hz/s
Ageing: ± 0.1 ppm/year
Vcc + Temperature: ± 0.1 ppm
11.2.5 Channel bandwidth
Data rate
100 BPS
300 BPS
1200 BPS
Bandwidth
1.5 kHz
1.5 kHz
3.0 kHz
11.2.6 Time keeping
Setting Accuracy: +/- 100 us synchronized to GPS
Drift: +/- 10 ms/day over operating temperature range.
Transmission continuation without GPS fix: 28 days
11.2.7 GPS
Antenna type: 3 V active
Connector: SMA female
Time synchronization / frequency correction schedule:
- 1 fix at power up, 1 fix per day thereafter
page 247