1
PDQuest User Guide
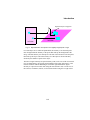
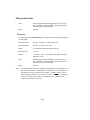
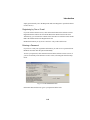
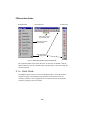
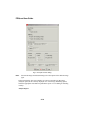
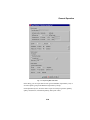
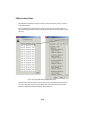
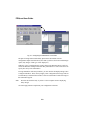
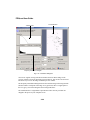
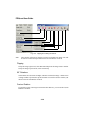
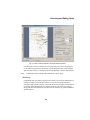
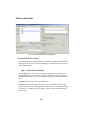
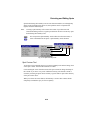
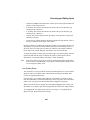
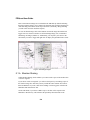
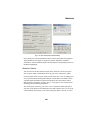
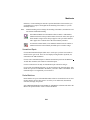
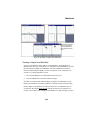
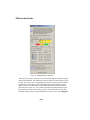
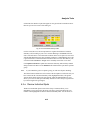
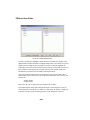
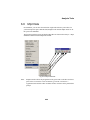
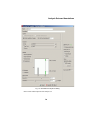
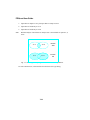
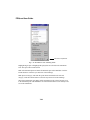
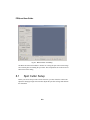
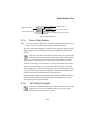
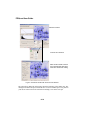
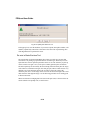
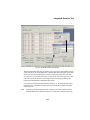
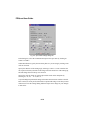
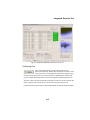
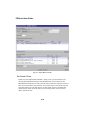
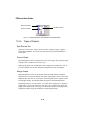
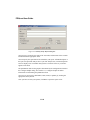
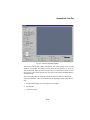
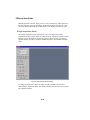
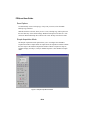
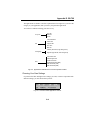
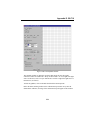
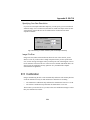
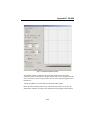
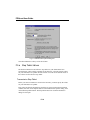
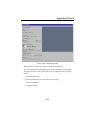
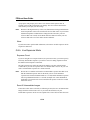
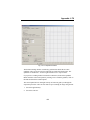
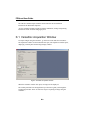
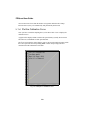
Preview Window
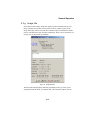
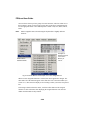
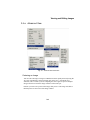
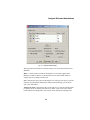
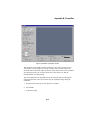
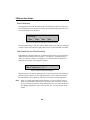
Transform Plot
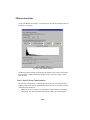
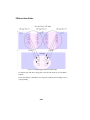
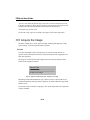
Frequency Distribution histogram
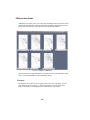
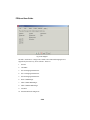
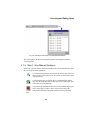
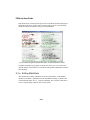
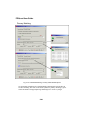
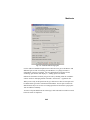
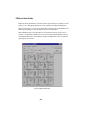
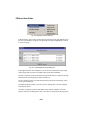
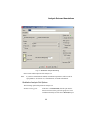
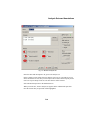
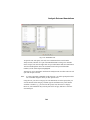
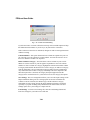
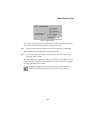
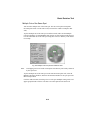
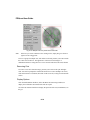
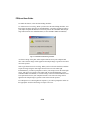
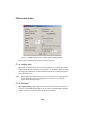
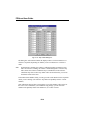
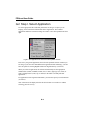
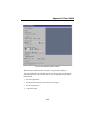
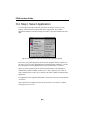
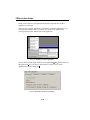
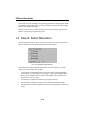
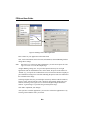
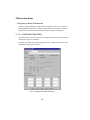
Fig. 3-15. Transform dialog box.
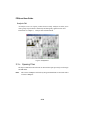
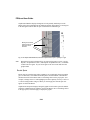
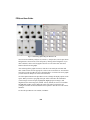
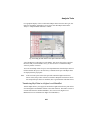
You can use regular viewing tools like Zoom Box and View Entire Image in the
preview window to focus on particular regions of interest. You can also use Grab tool
and arrow keys to move the image within the preview window.
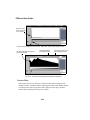
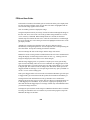
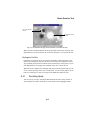
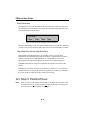
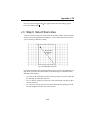
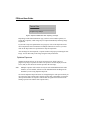
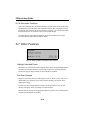
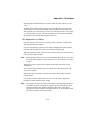
The Frequency Distribution histogram shows the total data range in the image and the
amount of data at each point in the range. In a typical scan, there is a signal spike at
the left (“gray”) end of the histogram due to background noise.
The Transform Plot is a logarithmic representation of how the raw pixel data are
mapped to the pixels of your computer screen.
3-22