1
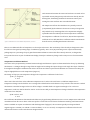
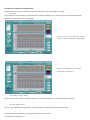
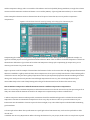
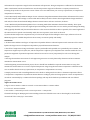
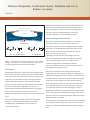
Tiltmeter Temperature Coefficients: Source, Definition and Use to
Improve Accuracy
Tech Note
expansion and contraction in response to daily and seasonal
temperature fluctuations generate real movements that are
EXCITATION ELECTRODES
detected by tiltmeters and other sensors. The magnitude of
this effect, and ways of differentiating it from purely
GAS BUBBLE
CONDUCTIVE FLUID
instrumental behavior, are discussed in this article.
Sources of Temperature Coefficients
GLASS CAPSULE
The sensors in Jewell Instruments tiltmeters are known as
PICK-UP
ELECTRODE
electrolytic tilt sensors, a type of electronic spirit level
comprised of a glass case and containing a conductive liquid
R1
R1 R2
R1 = R2 WHEN LEVEL
TILTED
R2
R1 ≠ R2 WHEN
(electrolyte), an air bubble and platinum electrodes. As the
sensor tilts, the wetted area of each excitation electrode
(Figure 1) increases or decreases,
depending on the tilt direction. This change causes the
electrical resistance between the central pick-up electrode
Figure 1. Electrolytic tilt sensor. Movement of the bubble
changes the output at the pick-up electrode when an AC
voltage is applied across the excitation electrodes.
Introduction
Environmental temperature changes alter the mechanical and
electrical characteristics of all instrumentation. Metals expand
and contract, and electrical properties such as resistance and
capacitance rise and fall. These effects change instrument
output and lessen the accuracy of the measured variable
(pressure, flow, tilt, strain, etc.). This technical note describes
the source of temperature dependency in one type of
instrumentation, Jewell Instruments tiltmeters, and explains
how to remove this effect to maximize accuracy. The
principles presented here also apply to many other instrument
types.
Just as instrumentation exhibits temperature-dependent
behavior, so too do natural and engineered structures,
including slopes, embankments, concrete and steel
construction. Thermal
and each excitation electrode to rise or fall. It is these
resistance changes that are sensed by the tiltmeter
electronics, which convert them to precise measurements of
the magnitude and direction of tilt.
Temperature fluctuations cause thermal expansion and
contraction of the sensor liquid, shrinking or swelling the air
bubble and changing the amount of liquid in contact with each
excitation electrode. This process alters the scale factor (gain)
of the sensor and can shift its zero point. Small changes in
sensor output in the absence of any real tilt movement are the
result. Experiments have shown that volumetric expansion
and contraction of the liquid is the single biggest source of
temperature coefficients in Jewell Instruments tiltmeters. This
effect is much greater than dimensional changes of the sensor’s
glass case, which has a thermal expansion coefficient 100 times
smaller than that of the liquid.
Thermoelasticity of the tiltmeter housing, and of the mechanical
connections between housing and sensor, is another source of
tiltmeter zero shift. To minimize this effect, rigid housings are
used
and connections between the sensor and enclosure are made as few
as possible. In many designs we pot the tilt sensor directly into the
housing base, eliminating mechanical connections entirely and
turning the sensor and base into one unified element.
The temperature effects described above are partially removed
(compensated) by the tiltmeter’s electronic circuitry. The apparent
tilt (residual error) remaining after such compensation is highly
repeatable and is described by two linear temperature coefficients,
the temperature coefficient of scale factor, KS, and the temperature
coefficient of zero shift, KZ. These coefficients include contributions
from all sources, including the tiltmeter electronics.
There is one additional effect of temperature on electrolytic tilt sensors. The conductivity of the electrolyte changes more than
five-fold over the typical operating range of a tiltmeter (typically -40 to +70°C). By measuring sensor output ratiometrically
(taking output as a percentage of input), Jewell Instruments tiltmeters remove this effect entirely. However, in designs that
incorporate the sensor as part of a Wheatstone bridge, electrolyte conductivity change can be a major source of measurement
error.
Temperature Coefficients Defined
Scale factor is the proportionality constant between tilt angle and tiltmeter output. It is determined in the factory by calibrating
the tiltmeter—rotating it through a range of known angles and recording the output voltage at each angle. The slope of the bestfit straight line through the calibration data is the scale factor Scal that is reported in the tiltmeter user’s manual. In reality, the
slope is slightly different at each temperature (Figure 2).
The change of slope per unit temperature change is the temperature coefficient of scale factor:
1) KS = (S - Scal)/Scal
T - Tcal
where Scal is the scale factor at the calibration temperature Tcal , and S is the scale factor at a different temperature T.
Temperature change can also shift the zero crossing of the calibration line in the absence of any real tilt of the structure to which
the tiltmeter is attached. In Figure 2 the zero offset voltage is VT which leads to an apparent tilt angle of θT = Scal VT at
temperature T. The zero shift is therefore Scal VT - θcal. The zero shift per unit temperature change is defined as the temperature
coefficient of zero shift, KZ :
2) KZ = Scal VT - θcal
T - Tcal
The coefficients KS and KZ are determined in the laboratory by performing calibrations at two or more temperatures and include
contributions from all sources. Their values are specific to each of the several classes of tiltmeters made by Jewell Instruments
and are available on request. For tiltmeters with the designation “high gain,” the ones most typically used in geotechnical
engineering, KS ≅ +0.0004/ °CC and KZ ≅ 1.5 microradians/ °C = 0.3 arc second/ °C. Temperature coefficient values should
decline in the future as sensor and electronic designs advance.
Procedure for Temperature Compensation
For tiltmeter measurements made at the calibration temperature Tcal , the tilt angle θ is simply
3) θ Scal V
where V is the measured voltage. For measurements at a different temperature, T, the scale factor is first adjusted using the
temperature coefficient KS before computing θ:
Figure 3. Ten days of ground tilts during a
pump test, without temperature compensation.
Figure 4. Same data as in Figure 3, with
temperature compensation.
4) S = Scal [ 1 + KS (T - Tcal) ]
The zero offset is then removed using the temperature coefficient KZ and the true tilt angle computed as follows:
5) θ = SV - KZ (T - Tcal )
where θ = true angular position (tilt) and T = the temperature at which your measurement was made
Tcal = the calibration temperature reported in the tiltmeter user's manual
S = scale factor at temperature T
Scal = the scale factor reported in the user's manual
V = the measured output voltage at temperature T
This temperature compensation procedure is automatically applied in Jewell Instruments digital tiltmeters and in our TBASE II
analysis software. It may also be incorporated into spreadsheets and other user-written programs.
Example
Figures 3 and 4 show 10 days of data (blue and yellow traces) for two identical high-gain tiltmeters with a resolution of 1 microradian (0.2 arc second). The plots were made using the program TBASE II. The upper graph in each figure plots daily
temperature oscillations at the ground surface in degrees Celsius, measured by temperature sensors inside each tiltmeter. The
lower graph shows tilt of the ground surface in microradians during the same period. The large change in tilt on the fourth day
resulted from ground subsidence caused by a nearby pump test.
The graph of tilt in Figure 3 contains daily oscillations that directly correlate with temperature. Tiltmeter temperature
coefficients
were input as part of
the
configuration options
in TBASE II to
compensate for the
temperature-
induced error. The
temperature-
corrected results are
shown in
Figure 4.
Thermoelasticity in Geotechnical Engineering
Thermoelasticity is the elastic expansion and contraction of materials in response to changing temperature. Soil, steel and
concrete structures each have their own temperature coefficient, the coefficient of thermal expansion α, which is expressed in
units of strain (microinches per inch or microns per meter) per unit change in temperature. Thermoelasticity is a major source of
structural movement, and precision tiltmeters easily measure this behavior. Thermoelastic deformation typically produces tilts
that exceed the temperature-induced output changes of properly designed tiltmeters. The following example illustrates how
large thermoelastic movements can be.
Tiltmeters are commonly installed on bridge piers and columns to detect early signs of settlement and riverbed scour. Figure 5a
shows a bridge with one span. Let us assume that the span is fixed at one end but can expand laterally at the other. Now if the slip
bearings are seized at the movable end, thermal expansion of the span by an amount ΔL will result in a tilt of the right pier
(Figure 5b) of θ = sin-1 (ΔL/H). If the temperature change is 10oC, α is 10-5/°C and span length L is 30 meters, then ΔL =
(10°C)(10-5/ °C)(30,000 mm) = 3 mm. For a pier that is 3 meters high, the tilt will be θ = 1000 microradians = 206 arc seconds.
Now compare this 1000 microradian movement with the uncorrected temperature-induced error of an Jewell Instruments
tiltmeter. Our “high-gain” tiltmeters, typically used in geotechnical and structural monitoring, have temperature coefficients of
KS ≅ 0.0004/ °C and KZ ≅ 1.5 microradians/ °C. A 10 °C temperature change therefore produces a zero shift of 15 microradians,
1.5% of the actual pier movement. The error induced by the coefficient KS is proportional to the rotation angle of the tiltmeter
and the temperature change, and is even smaller. If the tiltmeter was leveled (nulled) during installation, its angle after column
rotation would be 1000 microradians and the KS error would be (0.0004/ °C)(10 °C)(1000 microradians) = 4 microradians.
In this example the tiltmeter measures thermoelastic tilt of the pier to better than 2% accuracy with no temperature
compensation.
Figure 6: Thermoelastic dam tilt caused by heating and cooling of the downstream face.
Compensating the readings for temperature change yields even better results. Although this is an hypothetical example, it is
typical of real field projects involving Jewell Instruments tiltmeters. Most of the correlation of tilt with temperature results from
thermoelastic deformation. If your data still correlate with temperature change after compensating for temperature, you are
observing real structural or ground movement.
Figure 6 presents a real-life example of thermoelastic deformation of a thin-arch concrete dam. The high-gain Jewell Instruments
tiltmeter is installed in a gallery inside the dam, where temperatures do not cycle on a daily basis because of the insulating effect
of the thick concrete. The plot shows gallery temperatures and raw (uncompensated) upstream-downstream tilting of the dam
during a two-week period in early October 1993. Although temperatures do not vary, the real tilt angle fluctuates by 15
microradians daily as the result of daily heating and cooling of the downstream face of the dam a few meters away.
How to Minimize Temperature-Induced Measurement Errors without Temperature Compensation
There are several ways to minimize temperature-induced measurement errors that do not involve any data processing at all. In
many cases these methods eliminate the need for the temperature compensation procedures outlined above.
1. Reduce Temperature Extremes. When possible, instruments should be installed underground or in shaded locations where
temperature extremes are minimized. If temperatures do not vary, they can have no effect on your measurements. If your
instruments must be installed in locations exposed to direct sunlight, set up a hood that keeps them shaded while maintaining
good ventilation.
2. Choose Light Colors. When other specifications are equal, light-colored instruments stay cooler and are preferable to darkcolored ones.
3. Establish Your Accuracy Requirements. Before selecting the tiltmeters for your project, decide on the accuracy that is required
and estimate the temperature range that the instruments will experience. Then get temperature coefficients for the tiltmeters
under consideration from their manufacturers. Use the temperature range and coefficients to compute potential errors,
following the procedure in the previous section. If these errors are smaller than your accuracy requirements, no temperature
compensation is necessary.
4. Use a Mechanically Stable Tiltmeter Design. Choose a tiltmeter design that minimizes thermoelastic deformation of the instrument itself. Compact, stiff housings are more stable and less likely to bend or vibrate than elongated beam designs with fixed
ends. Also, the fewer the mechanical linkages between internal sensor and outer enclosure, the better.
5. Use a Mechanically Stable Mounting Method. Use a mounting method that maximizes thermoelastic stability. Three-point
mounting is best because it is the most rigid and prevents bending and torsion that can occur with 2-point mountings. Mounting
studs (typically threaded rods) that attach the tiltmeter to the structure should be as short as possible, of the same length and of
the same material. In special cases thermally stable, but more expensive, invar studs can be used.
If you decide that temperature compensation of your data is still required after taking the above steps, software such as the
TBASE II program is available that performs the necessary corrections quickly and reliably.
Conclusions
1. All instruments exhibit some degree of temperature-dependent behavior. Thermal expansion and contraction of the sensor
liquid is the largest source of temperature dependency in Jewell Instruments tiltmeters.
2. The effect of temperature change on tiltmeter output is predictable and repeatable. It is quantified by two constants, the
temperature coefficient of scale factor, KS , and the temperature coefficient of zero shift, KZ. These constants enable the user to
predict the magnitude of potential temperature-induced errors and to correct (compensate) for such errors during data
analysis.
3. The large thermoelastic movements of civil engineering structures are easily detected by tiltmeters and are sometimes
mistaken for measurement errors.
4. Before beginning an instrumentation project, the user should first establish the required measurement accuracy, then
estimate the measurement error over the expected temperature range using the instrument’s temperature coefficients. If the
error is smaller than the accuracy requirements, no temperature compensation is necessary.
5. Simple precautions such as installing tiltmeters in the shade or underground can reduce or eliminate temperature effects.
6. Temperature compensation of Jewell Instruments tiltmeter readings is performed using equations 4 and 5. Compensation is
carried out automatically by a commercial software package, and may also be built into spreadsheets and user-defined
programs.
Angle Conversion Factors
1 degree = 60 arc minutes = 3600 arc seconds = 17453 microradians = 0.01745 radians
1 arc second = 4.85 microradians
1 microradian = 1 microinch per inch = 1 micron per meter = 1 mm per km
If Canada had a hinge at Winnipeg and a man standing in Vancouver lifted the west coast to chest height, he would tilt the
western half of the country by 1 microradian.
Jewell Instruments LLC, 850 Perimeter Road, Manchester, NH 03103
[email protected] • www.jewellinstruments.com • Tel (800) 227-5955