1
HP 64746
MC68302 Emulator
Terminal Interface
User’s Guide
HP Part No. 64746-97007
Printed in U.S.A.
July 1996
Edition 4
Notice
Hewlett-Packard makes no warranty of any kind with regard to
this material, including, but not limited to, the implied warranties
of merchantability and fitness for a particular purpose.
Hewlett-Packard shall not be liable for errors contained herein or for
incidental or consequential damages in connection with the furnishing,
performance, or use of this material.
Hewlett-Packard assumes no responsibility for the use or reliability of
its software on equipment that is not furnished by Hewlett-Packard.
© Copyright Hewlett-Packard Company 1990, 1991, 1996
This document contains proprietary information, which is protected by
copyright. All rights are reserved. No part of this document may be
photocopied, reproduced or translated to another language without the
prior written consent of Hewlett-Packard Company. The information
contained in this document is subject to change without notice.
UNIX ® is a registered trademark in the United States and
other countries, licensed exclusively through X/Open Company
Limited.
Hewlett-Packard Company
P.O. Box 2197
1900 Garden of the Gods Road
Colorado Springs, CO 80901-2197, U.S.A.
RESTRICTED RIGHTS LEGEND Use, duplication, or disclosure
by the U.S. Government is subject to restrictions set forth in
subparagraph (C) (1) (ii) of the Rights in Technical Data and Computer
Software Clause at DFARS 252.227-7013. Hewlett-Packard Company,
3000 Hanover Street, Palo Alto, CA 94304 U.S.A. Rights for
non-DOD U.S. Government Departments and Agencies are as set forth
in FAR 52.227-19(c)(1,2).
Printing History
New editions are complete revisions of the manual. The date on the
title page changes only when a new edition is published.
A software code may be printed before the date; this indicates the
version level of the software product at the time the manual was issued.
Many product updates and fixes do not require manual changes, and
manual corrections may be done without accompanying product
changes. Therefore, do not expect a one-to-one correspondence
between product updates and manual revisions.
Edition 1
Edition 2
Edition 3
Edition 4
64746-97000, August 1990
64746-97005, December 1990
64746-97006, July 1991
64746-97007, July 1996
Certification and Warranty
Certification
Warranty
Hewlett-Packard Company certifies that this product met its published
specifications at the time of shipment from the factory.
Hewlett-Packard further certifies that its calibration measurements are
traceable to the United States National Bureau of Standards, to the
extent allowed by the Bureau’s calibration facility, and to the
calibration facilities of other International Standards Organization
members.
This Hewlett-Packard system product is warranted against defects in
materials and workmanship for a period of 90 days from date of
installation. During the warranty period, HP will, at its option, either
repair or replace products which prove to be defective.
Warranty service of this product will be performed at Buyer’s facility
at no charge within HP service travel areas. Outside HP service travel
areas, warranty service will be performed at Buyer’s facility only upon
HP’s prior agreement and Buyer shall pay HP’s round trip travel
expenses. In all other cases, products must be returned to a service
facility designated by HP.
For products returned to HP for warranty service, Buyer shall prepay
shipping charges to HP and HP shall pay shipping charges to return the
product to Buyer. However, Buyer shall pay all shipping charges,
duties, and taxes for products returned to HP from another country. HP
warrants that its software and firmware designated by HP for use with
an instrument will execute its programming instructions when properly
installed on that instrument. HP does not warrant that the operation of
the instrument, or software, or firmware will be uninterrupted or error
free.
Limitation of Warranty
The foregoing warranty shall not apply to defects resulting from
improper or inadequate maintenance by Buyer, Buyer-supplied
software or interfacing, unauthorized modification or misuse, operation
outside of the environment specifications for the product, or improper
site preparation or maintenance.
No other warranty is expressed or implied. HP specifically disclaims
the implied warranties of merchantability and fitness for a particular
purpose.
Exclusive Remedies
The remedies provided herein are buyer’s sole and exclusive remedies.
HP shall not be liable for any direct, indirect, special, incidental, or
consequential damages, whether based on contract, tort, or any other
legal theory.
Product maintenance agreements and other customer assistance
agreements are available for Hewlett-Packard products.
For any assistance, contact your nearest Hewlett-Packard Sales and
Service Office.
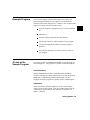
Using this Manual
This manual has two main purposes:
It describes the HP 64746 MC68302 emulator.
It gives an introduction to using the emulator’s Terminal
Interface.
This manual also describes specific MC68302 emulator commands
which do not appear in the Terminal Interface Reference.
This manual does not tell you how to use all of the emulator and
analyzer commands. Refer to the Terminal Interface Reference.
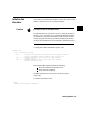
Conventions Used
Examples in this manual use the following format and conventions:
M>cf clk=ext <RETURN>
M>
This represents one of the prompts shown on
screen.
cf clk=ext
This represents an entry that you make.
<RETURN>
This instructs you to press <RETURN>.
bold
Bold type highlights commands and options.
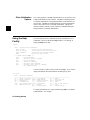
<RETURN> versus
<ENTER>
This manual instructs you to press the <RETURN> key to execute
commands. Depending on whether you are using a terminal or
personal computer (PC), you will use either the <RETURN> or
<ENTER> key to execute the commands. The <RETURN> key on a
terminal and the <ENTER> key on a PC both perform a carriage
return, which is necessary to execute most of the HP 64700-Series
commands.
Contents
1
Introducing the MC68302 Emulator
Introduction . . . . . . . . . . . . . . . . . . . . . .
Function of the MC68302 Emulator . . . . . . . . .
Versions of the HP 64746 . . . . . . . . . . . . . .
Features of the MC68302 Emulator . . . . . . . . .
Supported Microprocessors . . . . . . . . . . . .
Clock Speeds . . . . . . . . . . . . . . . . . . .
Emulation Memory . . . . . . . . . . . . . . . .
Analysis . . . . . . . . . . . . . . . . . . . . . .
Registers . . . . . . . . . . . . . . . . . . . . . .
Single-Step . . . . . . . . . . . . . . . . . . . .
Breakpoints . . . . . . . . . . . . . . . . . . . .
Reset Support . . . . . . . . . . . . . . . . . . .
Real-Time Operation . . . . . . . . . . . . . . .
Limitations . . . . . . . . . . . . . . . . . . . . . .
How the Components Communicate . . . . . . . . .
Knowledge of the MC68302 . . . . . . . . . . .
Tips for Operating the Emulator . . . . . . . . . . .
Don’t Write to Low Memory . . . . . . . . . . .
Commands Which Stop the Processor . . . . . .
MC68302 Vector Table . . . . . . . . . . . . . .
Memory Access Mode . . . . . . . . . . . . . .
Pin Protector . . . . . . . . . . . . . . . . . . . .
Chip Selects . . . . . . . . . . . . . . . . . . . .
DTACK Interlock . . . . . . . . . . . . . . . . .
SCR Register . . . . . . . . . . . . . . . . . . .
Connecting the emulator to the target system . . . .
Connecting the probe to a PGA socket . . . . . .
Connecting using a QFP Probe Adapter Assembly
Connecting using the HP Wedge Probing System
Other Sources of Information . . . . . . . . . . . . .
.
.
.
.
.
.
.
.
.
.
.
.
.
.
.
.
.
.
.
.
.
.
.
.
.
.
.
.
.
.
.
.
.
.
.
.
.
.
.
.
.
.
.
.
.
.
.
.
.
.
.
.
.
.
.
.
.
.
.
.
.
.
.
.
.
.
.
.
.
.
.
.
.
.
.
.
.
.
.
.
.
.
.
.
.
.
.
.
.
.
.
.
.
.
.
.
.
.
.
.
.
.
.
.
.
.
.
.
.
.
.
.
.
.
.
.
.
.
.
.
.
.
.
.
.
.
.
.
.
.
.
.
.
.
.
.
.
.
.
.
.
.
.
.
.
.
.
.
.
.
.
.
.
.
.
.
.
.
.
.
.
.
.
.
.
.
.
.
.
.
.
.
.
.
.
.
.
.
.
.
.
.
.
.
.
.
.
.
.
.
.
.
.
.
.
.
.
.
.
.
.
.
.
.
.
.
.
.
.
.
. 1-1
. 1-1
. 1-2
. 1-3
. 1-3
. 1-3
. 1-3
. 1-3
. 1-3
. 1-3
. 1-4
. 1-4
. 1-4
. 1-4
. 1-5
. 1-5
. 1-6
. 1-6
. 1-6
. 1-6
. 1-7
. 1-7
. 1-7
. 1-8
. 1-8
. 1-8
. 1-8
1-10
1-13
1-16
Contents-1
2
Getting Started
Before Using the HP 64746 . . . . . . . . . . .
Things to Know Before You Begin . . . . . .
Apply Power . . . . . . . . . . . . . . . . . . .
About the Prompts . . . . . . . . . . . . . . . .
If No Prompt is Displayed . . . . . . . . . . .
Description of the Prompts . . . . . . . . . .
Initialize the Emulator . . . . . . . . . . . . . .
Other Initialization Options . . . . . . . . . .
Using the Help Facility . . . . . . . . . . . . . .
Configure the Emulator . . . . . . . . . . . . . .
Software . . . . . . . . . . . . . . . . . . . . . .
Supported Absolute Files . . . . . . . . . . .
Assembler/Linker . . . . . . . . . . . . . . .
C Compiler . . . . . . . . . . . . . . . . . .
Branch Validator . . . . . . . . . . . . . . .
About the Other Interfaces . . . . . . . . . .
Example Program . . . . . . . . . . . . . . . . .
A Look at the Sample Program . . . . . . . . . .
Initialize the Emulator to a Known State . . . . .
Set Up the Proper Emulation Configuration . . .
Set Up Emulation Conditions . . . . . . . . .
Map Memory . . . . . . . . . . . . . . . . .
Set Up the Stack Pointer . . . . . . . . . . . .
Transfer Code into Memory . . . . . . . . . . .
From a Terminal in Standalone Configuration
From a Host in Transparent Configuration . .
Looking at Your Code . . . . . . . . . . . . . .
Familiarize Yourself with the System Prompts .
Running the Sample Program . . . . . . . . . .
Tracing Program Execution . . . . . . . . . . .
For More Information . . . . . . . . . . . . . .
3
.
.
.
.
.
.
.
.
.
.
.
.
.
.
.
.
.
.
.
.
.
.
.
.
.
.
.
.
.
.
.
.
.
.
.
.
.
.
.
.
.
.
.
.
.
.
.
.
.
.
.
.
.
.
.
.
.
.
.
.
.
.
.
.
.
.
.
.
.
.
.
.
.
.
.
.
.
.
.
.
.
.
.
.
.
.
.
.
.
.
.
.
.
.
.
.
.
.
.
.
.
.
.
.
.
.
.
.
.
.
.
.
.
.
.
.
.
.
.
.
.
.
.
.
.
.
.
.
.
.
.
.
.
.
.
.
.
.
.
.
.
.
.
.
.
.
.
.
.
.
.
.
.
.
.
.
.
.
.
.
.
.
.
.
.
.
.
.
.
.
.
.
.
.
.
.
.
.
.
.
.
.
.
.
.
.
.
.
.
.
.
.
.
.
.
.
.
.
.
.
.
.
.
.
.
.
.
.
.
.
.
.
.
.
.
.
.
.
.
.
.
.
.
.
.
.
.
.
.
.
.
.
.
.
.
.
.
.
.
.
.
.
.
.
.
.
.
.
. 2-1
. 2-1
. 2-2
. 2-2
. 2-3
. 2-3
. 2-5
. 2-6
. 2-6
. 2-7
. 2-8
. 2-8
. 2-8
. 2-8
. 2-8
. 2-8
. 2-9
. 2-9
2-13
2-13
2-13
2-16
2-16
2-17
2-17
2-19
2-22
2-23
2-25
2-26
2-30
.
.
.
.
.
.
.
.
.
.
.
.
.
.
.
.
.
.
.
.
.
.
.
.
.
.
.
.
.
.
.
.
.
.
.
.
.
.
.
.
.
.
.
.
.
.
.
.
.
.
.
.
.
.
.
.
.
.
.
.
.
.
.
.
.
.
.
.
.
.
Advanced Example
The Sample Programs . . . .
Supervisor Program . . . .
User Program . . . . . . .
Mapping Memory . . . . . . .
Loading the Sample Program .
Assembly and Linking . .
Loading the Code . . . . .
2-Contents
.
.
.
.
.
.
.
.
.
.
.
.
.
.
.
.
.
.
.
.
.
.
.
.
.
.
.
.
.
.
.
.
.
.
.
.
.
.
.
.
.
.
.
.
.
.
.
.
.
.
.
.
.
.
.
.
.
.
.
.
.
.
.
.
.
.
.
.
.
.
.
.
.
.
.
.
.
.
.
.
.
.
.
.
.
.
.
.
.
.
.
.
.
.
.
.
.
.
.
.
.
3-1
3-2
3-4
3-7
3-9
3-9
3-9
Building a Command File . . . . . . . . . . . . . . . .
Set Mode and Stack Pointer . . . . . . . . . . . . . . .
Complex Configuration Trace Example . . . . . . . . .
Defining Equates . . . . . . . . . . . . . . . . . . .
Set the Analyzer to Complex Configuration . . . . .
Define a New Analyzer Signal Label . . . . . . . . .
Assign Analyzer Patterns to Expressions . . . . . . .
Set the Primary Branch Qualifiers . . . . . . . . . .
Specifying What to Store . . . . . . . . . . . . . . .
Counting the Output Writes . . . . . . . . . . . . . .
Set the Trace Display Format . . . . . . . . . . . . .
Make the Measurement . . . . . . . . . . . . . . . .
Setting up an Automatic Break to Monitor . . . . . . . .
Break on Measurement Complete . . . . . . . . . . .
Setting a Software Breakpoint . . . . . . . . . . . . .
Write to ROM . . . . . . . . . . . . . . . . . . . . .
Prefetching and Effect on Break Conditions . . . . .
Step, Register Display, and Memory Display Example .
Defining Macros . . . . . . . . . . . . . . . . . . . .
Using Echo to Send Escape Sequences to a Terminal
Using the Step Command . . . . . . . . . . . . . . .
Displaying Memory . . . . . . . . . . . . . . . . . .
Displaying Registers . . . . . . . . . . . . . . . . .
Searching Memory for Strings or Numeric Expressions .
What Next? . . . . . . . . . . . . . . . . . . . . . . . .
4
.
.
.
.
.
.
.
.
.
.
.
.
.
.
.
.
.
.
.
.
.
.
.
.
.
.
.
.
.
.
.
.
.
.
.
.
.
.
.
.
.
.
.
.
.
.
.
.
.
.
.
.
.
.
.
.
.
.
.
.
.
.
.
.
.
.
.
.
.
.
.
.
.
.
.
.
.
.
.
.
.
.
.
.
.
.
.
.
.
.
.
.
.
.
.
.
.
.
.
.
.
.
.
.
.
.
.
.
.
.
.
.
.
.
.
.
.
.
.
.
.
.
.
.
.
3-11
3-14
3-14
3-17
3-18
3-18
3-18
3-19
3-19
3-20
3-20
3-21
3-28
3-28
3-29
3-30
3-30
3-30
3-31
3-31
3-32
3-32
3-32
3-34
3-35
Configuring the Emulator
Emulation Commands . . . . . . . . . . . .
Configuration Commands . . . . . . . . .
Commands Used to Make a Measurement
Coordinated Measurement Commands . .
Analyzer Commands . . . . . . . . . . .
System Commands . . . . . . . . . . . .
Displaying MC68302 Configuration Items .
Using the Built-in Help Facility . . . . . . .
Bus Arbitration (cf ba) . . . . . . . . . .
Background Block
(cf bbk) . . . . . . . . . . . . . . . . . .
Bus Error (cf be) . . . . . . . . . . . . . .
Background Function Codes (cf bfc) . . .
Clock Selection (cf clk) . . . . . . . . . .
.
.
.
.
.
.
.
.
.
.
.
.
.
.
.
.
.
.
.
.
.
.
.
.
.
.
.
.
.
.
.
.
.
.
.
.
.
.
.
.
.
.
.
.
.
.
.
.
.
.
.
.
.
.
.
.
.
.
.
.
.
.
.
.
.
.
.
.
.
.
.
.
.
.
.
.
.
.
.
.
.
.
.
.
.
.
.
.
.
.
.
.
.
.
.
.
.
.
.
.
.
.
.
.
.
.
.
.
4-1
4-1
4-1
4-3
4-3
4-3
4-3
4-4
4-5
.
.
.
.
.
.
.
.
.
.
.
.
.
.
.
.
.
.
.
.
.
.
.
.
.
.
.
.
.
.
.
.
.
.
.
.
.
.
.
.
.
.
.
.
.
.
.
.
4-6
4-6
4-7
4-8
Contents-3
Chip Selects (cf cs[0-3]_dtk) . . . . . . .
Drive Background Cycles (cf dbc) . . . .
/DTACK Interlock (cf dti) . . . . . . . . .
PB0/IACK7 Configuration (cf iack7) . . .
Interrupt Mode (cf im) . . . . . . . . . . .
IRQ7 Mode (cf int7) . . . . . . . . . . . .
Load Function Codes (cf lfc) . . . . . . .
Monitor Selection (cf mon) . . . . . . . .
Bus Width (cf pdw) . . . . . . . . . . . .
Restrict to Real-Time (cf rrt) . . . . . . .
Supervisor Stack Pointer on Reset (cf rssp)
Software Breakpoint Trap (cf swtp) . . . .
Target System Interrupts (cf ti) . . . . . .
DMA Tracing (cf trc_dma) . . . . . . . .
Where to Find More Information . . . . . . .
Configuring Other Features . . . . . . . . . .
5
.
.
.
.
.
.
.
.
.
.
.
.
.
.
.
.
.
.
.
.
.
.
.
.
.
.
.
.
.
.
.
.
.
.
.
.
.
.
.
.
.
.
.
.
.
.
.
.
.
.
.
.
.
.
.
.
.
.
.
.
.
.
.
.
.
.
.
.
.
.
.
.
.
.
.
.
.
.
.
.
.
.
.
.
.
.
.
.
.
.
.
.
.
.
.
.
.
.
.
.
.
.
.
.
.
.
.
.
.
.
.
.
.
.
.
.
.
.
.
.
.
.
.
.
.
.
.
.
.
.
.
.
.
.
.
.
.
.
.
.
.
.
.
.
.
.
.
.
.
.
.
.
.
.
.
.
.
.
.
.
. 4-9
. 4-9
4-10
4-11
4-11
4-12
4-12
4-13
4-15
4-15
4-16
4-17
4-18
4-19
4-19
4-20
.
.
.
.
.
.
.
.
.
.
.
.
.
.
.
.
.
.
.
.
.
.
.
.
.
.
.
.
.
.
.
.
.
.
.
.
.
.
.
.
.
.
.
.
.
.
.
.
.
.
.
.
.
.
.
.
.
.
.
.
.
.
.
.
.
.
.
.
.
.
.
.
.
.
.
.
.
.
.
.
.
.
.
.
.
.
.
.
.
.
.
.
.
.
.
.
.
.
.
.
.
.
.
.
.
.
.
.
.
.
.
.
.
.
.
.
.
.
.
.
.
.
.
.
.
.
.
.
.
.
.
.
.
.
.
.
.
.
.
.
.
.
.
.
.
.
.
.
.
.
.
.
.
.
.
.
.
.
.
.
.
.
.
.
.
.
.
.
.
.
.
.
.
.
.
.
.
.
.
.
.
.
.
.
.
.
.
.
.
.
.
.
.
.
.
.
.
.
.
.
.
.
.
.
.
.
.
.
.
.
.
.
.
.
.
.
.
.
.
.
.
.
.
.
.
.
.
.
.
.
.
.
.
.
.
.
.
.
.
.
.
.
.
.
.
.
.
.
.
.
.
.
.
. 5-1
. 5-2
. 5-2
. 5-3
. 5-4
. 5-4
. 5-5
. 5-5
. 5-7
. 5-8
. 5-8
. 5-8
. 5-8
. 5-8
. 5-9
. 5-9
. 5-9
5-10
5-10
5-12
5-15
5-16
5-17
Concepts
Topics Covered . . . . . . . . . . . . . .
MC68302 Vector Table . . . . . . . . . .
Access and Display Modes . . . . . . . .
Target System Memory Access . . . . .
Break Conditions . . . . . . . . . . . . .
Software Breakpoints . . . . . . . . .
Break on Trigger Signals . . . . . . .
Macros . . . . . . . . . . . . . . . . . .
Coordinated Measurement Bus Operation
Software Products . . . . . . . . . . . .
Assembler/Linker . . . . . . . . . . .
C Cross Compiler . . . . . . . . . . .
HP Branch Validator . . . . . . . . .
User Interfaces . . . . . . . . . . . . .
Protecting the Emulator Probe . . . . . .
Pin Protector . . . . . . . . . . . . . .
Conductive Pin Guard . . . . . . . . .
Using the Analyzer . . . . . . . . . . . .
Analyzer Clock Speed . . . . . . . . .
Equates . . . . . . . . . . . . . . . . . .
Symbols . . . . . . . . . . . . . . . . . .
Emulator Firmware . . . . . . . . . . . .
Monitor Description . . . . . . . . . . .
4-Contents
.
.
.
.
.
.
.
.
.
.
.
.
.
.
.
.
.
.
.
.
.
.
.
.
.
.
.
.
.
.
.
.
.
.
.
.
.
.
.
.
.
.
.
.
.
.
.
.
.
.
.
.
.
.
.
.
.
.
.
.
.
.
Comparison of Foreground and Background Monitors . . . . . 5-17
Using a Foreground Monitor . . . . . . . . . . . . . . . . . . 5-19
Sample Foreground Monitor Listing . . . . . . . . . . . . . . 5-20
A
Syntax for the MC68302 Emulator
Notes . . . . . . . . .
ADDRESS . . . . . .
Notes . . . . . . . . .
CONFIG_ITEMS . . .
MODE . . . . . . . .
REGISTERS . . . . .
ANALYZER INPUTS
Notes . . . . . . . . .
.
.
.
.
.
.
.
.
.
.
.
.
.
.
.
.
.
.
.
.
.
.
.
.
.
.
.
.
.
.
.
.
.
.
.
.
.
.
.
.
.
.
.
.
.
.
.
.
.
.
.
.
.
.
.
.
.
.
.
.
.
.
.
.
.
.
.
.
.
.
.
.
.
.
.
.
.
.
.
.
.
.
.
.
.
.
.
.
.
.
.
.
.
.
.
.
.
.
.
.
.
.
.
.
B
Messages
C
MC68302 Specifications and Characteristics
General Specifications . . . . . . . .
Processor Compatibility . . . . . .
Electrical . . . . . . . . . . . . . .
Physical . . . . . . . . . . . . . .
Environmental . . . . . . . . . . .
Regulatory Compliance . . . . . .
BNC (labeled TRIGGER IN/OUT)
Communications . . . . . . . . . .
Emulator Probe Characteristics . . . .
Unbuffered Signals . . . . . . . .
Data Inputs . . . . . . . . . . . . .
Address and Function Codes . . .
Clocks . . . . . . . . . . . . . . .
Chip Selects . . . . . . . . . . . .
Interrupts . . . . . . . . . . . . . .
Other Signals . . . . . . . . . . .
.
.
.
.
.
.
.
.
.
.
.
.
.
.
.
.
.
.
.
.
.
.
.
.
.
.
.
.
.
.
.
.
.
.
.
.
.
.
.
.
.
.
.
.
.
.
.
.
.
.
.
.
.
.
.
.
.
.
.
.
.
.
.
.
.
.
.
.
.
.
.
.
.
.
.
.
.
.
.
.
.
.
.
.
.
.
.
.
.
.
.
.
.
.
.
.
.
.
.
.
.
.
.
.
.
.
.
.
.
.
.
.
.
.
.
.
.
.
.
.
.
.
.
.
.
.
.
.
.
.
.
.
.
.
.
.
.
.
.
.
.
.
.
.
.
.
.
.
.
.
.
.
.
.
.
.
.
.
.
.
. A-2
. A-3
. A-6
. A-7
. A-9
A-11
A-13
A-16
.
.
.
.
.
.
.
.
.
.
.
.
.
.
.
.
.
.
.
.
.
.
.
.
.
.
.
.
.
.
.
.
.
.
.
.
.
.
.
.
.
.
.
.
.
.
.
.
.
.
.
.
.
.
.
.
.
.
.
.
.
.
.
.
.
.
.
.
.
.
.
.
.
.
.
.
.
.
.
.
.
.
.
.
.
.
.
.
.
.
.
.
.
.
.
.
.
.
.
.
.
.
.
.
.
.
.
.
.
.
.
.
.
.
.
.
.
.
.
.
.
.
.
.
.
.
.
.
.
.
.
.
.
.
.
.
.
.
.
.
.
.
.
.
.
.
.
.
.
.
.
.
.
.
.
.
.
.
.
.
. C-1
. C-1
. C-1
. C-2
. C-2
. C-3
. C-3
. C-3
. C-4
. C-4
. C-4
. C-4
. C-4
. C-4
. C-4
. C-4
Contents-5
Illustrations
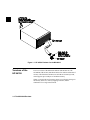
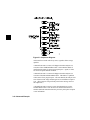
Figure 1-1. HP 64746 Emulator for the MC68302 . . . . . . . .
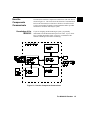
Figure 1-2. How the Components Communicate . . . . . . . .
Figure 1-3. Connecting the Probe to a PGA socket. . . . . . . .
Figure 1-4. Connecting Using a QFP Probe Adapter Assembly.
Figure 1-5. Connecting Using the HP Wedge Probing System .
Figure 2-1. Listing of newprog.s. . . . . . . . . . . . . . . . . .
Figure 2-2. Listing of newprog.s (continued). . . . . . . . . . .
Figure3-1. Supervisor program listing. . . . . . . . . . . . . . .
Figure3-2. User program listing. . . . . . . . . . . . . . . . . .
Figure 3-3. Sequencer diagram. . . . . . . . . . . . . . . . . .
.
.
.
.
.
.
.
.
.
.
. 1-2
. 1-5
. 1-9
. 1-9
. 1-9
2-10
2-11
. 3-2
. 3-4
3-16
Tables
Table 1-1. Other Sources of Information . . . . . . . . . . . . . . 1-11
Table 4-1. Command Groups . . . . . . . . . . . . . . . . . . . . . 4-2
6-Contents
1
Introducing the MC68302 Emulator
Introduction
The topics in this chapter include:
Function of the MC68302 Emulator
Features of the MC68302 Emulator
How the Components Communicate
Tips for Operating the Emulator
Connecting the emulator to the target system
– Connecting the probe to a PGA socket
– Connecting using a 132-pin QFP Probe Adapter Assembly
– Connecting using the 144-pin HP Wedge Probing System
Other Sources of Information
Function of the
MC68302 Emulator
The MC68302 emulator is designed to replace the MC68302
microprocessor in your target system so you can control operation of
the microprocessor in your application hardware (usually referred to as
the target system). The emulator performs just like the MC68302
microprocessor, but is a device that allows you to control the MC68302
directly. The MC68302 emulator features allow you to easily debug
software before any hardware is available, and ease the process of
integrating hardware and software.
The MC68302 Emulator 1-1
Figure 1-1. HP 64746 Emulator for the MC68302
Versions of the
HP 64746
Previous versions of the MC68302 emulator (HP 64746A/AL, HP
64746B/BL, HP 64746G, and HP 64746H) came with fixed amounts of
memory. The HP 64746J emulator uses the HP 64170 memory board,
which supports up to 2 Mbytes of emulation memory.
When you use the HP 64170 memory board, you will notice changes in
the memory block size, memory mapping resolution, and the
elimination of coverage measurements.
1-2 The MC68302 Emulator
Features of the
MC68302 Emulator
Supported
Microprocessors
Clock Speeds
Emulation Memory
The HP 64746 emulator contains a Motorola 68302 microprocessor
revision B or greater.
The internal clock speed of the HP 64746 emulator is at least
16.67 MHz. Your emulator may use a faster clock speed.
The HP 64170 memory board provides 256 Kbytes, 512 Kbytes, 1
Mbyte, or 2 Mbytes of emulation memory. The emulator operates with
no wait states to emulation or target memory.
Up to seven ranges of memory may be configured as emulation RAM,
emulation ROM, target system RAM, target system ROM, or guarded
memory.
Analysis
The analyzer (HP 64704A) supplied with the MC68302 emulator
monitors the emulation processor using an emulation analysis bus.
This analyzer performs only state analysis, and is referred to as the
emulation analyzer.
The optional external analyzer (HP 64703A) allows you to probe 16
individual lines in your target system. Thus you will have a total of 64
analysis channels (or 48 channels if you have upgraded from a HP
64742 M68000 emulator). The external analyzer lets you, for example,
to watch the chip select lines, and to distinguish internal from external
direct memory accesses. You can configure the external analyzer to
perform state or timing analysis measurements. Refer to the Analyzer
Terminal Interface User’s Guide for a complete list of analyzer features.
Registers
You can display or modify the MC68302 internal register contents.
This includes the ability to modify the program counter (PC) value so
you can control where the emulator starts a program run.
Single-Step
You can direct the emulation processor to execute a single instruction
or a specified number of instructions.
The MC68302 Emulator 1-3
Breakpoints
You can set the emulator/analyzer interaction so the emulator will
break to the monitor program when the analyzer finds a specific state or
states, allowing you to perform post-mortem analysis of the program
execution.
You can also set software breakpoints in your program. With the
MC68302 emulator, setting a software breakpoint inserts a TRAP
instruction into your program at the desired location.
Reset Support
Real-Time Operation
The emulator can be reset from the emulation system under your
control, or your target system can reset the emulation processor.
Real-time signifies continuous execution of your program at full rated
processor speed without interference from the emulator. (Such
interference occurs when the emulator needs to break to the monitor to
perform an action you requested, such as displaying target system
memory.) Emulator features performed in real-time include running
and analyzer tracing.
Emulator features not performed in real-time include displaying or
modifying target system memory, loading or dumping any memory,
and displaying or modifying registers.
Limitations
The emulator does not support the CPU disable mode.
Direct memory access (DMA) to emulation memory is not
permitted.
Memory coverage measurements are not supported by the HP
64746J emulator.
1-4 The MC68302 Emulator
How the
Components
Communicate
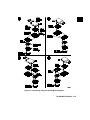
The MC68302 emulation components communicate with each other as
shown in figure 1-2. The arrows show the direction of communication.
Refer to the HP 64700-Series Emulators Hardware Installation And
Configuration manual for details on components that make up an HP
64700-Series emulation and analysis system.
Knowledge of the
MC68302
If you are designing an MC68302 target system, you probably
understand how the MC68302 microprocessor works. If you do not
have a working knowledge of this processor, you should become
familiar with this processor before continuing.
Figure 1-2. How the Components Communicate
The MC68302 Emulator 1-5
Tips for Operating
the Emulator
Note
Don’t Write to Low
Memory
To operate the MC68302 emulator efficiently, read this section!
Remember that addresses $0 through $FF in the supervisor space are
reserved for the MC68302 vector table.
In particular, address $0F2 is the BAR (base address) register and $0F4
is the SCR (system control) register. If you map these addresses as part
of a data area, they may get overwritten, causing unpredictable
processor behavior.
Be especially careful not to place the stack where it could grow into
this area. For example, never place the stack at 100 hex.
Commands Which
Stop the Processor
MC68302 Vector
Table
If your target system circuitry is dependent on constant execution of
program code, you should set cf rrt=en. This will help insure that
target system damage doesn’t occur. You may also use cf dbc=en to
drive the address, data, and control strobes while the background
monitor is executing. However, remember that you can still execute the
rst, b and s commands. You should use caution in executing these
commands.
All MC68302 emulation systems require a vector table to process
system conditions, such as divide by zero or trace traps. You need to
provide such a vector table to manage these conditions. Exception
processing attempted without a vector table will cause unpredictable
results. Most of the examples shown in this manual were created
without a vector table to simplify the examples.
Remember not to map internal memory space to 0, thus overwriting the
vector table. The internal space must be mapped as target RAM (tram).
The BAR and SCR may be mapped as emulation RAM (eram), but you
1-6 The MC68302 Emulator
should use the reg (not m) command to modify or examine these
locations.
Refer to the Motorola documentation for the MC68302 microprocessor
for additional information about vector tables and exception processing.
Memory Access Mode
Pin Protector
Chip Selects
When in 8-bit mode, byte access is always used. In 16-bit mode, either
byte or word access can be used. Use byte access mode (the default)
unless a larger size is needed. See chapter 5, "Concepts," for a
discussion of target system memory access.
Do not use the probe without a pin protector installed. See chapter 5,
"Concepts," for more information on protecting the emulator probe.
The MC68302 chip selects can be configured either to generate the
DTACK signal interally or to use an externally supplied DTACK. The
emulator looks at two things to decide which source of the DTACK it
should look for when a given chip select is active:
The chip select lines (programmed using registers BR0-BR3).
The source of DTACK for the chip select lines is determined
by the corresponding DTACK field bits (programmed using
OR0-OR3). The order in which you write these registers is
significant.
The emulator configuration (set using cf cs0_dtk through cf
cs3_dtk). The effects of the emulator configuration are
described in chapter 4.
Note
Be sure that the emulator configuration and the configuration of the
chip select lines are consistent. Remember that the order in which you
write the chip select registers BR0-BR3 and OR0-OR3 is significant.
Registers OR0-OR3 contain, among other things, a base address mask
field. The base address mask is used to set the block size of the
corresponding chip select line. The emulator assumes that this register
will be programmed to map one contiguous block for the chip select
The MC68302 Emulator 1-7
line. The MC68302 processor does not enforce this rule, so you should
be careful not to map several ranges for a specific chip select.
DTACK Interlock
Use the cf dti configuration item to select whether the emulator will
look for or generate the DTACK signal. See chapter 4 for details.
SCR Register
The emulator does not set any bits in the System Control Register
(SCR). You should set the FRZW bit in the SCR to avoid problems
when breaking into the monitor via a watchdog timer RESET.
Connecting the
emulator to the
target system
Connecting the
probe to a PGA
socket
The emulator supports connections to PGA sockets, 132-pin PQFP, and
144-pin TQFP package types for the Motorola MC68302.
To avoid having to replace the entire probe because of a bent or broken
pin, use a pin protector (that is, an extra PGA socket) between the
probe and the target.
PGA sockets are available from Hewlett-Packard as HP part number
1200-1318. A MacKenzie Technology PGA-100M-003B1-1324 socket
should also be suitable.
See chapter 5 for some important suggestions about using the emulator
in-circuit.
Note
The emulator probe requires a PGA (pin grid array) socket. Be sure to
use a PGA socket in your target system.
Follow these steps to install the probe in your target system:
1. Turn off power to the emulator and the target system.
1-8 The MC68302 Emulator
2. Take any necessary precautions to avoid static discharge.
3. Remove the MC68302 processor from the target system PGA
socket.
4. Plug the probe into a pin protector, if you have not already
done so.
5. Plug the probe into your target system.
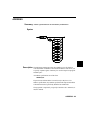
Be sure to orient the probe correctly. Pin A1 of the PGA
matrix is at the notched corner of the probe. (Note that pin
"A1" of the PGA matrix is signal "A14." Pin numbers do not
correspond to signal numbers for the MC68302.)
Figure 1-3. Connecting the Probe to a PGA Socket.
The MC68302 Emulator 1-9
6. Turn on the emulator.
7. Turn on power to the target system.
Turning on the emulator before the target system will prevent
damage to sensitive components in the target system.
Connecting using a
132-pin QFP Probe
Adapter Assembly
If your target system uses the MC68302FE surface mount (CQFP) or
the MC68302FC surface mount (PQFP) package, you should order the
following parts:
HP E3408A PQFP/CQFP Adapter Kit which includes:
– One HP E2414A QFP Probe Adapter Assembly (includes
an HP E2414-63201 transition socket)
– Two HP 64748-87608 Motorola MC22901PQFP132
dummy parts. Additional dummy parts can be ordered.
Caution
Equipment damage. The connections between the emulator probe,
probe adapter assembly, and microprocessor (dummy part) on the
target board are delicate and must be done with care. Refer to the
Operating Note supplied with the probe adapter assembly for specific
instructions when making the connection.
1. Install the "dummy" part in place of the microprocessor on
your target system. The QFP Probe Adapter Assembly
connects the dummy part to the emulator’s PGA probe.
Before connecting the emulator, a 132-pin PQFP "dummy
part" (a mechanical sample with no internal connections) must
be soldered onto the target system in place of the
microprocessor. This is necessary because the MC68302 has
no facility to three-state all of its signals. It is best to solder
the dummy part onto the target system using automated
surface mounting equipment to give more reliable probing.
Hand soldering may result in solder wicking up the leads,
1-10 The MC68302 Emulator
which can prevent the probe adapter cable assembly from
making good contact.
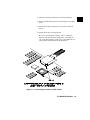
2. Select an orientation using the following illustration.
A QFP Probe Adapter can be installed in one of four
orientations as shown in the following illustration. This allows
flexibility in attaching the emulator probe when target system
components interfere. Select the orientation that best suits
your target system, and note the position of Pin 1 on the
microprocessor (dummy part) on your target board.
There are two labels with color coding and bar coding on the
QFP Probe Adapter; use these to ensure correct orientation
when the probe adapter is connected to the emulator. Note the
color or count the bars on the edge of the probe adapter that is
placed over the Pin 1 side of the dummy part. (For example,
Pin 1 of the dummy part may be along the side that is color
coded yellow, or along the side that has three bars.) There is a
corresponding edge on the PGA end of the probe adapter; it
has the same color code and bar code. Connect the PIN 1
SIDE of the emulator probe into the PGA end of the probe
adapter that has the same color code/bar code as is on the Pin
1 side of the microprocessor (dummy part).
3. Follow the instructions in the QFP Probe Adapter Assembly
Operating Note to install the adapter assembly.
The MC68302 Emulator 1-11
Figure 1-4. Connecting Using a QFP Adapter Assembly.
1-12 The MC68302 Emulator
Connecting using the
144-pin HP Wedge
Probing System
If your target system uses a 144-pin TQFP (thin quad flat pack)
surface-mounted integrated circuit, you should order:
HP E3438A Wedge Adapter Kit
– HP E3435A Wedge
– HP E3441A General-purpose Flexible Adapter
– HP E5347-87601 Male-to-male Header
– HP E3439A Transition Socket
– HP E3435-97001 HP Wedge Probing System User’s Guide
– Two HPE3435-87601 144-pin TQFP dummy parts
Caution
Equipment damage. Ensure that the emulator probe is aligned with
the proper pins when connecting to the general-purpose flexible
adapter. Serious equipment damage can result from improper
connection. Refer to the User’s Guide supplied with the HP Wedge
Probing System for instructions on installing the 144-pin HP Wedge
probe adapter, male-to-male header, general-purpose flexible adapter,
and transition socket.
1. Install the "dummy" part in place of the microprocessor on
your target system. The QFP Probe Adapter Assembly
connects the dummy part to the emulator’s PGA probe.
Before connecting the emulator, a 144-pin TQFP "dummy
part" (a mechanical sample with no internal connections) must
be soldered onto the target system in place of the
microprocessor. This is necessary because the MC68302 has
no facility to three-state all of its signals. It is best to solder
the dummy part onto the target system using automated
surface mounting equipment to give more reliable probing.
Hand soldering may result in solder wicking up the leads,
The MC68302 Emulator 1-13
which can prevent the probe adapter cable assembly from
making good contact.
2. Select an orientation using the following illustration.
The HP Wedge Probing System can be installed in one of four
orientations as shown in the following illustration. This allows
flexibility in attaching the emulator probe when target system
components interfere. Select the orientation that best suits
your target system, and note the position of Pin 1 on the
microprocessor (dummy part) on your target board.
There are two labels with color coding and bar coding on the
general-purpose flexible adapter; use these to ensure correct
orientation when the flexible adapter is connected to the
emulator. Note the color or count the bars on the edge of the
general-purpose flexible adapter that is placed over the Pin 1
side of the dummy part. (For example, Pin 1 of the dummy
part may be along the side that is color coded yellow, or along
the side that has three bars.) There is a corresponding edge on
the other end of the general-purpose flexible adapter; it has the
same color code and bar code. Connect the PIN 1 SIDE of the
emulator probe into the end of the general-purpsoe flexible
adapter that has the same color code/bar code as is on the Pin
1 side of the microprocessor (dummy part).
3. Follow the instructions in the HP Wedge Probing System
User’s Guide to install the probing system.
1-14 The MC68302 Emulator
Figure 1-5. Connecting Using the HP Wedge Probing Sys.
The MC68302 Emulator 1-15
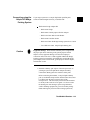
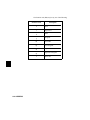
Other Sources of
Information
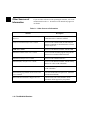
If you need other references while operating the emulator, refer to the
manuals listed in table 1-1. Note that several manuals may appear in
one binder.
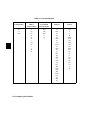
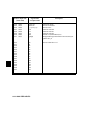
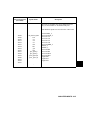
Table 1-1. Other Sources of Information
Manual
Description
HP 64700-Series Emulators Terminal Interface
Reference
Terminal Interface emulation, analysis, and CMB
commands used to control the emulator.
Analyzer Terminal Interface User’s Guide
How to use the emulation and external analyzers.
Analysis commands are described in the Terminal
Interface Reference.
CMB User’s Guide
How to use the M68302 emulator with the CMB.
M68302 Assembler/Linker User’s Guide
How to assemble and link programs using the HP
64870 Cross Assembler/Linker/Librarian.
M68302 PC Interface User’s Guide
How to use the emulator with a PC.
M68302 Softkey Interface User’s Guide
How to use the M68302 emulator with the Softkey
Interface on a Sun or HP workstation.
Graphical User Interface User’s Guide
How to use the Graphical User Interface on a Sun
or HP workstation.
MC68302 Integraged Multi-Protocol Processor
User’s Manual
Describes the M68302 microprocessor. (Motorola
part MC68302UM/AD).
HP 64700-Series Emulators Support Services
If all else fails, refer to this manual to locate
information about support for your product.
1-16 The MC68302 Emulator
2
Getting Started
Before Using the
HP 64746
Things to Know
Before You Begin
If you haven’t already done so, connect the emulator to the host
computer. If necessary, refer to the HP 64700-Series Emulators
Hardware Installation And Configuration manual for details. Then
return here.
Before working the examples in this chapter, be sure you know the
following:
Know Your System Configuration
Determine which system configuration you will use (either standalone,
transparent, or remote). Refer to the HP 64700-Series Emulators
Hardware Installation And Configuration manual for additional
information.
If you are using the Remote Configuration, you must have completed
installation and configuration of a terminal emulator program which
will allow your host to act as a terminal connected to the emulator. In
addition, you must start the terminal emulator program before you can
work the examples in this chapter. Refer to the HP 64700-Series
Emulators Hardware Installation And Configuration manual and the
appropriate terminal emulator software manual (such as that for HP
AdvanceLink).
Know the Basic Concepts of Emulation
You should read and understand the concepts of emulation presented in
the HP 64700-Series Emulators System Overview manual. A brief
understanding of these concepts may help avoid questions later.
Getting Started 2-1
Apply Power
Caution
POSSIBLE DAMAGE TO TARGET SYSTEM!
The emulator power must be turned on before the target system power.
An excess amount of current may be drawn out of the target system and
the target system may be damaged if the order is reversed. Likewise,
the target system should be turned off first and then the emulator.
Apply power to the emulator if you haven’t already done so. After
power is applied, the following information should be displayed.
Copyright (c) Hewlett-Packard Co. 1987
All Rights Reserved. Reproduction, adaptation, or translation without prior
written permission is prohibited, except as allowed under copyright laws.
HP64700 Series Emulation System
Version:
A.03.00 13Dec90
HP64746A (PPN: 64746A) Motorola 68302 Emulator
Version:
A.00.03 24Jun91
Control:
HP64170A Memory Control Board
You will also see information about the amount of memory installed in
each bank on the memory control board.
If a message like the one above is not displayed, refer to the Support
Services manual.
About the Prompts
Press <RETURN> to display one of these prompts:
U> (emulator is running user code)
R> (emulation processor is reset - in normal mode)
M> (emulator is running in monitor)
Upon powerup the prompt should be R>.
2-2 Getting Started
If No Prompt is
Displayed
If one of the prompts (U>, R>, or M>) is not displayed, cycle power on
the emulator. The prompt character should be an R> at this point.
If the emulator still doesn’t respond, toggle data communication
switch 4 (refer to the HP 64700-Series Emulators Installation And
Configuration manual). Cycle power on the emulator. Then press
<RETURN> again.
If one of the prompts still does not appear after you have done this,
refer to the HP 64700-Series Emulators Support Services manual for
information about how to resolve this problem. The Support Services
manual contains a list of Hewlett-Packard Sales and Service Offices
that you can use to contact your HP Representative.
Note
One of these prompts must appear before you can continue.
Note
All HP 64700-Series commands must be entered using lower case
letters. Follow each of the commands by pressing <RETURN> on
your terminal (or <ENTER> on your personal computer) unless
instructed otherwise.
Do not place spaces before or after ".." and "="; doing so will result in
an "Invalid option or operand" error.
Description of the
Prompts
The prompts for the emulator are:
c>
The c> prompt means that the emulator is in
external clock mode (set using cf clk=ext) and
is waiting for a clock signal from the target
system. If the target power has not been
Getting Started 2-3
applied do so now. Then press <RETURN>.
The R> prompt should be present now.
2-4 Getting Started
R>
The processor is being held reset from the
emulator.
r>
The processor is being held reset, but not from
the emulator.
h>
The processor is halted.
g>
The bus has been granted for direct memory
access (DMA).
w>
A memory cycle has started but has not
completed. This is caused when no device has
issued a termination signal (DTACK or BERR)
to the processor.
W>
This indicates the emulator is waiting for the
CMB ready signal.
M>
The emulator is executing in the monitor.
b>
No external bus cycles are occurring. Usually
the emulator can determine why this is the case
and will display the prompt such as w>, c>, or
r> to indicate the cause of no bus cycles. If no
reason can be determined, the b> prompt will
be displayed. One possibility is that a STOP
instruction was executed.
Initialize the
Emulator
If you plan to use the MC68302 emulator to follow the exercises in this
chapter, verify that no one else is using the emulator.
POSSIBLE LOSS OF INFORMATION!
Caution
It is important that you verify that no one else is using the emulator at
this time. If you or someone else is operating the MC68302 emulator
in a standalone configuration controlled by a data terminal, and have
entered a program into memory by manually modifying the memory
locations, this information will be lost during the initialization process.
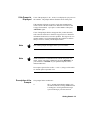
To display the available initialization options, enter:
M>help init
init - reinitialize system
init
init -c
init -p
- limited initialization; resets emulation and analysis products
but not environment (macros, equates, date & time, etc.)
- complete initialization; does not run system memory
integrity tests
- powerup initialization; run from reset with complete
system verification tests
Notice that the init command performs the following:
Resets the emulation configuration items.
Resets the break conditions.
Clears software breakpoints.
The init command does not clear macros or equates (logical
expressions).
To initialize the emulator, enter:
M>init
#Limited initialization completed
Getting Started 2-5
Other Initialization
Options
Using the Help
Facility
The -c and -p options to the init command allow you to perform a more
complete initialization of the emulator. The init -c command performs
a cold-start initialization, except that performance verification tests are
not executed. The init -p command performs a powerup initialization,
which is also referred to as a cold-start initialization. This process
includes emulator, analyzer, system controller, communications port,
and performance verification initialization.
If you need quick reference information about a command or a set of
commands, you can use the built-in help facilities. For example, to
display the help menu, enter:
R>help
help
- display help information
help <group>
help -s <group>
help <command>
help
-
print
print
print
print
help for desired group
short help for desired group
help for desired command
this help screen
--- VALID <group> NAMES --gram
- system grammar
proc
- processor specific grammar
sys
emul
trc
xtrc
*
-
system commands
emulation commands
analyzer trace commands
external trace analysis commands
all command groups
You can enter the ? symbol in place of the word "help." If you want to
display information about the emulation command group, enter:
R>? emul
emul - emulation commands
----------------------------------------------------------------------------b......break to monitor cp.....copy memory
mo.....modes
bc.....break condition
dump...dump memory
r......run user code
bp.....breakpoints
es.....emulation status reg....registers
cf.....configuration
io.....input/output
rst....reset
cim....copy target image load...load memory
rx.....run at CMB execute
cmb....CMB interaction
m......memory
s......step
map....memory mapper
ser....search memory
To display information for a single command, type help (or ?) and the
command name. For example:
2-6 Getting Started
R>help load
load - download absolute file into processor memory space
load
load
load
load
load
load
load
load
load
load
load
load
load
load
load
-i
-m
-t
-S
-h
-a
-e
-u
-o
-s
-b
-x
-q
-p
-c <file>
Configure the
Emulator
-
download intel hex format
download motorola S-record format
download extended tek hex format
download symbol file
download hp format (requires transfer protocol)
reserved for internal hp use
write only to emulation memory
write only to target memory
data received from the non-command source port
send a character string out the other port
data sent in binary (valid with -h option)
data sent in hex ascii (valid with -h option)
quiet mode
record ACK/NAK protocol (valid with -imt options)
data is received from the 64000. file name format is:
<filename>:<userid>:absolute
You may want to change the default emulator configuration items
before proceeding. To do this, refer to chapter 4 for detailed
information. When you are finished, return here.
Getting Started 2-7
Software
Supported Absolute
Files
Assembler/Linker
Supported absolute file formats that you can download into the target
system include, HP, Intel hex, Motorola S-records, and Tektronix hex.
To download executable code in HP format you must use the HP
64700-Series MC68302 Emulator PC Interface or Softkey Interface.
Assembly language support for the MC68302 includes:
HP 64870 HP 9000-based M68000
Assembler/Linker/Librarian . (This assembler generates code
for the M68000, M68008, M68010, MC68302, M68332, and
M68020 processors. The product number for Apollo
computers is HP B1423 .)
C Compiler
High-level language support for the MC68302 includes:
HP 64902 HP 9000-based M68000 C Compiler (Product
number B1421 for Apollo computers)
Branch Validator
Branch analysis support includes:
HP B1419 HP Branch Validator
About the Other
Interfaces
HP provides easy-to-use emulator interfaces for the following host
computers:
Personal computers
HP 9000 Series 300 workstations
HP 9000 Series 700 workstations
Sun workstations
These interfaces provide menu-driven access to emulator commands,
disassembly, high-level source code debugging, and many other
features to make your job easier.
2-8 Getting Started
Example Program
The rest of this chapter will lead you through a basic, step by step
tutorial designed to familiarize you with the use of the HP 64700
emulator for the 68302 microprocessor. When you have completed this
chapter, you will be able to perform these tasks:
Set up an emulation configuration for out of circuit emulation
use.
Map memory.
Transfer a small program into emulation memory.
Use run/stop controls to control operation of your program.
Use memory manipulation features to alter the program’s
operation.
Use analyzer commands to view the real time execution of
your program.
A Look at the
Sample Program
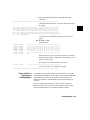
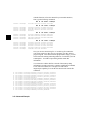
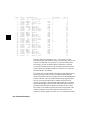
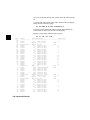
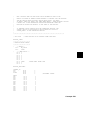
The sample program "COMMAND_READER" used in this chapter is
shown in figure 2-1. The program is a primitive command interpreter.
Data Declarations
INPUT_POINTER and OUTPUT_POINTER define the address
locations of an input area and an output area to be used by the program.
MESSAGE_A, MESSAGE_B and INVALID_INPUT are the
messages used by the program to respond to various command inputs.
Initialization
The locations of the input and output areas are moved into address
registers for use by the program. Next, the CLEAR routine clears the
command byte (the first byte location pointed to by the input area
address - 3000 hex).
Getting Started 2-9
Command line:
Line Address
1
2
3
4
5
00000000
6
00000004
7
8
00000008
9
10
11
12
13
14
15
16
17
18
19
20
21
22
23
24
25
26
27
28
29
30
31
32
33
34
35
36
37
38
39
40
41
42
43
44
as68k -Lh newprog.s
CHIP
68000
SECTION DATA,,D
0000 3000
0000 4000
5448
5320
4147
00000019 5448
5320
4147
4953
4D45
4520
4953
4D45
4520
INPUT_POINTER DC.L 00003000H
OUTPUT_POINTER DC.L 00004000H
2049
5353
41
2049
5353
42
0000002A 494E 5641 4C49
4420 434F 4D4D
414E 44
MESSAGE_A
DC.B
’THIS IS MESSAGE A’
MESSAGE_B
DC.B
’THIS IS MESSAGE B’
INVALID_INPUT DC.B
’INVALID COMMAND’
SECTION PROG,,C,P
00000000 2479 0000 0000
00000006 2679 0000 0004
R INIT
R
MOVE.L INPUT_POINTER,A2
MOVE.L OUTPUT_POINTER,A3
0000000C 14BC 0000
CLEAR
MOVE.B #00H,(A2)
00000010 1012
00000012 0C00 0000
00000016 67F8
READ_INPUT
MOVE.B (A2),D0
CMP.B #00h,D0
BEQ READ_INPUT
00000018
0000001C
00000020
00000024
00000028
PROCESS_COMM
CMP.B #41H,D0
BEQ COMMAND_A
CMP.B #42H,D0
BEQ COMMAND_B
BRA UNRECOGNIZED
COMMAND_A
MOVE.B #11H,D0
MOVE.L #MESSAGE_A,A0
0C00
6700
0C00
6700
6000
0041
000E
0042
0014
001E
0000002C 103C 0011
00000030 207C 0000 0008
00000036 6000 001A
0000003A 103C 0011
0000003E 207C 0000 0019
00000044 6000 000C
00000048 103C 000F
0000004C 207C 0000 002A
00000052 224B
R
COMMAND_B
BRA OUTPUT
MOVE.B #11H,D0
MOVE.L #MESSAGE_B,A0
UNRECOGNIZED
BRA OUTPUT
MOVE.B #0FH,D0
MOVE.L #INVALID_INPUT,A0
OUTPUT
MOVE.L A3,A1
R
R
Figure 2-1. Listing of newprog.s.
2-10 Getting Started
Line
45
46
47
48
49
50
51
52
53
54
55
56
57
58
Address
00000054 123C 0020
00000058
0000005A
0000005E
00000062
2A4B
1AFC 0000
0441 0001
66F6
00000064
00000066
0000006A
0000006C
12D8
0440 0001
66F8
4EFA FF9E
CLEAR_OLD
CLEAR_LOOP
LOOP
MOVE.B #20H,D1
MOVE.L A3,A5
MOVE.B #00H,(A5)+
SUBI #01H,D1
BNE CLEAR_LOOP
MOVE.B (A0)+,(A1)+
SUBI #01H,D0
BNE LOOP
JMP CLEAR
END
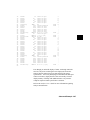
Figure 2-2. Listing of newprog.s (continued).
Read_Input
This routine continuously reads the byte at location 3000 hex until it is
something other than a null character (00 hex); when this occurs, the
PROCESS_COMM routine is executed.
Process_Comm
Compares the input byte (now something other than a null) to the
possible command bytes of "A" (ASCII 41 hex) and "B" (ASCII 42
hex), then jumps to the appropriate set up routine for the command
message. If the input byte does not match either of these values, a
branch to a set up routine for an error message is executed.
Command_A, Command_B, Unrecognized
These routines set up the proper parameters for writing the output
message: the number of bytes in the message is moved to the D0
register and the base address of the message in the data area is moved
to address register A0.
Output
First the base address of the output area is copied to A1 (this preserves
A3 for use in later program passes). Then the CLEAR_OLD routine
Getting Started 2-11
writes nulls to 32 bytes of the output area (this serves both to initialize
the area and to clear old messages written during previous program
passes).
Finally, the proper message is written to the output area by the LOOP
routine. When done, LOOP jumps back to CLEAR and the command
monitoring process begins again.
Using the various features of the emulator, we will show you how to
load this program into emulation memory, execute it, monitor the
program’s operation with the analyzer, and simulate entry of different
commands utilizing the memory access commands provided y the HP
64700 command set.
2-12 Getting Started
Initialize the
Emulator to a
Known State
Note
To initialize the emulator to a known state for this tutorial:
It is especially important that you perform the following step if the
emulator is being operated in a standalone mode controlled by only a
data terminal. The only program entry available in this mode is
through memory modification; consequently, if the emulator is
reinitialized, emulation memory will be cleared and a great deal of
tedious work could be lost.
1. Verify that no one else is using the emulator or will have need
of configuration items programmed into the emulator.
2. Initialize the emulator by typing the command:
R> init -p
Set Up the Proper
Emulation
Configuration
Set Up Emulation
Conditions
To set the emulator’s configuration values to the proper state for this
tutorial, do this:
1. Type:
R> cf
You should see the following configuration items displayed:
R>cf
cf ba=en
cf trc_dma=dis
cf bbk=0
Getting Started 2-13
cf
cf
cf
cf
cf
cf
cf
cf
cf
cf
cf
cf
cf
cf
cf
cf
cf
cf
cf
bfc=sp
be=dis
clk=int
dbc=en
dti=dis
lfc=x
mon=bg
rrt=dis
rssp=9
swtp=0
ti=dis
im=nor
int7=lev
iack7=pb0
pdw=16
cs0_dtk=int
cs1_dtk=ext
cs2_dtk=ext
cs3_dtk=ext
Note
The individual configuration items won’t be explained in this example;
refer to chapter 4 of this manual and the Reference manual for details.
2. If the configuration items displayed on your screen don’t
match the ones listed above, here is how to make them agree:
For each configuration item that does not match, type:
R> cf <config_item>=<value>
For example, if you have the following configuration items
displayed (those in bold indicate items different from the list
above):
cf
cf
cf
cf
cf
cf
cf
ba=en
bat=dis
bbk=0
be=dis
bfc=sp
clk=ext
dbc=dis
.
.
.
To make these configuration values agree with the desired
values, type:
R> cf clk=int
R> cf dbc=en
3. Let’s go ahead and set up the proper break conditions.
2-14 Getting Started
Type:
R> bc
You will see:
bc
bc
bc
bc
bc
bc
-d
-d
-d
-d
-d
-d
bp #disable
rom #disable
bnct #disable
cmbt #disable
trig1 #disable
trig2 #disable
For each break condition that does not match the one listed,
use one of the following commands:
To enable break conditions that are currently disabled, type:
R> bc -e <breakpoint type>
To disable break conditions that are currently enabled, type:
R> bc -d <breakpoint type>
For example, if typing bc gives the following list of break
conditions:
(items in bold indicate improper values for this example)
bc
bc
bc
bc
bc
bc
-d
-d
-d
-d
-e
-e
bp #disable
rom #disable
bnct #disable
cmbt #disable
trig1 #enable
trig2 #enable
Type the following commands to set the break conditions
correctly for this example:
R> bc -e rom
(this enables the write to ROM break)
R> bc -d trig1 trig2
(this disables break on triggers from the analyzer)
4. To avoid problems later while modifying and displaying
memory locations, type:
R> mo -ab -db
This sets the access and display modes for memory operation
to byte. (If they are left at the default mode of word, the
memory modification and display examples will not function
correctly.)
Getting Started 2-15
Map Memory
The high-speed emulation memory can be mapped at a resolution of 1
kilobyte.
Emulation memory allows you to store programs and data used in
development before target system memory is available. For this
example, you will need to map some of the memory blocks to various
type designators. Do the following:
Type:
R>
R>
R>
R>
Set Up the Stack
Pointer
map
map
map
map
1000..1fff eram
2000..2fff erom
3000..5fff eram
0fff000..0ffffff tram
After emulator initialization, the "reset supervisor stack pointer"
configuration item (cf rssp) and the supervisor stack pointer are set to
an odd value. Since you cannot run the emulator when the supervisor
stack pointer is odd, you must set up the supervisor stack pointer
register to contain an even value. You can do this by using the reg
command to modify the supervisor stack pointer, or you can change the
reset supervisor stack pointer configuration item (as shown below).
The value you assign to the rssp configuration item is placed into the
supervisor stack pointer on the entrance to the emulation monitor from
an emulation initiated RESET state (the R> prompt).
For this example, we will define the stack pointer within one of the
areas mapped earlier.
2-16 Getting Started
Type:
R>cf rssp=5000
R>b
This defines register A7 (the supervisor stack pointer) as 5000 hex.
The stack will grow downward in memory from this location; for
purposes of our example, it will not grow far enough to interfere with
the output area for the program defined at 4000 hex. (The 68302
emulator does not provide stack checking hardware or software to
guard against program destruction from an overgrown stack; your
program must provide such protection.)
To get the "M>" prompt shown in the next section, type:
R>b
M>
Transfer Code
into Memory
From a Terminal in
Standalone
Configuration
To transfer code into memory from a data terminal running in
standalone mode, you must use the modify memory commands. This is
necessary because you have no host computer transfer facilities to
automatically download the code for you (as you would if you were
using the transparent configuration or the remote configuration.)
To minimize the effects of typing errors, you will modify only one row
of memory at a time in this example. Do the following:
Getting Started 2-17
Make sure that you have modified the memory access mode default to
byte as instructed earlier, before you proceed with memory
modification. If you are in doubt, type mo at the prompt. If you see mo
-ab -db, your setup is fine. Otherwise, type mo -ab -db at the prompt
to set the memory display and modification modes.
Note
1. Enter the data information for the program by typing the
following commands:
M>
M>
M>
M>
m
m
m
m
1000..100f=00,00,30,00,00,00,40,00,54,48,49,53,20,49,53,20
1010..101f=4d,45,53,53,41,47,45,20,41,54,48,49,53,20,49,53
1020..102f=20,4d,45,53,53,41,47,45,20,42,49,4e,56,41,4c,49
1030..1038=44,20,43,4f,4d,4d,41,4e,44
If you make a mistake, enable command line editing by typing:
M> cl -e
The commands for command line editing are described in the
"Command Entry" chapter of the Terminal Interface Reference. You
can see a summary of the editing commands by typing:
M> help cl
1. You should now verify that the data area of the program is
correct by typing:
M> m 1000..1038
You should see:
001000..00100f
001010..00101f
001020..00102f
001030..001038
00
4d
20
44
00
45
4d
20
30
53
45
43
00
53
53
4f
00
41
53
4d
00
47
41
4d
40
45
47
41
00
20
45
4e
54 48 49 53 20 49 53 20
41 54 48 49 53 20 49 53
20 42 49 4e 56 41 4c 49
44
If this is not correct, you can correct the errors by re-entering
only the modify memory commands for the particular rows of
memory that are wrong.
For example, if row 1000..100f shows these values:
001000..00100f
00 30 00 00 00 40 00 54 48 49 53 20 49 53 20 20
you can correct this row of memory by typing:
M> m 1000..100f=00,00,30,00,00,00,40,00,54,48,49,53,20,49,53,20
Or, you might need to modify only one location, as in the
instance where address 100f equals 32 hex rather than 20 hex.
Type:
M> m 100f=20
2-18 Getting Started
2. Enter the program information by typing the following
commands:
M> m 2000..200f=24,79,00,00,10,00,26,79,00,00,10,04,14,0bc,00,00
(note the third from last term -- hex letters must be preceded
by a digit)
M>
M>
M>
M>
M>
M>
M>
m
m
m
m
m
m
m
2010..201f=10,12,0c,00,00,00,67,0f8,0c,00,00,41,67,00,00,0e
2020..202f=0c,00,00,42,67,00,00,14,60,00,00,1e,10,3c,00,11
2030..203f=20,7c,00,00,10,08,60,00,00,1a,10,3c,00,11,20,7c
2040..204f=00,00,10,19,60,00,00,0c,10,3c,00,0f,20,7c,00,00
2050..205f=00,2a,22,4b,12,3c,00,20,2a,4b,1a,0fc,00,00,04,41
2060..206f=00,01,66,0f6,12,0d8,04,40,00,01,66,0f8,4e,0f9,00,002070..2071=20,0c
You should now verify that the program area is correct by
typing:
M> m 2000..2071
You should see:
002000..00200f
002010..00201f
002020..00202f
002030..00203f
002040..00204f
002050..00205f
002060..00206f
002070..002071
24
10
0c
20
00
00
00
20
79
12
00
7c
00
2a
01
0c
00
0c
00
00
10
22
66
00
00
42
00
19
4b
f6
10
00
67
10
60
12
12
00
00
00
08
00
3c
d8
26
67
00
60
00
00
04
79
f8
14
00
0c
20
40
00
0c
60
00
10
2a
00
00
00
00
1a
3c
4b
01
10
00
00
10
00
1a
66
04
41
1e
3c
0f
fc
f8
14
67
10
00
20
00
4e
bc
00
3c
11
7c
00
f9
00
00
00
20
00
04
00
00
0e
11
7c
00
41
00
If this is not correct, you can correct the errors by re-entering
only the modify memory commands for the particular rows of
memory that are wrong.
For example, if row 2000..200f shows the values
002000..00200f
24 79 00 10 00 26 79 00 00 10 04 14 bd 00 00 00
you can correct this row of memory by typing:
M> m 2000..200f=24,79,00,00,10,00,26,79,00,00,10,04,14,0bc,00,00
From a Host in
Transparent
Configuration
The method provided in this example assumes that you are using the
Hewlett-Packard’s 68000 Cross Assembler/ Linker/Loader (HP product
number 64870 if you are using an HP Series 9000 computer). In
addition, you must have the HP 64000 transfer software running on
your host.
If you are using another assembler, you may be able to adapt the
methods below to load your code into the emulator (refer to the HP
64700 Terminal Interface User’s Reference manual for help).
Getting Started 2-19
If you are not able to transfer code from your host to the emulator using
one of these methods, use the method described previously under
"From a Terminal in Standalone Mode", as it will work in all cases.
However, transferring code using host transfer facilities is easier and
faster than modifying memory locations, especially for large programs.
1. First, you must establish communications with your host
computer through the transparent mode link provided in the
HP 64700. Enable the transparent mode link by typing:
M> xp -e
If you then press <RETURN> a few times, you should see:
login:
login:
login:
This is the login prompt for the host system. (Your prompt
may differ depending on how your system manager has
configured your system.)
2. Log in to your host system and start up an editor such as "vi".
You should now enter the source code for the sample program
shown at the beginning of the chapter. When finished, save
the program to filename "newprog.s".
Note
If you need help learning how to log in to your host system or use other
features of the system, such as editors, refer to the host documentation
(for an HP-UX host, read the HP-UX Concepts and Tutorials guides)
or ask your system administrator.
3. Assemble your code with the 68000 Cross Assembler using
the command:
$ as68k -Lh newprog.s newprog.lis
This will generate an expanded listing with cross reference
table of all the symbols used. If any assembly errors were
reported, re-edit your file and verify that the code was entered
correctly (compare to the listing at the beginning of the
chapter).
2-20 Getting Started
4. Link the program to the correct addresses.
Using your editor, create a linker command file called "newprog.cmd":
NAME newprog
LIST C,D,O,P,S,T,X
ORDER PROG,DATA
SECT DATA=1000H
SECT PROG=2000H
LOAD newprog.o
END
Now link using the command using the command:
$ ld68k -c newprog.cmd -Lh
Now it’s time to transfer your code into the emulator. Do the following:
1. Disable the transparent mode so that your terminal will talk
directly to the emulator. Type:
$ <ESC>g xp -d
The "<ESC>g" sequence temporarily toggles the transparent
mode so that the emulator will accept commands; "xp -d" then
fully disables the transparent mode.
2. Load code into the emulator by typing:
M> load -hbo
transfer -tb newprog.X<ESC>g (NOTE: DO NOT
TYPE CARRIAGE RETURN!)
The system will respond:
##
M>
load -hbo tells the emulator to load code expected in HP
binary file format and to expect the data from the other port
(the one connected to the host). It then puts you in
communication with the host; you then enter the transfer
command to start the HP 64000 transfer utility. Typing
"<ESC>g" tells the system to return to the emulator after
transferring the code. The "##" marks returned by the system
indicates that the emulator loaded two records from the host.
3. At this point you should examine a portion of memory to
verify that your code was loaded correctly. Type:
M> m 1000..1038
You should see:
Getting Started 2-21
001000..00100f
001010..00101f
001020..00102f
001030..001038
00
4d
20
44
00
45
4d
20
30
53
45
43
00
53
53
4f
00
41
53
4d
00
47
41
4d
40
45
47
41
00
20
45
4e
54 48 49 53 20 49 53 20
41 54 48 49 53 20 49 53
20 42 49 4e 56 41 4c 49
44
If your system does not match, verify that you entered the
source code and linker command file correctly.
Looking at Your
Code
Now that you have loaded your code into memory, you can display it in
mnemonic format. Type:
M> sym start=2000
M> m -dm 2000..206d
You will see:
0002000
0002006
000200c
0002010
0002012
0002016
0002018
000201c
0002020
0002024
0002028
000202c
0002030
0002036
000203a
000203e
0002044
0002048
000204c
0002052
0002054
0002058
000205a
000205e
0002062
0002064
0002066
000206a
000206c
start
-
2-22 Getting Started
MOVEA.L
MOVEA.L
MOVE.B
MOVE.B
CMPI.B
BEQ.B
CMPI.B
BEQ.W
CMPI.B
BEQ.W
BRA.W
MOVE.B
MOVEA.L
BRA.W
MOVE.B
MOVEA.L
BRA.W
MOVE.B
MOVEA.L
MOVEA.L
MOVE.B
MOVEA.L
MOVE.B
SUBI.W
BNE.B
MOVE.B
SUBI.W
BNE.B
JMP
0001000,A2
0001004,A3
#000,[A2]
[A2],D0
#000,D0
0002010
#041,D0
000202c
#042,D0
000203a
0002048
#011,D0
#000001008,A0
0002052
#011,D0
#000001019,A0
0002052
#00f,D0
#00000102a,A0
A3,A1
#020,D1
A3,A5
#000,[A5]+
#00001,D1
000205a
[A0]+,[A1]+
#00001,D0
0002064
000200c[PC]
Familiarize
Yourself with the
System Prompts
Note
The following steps are not intended to be complete explanations of
each command; the information is only provided to give you some idea
of the meanings of the various command prompts you may see and
reasons why the prompt changes as you execute various commands.
You should gain some familiarity with the HP 64700 emulator
command prompts by doing the following:
1. Ignore the current command prompt. Type:
M> rst
You will see:
R>
The rst command resets the emulation processor and holds it
in the reset state. The "R>" prompt indicates that the
processor is reset.
2. Type:
R> r 2000
You will see:
U>
The r (run) command causes the emulation processor to begin
executing from the current program counter address or from
the specified address.
The "U>" prompt indicates that the emulation processor is
running in foreground, rather than in the monitor. When you
have a program loaded into memory, this prompt indicates
that the processor is running a user program.
Getting Started 2-23
Note
This prompt (U>) will be displayed if there is user code to run, or if
you try to run the processor and no breaks occur.
3. To cause the emulator to begin executing in the monitor, enter:
U> b
You will see:
M>
The b (break) command causes the emulation processor to
stop execution of whatever it is doing and begin executing in
the emulation monitor. The newly displayed "M>" prompt
indicates that the emulator is running in the monitor.
To view all of the possible emulator prompts (emulation status
characters), enter:
M>help proc
2-24 Getting Started
Running the
Sample Program
1. Type:
M> r 2000
The emulator changes state from background to foreground
and begins running the sample program from location 2000
hex.
The default number base for address and data values within HP 64700
is hexadecimal. Other number bases may be specified. Refer to the
"Expressions" chapter of the HP 64700 Terminal Interface Reference
manual for further details.
Note
2. Let’s look at the registers to verify that the address registers
were properly initialized with the pointers to the input and
output areas. Type:
U> reg
You will see:
reg
reg
reg
reg
pc=00000000 st=2700 d0=00000000 d1=00000000 d2=00000000 d3=00000000
d4=00000000 d5=00000000 d6=00000000 d7=00000000 a0=00000000 a1=00000000
a2=00000000 a3=00000000 a4=00000000 a5=00000000 a6=00000000 a7=00005000
usp=00000000 ssp=00005000 bar=bfff scr=00000f00
Notice that A2 contains 3000 hex; A3 contains 4000 hex.
3. Verify that the input area command byte was cleared during
initialization.
Type:
U> m -db 3000
You will see:
003000..003000
00
The input byte location was successfully cleared.
Getting Started 2-25
4. Now we will use the emulator features to make the program
work. Remember that the program writes specific messages to
the output area depending on what the input byte location
contains. Type:
U> m 3000=41
This modifies the input byte location to the hex value for an
ASCII "A". Now let’s check the output area for a message.
U> m 4000..401f
You will see:
004000..00400f
004010..00401f
54 48 49 53 20 49 53 20 4d 45 53 53 41 47 45 20
41 00 00 00 00 00 00 00 00 00 00 00 00 00 00 00
These are the ASCII values for MESSAGE_A.
Repeat the last two commands twice. The first time, use 42
instead of 41 at location 3000 and note that MESSAGE_B
overwrites MESSAGE_A. Then try these again, using any
number except 00, 41, or 42 and note that the
INVALID_INPUT message is written to this area.
Tracing Program
Execution
2-26 Getting Started
Now let’s use the emulation analyzer to trace execution of the program.
Suppose that you would like to start the trace when the analyzer begins
writing data to the message output area. You can do this by specifying
an analyzer trigger upon encountering the address 4000 hex.
Furthermore, you might want to store only the data written to the
output area. This can be accomplished by modifying what is known as
the "analyzer storage specification".
Note
For this example, you will be using the analyzer in the easy
configuration, which simplifies the process of analyzer measurement
setup. The complex configuration allows more powerful
measurements, but requires more interaction from you to set up those
measurements. Such examples will be covered in later chapters. For
more information on easy and complex analyzer configurations and the
analyzer, refer to the HP 64700 Analyzer User’s Guide and the User’s
Reference.
Now, let’s set the trigger specification. Type:
M> tg addr=4000
Do you remember how to get the "M>" prompt? Type "b" to break
from the running prompt "U>" to the monitor prompt "M>". The
commands in this section will also work if you type them at the "U>"
prompt.
To store only the accesses to the address range 4000 through 4011 hex,
type:
M> tsto addr=4000..4011
Let’s change the data format of the trace display so that you will see the
output message writes displayed in ASCII format:
M> tf addr,h data,A count,R seq
Start the trace by typing:
M> t
You will see:
Emulation trace started
To start the emulation run, type:
M> r 2000
Now, you need to have a "command" input to the program so that the
program will jump to the output routines (otherwise the trigger will not
be found, since the program will never access address 4000 hex). Type:
U> m 3000=41
To display the trace list, type:
U> tl 0..34
Getting Started 2-27
You will see:
Line
----0
1
2
3
4
5
6
7
8
9
10
11
12
13
14
15
16
17
18
19
20
21
22
23
24
25
26
27
28
29
30
31
32
33
34
addr,H
-----004000
004001
004002
004003
004004
004005
004006
004007
004008
004009
00400a
00400b
00400c
00400d
00400e
00400f
004010
004011
004000
004001
004002
004003
004004
004005
004006
004007
004008
004009
00400a
00400b
00400c
00400d
00400e
00400f
data,A
-----..
..
..
..
..
..
..
..
..
..
..
..
..
..
..
..
..
..
TT
HH
II
SS
..
II
SS
..
MM
EE
SS
SS
AA
GG
EE
..
count,R
----------1.880 uS
1.880 uS
1.840 uS
1.880 uS
1.880 uS
1.880 uS
1.880 uS
1.880 uS
1.880 uS
1.880 uS
1.840 uS
1.880 uS
1.880 uS
1.880 uS
1.880 uS
1.880 uS
1.880 uS
28.00 uS
1.880 uS
1.840 uS
1.880 uS
1.880 uS
1.880 uS
1.880 uS
1.880 uS
1.880 uS
1.880 uS
1.840 uS
1.880 uS
1.880 uS
1.880 uS
1.880 uS
1.880 uS
seq
--+
.
.
.
.
.
.
.
.
.
.
.
.
.
.
.
.
.
.
.
.
.
.
.
.
.
.
.
.
.
.
.
.
.
If you look at the last lines of the trace listing, you will notice that the
analyzer seems to have stored only part of the output message, even
though you specified more than the full range needed to store all of the
message. The reason for this is that the analyzer has a storage pipeline,
which holds states that have been acquired but not yet written to trace
memory. To see all of the states, halt the analyzer by typing:
U> th
You will see:
Emulation trace halted
Now display the trace list:
U> tl 0..34
You will see:
2-28 Getting Started
Line
----0
1
2
3
4
5
6
7
8
9
10
11
12
13
14
15
16
17
18
19
20
21
22
23
24
25
26
27
28
29
30
31
32
33
34
addr,H
-----004000
004001
004002
004003
004004
004005
004006
004007
004008
004009
00400a
00400b
00400c
00400d
00400e
00400f
004010
004011
004000
004001
004002
004003
004004
004005
004006
004007
004008
004009
00400a
00400b
00400c
00400d
00400e
00400f
004010
data,A
-----..
..
..
..
..
..
..
..
..
..
..
..
..
..
..
..
..
..
TT
HH
II
SS
..
II
SS
..
MM
EE
SS
SS
AA
GG
EE
..
AA
count,R
----------1.880 uS
1.880 uS
1.840 uS
1.880 uS
1.880 uS
1.880 uS
1.880 uS
1.880 uS
1.880 uS
1.880 uS
1.840 uS
1.880 uS
1.880 uS
1.880 uS
1.880 uS
1.880 uS
1.880 uS
28.00 uS
1.880 uS
1.840 uS
1.880 uS
1.880 uS
1.880 uS
1.880 uS
1.880 uS
1.880 uS
1.880 uS
1.840 uS
1.880 uS
1.880 uS
1.880 uS
1.880 uS
1.880 uS
1.880 uS
seq
--+
.
.
.
.
.
.
.
.
.
.
.
.
.
.
.
.
.
.
.
.
.
.
.
.
.
.
.
.
.
.
.
.
.
.
As you can see, all of the requested states have been captured by the
analyzer. By the way, you may be wondering why the analyzer has
"doubled up" the message written on both bytes of the data bus. This
occurred because we were using byte write accesses to the requested
address; the output data was repeated on both the lower and upper bytes
of the data bus.
Getting Started 2-29
For More
Information
2-30 Getting Started
Chapter 3 contains additional information about using the emulator. If
you want detailed information about emulation commands, refer to the
Terminal Interface Reference.
3
Advanced Example
In the previous chapter, "Getting Started", you learned how to load
code into the emulator, how to modify memory and view a register, and
how to perform a simple analyzer measurement. This chapter will
discuss in more detail how to use the emulator. Some of the topics
discussed discussed in this chapter build upon others; therefore,
proceed through the chapter by working through each topic
sequentially and not by jumping randomly from topic to topic.
The Sample
Programs
The last chapter looked at a primitive command interpreter; that is, it
wrote various messages to an output buffer depending on the character
you inserted in the input buffer. That program executed only in the
68302 processor’s supervisor state.
This chapter uses a modified version of the program from chapter 2. It
performs exactly the same function; however, the program now
changes between supervisor and user states.
The supervisor program performs most of the initialization
routines and reads the input buffer, looking for a command.
When a command is entered, the program changes to the user
state.
The user program determines which command was entered
and writes the appropriate output message. A software trap
then returns execution to the supervisor program.
The programs are listed and described on the following pages.
Notice that the supervisor and user programs are assembled and linked
separately; this is necessary in order to load the programs correctly.
Advanced Example 3-1
Supervisor Program
The supervisor program used in the following examples is shown in
figure 3-1.
Variable Declaration
Command line:
Line Address
1
2
3
4
5
6
7
00002000
8
00002004
9
00002008
10
0000200C
11
12
13
14
15
00001000
16
00001004
17
00001008
18
0000100C
19
20
00001012
21
22
00001016
23
00001018
24
0000101C
25
26
0000101E
27
00001022
28
00001026
29
30
00001028
31
0000102E
32
00001032
33
as68k -Lh supprog.s
CHIP 68000
;SUPERVISOR SECTION
SECT DATA ,,D,D
ORG 2000H
0000
0000
0000
0000
0400
1000
00BC
0FF0
INPUT_POINTER
USER_LOCATION
TRAP_POINTER
STACK_POINTER
DC.L
DC.L
DC.L
DC.L
00000400H
00001000H
000000BCH
00000FF0H
SECT PROG,,C,P
ORG 1000H
2478
2E78
2C78
2CBC
2000
200C
2008
0000 1028
INIT
MOVE.L
MOVE.L
MOVE.L
MOVE.L
INPUT_POINTER,A2
STACK_POINTER,A7
TRAP_POINTER,A6
#RETURNTOSUP,(A6)
14BC 0000
CLEAR
MOVE.B #00H,(A2)
1012
0C00 0000
67F8
READ_INPUT
MOVE.B (A2),D0
CMP.B #00h,D0
BEQ READ_INPUT
2F38 2004
3F3C 0000
4E73
JUMPTOUSER
MOVE.L USER_LOCATION,-(A7)
MOVE.W #0000H,-(A7)
RTE
2F3C 0000 1012
3F3C 2000
4E73
RETURNTOSUP
MOVE.L #CLEAR,-(A7)
MOVE.W #2000H,-(A7)
RTE
END
Figure 3-1. Supervisor program listing.
The supervisor program declares the following pointers:
Pointer to the input area at location 400 hex.
First location of the user program (1000 hex).
3-2 Advanced Example
Trap pointer, which is the location of the trap vector used to
return to the supervisor state (0bc hex).
Supervisor stack pointer (0ff0 hex).
INIT
The initialization routine moves the input area pointer to a register for
future use in addressing the input port. The stack pointer register is
initialized. Then, the trap vector 0BC hex is loaded with the address of
the RETURNTOSUP routine.
CLEAR
The CLEAR routine prepares the program for input by initializing the
input port value to a null character (00 hexadecimal).
READ_INPUT
This routine continuously reads the input port until a non-zero value is
read, indicating the presence of a command value.
JUMPTOUSER
As soon as a non-zero value is read from the input port, the
JUMPTOUSER routine pushes onto the stack the location of the user
program and a status register value that indicates a user program state.
The RTE instruction is then executed, which loads the status register
and program counter with the values on the stack and begins execution
at the new program counter value. With the values just pushed on, the
processor will be executing in the user program after this routine
completes.
RETURNTOSUP
This routine is executed whenever the user program terminates by
executing a TRAP #0FH instruction. Specifically, when the user
program executes the TRAP #0FH, the address of RETURNTOSUP is
loaded into the program counter from the trap vector at 0BC hex, and
execution begins in the RETURNTOSUP routine. In the
RETURNTOSUP routine, the address of the CLEAR routine is pushed
Advanced Example 3-3
onto the stack, along with an appropriate status register value. The RTE
instruction is executed, causing the values pushed onto the stack to be
loaded into the status register and program counter. This causes
execution to continue in the CLEAR routine (described above).
User Program
The user program used in the following examples is shown in figure
3-2.
Command line: as68k -Lh usrprog.s
Line Address
1
CHIP 68000
2
3
;USER PROGRAM SECTION
4
5
SECT DATA,,D,D
6
ORG 2000H
7
8
00002000 0000 0500
OUTPUT_POINTER DC.L 00000500H
9
10
00002004 5448 4953 2049
MESSAGE_A
DC.B
’THIS IS MESSAGE A’
5320 4D45 5353
4147 4520 41
11
12
00002015 5448 4953 2049
MESSAGE_B
DC.B
’THIS IS MESSAGE B’
5320 4D45 5353
4147 4520 42
13
14
00002026 494E 5641 4C49
INVALID_INPUT DC.B
’INVALID COMMAND’
4420 434F 4D4D
414E 44
15
16
17
SECT PROG,,C,P
18
ORG 1000H
19
20
00001000 2678 2000
INIT
MOVE.L OUTPUT_POINTER,A3
21
22
00001004 0C00 0041
PROCESS_COMM CMP.B #41H,D0
23
00001008 6700 000E
BEQ COMMAND_A
24
0000100C 0C00 0042
CMP.B #42H,D0
25
00001010 6700 0014
BEQ COMMAND_B
26
00001014 6000 001E
BRA UNRECOGNIZED
27
28
00001018 103C 0011
COMMAND_A
MOVE.B #11H,D0
29
0000101C 207C 0000 2004
MOVE.L #MESSAGE_A,A0
30
00001022 6000 001A
BRA OUTPUT
Figure 3-2. User program listing.
3-4 Advanced Example
31
32
33
34
35
36
37
38
39
40
41
42
43
44
45
46
47
48
49
50
51
52
53
00001026 103C 0011
0000102A 207C 0000 2015
00001030 6000 000C
COMMAND_B
MOVE.B #11H,D0
MOVE.L #MESSAGE_B,A0
BRA OUTPUT
00001034 103C 000F
00001038 207C 0000 2026
UNRECOGNIZED
MOVE.B #0FH,D0
MOVE.L #INVALID_INPUT,A0
0000103E 224B
OUTPUT
MOVE.L A3,A1
00001040 123C 0020
00001044 2A4B
CLEAR_OLD
MOVE.B #20H,D1
MOVE.L A3,A5
00001046 1AFC 0000
0000104A 0441 0001
0000104E 66F6
CLEAR_LOOP
MOVE.B #00H,(A5)+
SUBI #01H,D1
BNE CLEAR_LOOP
00001050 12D8
00001052 0440 0001
00001056 66F8
LOOP
MOVE.B (A0)+,(A1)+
SUBI #01H,D0
BNE LOOP
00001058 4E4F
TRAPTOSUP
TRAP #0FH
END
Figure 3-2. User program listing (continued).
Variable Declaration
The user program declares one pointer, which is the pointer to the
output port base location at 500 hex. Three strings are also declared;
these are the messages that will be written to the output port whenever
a command input is processed.
INIT
This routine moves the output pointer value to an address register for
future use in the program.
PROCESS_COMM
When the routine arrives here, the non-zero value read into the input
port is still available in the D0 data register. PROCESS_COMM
performs a series of comparisons to determine whether the command in
register D0 is "A", "B" or an unrecognized command. Once this is
resolved, the routine branches to one of the setup routines to prepare
for message output.
Advanced Example 3-5
COMMAND_A, COMMAND_B, UNRECOGNIZED
One of these routines will be executed, depending on the comparisons
made in PROCESS_COMM. Each routine moves the length of the
appropriate message into the D0 register (which will be used as a
counter for the number of bytes to be moved). Also, each routine
moves the location of the appropriate message into the A0 register.
OUTPUT
This routine begins the output by first setting up some pointer values
and an output buffer length (20 hex, resident in D1). The
CLEAR_LOOP routine then writes null characters to all of the output
buffer locations. This insures that previous messages are erased from
the output buffer.
LOOP then performs byte moves using the values of the A0 (message
source pointer) and the A1 register (output buffer pointer) to determine
the locations of the source and destination. When all of the bytes have
been moved (indicated by the value of D0), the loop terminates.
TRAPTOSUP
When LOOP is complete, execution should return to the supervisor
program and resume reads of the input buffer. TRAPTOSUP does this
by simply executing a TRAP #0F instruction. The processor will fetch
the new execution address from the trap vector region, switch to the
supervisor state, and begin execution. (The specific return location is
the RETURNTOSUP routine in the supervisor module.)
Note
3-6 Advanced Example
This set of programs should not be construed as a complete example of
user/supervisor state switching for the 68302. It relies on simplicity,
and the fact that various pointer and data values are retained during the
state switch. In an actual programming example, you would probably
want to push the values of all registers onto a stack before making a
state switch, then recover those values after the switch.
Mapping Memory
For this example, you will need to specify more information in the
memory map to allow correct loading of the program. The information
required tells the memory mapper that a certain range resides within
supervisor memory space or user memory space. To map memory for
this program, type the following commands:
R> map -d *
R> map 100..0fff@d eram
R> map 1000..2fff@s erom
R> map 1000..2fff@u erom
The first command deletes all currently defined mapper terms.
The second command defines an emulation RAM data area (to be used
by either the supervisor or user program) from 100 to fff hexadecimal.
Notice that this data area was not placed at 0--supervisor writes in the
range 0 to ff could change the exception vector table and the SCR and
BAR registers.
The third and fourth commands define supervisor (@s) and user (@u)
program/data areas as emulation ROM from address 1000 to 2fff
hexadecimal. The emulation memory mapper can differentiate between
the supervisor and user address spaces. Now, whenever you specify
an address in the range 1000 to 2fff hex, you must also include the
function code; otherwise, the address will be ambiguous. Refer to
chapter 4 of this manual for further information on specifying function
codes as part of the memory map.
You will usually need to map an area of memory for the 68302’s
internal dual-port RAM. Be sure to map this space above the vector
table. Map this space as target RAM:
R> map 0fff000..0ffffff@s tram
To help you find accidental accesses to other parts of memory, map all
other addresses to guarded memory:
R> map other grd
You can specify even more detailed load information. For example,
you might wish to define 1000 to 1fff as a supervisor program space,
and 2000 to 2fff as a supervisor data space. To enter such a map, you
would type (do not type this right now):
R> map 1000..1fff@sp erom
R> map 2000..2fff@sd erom
Advanced Example 3-7
However, if you do this, the supervisor data and program modules will
need to be separated, modified (to declare symbols defined in one
module and used in the other as globals and externals, respectively),
linked, and loaded separately. The cf lfc
command specifies the function code area where each module is loaded.
Note
When memory ranges are overlaid using function code specifiers, you
need to have a separately linked module for each different function
code specifier. (This is because linkers do not typically understand
function codes and overlapping address errors would occur when
attempting to link modules to the same address range.)
When different address ranges are mapped with different function code
specifiers (no overlapping ranges), your program modules may exist in
one absolute file; however, you will have to use multiple load
commands - one for each function code specifier. This is necessary to
load the various sections of the absolute file into the appropriate
function code qualified mapper ranges. When you do this, be sure that
"other" is mapped as target RAM. (If "other" is mapped as guarded,
guarded memory access errors, from the attempt to load the absolute
file sections that are outside the function code specified range, can
prevent the absolute file sections that are inside the function code
specified range from being loaded.)
For details on all of the different possible function code specifiers, refer
to Appendix A, which contains syntax information specific to the
68302 emulator.
3-8 Advanced Example
Loading the
Sample Program
Assembly and
Linking
You are now ready to load the sample program. You must first
assemble and link it using the available host tools.
If you are using the transparent configuration, connect to your host by
typing:
xp -e
If you are using the HP 64870 68000 Assembler/ Linker/Librarian,
assemble and link using the following commands:
$ as68k -Lh userprog.s
$ as68k -Lh supprog.s
$ ld68k -c userprog.cmd -Lh
$ ld68k -c supprog.cmd -Lh
Use the following linker command files:
$ cat userprog.cmd
NAME userprog
LIST C,D,O,P,S,T,X
ORDER PROG,DATA
SECT DATA=1000H
SECT PROG=2000H
LOAD userprog.o
END
$ cat supprog.cmd
NAME supprog
LIST C,D,O,P,S,T,X
ORDER PROG,DATA,A5
SECT PROG=1000H
SECT DATA=2000H
SECT A5=2000H
LOAD supprog.o
END
$
Loading the Code
Now to load your files. The example in this chapter uses the HP
9000/HP-UX based transfer utility. You can use this method or any
that fits your situation; refer to Chapter 2 and the load command
information in the Reference for examples of other file load methods.
The important difference in this load procedure is that you need to
Advanced Example 3-9
properly configure the emulator so that each module will end up in the
proper supervisor or user space.
If you need to change directories to get to your program files, do so
now.
Otherwise, type:
<ESC>g xp -d
to return to the emulator command prompt.
Now, load the supervisor module by typing:
M> cf lfc=s
This command (configure load function code) tells the emulator that
subsequent load commands should load code into memory ranges
mapped as supervisor.
Now type:
M> load -hbo
transfer -tb supprog.X<ESC>g (do NOT press
return)
You will see:
##
M>
To load the user module, type the following:
M> cf lfc=u
This tells the emulator that subsequent load commands should load
code into memory ranges mapped as user space.
Type:
M> load -hbo
transfer -tb userprog.X<ESC>g (again, do NOT
press return)
You will see:
##
M>
3-10 Advanced Example
Your code is now loaded into memory and is ready to use. To log off
the host computer, type:
M> xp -e
Hit return until you see a prompt and type:
$ <CTRL>d
Now type:
<ESC>g xp -d
which will return you to the emulator command prompt.
Note
Building a
Command File
Note
If you see the message "hpuadownload in_HP64000_format," you
pressed <RETURN> after entering the transfer command. Repeat the
load and transfer commands exactly as shown above.
If you are using a computer with a terminal emulator, find out if the
terminal emulator has the ability to log displays to a disk file and
upload ASCII disk files to the datacomm port. If your terminal
emulator has this ability, you can easily build a command files to save a
considerable amount of time whenever you need to reload the
emulator’s code, data, or configuration information.
The HP 64700 Terminal Interface also supports command files from a
host in transparent mode using the po -f command. That command is
not described here; refer to the Reference for an example.
Now, follow the steps below to build a command file which will load
your emulator’s code by modifying memory.
First, you need to get the memory contents into a disk file so that you
can manipulate them. Enable the file logging capability of your
terminal emulator to create a file called comfile.txt. (If you need help
Advanced Example 3-11
with this function, refer to the manual for your terminal emulator.)
Then, type the following commands:
M> m -dl 2000..200f@s
0002000..000200f@s
00000400 00001000 000000bc 00000ff0
0001000..000100f@s
0001010..000101f@s
0001020..000102f@s
0001030..0001033@s
24782000 2e78200c 2c782008 2cbc0000
102814bc 00001012 0c000000 67f82f38
20043f3c 00004e73 2f3c0000 10123f3c
20004e73
M> m -dl 1000..1033@s
M> m -dl 2000..2034@u
0002000..000200f@u
0002010..000201f@u
0002020..000202f@u
0002030..0002037@u
00000500
41474520
53414745
4d4d414e
54484953 20495320 4d455353
41544849 53204953 204d4553
2042494e 56414c49 4420434f
44000000
0001000..000100f@u
0001010..000101f@u
0001020..000102f@u
0001030..000103f@u
0001040..000104f@u
0001050..000105b@u
26782000
67000014
20046000
6000000c
123c0020
12d80440
0c000041
6000001e
001a103c
103c000f
2a4b1afc
000166f8
M> m -dl 1000..1059@u
6700000e
103c0011
0011207c
207c0000
00000441
4e4f4e4f
0c000042
207c0000
00002015
2026224b
000166f6
Now you can close the disk log file. Your disk log file contains the
code for the supervisor data, supervisor program, user data, and user
program regions. Note that to enter the proper address ranges, you will
need to know the starting and ending addresses of each block you want
to manipulate. Your linker output listing should contain this
information.
You will need to edit the disk file so that all of the memory dump
information is actually expressed as a memory modification command.
Use an ASCII text editor (or a word processor with ASCII
import/export capability) to create the file shown below from the file
comfile.txt.
m
m
m
m
m
m
m
m
m
m
m
m
m
m
m
-dl
-dl
-dl
-dl
-dl
-dl
-dl
-dl
-dl
-dl
-dl
-dl
-dl
-dl
-dl
0002000..000200f@s=00000400,00001000,000000bc,00000ff0
0001000..000100f@s=24782000,2e78200c,2c782008,2cbc0000
0001010..000101f@s=102814bc,00001012,0c000000,67f82f38
0001020..000102f@s=20043f3c,00004e73,2f3c0000,10123f3c
0001030..0001033@s=20004e73
0002000..000200f@u=00000500,54484953,20495320,4d455353
0002010..000201f@u=41474520,41544849,53204953,204d4553
0002020..000202f@u=53414745,2042494e,56414c49,4420434f
0002030..0002037@u=4d4d414e,44000000
0001000..000100f@u=26782000,0c000041,6700000e,0c000042
0001010..000101f@u=67000014,6000001e,103c0011,207c0000
0001020..000102f@u=20046000,001a103c,0011207c,00002015
0001030..000103f@u=6000000c,103c000f,207c0000,2026224b
0001040..000104f@u=123c0020,2a4b1afc,00000441,000166f6
0001050..000105b@u=12d80440,000166f8,4e4f4e4f
3-12 Advanced Example
Notice that you do not have to modify the "load function code"
configuration item. This method is completely different than loading
memory with the load command. Instead, the function code is
explicitly specified in memory modification commands.
Now you can execute your command file. Make sure that the emulator
is running in the monitor ("M>" prompt), or is running. To get to the
monitor, type b.
Note
If the emulator is reset, it will not be able to display or modify target
system memory. Although that does not affect this particular example,
you should keep this information in mind when you build command
files which access target system memory.
To load your command file, simply use the ASCII upload feature of
your terminal emulator and specify comfile.txt as the file to upload.
You will see each line read in by the emulator and executed as a
command.
You can do this with virtually any command that prints the current
settings when executed. The output of many commands, such as map
and tpat, can be used in a command file without any modification.
You can avoid error messages by using the appropriate "clear"
command at the beginning of a command file. For example, if your
command file contains map commands, include the command map -d
* to delete any existing mapper terms.
Again, you can use your terminal emulator’s ASCII upload facilities to
load this file into the emulator.
To build a command file to completely configure your emulator, you
would simply enable disk logging as you start configuration and turn it
off when you’re finished. Then you can edit the command file.
However, be sure to completely understand the procedure you will use;
otherwise, you might spend a lot of time editing a command file
because of logged mistakes.
Advanced Example 3-13
Note
Set Mode and
Stack Pointer
We strongly recommend that you use your terminal emulator’s logging
feature to record the commands you enter in the example which
follows. Doing so will save you a lot of work if for any reason you
need to start over.
Set the memory display mode to byte to avoid problems later in the
examples:
M> mo -db
Also, the supervisor stack pointer must be modified to be able to run
the emulator. Type:
M> rst
R> cf rssp=00000ff0
R> b
Now the supervisor stack pointer will be initialized to the value
00000ff0 hex.
You could also modify the supervisor stack pointer as follows:
M> reg ssp=0ff0
This modifies the supervisor stack pointer register directly to the value
00000ff0. However, by using the cf rssp command, you will
automatically set the stack pointer every time the emulator enters the
monitor from an emulation reset.
Complex
Configuration
Trace Example
3-14 Advanced Example
This example will make a more sophisticated trace measurement using
the analyzer’s complex configuration capabilities. In this example, the
sequencer will be used to look for execution of several of the routines
in the two programs and to trigger the analyzer finding the last routine.
The analyzer will be set up so that execution between certain states is
stored until the trace list is filled.
This example will be using several different analyzer and emulator
commands to make a complete measurement. This is intended to give
you a complete context for the use of each command, rather than
presenting the commands independently.
Note
This example will not explain all of the analyzer’s sequencer
capabilities. Instead, refer to the Analyzer User’s Guide for a complete
tutorial on analyzer operation.
When setting up complex analyzer measurements, you will generally
use the following procedure to draw a sequencer diagram.
First, draw a sequencer diagram which shows all eight of the
analyzer sequencer terms.
Next, fill in the primary and secondary branch qualifiers.
Finally, write down the analyzer storage qualifiers for each
sequencer level.
With the completed diagram, you can set up the analyzer measurement
quickly and accurately.
In the sequencer diagram shown in figure 3-3, several branches and
store conditions are set up.
The analyzer always enters the sequencer at term 1.
It will branch from term 1 to term 2 when data of any value except zero
is read from the INPUT_POINTER location while in the supervisor
state. Notice that the expression is additionally qualified with the
supervisor data status. This is done because the analyzer does not
allow you to specify function codes in addresses; the additional status
qualifier makes sure that the sequencer searches for the supervisor
access to the INPUT_POINTER location and not a user access. No
states are stored before or after the branch; however, any expression
Advanced Example 3-15
Figure 3-3. Sequencer Diagram.
which satisfies a branch will always store, regardless of the storage
qualifier.
A branch from term 2 to term 3 will happen when the analyzer sees
execution of the JUMPTOUSER routine. Notice that the address is
qualified with a status of supervisor program space. Again, no states
are stored except the branch condition.
A branch from term 3 to term 4 will happen when the analyzer sees
execution of the PROCESSCOMM routine. The address is qualified
with a status of user program space. After the branch, the analyzer will
store all states in the range 500 through 511 hex with data not equal to
zero. (The sequencer will specifically look for the message writes to
the output area.)
A branch from term 4 to term 5 occurs when the analyzer sees the
TRAPTOSUP routine. Now all states are stored because the trace
should contain the states that show the processor pick up the exception
vector information.
3-16 Advanced Example
A branch from term 5 to term 6 (the trigger term) happens when the
analyzer sees the execution of the RETURNTOSUP routine. No states
are stored.
Finally, the sequencer branches back to term 2 when a non-zero value
is read from the input port by the supervisor program. The sequencer
process is repeated from this point onward.
Terms 7 and 8 are not used in this example. Also, there are no
secondary branch conditions, so they are left at the default of telif never.
Defining Equates
Use the equ command to assign names to specific patterns. This
should aid you in setting up the analyzer specification. First, look at
the default equate list. Type:
M> equ
You can see that several "equates" have been predefined. This occurred
during emulator initialization. These equates allow you to specify
various processor status qualifiers without having to remember the
specific bit patterns associated with each status. For example, you can
specify a status qualifier of "supervisor program" with stat=supprog.
Now set up the equates for the input port address, the program routine
names, and a "null data" value of 00 hex. Type:
M> equ inputpointer=400
M> equ nulldata=00
M> equ jumptouser=101e
Verify the new equates by typing:
M> equ
Symbols are can be used like equates for addresses, but they also are
shown by name in the trace listings.
M> sym processcomm=1004@u
M> sym traptosup=1058@u
M> sym returntosup=1028@s
Verify the symbols by typing:
M> sym
Advanced Example 3-17
Set the Analyzer to
Complex
Configuration
Before you set up the analyzer qualifiers, you need to set the analyzer
to the complex configuration. Type:
M> tcf -c
(For specific information on the capabilities of the analyzer’s complex
configuration, refer to the Analyzer User’s Guide and the Reference
manuals.)
Define a New
Analyzer Signal Label
Now you need to set up an analyzer label for the lower byte of the data
bus. Type:
M> tlb lowerdata 40..47
This enables you to qualify byte operations (such as the input port read
or the output port writes) without concern about what the patterns are
on the upper byte of the bus.
Assign Analyzer
Patterns to
Expressions
Now, since the analyzer is in complex configuration, you need to
assign pattern numbers to the specific analyzer expressions you want to
use for branching. (The complex configuration does not allow you to
specify these expressions directly in the branch (tif command); instead,
you assign pattern names to expressions, then use the pattern names in
the tif command to form more complex expressions.) Type:
M> tpat p1 addr=inputpointer and stat=supdata
M> tpat p2 addr=jumptouser and stat=supprog
M> tpat p3 addr=processcomm and stat=userprog
M> tpat p4 addr=traptosup and stat=userprog
M> tpat p5 addr=returntosup and stat=supprog
Use the range variable to qualify storage of data written to the output
area. Assign a range to this variable using the trng command. Type:
M> trng addr=500..511
Finally, one pattern is needed that has data not equal to zero. Set this
pattern not equal to the nulldata equate defined earlier. Type:
M> tpat p6 lowerdata!=nulldata
You can verify all of the pattern assignments by typing:
M> tpat
3-18 Advanced Example
tpat
tpat
tpat
tpat
tpat
tpat
tpat
tpat
p1
p2
p3
p4
p5
p6
p7
p8
addr=inputpointer and stat=supdata
addr=jumptouser and stat=supprog
addr=processcomm and stat=userprog
addr=traptosup and stat=userprog
addr=returntosup and stat=supprog
lowerdata!=nulldata
any
any
Set the Primary
Branch Qualifiers
Now you can set up the primary branch qualifiers which specify how
the analyzer sequencer will branch from term to term when certain
expressions are found. Type:
M> tif 1 p1 and p6 2
M> tif 2 p2 3
M> tif 3 p3 4
M> tif 4 p4 5
M> tif 5 p5 6
M> tif 6 p1 and p6 2
Now you can specify the trigger term. Type:
M> tsq -t 6
You can check all of the primary branch qualifiers by typing:
M> tif
tif
tif
tif
tif
tif
tif
tif
tif
1
2
3
4
5
6
7
8
p1 and p6 2
p2 3
p3 4
p4 5
p5 6
p1 and p6 2
any 8
never
Specifying What to
Store
As you can see from the sequencer diagram, you only want to store
certain items depending on the state of the sequencer. The analyzer’s
complex configuration allows you to specify different storage qualifiers
for each trigger state. Since nothing is to be stored for the majority of
the sequencer terms, you can use one command to set all storage
qualifiers to none. Then, you can redefine the storage qualifiers for the
individual terms during which trace states are to be stored. For
example, type:
M> tsto none
View this by typing:
M> tsto
Advanced Example 3-19
tsto
tsto
tsto
tsto
tsto
tsto
tsto
tsto
1
2
3
4
5
6
7
8
none
none
none
none
none
none
none
none
Now you can set the storage qualifiers for the terms that need to
change. Type:
M> tsto 4 r and p6
M> tsto 5 all
Check the storage qualifier changes:
M> tsto
tsto
tsto
tsto
tsto
tsto
tsto
tsto
tsto
1
2
3
4
5
6
7
8
none
none
none
r and p6
all
none
none
none
Counting the Output
Writes
Set the Trace Display
Format
You can set the analyzer’s trace tag counter to count the number of
writes to the output area. Since a range variable was defined for the
storage qualifier, you can use this to count the number of writes to the
output range. Type:
M> tcq r
To display the trace with address and mnemonic information, along
with the data (output writes), in ASCII format, and the output write
count, type:
M> tf addr,h mne lowerdata,A count,A
The trace list display will have address displayed in hex, data
disassembled into 68302 mnemonic instructions, the lower byte of the
data bus displayed in ASCII, and the state count displayed absolute
(relative to the beginning of the trace rather than the previous state).
Make the
Measurement
3-20 Advanced Example
Now you can make the measurement. First, start the trace by typing:
M> t
Emulation trace started
Then, start the emulation run:
M> r 1000@s
Notice that you need to specify the function code specifier since two
different function code ranges (user and supervisor) share the same
numeric addresses.
Note
If you see any error messages at this point, check that you entered all of
the code, data, equates, and analyzer expressions correctly.
You will need to provide some input to the input port; otherwise, the
analyzer will never trigger (because the sequencer will never pass term
1). Type:
U> m 400@d=41
U> m 400@d=42
U> m 400@d=43
This puts an "A" command, a "B" command, and an unrecognized
command into the input port. Now display the trace list:
U> tl -etd 30
Advanced Example 3-21
Line
----0
1
2
3
4
5
6
7
8
9
10
11
12
13
14
15
16
17
18
19
20
21
22
23
24
25
26
27
28
29
addr,H
-----000400
00101e
sscomm
000500
ptosup
001050
001052
002005
000501
001054
001056
ptosup
001050
001052
002006
000502
001054
001056
ptosup
001050
001052
002007
000503
001054
001056
ptosup
001050
001052
002008
000504
68302 Mnemonic,H
----------------------------------41
sdata rd byte
MOVE.L ******,-[A7]
ROM
CMPI.B #**,D0
ROM
54
udata wr byte
TRAP
#f
ROM
MOVE.B [A0]+,[A1]+
ROM
SUBI.W #00001,D0
ROM
48 udata rd byte
ROM
48 udata wr byte
0001 uprog rd word
ROM
BNE.B
0001050
ROM
TRAP
#f
ROM
MOVE.B [A0]+,[A1]+
ROM
SUBI.W #00001,D0
ROM
49
udata rd byte
ROM
49
udata wr byte
0001 uprog rd word
ROM
BNE.B
0001050
ROM
TRAP
#f
ROM
MOVE.B [A0]+,[A1]+
ROM
SUBI.W #00001,D0
ROM
53 udata rd byte
ROM
53 udata wr byte
0001 uprog rd word
ROM
BNE.B
0001050
ROM
TRAP
#f
ROM
MOVE.B [A0]+,[A1]+
ROM
SUBI.W #00001,D0
ROM
20
udata rd byte
ROM
20
udata wr byte
lowerdata,A
----------A
/
.
T
N
.
.
.
H
.
f
N
.
.
I
I
.
f
N
.
.
.
S
.
f
N
.
.
.
.
count,A
--------0
0
0
19
19
19
19
19
20
20
20
20
20
20
20
21
21
21
21
21
21
21
22
22
22
22
22
22
22
23
This isn’t what you would expect to see. (You expect to see the
lowerdata column with unbroken strings of each message, and you also
expect to see the TRAP vector pickup.) If you look carefully at the
trace listing, you will see that the TRAP #f instruction is repeated
several times, but the processor keeps repeating instructions from the
LOOP routine in the program and doesn’t switch states to supervisor
when the TRAP is encountered.
The reason for the repeated TRAP instruction is the prefetch feature of
the 68302 processor. The processor is continually prefetching the
TRAP #f instruction, but not executing it because of the BNE.B back to
location 1050 hex. The reason this instruction keeps appearing in the
trace list is because the HP 64700’s emulation analyzer does not
provide "de-queuing" of the instruction pipeline; that is, it records all
instructions that appear on the bus and cannot differentiate between a
prefetched instruction and one which was actually executed. Many
more states are stored than expected, because the first prefetch of the
TRAP #f instruction causes the sequencer to increment to term 5,
which has a storage qualifier of tsto all. So, as a result of the prefetch,
3-22 Advanced Example
many side effects have occurred which present a different trace list than
expected.
One of the easiest ways to fix this problem, at least during the
debugging and integration stages of your project, is to insert a NOP
instruction at the end of each routine in your code. Then, if you set up
the sequencer branch for the first instruction of the next routine, the
NOP is the instruction prefetched at the end of the previous routine and
therefore won’t cause a sequencer branch (unless, of course, you set up
the sequencer to branch on the NOP or its address in memory). To do
this with the sample program, first display the end of the user program
routine:
U> m 1050..1059@u
0001050..0001059@u
12 d8 04 40 00 01 66 f8 4e 4f
Now, insert a NOP instruction where the TRAP #f is and move TRAP
#f to the next higher memory location. (NOP is 4e71 hex; TRAP #f is
4e4f hex.)
U> m -dw traptosup=4e71,4e4f
Now verify the change:
U> m -db 1050..105b@u
0001050..000105b@u
12 d8 04 40 00 01 66 f8 4e 71 4e 4f
You need to modify the traptosup symbol to reflect the new location of
the TRAPTOSUP routine. Type:
U> sym traptosup=105a
You must also reenter the commands where the symbol is used! This is
because an equate is translated at the time of command entry, rather
than at the time of measurement.
U> tpat p4
tpat p4 addr=traptosup and stat=userprog
U> tpat p4 addr=traptosup and stat=userprog
Repeat the measurement:
U> t
Advanced Example 3-23
Emulation trace started
U>
U>
U>
U>
Line
-----1
0
1
2
3
4
5
6
7
8
9
10
11
12
13
14
15
16
17
18
19
20
21
22
23
24
25
26
27
28
addr,H
-----0000be
ntosup
000400
00101e
sscomm
000500
000501
000502
000503
000504
000505
000506
000507
000508
000509
00050a
00050b
00050c
00050d
00050e
00050f
000510
ptosup
00105c
000fd6
000fd2
000fd4
0000bc
0000be
ntosup
m 400@d=41
m 400@d=42
m 400@d=43
tl -etd 30
68302 Mnemonic,H
----------------------------------1028 sdata rd word
MOVE.L #********,-[A7]
ROM
42
sdata rd byte
MOVE.L ******,-[A7]
ROM
CMPI.B #**,D0
ROM
54
udata wr byte
48 udata wr byte
49
udata wr byte
53 udata wr byte
20
udata wr byte
49 udata wr byte
53
udata wr byte
20 udata wr byte
4d
udata wr byte
45 udata wr byte
53
udata wr byte
53 udata wr byte
41
udata wr byte
47 udata wr byte
45
udata wr byte
20 udata wr byte
42
udata wr byte
TRAP
#f
ROM
07e1 unused prefetch
ROM
105c sdata wr word
0004 sdata wr word
0000 sdata wr word
0000 sdata rd word
1028 sdata rd word
MOVE.L #********,-[A7]
ROM
lowerdata,A
----------.
/
B
/
.
T
H
I
S
.
I
S
.
M
E
S
S
A
G
E
.
B
N
.
.
.
.
.
.
/
count,A
--------0
0
0
0
0
19
20
21
22
23
24
25
26
27
28
29
30
31
32
33
34
35
35
35
35
35
35
35
35
35
Now the desired states seem to have been captured, including the
pickup of the TRAP vector from 0bc hex (states 26 and 27 in the trace
list). However, the message written from the first command entry
("MESSAGE A") is missing. The sequencer trigger was actually the
last term in the sequence (term 6); and since the trigger position in the
trace list was the first state in trace memory, states occurring previous
to the trigger were discarded. You can modify the trigger position in
memory and run another trace so these states will be retained.
3-24 Advanced Example
Type:
U> tp -b 30
U> t
Emulation trace started
U> m 400@d=41
Are you getting tired of typing this information over and over? Use
command line editing to enter the data this time:
cl -e
Now type <ESC> k k to see the line you just entered. Type $ to move
the cursor to the end of the line. Type r2 to replace the 1 with a 2:
U> m 400@d=42
Press <RETURN> to enter that line. Type <ESC> k $ r 3 to get:
U> m 400@d=43
Now type:
U> tl -etd
Line
-----27
-26
-25
-24
-23
-22
-21
-20
-19
-18
-17
-16
-15
-14
-13
-12
-11
-10
-9
-8
-7
-6
-5
-4
-3
-2
-1
0
addr,H
-----000400
00101e
sscomm
000500
000501
000502
000503
000504
000505
000506
000507
000508
000509
00050a
00050b
00050c
00050d
00050e
00050f
000510
ptosup
00105c
000fca
000fc6
000fc8
0000bc
0000be
ntosup
68302 Mnemonic,H
----------------------------------41
sdata rd byte
MOVE.L ******,-[A7]
ROM
CMPI.B #**,D0
ROM
54
udata wr byte
48 udata wr byte
49
udata wr byte
53 udata wr byte
20
udata wr byte
49 udata wr byte
53
udata wr byte
20 udata wr byte
4d
udata wr byte
45 udata wr byte
53
udata wr byte
53 udata wr byte
41
udata wr byte
47 udata wr byte
45
udata wr byte
20 udata wr byte
41
udata wr byte
TRAP
#f
ROM
07e1 unused prefetch
ROM
105c sdata wr word
0004 sdata wr word
0000 sdata wr word
0000 sdata rd word
1028 sdata rd word
MOVE.L #********,-[A7]
ROM
lowerdata,A
----------A
/
.
T
H
I
S
.
I
S
.
M
E
S
S
A
G
E
.
A
N
.
.
.
.
.
.
/
1
2
000400
00101e
42
MOVE.L
B
/
sdata rd byte
******,-[A7]
ROM
count,A
---------35
-35
-35
-16
-15
-14
-13
-12
-11
-10
-9
-8
-7
-6
-5
-4
-3
-2
-1
0
0
0
0
0
0
0
0
0
0
0
Advanced Example 3-25
Now you see the first message; but, you don’t have the entire message
set.
To see the full symbol name in the "addr" column of the trace display,
change the trace format by typing:
U> tf addr,h,14 mne lowerdata,A
This increases the width of the address column, and eliminates the
count column to make room on an 80-column display.
Display a greater range of the trace list by typing:
U> tl -ed -30..100
Line
-----28
-27
-26
-25
-24
-23
-22
-21
-20
-19
-18
-17
-16
-15
-14
-13
-12
-11
-10
-9
-8
-7
-6
-5
-4
-3
-2
-1
0
1
2
3
4
5
6
7
8
9
10
11
12
13
14
addr,H
--------------
68302 Mnemonic,H
-----------------------------------
lowerdata,A
-----------
000400
00101e
processcomm
000500
000501
000502
000503
000504
000505
000506
000507
000508
000509
00050a
00050b
00050c
00050d
00050e
00050f
000510
traptosup
00105c
000fca
000fc6
000fc8
0000bc
0000be
returntosup
000400
00101e
processcomm
000500
000501
000502
000503
000504
000505
000506
000507
000508
000509
00050a
41
MOVE.L
CMPI.B
54
48
49
53
20
49
53
20
4d
45
53
53
41
47
45
20
41
TRAP
07e1
105c
0004
0000
0000
1028
MOVE.L
42
MOVE.L
CMPI.B
54
48
49
53
20
49
53
20
4d
45
53
A
/
.
T
H
I
S
.
I
S
.
M
E
S
S
A
G
E
.
A
N
.
.
.
.
.
.
/
B
/
.
T
H
I
S
.
I
S
.
M
E
S
3-26 Advanced Example
sdata rd byte
******,-[A7]
#**,D0
udata wr byte
udata wr byte
udata wr byte
udata wr byte
udata wr byte
udata wr byte
udata wr byte
udata wr byte
udata wr byte
udata wr byte
udata wr byte
udata wr byte
udata wr byte
udata wr byte
udata wr byte
udata wr byte
udata wr byte
#f
unused prefetch
sdata wr word
sdata wr word
sdata wr word
sdata rd word
sdata rd word
#********,-[A7]
sdata rd byte
******,-[A7]
#**,D0
udata wr byte
udata wr byte
udata wr byte
udata wr byte
udata wr byte
udata wr byte
udata wr byte
udata wr byte
udata wr byte
udata wr byte
udata wr byte
ROM
ROM
ROM
ROM
ROM
ROM
ROM
15
16
17
18
19
20
21
22
23
24
25
26
27
28
29
30
31
32
33
34
35
36
37
38
39
40
41
42
43
44
45
46
47
48
49
50
51
52
53
54
55
00050b
00050c
00050d
00050e
00050f
000510
traptosup
00105c
000fc4
000fc0
000fc2
0000bc
0000be
returntosup
000400
00101e
processcomm
000500
000501
000502
000503
000504
000505
000506
000507
000508
000509
00050a
00050b
00050c
00050d
00050e
traptosup
00105c
000fbe
000fba
000fbc
0000bc
0000be
returntosup
53
41
47
45
20
42
TRAP
07e1
105c
0004
0000
0000
1028
MOVE.L
43
MOVE.L
CMPI.B
49
4e
56
41
4c
49
44
20
43
4f
4d
4d
41
4e
44
TRAP
07e1
105c
0004
0000
0000
1028
MOVE.L
udata wr byte
udata wr byte
udata wr byte
udata wr byte
udata wr byte
udata wr byte
#f
unused prefetch
sdata wr word
sdata wr word
sdata wr word
sdata rd word
sdata rd word
#********,-[A7]
sdata rd byte
******,-[A7]
#**,D0
udata wr byte
udata wr byte
udata wr byte
udata wr byte
udata wr byte
udata wr byte
udata wr byte
udata wr byte
udata wr byte
udata wr byte
udata wr byte
udata wr byte
udata wr byte
udata wr byte
udata wr byte
#f
unused prefetch
sdata wr word
sdata wr word
sdata wr word
sdata rd word
sdata rd word
#********,-[A7]
ROM
ROM
ROM
ROM
ROM
ROM
ROM
ROM
S
A
G
E
.
B
N
.
.
.
.
.
.
/
C
/
.
I
N
V
A
L
I
D
.
C
O
M
M
A
N
D
N
.
.
.
.
.
.
/
Even though you asked for display of states -30 through 100 in the
trace list, only states -28 through 54 were displayed, because the
analyzer has not captured any more data satisfying the storage
specifications. You can try modifying location 400 in the data space
with several values; display the trace after each modify. The trace
display memory will fill up with additional states every time the
complete sequencer branch specification is satisfied.
Refer to the Analyzer User’s Guide for more information regarding
analyzer measurements.
Advanced Example 3-27
Setting up an
Automatic Break
to Monitor
Break on
Measurement
Complete
By using the bc command, you can set the emulator to break to the
monitor upon finding certain conditions, such as a write to ROM, a
software breakpoint, or a specific condition found by the analyzer.
Suppose you have found that the first value input to the input port is
handled correctly by the sample program, but the next value input
causes the program to "run away" and destroy memory. You can
modify the measurement set up from the complex configuration trace
example to capture only one trace, then break the emulator to monitor
so that memory contents are not destroyed by the runaway program.
(Note: the program does not actually have such a bug; assume it might
for purposes of this example.)
First, set up the analyzer to drive the trig1 signal (internal to the HP
64700 emulator) upon finding the trigger condition:
U> tgout trig1
Now, set the emulator break conditions such that the emulator will
break to monitor upon receiving the trig1 signal:
U> bc -e trig1
Start the measurement:
U> t
Emulation trace started
U> r 1000@s
U> m 400@d=41
!ASYNC_STAT
618! trig1 break
M>
The analyzer finds the trigger condition and asserts the trig1 signal; the
emulator then recognizes that the break condition is true and breaks the
emulator to monitor execution.
You may also have the emulator break upon receiving the trig2 signal,
a trigger signal from the CMB (Coordinated Measurement Bus), or the
BNC trigger line (allowing you to break the emulator when an external
instrument finds its trigger condition.) Refer to the HP 64700
Terminal Interface Reference and the CMB User’s Guide for more
3-28 Advanced Example
information on using the various trigger signals to break emulator
execution.
Setting a Software
Breakpoint
Another way to stop program execution is to set a software breakpoint.
Using the bc and bp commands, you can insert TRAP instructions into
your code and have the emulator break to the monitor upon execution
of the inserted TRAP. Selection of one of the 16 different TRAP
instructions for insertion is managed by the cf swtp command; see
Chapter 4 of this manual. Once the breakpoint is found, you can
examine memory locations, registers, and so on, without worry that
further program execution will destroy the state of the machine.
First, you must enable the software breakpoint feature:
M> bc -e bp
Now, insert a breakpoint at the location of the RETURNTOSUP
routine in the supervisor program:
M> bp returntosup
The emulator controller saves the state of the instruction at location
1028 (returntosup) and overwrites the information there with a TRAP
instruction. Now, start the program run:
M> r 1000@s
U> m 400@d=41
!ASYNC_STAT
615! Software breakpoint: 0001028@sp
M>
When the breakpoint is executed, the status message shown above is
displayed. At this time, the emulator restores the original contents of
the breakpoint location and disables the breakpoint in the breakpoint
list. You can reenable the breakpoint using the command bp -e
returntosup. Refer to the Reference manual for further information on
software breakpoints.
Advanced Example 3-29
Note
Write to ROM
Prefetching and
Effect on Break
Conditions
Step, Register
Display, and
Memory Display
Example
3-30 Advanced Example
In the 68302 emulator, all read accesses to the software breakpoint
TRAP vector location preceded by a supervisor data write will cause
the emulator to break into background. However, only the read
associated with the TRAP instruction will cause a proper transfer to
monitor. All other accesses will result in undefined execution.
Therefore, if software breakpoints are enabled, the TRAP vector should
not be accessed by any instruction other than a TRAP. Note that this
includes boot-up code that attempts to perform a checksum over the
vector table area. The status of the emulator may become undefined,
and the monitor program may become unusable.
You can also have the emulator break to the monitor upon attempts to
write to memory space mapped as ROM. Simply enter the command
bc -e rom. All current HP 64700 emulators will prevent the processor
from actually writing to memory mapped as emulation ROM; however,
they cannot prevent writes to target system RAM locations which are
mapped as ROM, even though the write to ROM break is enabled.
Since the 68302 emulator prefetches instructions, it is possible that an
additional instruction may execute after the one which originally
caused the break condition. If this does occur, the additional
instruction was already in the processor’s instruction pipeline; the
emulator has no way of aborting the execution of that instruction.
Suppose you would like to set up a measurement that displays
information for each execution of the sample program’s LOOP routine.
You want to step through the routine so that each pass of the loop is
executed, then the processor’s registers are displayed, and the output
buffer area is displayed. You also want to label each display, and you
do not want the display to scroll.
Note
Defining Macros
This example assumes that you are using an HP 2392A data terminal or
any HP data terminal which uses equivalent control escape sequences.
If you are not using such a terminal, you can modify the escape
sequences in the example to work with your terminal. Refer to the
reference manual for your data terminal.
To set up this measurement, you’ll define several different macros, then
assemble them into one macro which runs the entire measurement and
display sequence. The mac command allows you to assemble several
HP 64700 commands under one name and store them away for later
execution.
The first macro you define will set up initial conditions for the looping
sequence by inserting a breakpoint at the LOOP routine location, then
running the processor to that breakpoint by supplying a "command" to
the input area. Type:
M> mac runtoloop={bc -e bp;bp 1050@u;r
1000@s;m 400@d=41}
You must also define an equate which predefines a value used for
numbering iterations through the LOOP routine on the output display:
M> mac defcount={equ loopcount=0}
Using Echo to Send
Escape Sequences to
a Terminal
Before you display the first measurement, you want to clear the
terminal screen. Type:
M> mac clrscreen={echo \1b "H" \1b "J"}
This macro will echo the sequence <ESC>H<ESC>J to the terminal,
which will home the cursor and clear display memory.
You can echo any hex character between 0 and 255 decimal by using
\nn, where nn is the hex representation of that character. Any printing
ASCII characters can be echoed by enclosing them in single or double
quote marks.
Advanced Example 3-31
Using the Step
Command
The step command allows you to step the emulation processor through
individual instructions or groups of instructions.
Now, define a macro which steps the processor through the loop. Since
there are three instructions in the loop, use 3 as the step count for the s
(step) command. Type:
M> mac steploop={s 3 1050@u}
The step count is always the value immediately after the command. If
no other parameters are specified, the processor is stepped from the
current program counter value. In this case, you want to step from the
beginning of the loop routine, so supply that address as the second
parameter.
Note
Displaying Memory
You need to be careful not to confuse the step count and the step
address; if you happen to supply an address as a step count, the
emulator will attempt to step through that many instructions.
One of the things you want is a display of the output memory area. Set
this up as follows:
M> mac dispoutput={m -db 500..51f@d}
Now you can set up the full combination of displays. You want the
step display at the top of the screen, the register display in the middle,
and the output area display at the bottom. Set up the step display as
follows:
M> mac dispstep={echo \1b "H";echo "LOOP # "
loopcount;equ loopcount=loopcount+1;
steploop}
The dispstep macro homes the cursor, then echoes the words "LOOP #
" along with the current value of the loopcount (defined by defcount as
zero). Then, the loopcount is incremented, and you step through the
loop.
3-32 Advanced Example
Displaying Registers
You can display processor registers in groups or individually. You
want to display the entire register set, so use the reg command without
any parameters.
To define the register display, type:
M> mac dispreg={echo \1b "&a8r0C";echo
"PROCESSOR REGISTERS";reg}
Here, the cursor is moved to row 8, column 0 of the display. The
words "PROCESSOR REGISTERS" are echoed on the display; then,
the register set is displayed.
To define the memory display, type:
M> mac dispmem={echo \1b "&a16r0C";echo
"OUTPUT PORT DISPLAY";dispoutput}
With this macro, the cursor is moved to row 16, column 0; the words
"OUTPUT PORT DISPLAY" are echoed to the display; then the
memory is displayed.
Now, you need a macro to assemble these into one. Type:
M> mac runit={runtoloop; defcount;
clrscreen;rep 17 {dispstep;dispreg; dispmem}}
The initial loop counter value is defined, then the screen is cleared.
Next, the step/register/memory display sequence is repeated 17 times
(which happens to be the number of bytes written by the loop).
Verify all of the macros by typing:
M> mac
mac runtoloop={bc -e bp;bp 1050@u;r 1000@s;m 400@d=41}
mac defcount={equ loopcount=0}
mac clrscreen={echo \1b "H" \1b "J"}
mac steploop={s 3 1050@u}
mac dispoutput={m -db 500..51f@d}
mac dispstep={echo \1b "H";echo "LOOP # " loopcount; equ loopcount=loopcount+1;
steploop}
mac dispreg={echo \1b "&a8r0C";echo "PROCESSOR REGISTERS";reg}
mac dispmem={echo \1b "&a16r0C";echo "OUTPUT PORT DISPLAY";dispoutput}
mac runit={defcount;clrscreen;rep 17 {dispstep;dispreg;dispmem}}
Your macros should match the ones defined here (unless you needed to
modify the escape sequences to work with a terminal incompatible with
the HP 2392A).
To run the macros, type:
Advanced Example 3-33
M>runtoloop
# bc -e bp ; bp 1050@u ; r 1000@s ; m
400@d=41
!ASYNC_STAT 615! Software breakpoint:
0001050@up
M>runit
As the macros execute, you can watch the processor instruction steps,
the changing register values, and the changing output memory region.
Searching
Memory for
Strings or
Numeric
Expressions
The HP 64700 emulator provides you with tools that allow you to
search memory for data strings or numeric expressions. For example,
you might want to know exactly where a string is located, so that you
can define an equate pointing to that string. To locate the position of
the string "THIS IS MESSAGE A" in the user data area of the sample
program, type:
M> ser 1000..2fff@u="THIS IS MESSAGE A"
pattern match at address: 0002004@u
You can also find numeric expressions. For example, you might want
to find all of the TRAP instructions in the user code. Since a TRAP
instruction begins with 4e hex, you can search for that value:
M> ser -db 1000..105b@u=4e
pattern match at address: 0001050@u
pattern match at address: 0001058@u
pattern match at address: 000105a@u
(Note: this search assumes that all of the breakpoints inserted during
the tutorials in this chapter were enabled with bp -e *.)
You can then use the memory display to narrow down the selection:
M> m 1050..105f@u
0001050..000105f@u
4e 40 04 40 00 01 66 f8 4e 71 4e 4f 00 00 00 00
3-34 Advanced Example
Two TRAP instructions are here; one at location 1050 hex, the other at
location 105a hex. The instruction at location 1058 hex is actually a
NOP.
What Next?
For more tutorial information:
On the analyzer, refer to the Analyzer User’s Guide.
On coordinated measurements using the CMB, refer to the
CMB User’s Guide.
For reference information, with examples showing command context,
refer to the Reference manual.
Advanced Example 3-35
Notes
3-36 Advanced Example
4
Configuring the Emulator
This chapter shows how you can configure the HP 64746 MC68302
emulator for your particular measurement needs.
Emulation
Commands
Configuration
Commands
Commands Used to
Make a Measurement
Emulator commands fall into several groups. To fully understand the
emulator configuration, you need to understand the different command
groups and how they relate to the emulator configuration. See table
4-1 for the list of commands in each group while you read about these
groups.
These commands are generally referred to as "configuration items," and
are used to configure the emulator. The emulator response to certain
processor actions can also be configured. These commands are
described in this chapter.
Several of the emulator commands do not configure the emulator.
They either simply start an emulator program run or other
measurement, begin or halt an analyzer measurement, or allow you to
display the results of such measurements. Some of these commands
are used in the examples in chapters 2 and 3. The Terminal Interface
Reference contains detailed information about all of these commands.
Configuring the Emulator 4-1
Table 4-1. Command Groups
Configuration
Make a
Measurement
Coordinated
Measurements
Analyzer
System
bc
cf
map
b
bp
cov
es
io
m
r
reg
rst
s
t
th
tl
bnct
cmb
cmbt
rx
tx
x
ta
tarm
tcf
tck
tcq
telif
tf
tg
tgout
tif
tinit
tlb
tp
tpat
tpq
trng
ts
tsck
tsq
tsto
xttd
xteq
xtgq
xtm
xtmo
xtsp
xtt
xttq
xtv
cim
cl
cp
dt
dump
echo
equ
help
init
lcd
load
mac
mo
po
pv
rep
ser
stty
sym
ver
w
xp
4-2 Configuring the Emulator
Coordinated
Measurement
Commands
These commands determine how the emulator interacts with other
measurement instruments, such as external analyzers, or other HP
64700-Series emulators connected together by the coordinated
measurement bus (CMB). These commands are described in the CMB
User’s Guide and in the Terminal Interface Reference.
Analyzer Commands
The analyzer configuration commands are those commands which
specify the type of measurement the analyzer is to make. Some of the
analyzer commands are described earlier in this manual. You can refer
to the Analyzer Terminal Interface User’s Guide and the Terminal
Interface Reference for more information.
System Commands
The system commands are used to set the emulator data
communications protocol, load or dump contents of emulation
memory, and set up command macros. These commands are described
earlier in this manual and in the Terminal Interface Reference.
Displaying
MC68302
Configuration
Items
M>cf
cf
cf
cf
cf
cf
cf
cf
cf
cf
cf
cf
cf
cf
cf
cf
cf
cf
cf
Use the cf command to configure the MC68302 emulator. To view the
current emulator configuration settings, enter:
ba=en
trc_dma=dis
bbk=0
bfc=sp
be=dis
clk=int
dbc=en
dti=dis
lfc=x
mon=bg
rrt=dis
rssp=9
swtp=0
ti=dis
im=nor
int7=lev
iack7=pb0
pdw=16
Configuring the Emulator 4-3
cf
cf
cf
cf
cs0_dtk=int
cs1_dtk=ext
cs2_dtk=ext
cs3_dtk=ext
Using the Built-in
Help Facility
To display information about the cf command, enter:
M>help cf
cf - display or set emulation configuration
cf
- display current settings for all config items
cf <item>
- display current setting for specified <item>
cf <item>=<value> - set new <value> for specified <item>
cf <item> <item>=<value> <item> - set and display can be combined
help cf <item>
- display long help for specified <item>
--- VALID CONFIGURATION <item> NAMES --ba
- en/dis bus arbitration
trc_dma - en/dis/tag emulation analysis of the bus arbitration cycles
bbk
- select memory block during background operation
bfc
- select function codes during background operation
be
- en/dis /BERR to/from target system
clk
- select int/ext clock source
dbc
- en/dis drive of background cycles to the target system
dti
- en/dis /DTACK interlock
lfc
- select function codes for file loading
mon
- selection of a foreground or background monitor
rrt
- en/dis restriction to real time runs
rssp
- set SSP when monitor is entered from emulation reset
swtp
- select trap for software breaks
ti
- en/dis of target system interrupts
im
- nor/ded mode of target system interrupts
int7
- lev/edge mode of IRQ7 interrupt
iack7
- pb0/iack7 iack7 pin is pb0 or iack 7
pdw
- 8/16 processor configuration for data bus width
cs0_dtk - int/ext internal or external /DTACK for chip selects 0
cs1_dtk - int/ext internal or external /DTACK for chip selects 1
cs2_dtk - int/ext internal or external /DTACK for chip selects 2
cs3_dtk - int/ext internal or external /DTACK for chip selects 3
Detailed information about each of these configuration items can be
obtained by specifying the name of the item. For example, to learn
about the ba item, type the following:
R>help cf ba
Bus Arbitration configuration
4-4 Configuring the Emulator
cf ba=en
cf ba=dis
enable
disable
When bus arbitration is enabled the /BR and /BGACK
signals driven from the target system to the emulator
will respond in the same manner as they would respond
if the CPU were present.
When bus arbitration is disabled the /BR signal
driven from the target system will be ignored
by the emulator. The emulator will not drive an
active level on /BG and the address, data and control
signals will not be placed in a tristate condition.
Bus Arbitration (cf ba)
The ba (bus arbitration) configuration item defines how your emulator
responds to bus request signals from the target system.
M> cf ba=en
When bus arbitration is enabled, the /BR (bus request) and /BGACK
(bus grant acknowledge) signals from the target system are responded
to exactly as they would be if the target processor was present. In other
words, if the emulation processor receives a /BR from the target
system, it will respond by asserting /BG and will set the various
processor lines to tri-state at the end of the current cycle. The target
system should then assert /BGACK to complete acquisition of the
processor bus. /BR is then released by the target; /BG is negated by the
processor. When /BGACK is negated by the target, the emulation
processor restarts execution.
Note
You cannot perform DMA (direct memory access) transfers between
your target system and emulation memory at any time; the 68302
emulator does not support such a feature. You may, however, do
accesses to the processor’s internal memory.
M> cf ba=dis
When you disable bus arbitration by entering the above command, the
emulator ignores the /BR and /BGACK signals from the target system.
The emulation processor will never drive the /BG line true; nor will it
place the address, data and control signals into the tri-state mode.
Enabling and disabling bus master arbitration can be useful to you in
isolating target system problems. For example, you may have a
situation where the processor never seems to execute any code. You
Configuring the Emulator 4-5
can disable bus arbitration using cf ba=dis to check and see if faulty
arbitration circuitry in your target system is contributing to the problem.
See also the section on cf trc_dma.
Background Block
(cf bbk)
The bbk (background block) configuration item allows you to specify
what memory address will be driven to the target system on address
lines A23-A16 during emulation background monitor accesses. These
lines will only be driven if you have configured the emulator to drive
upper addresses during background monitor operation using the cf
dbc=en option.
If you have set the emulator to use a foreground monitor using the cf
mon=fg..xxxxxx@f option, the bbk configuration option is still valid
because the emulation processor executes a few bus cycles in the
background monitor before the transition to the foreground monitor.
For example you might want your target system to see that accesses are
occurring in the range 05xxxx hexadecimal while the emulator is
operating in background. By typing
M> cf bbk=05
the emulator will drive the value 05 hex on the upper address lines
during every background monitor access.
You should use the address block configuration option to set up an
address which will not interfere with your target system circuitry, such
as memory management units or cache memory. Note that this is still
important even when using a foreground monitor, since the emulator
does spend a few cycles in the background monitor during the
transition to the foreground monitor.
Bus Error (cf be)
The be (bus error) configuration item allows you to define how the
emulator will respond to a /BERR (low bus error) signal asserted by the
target system during an emulation memory cycle.
be=en connects the target system /BERR to the emulator /BERR signal
so that the emulation processor will terminate the current emulation
memory cycle and will begin executing your bus error handler if your
target system asserts the /BERR signal during an emulation memory
cycle.
4-6 Configuring the Emulator
Note
You must interlock the target system /DTACK (data transfer
acknowledge) with the emulation system /DTACK using the cf dti=en
configuration option; otherwise, the emulator will not respond correctly
to the /BERR signal from the target system.
be=dis disconnects the emulator /BERR from the target.
Background
Function Codes (cf
bfc)
The bfc (background function codes) configuration option lets you
select the function code state that will be driven to your target system
during emulator background monitor cycles. These function codes will
only be driven to the target system if you set the cf dbc option to cf
dbc=en. If you have elected to use a foreground monitor with the cf
mon=fg option, this option is still valid because the emulator spends a
few cycles in the background before the transition to the foreground.
You can select one of four possible function code states to be driven to
the target system during background monitor cycles. These are:
M> cf bfc=sp
The function code for supervisor program cycles will be driven to the
target system. This is function code 110 binary (FC2-FC0,
respectively).
M> cf bfc=sd
The function code for supervisor data access cycles will be driven to
the target system. This is function code 101 binary (FC2-FC0,
respectively).
M> cf bfc=up
The function code for user program cycles will be driven to the target
system. This is function code 010 binary (FC2-FC0, respectively).
M> cf bfc=ud
The function code for user data access cycles will be driven to the
target system. This is function code 001 binary (FC2-FC0,
respectively).
The setting you choose for your situation is dependent on your
particular system. Generally, you want to choose a function code that
Configuring the Emulator 4-7
will not cause target system hardware such as memory management
units to behave in an unpredictable manner.
Clock Selection
(cf clk)
The clk (clock) option allows you to select either the external target
system clock or the emulator’s internal clock as the emulator clock
source.
M> cf clk=int
You can select the emulator’s internal 16 MHz oscillator using the
above command.
M> cf clk=ext
You can specify that the emulator use the emulator probe’s clock input
as the clock source. This clock must conform to the specifications for
the 68302 microprocessor. The maximum clock speed with the HP
64746 emulator is 16.67 MHz.
You should always select the external clock option when using the
emulator in-circuit to ensure that the emulator is properly synchronized
with your target system.
Note
4-8 Configuring the Emulator
Executing the cf clk=int command (even if already using the internal
clock) will drive the emulator into the reset state and hold it in that state
(R> prompt).
Chip Selects
(cf cs[0-3]_dtk)
The MC68302 chip selects can be configured either to generate the
DTACK signal internally or to use an externally supplied DTACK.
The emulator looks at two things to decide which source of the
DTACK it should look for when a given chip select is active:
The chip select lines (programmed using registers BR0-BR3).
The source of DTACK for the chip select lines is determined
by the corresponding DTACK field bits (programmed using
OR0-OR3). The order in which you write these registers is
significant.
The emulator configuration (set using cf cs0_dtk through cf
cs3_dtk).
Note
Be sure that the emulator configuration and the configuration of the
chip select lines are consistent. Remember that the order in which you
write the chip select registers BR0-BR3 and OR0-OR3 is significant.
If csx_dtk=int, an active signal on chip select x causes the /DTACK
signal to be driven to the target system and the emulator will not drive
/DTACK to the processor.
If csx_dtk=ext, an active signal on chip select x causes the /DTACK
signal to be driven to the processor. The source of this /DTACK signal
is determined by the /DTACK interlock configuration.
See also the section on /DTACK interlock in this chapter.
Drive Background
Cycles (cf dbc)
The dbc (drive background cycles) option allows you to select whether
or not the emulator will drive the target system bus on all background
monitor cycles.
If you have elected to use a foreground monitor with the cf mon=fg
command, emulator foreground monitor cycles will appear at the target
interface exactly as if they were bus cycles caused by any target system
program.
M> cf dbc=en
Configuring the Emulator 4-9
You can enable background cycle drive to the target system by entering
the above command. All of the emulation processor’s address, data
and control strobes are driven during background cycles.
The value driven on the upper 8 bits (A23-A16) of the address bus is
selected by the configuration command cf bbk=xx; the value driven on
the function code lines is selected by the configuration command cf
bfc=xx (see above for descriptions of these two configuration items).
Background write cycles will appear as read cycles to the target system
if the dbc option is enabled.
M> cf dbc=dis
If you specify the above command, background monitor cycles are not
driven to the target system. When you select this option, the emulator
will appear to the target system as if it is between bus cycles while it is
operating in the background monitor.
The dbc option is used to avoid target system interaction problems.
For example, your target system memory refresh scheme may depend
on the constant repetition of bus cycles, or you may be using a
watchdog timer (which resets the system after no bus cycles occur in a
specified time period). Using the dbc option will help avoid problems
in either case.
/DTACK Interlock
(cf dti)
The dti (/DTACK interlock) option allows you to specify the source of
the /DTACK (cycle termination) signal. /DTACK interlock applies
only to situations where the MC68302 does not provide an internal
/DTACK.
When /DTACK interlock is enabled (dti=en), the target system (if
there is one) is expected to provide a /DTACK signal. Accesses to
emulation memory will not be terminated until the target system
provides a /DTACK. If background cycles are being driven to the
target system, then the target system must provide a /DTACK signal to
terminate background memory cycles.
When /DTACK interlock is disabled (dti=dis), emulation memory and
background memory accesses are terminated by a /DTACK signal
generated by the emulator.
4-10 Configuring the Emulator
When the emulator is not operating in a target system, all externally
provided /DTACK cycles are terminated by an emulator-generated
/DTACK signal.
If a /BERR signal occurs during an emulation memory cycle when cf
be=en (bus error response enabled), then the cycle will be terminated
and the emulation processor will begin executing the bus error handler.
If you have enabled background monitor drive to the target system with
the cf dbc=en configuration option, and if /DTACK is interlocked (cf
dti=en), then the target system must provide a /DTACK signal as if it
were a normal user program access to emulation memory.
See also the section on chip selects in this chapter.
Note
PB0/IACK7
Configuration (cf
iack7)
If you are not operating the emulator in-circuit, all emulation and
background monitor accesses are completed by the emulator generated
DTACK signal, regardless of the setting of the cf dti configuration
option.
When the PB0/IACK7 pin is used as an interrupt acknowledge line (cf
iack7=iack7), the emulator blocks emulator-generated level 7 interrupt
acknowledges to the target system.
When the PB0/IACK7 pin is used as a port B peripheral pin (cf
iack7=pb0), the emulator does not affect the pb0 line.
Interrupt Mode (cf im)
In normal mode (cf im=nor), the interrupt inputs to the processor are
encoded on IPL2, IPL1, and IPL0.
In dedicated mode (cf im=ded), IPL2 becomes IRQ7, IPL1 becomes
IRQ6, and IPL0 becomes IRQ1. Use cf int7 to choose whether to
interrupt on a falling edge or on a low level.
Configuring the Emulator 4-11
IRQ7 Mode (cf int7)
This configuration item only applies when cf im=ded.
In level mode (cf int7=lev), interrupt 7 will happen when IRQ7 is low.
In edge mode (cf int7=edge), a change from high to low on IRQ7
causes an interrupt 7.
Load Function Codes
(cf lfc)
The lfc (load function codes) configuration item determines how the
emulator will interact with the load command when loading your
program files.
R>help cf lfc
Selection of function code for file loading
cf
cf
cf
cf
cf
cf
cf
cf
cf
lfc=x
lfc=s
lfc=u
lfc=p
lfc=d
lfc=sp
lfc=sd
lfc=up
lfc=ud
function codes unmapped
load file in supervisor space
load file in user space
load file in program space
load file in data space
load file in supervisor program space
load file in supervisor data space
load file in user program space
load file in user data space
Select the function code pattern that specifies
the function code range that the ’load’ command
uses to load files.
This configuration must be used if 68302 function
codes are part of the memory map.
Parameter Descriptions
cf lfc=x
No function codes are mapped. This is the
default.
cf lfc=s
This configures the emulator so that subsequent
load commands will address only terms
specified as supervisor space.
cf lfc=u
This configures the emulator so that subsequent
load commands will address only terms
specified as user space.
cf lfc=p
When you enter a load command, the file will
be loaded into memory ranges designated as
"program" space.
4-12 Configuring the Emulator
Monitor Selection
(cf mon)
cf lfc=d
When you enter a load command, the file will
be loaded into memory ranges designated as
"data" space.
cf lfc=sp
When you enter a load command, the file will
be loaded into memory ranges designated as
"supervisor program" space.
cf lfc=sd
When you enter a load command, the file will
be loaded into memory ranges designated as
"supervisor data" space.
cf lfc=up
When you enter a load command, the file will
be loaded into memory ranges designated as
"user program" space.
cf lfc=ud
When you enter a load command, the file will
be loaded into memory ranges designated as
"user data" space.
The mon (monitor) configuration item allows you to choose between a
foreground monitor, which you must load into the emulator, or the
background monitor, which resides in the emulator.
The emulation monitor is the program that handles communication
between the emulation controller and the emulation processor. For
example, when you ask for a register display, the emulator execution
breaks out of the user program into the monitor, where 68302
instructions store the register contents in an array of memory locations.
When all register contents are stored, emulator execution returns to
your program.
The background monitor provided with the emulator offers the greatest
degree of transparency to your target system (that is, your target system
should generally be unaffected by monitor execution). However, in
some cases you may require an emulation monitor tailored to the
requirements of your system. In this case, you will need to use a
foreground monitor linked into your program modules. See chapter 5
of this manual for more information on foreground monitors.
M> cf mon=bg
Configuring the Emulator 4-13
The command above selects the use of the built-in background monitor.
A memory overlay is created and the background monitor is loaded
into that area. You can use the configuration items cf dbc, cf bbk, and
cf bfc to specify how the emulator will drive the target system during
background monitor execution.
Note
When stepping through program execution and an interrupt occurs
while the emulator is executing in background, another step command
looks as though it causes the same instruction to execute. Actually, the
instruction does not execute because the interrupt occurs before the
instruction is executed.
M> cf mon=fg..XXXXXX@f
The command above selects the use of your foreground monitor, where
XXXXXX defines an hexadecimal address where the monitor
will be located. (Note: this will not load the monitor, it only
specifies its location). Choose the address as follows:
– If you are not using the HP 64170 memory board, the
address should be on a 2-kbyte boundary.
– If you are using the HP 64170 with 256-kbyte memory
modules, the address should be on a 2-kbyte boundary.
– If you are using the HP 64170 with 1-Mbyte memory
modules, the address should be on an 8-kbyte boundary.
@f defines an optional function code specifier to further
qualify the monitor location. You may only use x (no
function code) or s (supervisor space). If you do not specify a
function code, the default is x.
Remember that you must assemble and link your foreground monitor
starting at the 2 kilobyte boundary specified in the command above. If
you specified a function code in the monitor location specifier, you
need to use the cf lfc=s or cf lfc=x command before loading the
monitor to ensure that it is loaded at the correct location.
4-14 Configuring the Emulator
If you intend to use a foreground monitor, the monitor must be loaded
before attempting to load any information into target system memory.
Note
A memory mapper term is automatically created when you execute the
cf mon=fg command to reserve 2 kilobytes of memory space for the
monitor.
The memory map is reset any time cf mon=fg is entered. It is only
reset when the cf mon=bg command is entered if the emulator is not
already configured to use the background monitor.
Bus Width (cf pdw)
When out of circuit, this configuration item sets the processor bus
width. The two possibilities are cf pdw=8 and cf pdw=16.
When in circuit, the target system BUSW pin overrides this
configuration item.
Restrict to Real-Time
(cf rrt)
The rrt (restrict to real-time) option lets you configure the emulator so
that commands which temporarily cause the emulator to break to the
monitor will be rejected by the emulator command interpreter.
M>help cf rrt
Restrict to Real Time Runs
cf rrt=en
cf rrt=dis
enable
disable
When enabled and while the emulator is running the user program, any
command that requires a break to the monitor will be rejected except
’rst’, ’b’, ’r’ or ’s’.
When disabled, commands that require a break to the monitor will
always be accepted.
When you enable the "restrict to real-time" option with the command cf
rrt=en, you can restrict the emulator to accept only commands that
don’t cause temporary breaks to the monitor.
Only the following emulator run/stop commands will be accepted:
rst (Resets the emulation processor.)
b (Breaks processor to background monitor until you enter
another command.)
Configuring the Emulator 4-15
r (Runs the emulation processor from a given location.)
s (Steps the processor through a section of code, and returns to
monitor after each step.)
Commands which cause the emulator to temporarily break to the
monitor and return, such as reg, m (for target memory display), and
others, will be rejected by the emulator.
Caution
POSSIBLE DAMAGE TO TARGET SYSTEM!
IF COMMANDS THAT STOP THE PROCESSOR WILL
DISRUPT TARGET SYSTEM OPERATION, READ THIS!
If your target system circuitry is dependent on constant execution of
program code, you should set this option to cf rrt=en. This will help
insure that target system damage doesn’t occur. However, remember
that you can still execute the rst, b and s commands. You should use
caution in executing these commands.
Also consider using cf dbc=en to drive the address, data, and control
strobes while the background monitor is executing.
When the "restrict to real-time" option is disabled, all commands,
regardless of whether or not they require a break to the emulation
monitor, are accepted by the emulator.
Supervisor Stack
Pointer on Reset (cf
rssp)
The rssp (register supervisor stack pointer) configuration item allows
you to specify a value to which the supervisor stack pointer will be set
upon the first transition from emulation reset into the emulation
monitor.
R> cf rssp=XXXXXXXX
Where XXXXXXXX is a 32-bit hexadecimal even address. The
supervisor stack pointer will be set to this value upon entry to the
emulation monitor after an emulation reset. This address should reside
in an otherwise unused emulation or target system RAM area.
4-16 Configuring the Emulator
Note
We recommend that you use this method of configuring the supervisor
stack pointer. Without a stack pointer, the emulator is unable to make
the transition to the run state, step, or perform many other emulation
functions. However, using this option does not preclude you from
changing the stack pointer value or location within your program; it
just sets the initial conditions to allow a run to begin.
For example, to set the stack pointer to 000000ff0 hex, type:
R> cf rssp=00000ff0
Now, if you break the emulator to monitor using the b command, the
stack pointer will be modified to the value 00000ff0 hex.
Note
A target system reset which occurs during background monitor
operation will not affect the supervisor stack pointer value.
Note
When a foreground monitor is used, the reset value of the supervisor
stack pointer must be at least six bytes away from a guarded memory
area. If the reset value of SSP is not six bytes away from a guarded
area, a "Stack is in guarded memory" error will occur when you attempt
to run the program.
Software Breakpoint
Trap (cf swtp)
The swtp (software trap) configuration item allows you to specify
which of 16 software trap instructions implemented by the 68302
should be used when you insert a software breakpoint with the bp
command.
M> cf swtp=xx
Executing the above command with xx as one of the values 00 through
0f specifies the particular software trap instruction to be used for the
software breakpoints feature.
Configuring the Emulator 4-17
For example, suppose cf swtp=0f; when you define a software
breakpoint at some address, the opcode at that address is replaced by
the TRAP #0FH instruction.
When a TRAP #0FH instruction is executed, the emulator breaks into
the monitor. Since the system controller knows the locations of
defined software breakpoints, it can determine whether the TRAP
#0FH was generated by an enabled software breakpoint or a TRAP
#0FH instruction in the user program.
If the TRAP #0FH instruction was inserted as a software breakpoint,
the TRAP #0FH instruction is replaced by the original opcode. A
subsequent run or step command will execute from this address.
If the TRAP #0FH instruction is part of the user program, an
"undefined breakpoint" message is displayed. To continue program
execution, you must run or step from the user program’s TRAP #0FH
vector address.
When you change the value assigned to the swtp configuration item,
any software breakpoints currently defined with the bp command are
disabled (since the software trap instructions currently in memory may
differ from the new value you have specified).
Target System
Interrupts (cf ti)
The ti (target system interrupts) configuration item allows you to
specify whether or not the emulation processor responds to interrupts
generated by the target system.
M> cf ti=en
When you enable target system interrupts with the above command, all
target system interrupts generated when the processor is executing your
user program are recognized by the emulation processor.
If you are using the built-in background monitor, target system
interrupts are always ignored during background execution. If you are
using a foreground monitor, whether or not target system interrupts are
recognized during monitor execution is dependent on the
implementation of your monitor. See chapter 5 for further information
on foreground monitors.
M> cf ti=dis
You can disable the recognition of all target system interrupts by the
emulator by entering the above command.
4-18 Configuring the Emulator
DMA Tracing
(cf trc_dma)
When DMA tracing is enabled (cf trc_dma=en), the analyzer will
capture analyzer states during external or internal DMA bus cycles.
The analyzer state can be generated only if the processor states are
actually being driven on the external DMA cycle.
When DMA tracing is disabled (cf trc_dma=dis), the analyzer will not
capture any external or internal DMA, bus cycles.
When DMA tagging is enabled (cf trc_dma=tag), a single emulation
analyzer state will be generated each time an external bus arbitration
sequence occurs.
Where to Find
More Information
Due to the architecture of the HP 64700-Series Emulators, there are a
wide variety of items that affect how the emulator interacts with your
system, controller, and other measuring instruments. If you need more
information, refer to the following:
Analyzer Terminal Interface User’s Guide
This manual describes how to use the analyzer in the Terminal
Interface.
CMB User’s Guide
This manual describes how to use the Coordinated
Measurement Bus.
Terminal Interface Reference
This manual contains detailed descriptions and syntax
diagrams for all HP 64700-Series Terminal Interface
commands. Also included are error messages and other
pertinent information.
The built-in help messages for each configuration item
Configuring the Emulator 4-19
Configuring Other
Features
Some other emulator features that you can configure (not using the cf
command) include:
Memory
Access and Display Modes
Break Conditions
Software Breakpoints
Coordinated Measurement Bus Operation
4-20 Configuring the Emulator
5
Concepts
Topics Covered
MC68302 Vector Table
Access and Display Modes
Target System Memory Access
Break Conditions
Macros
Coordinated Measurement Bus Operation
Software Products
In-Circuit Emulation
Using the Analyzer
Equates
Replacing Firmware in the Emulator
Foreground and Background Monitors
Concepts 5-1
MC68302 Vector
Table
All MC68302 emulation systems require a vector table to process
system conditions, such as divide by zero or trace traps. You need to
provide such a vector table to manage these conditions. Exception
processing attempted without a vector table will cause unpredictable
results. Most of the examples shown in this manual were created
without a vector table to simplify the examples.
The MC68302 vector table is different from the M68000 vector table in
that it includes the processor’s BAR and SCR registers at $0F2 and
$0F4.
Refer to the Motorola documentation for the MC68302 microprocessor
for additional information about vector tables and exception processing.
Access and
Display Modes
When using the HP 64746 emulator, you can set the access mode to
bytes, or words. The display mode can be set to mnemonics, bytes,
words, or long words (4 bytes).
To display the current access and display modes, enter:
M>mo
mo -ab -dm
If the result shown above appears, the access mode is set to "bytes" and
the display mode is set to "mnemonics."
To change the access mode to word format, enter:
M>mo -aw -dm
To change the display mode to byte format, you can either use the mo
command to modify the current setting, or execute a "memory display"
command in the form:
M>m -db 300
The display mode is then automatically set to "byte." All successive
commands will be displayed in byte format.
5-2 Concepts
You should always do accesses in byte mode when the processor is
running in 8 bit mode (set by cf pdw=8 when out of circuit, or by the
BUSW pin when in circuit).
To display additional information about the mode command, enter:
M>help mo
Target System
Memory Access
Target memory accesses by the emulator are accomplished by causing
the monitor to read target memory, then placing the data so that it is
accessible by the emulation controller. When the emulator is executing
in the monitor, the target system is "locked out." Because of this,
special hardware is used to access the target system at the appropriate
time.
The choice of an access mode is provided by the emulator to
accommodate memory devices which must be accessed using a
particular bus size. The emulator access mode to target system
memory can be bytes, or words. The default access mode is bytes. The
emulator will access target system memory using whatever mode is
currently set.
When using word access mode, if the target system bus requires a
smaller bus width, an error message will be displayed. However, since
target system bus widths for a particular memory range cannot be
determined until the bus cycle occurs, target system memory write
operations may disrupt the monitor, causing the emulator to be put in
an unknown state. If this happens, resetting the emulator (using the rst
command) should restore the monitor.
Because of the restraints listed here, Hewlett-Packard recommends that
you use byte access mode unless a larger size is needed. If you need to
write to devices that require a larger bus size, use word mode.
However, performance increases are hardly noticeable when using a
larger access mode.
Concepts 5-3
Break Conditions
If break conditions are enabled, when a specified break condition
occurs the emulator will break to the monitor. If break conditions are
disabled, when a specified break condition occurs the emulator will not
break into the monitor. The bc command is used to set break
conditions.
Possible break conditions include:
bp (software breakpoints)
rom (write to ROM)
bnct (BNC trigger signal)
cmbt (CMB trigger signal)
trig1 (trig1 signal)
trig2 (trig2 signal)
Some examples follow. The Terminal Interface Reference contains
additional information about break conditions.
To display current break conditions, enter:
M>bc
The bc command lets you configure the emulator’s response to various
emulation system and external events.
Software Breakpoints
The bp command allows you to insert software traps in your code
which will cause a break to the emulation monitor when encountered
during program execution. To enable the insertion and use of software
breakpoints by the bp command, enter:
M>bc -e bp
Note that any breakpoints that existed before you entered this command
are not reenabled. You must do that explicitly by using the bp
(breakpoint) command.
To disable use of software breakpoints, enter:
M>bc -d bp
Any breakpoints which previously existed in memory are disabled, but
are not removed from the breakpoint table.
5-4 Concepts
Note
Break on Trigger
Signals
Software breakpoints should not be set, cleared, enabled, or disabled
while the emulator is running user code. If any of these commands are
entered while the emulator is running user code, and the emulator is
executing code in the area where the breakpoint is being modified,
program execution may be unreliable.
Each HP 64700-Series emulator provides four different trigger signals
which allow you to selectively start or stop measurements depending
on the signal state. These are the bnct (rear panel BNC input), cmbt
(CMB trigger input), and trig1 and trig2 signals (provided by the
analyzer).
You can configure the emulator to break to the monitor upon receipt of
any of these signals. For example, to have the emulator break to
monitor upon receipt of the trig1 signal from the analyzer, enter:
M>bc -e trig1
(In this situation, you must also configure the analyzer to drive the
trig1 signal upon finding its trigger by entering tgout trig1).
To enable the breakpoint and BNC trigger conditions, enter:
M>bc -e bp bnct
To disable the BNC trigger break condition, enter:
M>bc -d bnct
To display additional information about break conditions, refer to the
Terminal Interface Reference. You can also enter:
M>help bc
Concepts 5-5
Macros
To create your own macros, follow this syntax:
mac <macro_name>={command 1;command 2}
You can use more than two commands in a macro definition. Refer to
the HP 64700-Series Emulators Terminal Interface Reference for
details about the mac command.
For example, with a program already loaded in memory, you could
define a macro to:
Display the MC68302 emulator status.
Display registers.
Start the emulator running the program.
Trace program activity.
Halt the trace.
Display the trace list.
Observe the trace status.
All of these functions would be performed automatically when you
execute the macro. For example (enter the brackets also):
M>mac go302={es;t;r;reg;th;tl;ts}
While the emulator is executing in the monitor (the prompt is M>), to
execute the macro, enter:
M>go302
Observe the commands execute as you defined them in the macro.
To display additional information about the mac command, enter:
M>help mac
5-6 Concepts
Coordinated
Measurement Bus
Operation
The Coordinated Measurement Bus (CMB) connects multiple
emulators together and allows you to make synchronous measurements
between those emulators. You can determine whether the MC68302
emulator will participate in a coordinated measurement using the cmb
command. For example:
To display the current setting of the CMB, enter:
M>cmb
To enable CMB interaction, enter:
M>cmb -e
To disable CMB interaction, enter:
M>cmb -d
The cmb command does not affect operation of the HP 64700
emulation analyzer cross-triggering. Refer to the CMB User’s Guide
for additional information about operating the emulator with the CMB
and making measurements.
To display additional information you can enter:
M>help cmb
Concepts 5-7
Software Products
Assembler/Linker
HP 64870 HP 9000-based M68000 Assembler/Linker/Librarian . (This
assembler generates code for the M68000, M68008, M68010,
MC68302, M68332, and M68020 processors. Also available for Apollo
computers as B1423.)
C Cross Compiler
The HP 64902 68000 C Cross Compiler can be used to compile
high-level C programs, and operates on the HP 9000 Series 300 and
Series 800 host computers. (Also available for Apollo computers as
B1421.)
HP Branch Validator
User Interfaces
The HP Branch Validator operates on the HP 9000 Series 300 host
computer, and can be used to analyze and quantify the level of testing
on your product.
At least two other interfaces are available for using the HP 64746
emulator, depending on what type of host computer you are using.
Softkey Interface
The HP 64746 MC68302 Softkey Interface allows you to operate your
HP 64746 emulator using a softkey-driven interface on the HP 9000
Series 300 or Sun SPARCsystem host computer. You can also
configure your HP 64700-Series emulator into a measurement system
to make coordinated measurements with HP 64000-UX emulators.
PC Interface
The HP 64746 MC68302 PC Interface allows you to operate your HP
64746 emulator on a personal computer using a menu-driven interface.
The PC Interface allows you to transfer (download) absolute files from
a PC into the emulator in standalone mode.
5-8 Concepts
Protecting the
Emulator Probe
Note
The HP 64746 MC68302 emulator can be operated in-circuit
(connected to a target system) or out-of-circuit.
The emulator probe requires a PGA (pin grid array) socket.
Connecting the emulator is much easier if you use a PGA socket in
your target system.
If you would like to use a PQFP package, see chapter 1.
Pin Protector
The emulation probe has a pin protector that prevents damage to the
probe when inserting and removing the probe from the target system
microprocessor socket. Do not use the probe without a pin protector
installed. If the probe is installed on a densely populated circuit board,
there may not be enough room to accommodate the plastic shoulders of
the probe socket. If this occurs, another pin protector may be stacked
onto the existing pin protector.
To order additional pin protectors, contact your local HP Sales and
Service Office listed in the Support Services manual. You may also
use a socket such as the McKenzie Technology
PGA-100M-003B1-1324 for a pin protector.
Conductive Pin Guard
HP emulators are shipped with a conductive plastic or conductive foam
pin guard over the target system probe pins. This guard is designed to
prevent impact damage to the pins and should be left in place while you
are not using the emulator. However, when you do use the emulator,
either for normal emulation tasks, or to run performance verification on
the emulator, you must remove this conductive pin guard to avoid
intermittent failures due to the probe lines being shorted together.
Concepts 5-9
Caution
POSSIBLE DAMAGE TO EMULATOR PROBE!
Always use the pin protectors and guards as described above. Failure
to use these devices may result in damage to the probe pins. Replacing
the probe is expensive. If damage occurs, the entire probe and cable
assembly must be replaced because of the wiring technology employed.
Using the Analyzer
Your MC68302 emulator can use either an emulation analyzer (Model
64704A), and or an external analyzer (Model 64703A).
The emulation analyzer captures emulator bus cycle information
synchronously with the processor clock signal. When a trace is taken, a
collection of the captured states is stored in the analyzer.
The external analyzer captures activity on signals that are external to
the emulator. This typically includes signals in a target system. The
external analyzer provides 16 external trace signals and two external
clock inputs. The external analyzer can be used as an extension to the
emulation analyzer. In addition, it can be used independently as a state
analyzer, or as a timing analyzer. However, to use the external
analyzer as a timing analyzer, you must have either a personal
computer running the HP 64746 MC68302 PC Interface or an HP 9000
Series 300 host computer running the HP 64746 Softkey Interface.
For additional information about operating the analyzer terminal
interface, refer to the Analyzer Terminal Interface User’s Guide.
Analyzer Clock Speed
To display the current analyzer clock speed setting, enter:
M>tck
tck -r L -u -s S
You can configure the analyzer to operate at various clock speeds using
the following commands:
M>tck -s VF
(for speeds greater than 20 MHz)
5-10 Concepts
M>tck -s F
(for speeds greater than 16 MHz but less than 20MHz)
M>tck -s S
(for speeds less than 16 MHz)
For the MC68302, the analyzer speed should always be tck -s S.
If you try to execute one of these commands, and the system displays
an error message indicating the clock speed is not available with the
current count qualifier, enter:
M>tcq none
Then try executing the command again.
The analyzer clock runs at one-fourth of the processor clock speed.
Thus if the processor is running at 16 MHz, the analyzer will run at 4
MHz. The analyzer state counter cannot be used at analyzer clock
speeds greater than 20 MHz. The analyzer time counter is turned off
by default because it cannot be used at clock speeds greater than 16
MHz.
If you want to use the analyzer counter, you can:
Cut the clock speed in half.
Slow the bus clock using an external clock.
Concepts 5-11
Equates
Equates are logical expressions. The equ command allows you to
equate arithmetic values to names that you choose. Names can be used
in other commands when referencing the value. Equates are commonly
used to define trigger patterns for the emulation or external analyzers
(as trace qualifiers). Equates for common status values are predefined.
For the MC68302 emulator, the following equates are defined when the
emulator is powered up.
M>equ
### Equates ###
equ bclr=0xxxxxxxxxxxxxx0xy
equ berr=0xxxxxxxxx0xxxxxxy
equ bgd=0xxxxxxxy
equ byte=0xxxxxxx0y
equ cs0=0xxxxxxxxxx0xxxxxy
equ cs1=0xxxxxxxxxxx0xxxxy
equ cs2=0xxxxxxxxxxxx0xxxy
equ cs3=0xxxxxxxxxxxxx0xxy
equ data=0xxx01xxxy
equ ded_int1=0xx0xxxxxxxxxxxxxy
equ ded_int6=0x0xxxxxxxxxxxxxxy
equ ded_int7=0xxxxxxxxxxxxxxxy
equ dma=0x1xxxxxxy
equ ext_cyc=0xxxxx0xxy
equ ext_dma=0xxxxxxxxxxxxxxx0y
equ fgd=1xxxxxxxy
equ grd=0xxxxxxx0xxxxxxxxy
equ int_cyc=0xxxxx1xxy
equ int_dma=0xxxxxxxxxxxxxxx1y
equ intack=0xx111xxxy
equ nor_int1=110xxxxxxxxxxxxxy
equ nor_int2=101xxxxxxxxxxxxxy
equ nor_int3=100xxxxxxxxxxxxxy
equ nor_int4=11xxxxxxxxxxxxxy
equ nor_int5=10xxxxxxxxxxxxxy
equ nor_int6=1xxxxxxxxxxxxxy
equ nor_int7=0xxxxxxxxxxxxxy
equ nor_no_int=111xxxxxxxxxxxxy
equ not_dma=0x0xxxxxxy
equ pb10_h=0xxxx1xxxxxxxxxxxy
equ pb10_l=0xxxx0xxxxxxxxxxxy
equ pb11_h=0xxx1xxxxxxxxxxxxy
equ pb11_l=0xxx0xxxxxxxxxxxxy
equ pb8_h=0xxxxxx1xxxxxxxxxy
equ pb8_l=0xxxxxx0xxxxxxxxxy
equ pb9_h=0xxxxx1xxxxxxxxxxy
equ pb9_l=0xxxxx0xxxxxxxxxxy
equ prog=0xxx10xxxy
equ read=0xxxxxx1xy
equ rom=0xxxxxxxx0xxxxxxxy
equ sup=0xx1xxxxxy
equ supdata=0xx101xxxy
equ supprog=0xx110xxxy
equ user=0xx0xxxxxy
equ userdata=0xx001xxxy
equ userprog=0xx010xxxy
5-12 Concepts
equ word=0xxxxxxx1y
equ write=0xxxxxx0xy
You can add, observe, delete and modify logical expressions using the
equ command. How to use the equ command is described in the
following paragraphs.
These logical expressions are used to define values for the emulation
analyzer label "stat" (for 8-bit equates) and "extra" (for 16-bit equates).
For example, the following two equations are equal:
stat=data
stat=0xxxxxxxxxxxx0xy
The "y" indicates the number is binary.
Note
Use the label stat for 8-bit equates. Use the label extra for 16-bit
equates.
Note
The 16-bit equates and extra label will not exist on 48-channel
analyzers. If you upgraded an M68000 emulator to the MC68302
emulator, you have a 48-channel analyzer.
You can see a summary of which equates apply go with "stat" and
which go with "extra" by typing:
help proc
You can define other expressions using the equ command. Some
examples of using the equ command are shown in the following
paragraphs.
To define a logical expression for running from the start of a program
located at address 0, enter:
M>equ start=0
Concepts 5-13
Verify that the start equate was added to the list of equates.
M>equ *
You could put the analyzer in complex mode, then use the "start"
equate in defining a trigger pattern for the emulation analyzer. For
example:
M>tcf -c
M>tpat p1 addr=start
This command defines pattern 1 to be the address equal to the value of
"start." You could then have the analyzer trigger on p1 using the
command tg p1.
In "easy" mode, you could just specify tg addr=start.
Note
You should not delete any of the predefined equates unless you know
they are not going to be needed. Each time you cycle power on the
emulator, or execute an init command, any predefined equates that
were deleted will be automatically defined again.
To delete a defined equate (for example, "start"), enter:
M>equ -d start
To verify that the "start" equate was deleted from the list of equates,
enter:
M>equ
For additional information about equates and using the emulation or
external analyzer, refer to the Terminal Interface Reference (for
command descriptions) and the Analyzer Terminal Interface User’s
Guide.
5-14 Concepts
Symbols
Symbols, like equates, are logical expressions. If you use a symbol in
place of an equate for an address, the symbol name will be displayed in
the address column of the trace list.
For example, you can define a symbol "EntryPoint":
M>sym EntryPoint=1050
You can display the values of all currently defined symbols by typing:
M>sym
sym EntryPoint=0001050
To display a trace list with symbols, use the -e option:
M>tl -e
Any access to location 1050 hex will now be shown with the address
"EntryPoint" rather than "1050."
Concepts 5-15
Emulator Firmware
This emulator uses flash ROMs, which can be reprogrammed from an
appropriately equipped personal computer. Instructions on how to
reprogram the ROMs will accompany the firmware update.
If you need to determine what version of firmware is loaded into the
emulator, type:
M>ver
Copyright (c) Hewlett-Packard Co. 1987
All Rights Reserved. Reproduction, adaptation, or translation without prior
written permission is prohibited, except as allowed under copyright laws.
HP64700 Series Emulation System
Version:
A.02.02 24Jan90
HP64746A (PPN: 64746A) Motorola 68302 emulator
Version:
A.02.02 05Jul90
Speed:
16.67 MHz
Memory:
126 KBytes
HP64740 Emulation Analyzer with External State/Timing Analyzer
Version:
A.02.00 29Jun89
5-16 Concepts
Monitor
Description
The monitor program is the interface between the emulation system
controller and the target system. The emulation system controller
contains a microprocessor which accepts and executes emulation,
system, and analysis commands. The monitor operates in the
background emulator mode.
The monitor program allows emulation commands to access target
system resources. Access to the target system can only be
accomplished through the emulation processor. For example, if you
enter a command to modify target system memory, the monitor
program will execute instructions that write the new value into target
system memory.
When the emulation system controller recognizes that an emulation
command needs to access target system resources, it writes a command
code to the communications area, then breaks into the monitor. The
monitor reads the command code (and any associated parameters), then
executes the appropriate MC68302 instructions to access target system
resources.
By using and modifying the optional foreground monitor, you can
provide an emulation environment which is customized to the needs of
a particular target system.
Comparison of
Foreground and
Background Monitors
An emulation monitor is required to service certain requests for
information about the target system and the emulation processor. For
example, when you request a register display, the emulation processor
is forced into the monitor. The monitor code has the processor dump
its registers into certain emulation memory locations, which can then
be read by the emulator system controller without further interference.
Background Monitors
A background monitor is an emulation monitor which overlays the
processor’s memory space with a separate memory region. Entry into
the monitor is normally accomplished by jamming the monitor
addresses onto the processor’s address bus during an INT7 vector fetch.
Usually, a background monitor will be easier to work with in starting a
new design. The monitor is immediately available upon powerup, and
you don’t have to worry about linking in the monitor code or allocating
Concepts 5-17
space for the monitor to use the emulator. No assumptions are made
about the target system environment; therefore, you can test and debug
hardware before any target system code has been written. All of the
processor’s address space is available for target system use, since the
monitor memory is overlaid on processor memory, rather than
subtracted from processor memory. Processor resources such as
interrupts are not taken by the background monitor.
However, all background monitors sacrifice some level of support for
the target system. For example, when the emulation processor enters
the monitor code to display registers, it will not respond to target
system interrupt requests. This may pose serious problems for complex
applications that rely on the microprocessor for real-time, non-intrusive
support. Also, the background monitor code resides in emulator
firmware and can’t be modified to handle special conditions. Likewise,
entrance to the background monitor pulls on the MC68302 fr2 pin and
thus stops processor DMA and processor-internal DRAM refresh.
Foreground Monitors
A foreground monitor may be required for more complex debugging
and integration applications. A foreground monitor is a block of code
that runs in the same memory space as your program. You link this
monitor with your code so that when control is passed to your program,
the emulator can still service real-time events, such as interrupts or
watchdog timers. For most multitasking, interrupt intensive
applications, you will need to use a foreground monitor.
You can tailor the foreground monitor to meet your needs, such as
servicing target system interrupts. However, the foreground monitor
does use part of the processor’s address space, which may cause
problems in some target systems. You must also properly configure
the emulator to use a foreground monitor (see chapter 4); and, you
must link the monitor with your other program code. Note that the first
part of the monitor should not be modified.
5-18 Concepts
Using a Foreground
Monitor
You will need to follow several steps to use a foreground monitor:
Modify the ORG statement to piont to the base address where
the monitor will be loaded. Load the monitor at any 2-Kbyte
boundary (except 0, which is the vector table location). If you
are using an HP 64170 memory board with 1-Mbyte SIMMs,
use an 8-Kbyte boundary.
Assemble and link the monitor to your program.
Configure the emulator with cf mon=fg..XXXXX. This will
create a memory map entry for the monitor.
Set up a stack pointer for the monitor using cf rssp.
Load the monitor and program into the emulator.
If you will be using the s command to single step through your
code, you must modify the TRACE exception vector at 24 hex
to point to the TRACE_ENTRY routine in the monitor.
Concepts 5-19
Sample Foreground
Monitor Listing
This sample foreground monitor program is written to be used with the
HP 64870 or B1423A 68000 Cross Assembler. This is the same
monitor program used with the HP 64742 68000 Emulator.
The sample foreground monitor program is just a place to start; you
will need to modify it to meet your special needs.
SECT 14
;;;;;;;;;;;;;;;;;;;;;;;;;;;;;;;;;;;;;;;;;;;;;;;;;;;;;;;;;;;;;;;;;;;;;
;
;
EMULATION FOREGROUND MONITOR FOR 64746 EMULATOR.
;
THIS MONITOR VERSION IS USED WITH THE MICROTEC LANGUAGE
;
SYSTEM.
;
;;;;;;;;;;;;;;;;;;;;;;;;;;;;;;;;;;;;;;;;;;;;;;;;;;;;;;;;;;;;;;;;;;;;;
;
; @(mktid) Product_Numb Product_Description..................... A.00.00 DDMMMYY
HH:MM:SS status....
;
;;;;;;;;;;;;;;;;;;;;;;;;;;;;;;;;;;;;;;;;;;;;;;;;;;;;;;;;;;;;;;;;;;;;;
;
THE EMULATION FOREGROUND MONITOR IS THE VEHICLE BY WHICH THE
;
FOLLOWING EMULATOR FUNCTIONS ARE EFFECTED IF THE 64746
;
EMULATOR IS CONFIGURED TO OPERATE WITH A FOREGROUND MONITOR:
;
READ/WRITE TARGET SYSTEM MEMORY
;
DISPLAY/MODIFY 68302 REGISTERS
;
EXECUTE USER PROGRAM
;
BREAK AWAY FROM USER PROGRAM
;
;
THE 64746 FOREGROUND MONITOR MUST START ON A 2K BYTE BOUNDARY
;
OTHER THAN 0H. THE DESIRED 2K BYTE BOUNDARY SHOULD BE SPECIFIED
;
IN THE "ORG" STATEMENT AT THE START OF THE MONITOR. THE SAME
;
24 BIT ADDRESS MUST BE SPECIFIED IN THE EMULATOR CONFIGURATION
;
QUESTION "cf mon=fg..XXXXXX". IN THIS MANNER, COMMUNICATION
;
BETWEEN THE FOREGROUND MONITOR AND THE EMULATOR OPERATING SOFTWARE
;
CAN BE ESTABLISHED.
;
;
THE FIRST FEW SECTIONS OF THE FOREGROUND MONITOR CANNOT BE
;
MODIFIED AND THEIR LOCATION WITH RESPECT TO THE START OF THE
;
FOREGROUND MONITOR CANNOT BE ALTERED. THESE INCLUDE THE FOLLOWING:
;
MONITOR VECTOR TABLE
;
MONITOR VARIABLES
;
KEY MONITOR ENTRY ROUTINES
;
;
THE MONITOR VECTOR TABLE IS USED EXCLUSIVELY BY THE EMULATOR
;
TO TRANSITION INTO THE FOREGROUND MONITOR FROM RESET, FROM
;
SOFTWARE BREAKPOINTS, OR FROM EMULATION GENERATED BREAKS LIKE
;
THE BREAK COMMAND OR A WRITE TO ROM. THE MONITOR VECTOR IS NOT
;
A REPLACEMENT FOR THE TARGET SYSTEM’S EXCEPTION VECTOR TABLE.
;
;
THE MONITOR VARIABLES SECTION CONTAINS FOUR PARTS.
;
THE FIRST PART IS A GROUP OF VARIABLES THAT ACT AS THE
;
COMMUNICATIONS PATH BETWEEN THE FOREGROUND MONITOR AND THE
;
EMULATOR CONTROLLER. THE SECOND SECTION HOLDS A COPY OF THE
;
68302 REGISTERS WHICH ARE STORED WHEN ENTERING THE FOREGROUND MONITOR.
;
THE THIRD SECTION IS THE XFER_BUF WHICH IS A BUFFER TO HOLD DATA
;
WHICH IS TRANSFERRED BETWEEN THE EMULATOR CONTROLLER AND TARGET
;
SYSTEM MEMORY. THE BK_STACK IS A STACK USED BY THE MONITOR
;
WHEN IT IS IN A BACKGROUND STATE FOR A FEW BUS CYCLES UPON
;
TRANSITION TO THE FOREGROUND MONITOR. THE STAT(1:4) VARIABLES
5-20 Concepts
;
;
;
;
;
;
;
;
;
ARE A HOLDING AREA FOR THE EXTRA STACK INFORMATION THAT OCCURS
WHEN A BUS ERROR OR ADDRESS ERROR HANDLER IS DIRECTED INTO THE MONITOR.
THE KEY MONITOR ENTRY ROUTINES
SW_ENTRY, INMON_INT_ENTRY, AND
A BRIEF STOP IN THE BACKGROUND
MODIFIED OR MOVED WITH RESPECT
ARE BK_RESET_ENTRY, INT_ENTRY,
INMON_TRACE_ENTRY. THESE ROUTINES INVOLVE
MONITOR AND THEREFORE CANNOT BE
TO THE START OF THE MONITOR.
;
TO PERFORM SINGLE STEPPING WITH THE FOREGROUND MONITOR, THE
;
"TRACE" VECTOR IN THE EXCEPTION VECTOR TABLE MUST POINT TO
;
"TRACE_ENTRY" IN THE FOREGROUND MONITOR.
;
;;;;;;;;;;;;;;;;;;;;;;;;;;;;;;;;;;;;;;;;;;;;;;;;;;;;;;;;;;;;;;;;;;;;;;;;
; ORG XXXXX
; START MONITOR ON 2K BOUNDARY OTHER THAN ZERO
MONITOR_START
;;;;;;;;;;;;;;;;;;;;;;;;
; MONITOR VECTOR TABLE ;
;;;;;;;;;;;;;;;;;;;;;;;;
;
;
---RESET--DC.L
BK_STACK
DC.L
0258H
--- MARK SPACE --DC.L 0
DC.L 0
DC.L 0
DC.L 0
DC.L 0
DC.L 0
DC.L 0
DC.L 02B2H
;TRACE ENTRY AFTER STEP
DC.L 0
DC.L 0
MONITOR_REGISTERS
CURRENT_PC
PCH
PCL
PSTAT
PREGS
PD0
PD1
PD2
PD3
PD4
PD5
PD6
PD7
PA0
PA1
PA2
PA3
PA4
DC.W
DC.W
DC.W
DC.W
DC.L
DC.L
DC.L
DC.L
DC.L
DC.L
DC.L
DC.L
DC.L
DC.L
DC.L
DC.L
DC.L
0
0
0
0
;ALIGNMENT SPACER
0
0
0
0
0
0
0
0
0
0
0
0
0
Concepts 5-21
PA5
PA6
PA7
PUSP
DC.L
DC.L
DC.L
DC.L
0
0
0
0
; END OF MONITOR_REGISTERS ;
;
--- INTERRUPT MONITOR ENTRY --DC.L 266H
;;;;;;;;;;;;;;;;;;;;;;;;;;;;;;;;;;;;;;;;;;;;;;;
; TRAP VECTORS ( SOFTWARE BREAKPOINT VECTOR ) ;
;;;;;;;;;;;;;;;;;;;;;;;;;;;;;;;;;;;;;;;;;;;;;;;
DC.L
029EH
DC.L
029EH
DC.L
029EH
DC.L
029EH
DC.L
029EH
DC.L
029EH
DC.L
029EH
DC.L
029EH
DC.L
029EH
DC.L
029EH
DC.L
029EH
DC.L
029EH
DC.L
029EH
DC.L
029EH
DC.L
029EH
DC.L
029EH
;;;;;;;;;;;;;;;;;;;;;;;;;;;;;;;
; END OF MONITOR VECTOR TABLE ;
;;;;;;;;;;;;;;;;;;;;;;;;;;;;;;;
;;;;;;;;;;;;;;;;;;;;;
; MONITOR VARIABLES ;
;;;;;;;;;;;;;;;;;;;;;
STADJVAR
DC.W
DC.W
0
0
;ALIGNMENT SPACER
;ALIGNMENT SPACER
CMD_CONTROL
DC.W
3
CMD_RESULT
DC.W
0
CMD_TYPE
DC.W
0
TARG_START
TARG_BYTES
DC.L
DC.W
0
0
;VARIABLE TO TELL WHO IS IN CONTROL MONITOR OR EMULATOR
;’1’ INDICATES COMMAND PENDING
;’2’ INDICATES COMMAND IN PROGRESS
;’3’ INDICATES COMMAND COMPLETE
;’0’ INDICATES NO PROBLEM
;’1’ INDICATES ILLEGAL SR ON ENTRY
;’1’ INDICATES ’ARE-YOU-THERE’
;’2’ INDICATES MONITOR EXIT
;’4’ INDICATES TARGET MEMORY WRITES
;’8’ INDICATES TARGET MEMORY READS
;START ADDRESS TO LOAD EMULATION MEMORY
;NUMBER OF BYTES TO TRANSFER
;IF BIT 15 HIGH, DO WORD TRANSFERS
STEP_ENTRY
LAST_ENTRY
STEP_MODE
DC.W
DC.W
DC.W
0
0
0
5-22 Concepts
;
--- MARK SPACE --DC.W 0
DC.L 0
DC.L 0
DC.L 0
DC.L 0
DC.L 0
DC.L 0
DC.L 0
DC.L 0
DC.L 0
DC.L 0
DC.L 0
DC.L 0
DC.L 0
DC.L 0
DC.L 0
DC.L 0
DC.L 0
DC.L 0
XFR_BUF
DS.W
DS.W
136
16
DC.W
DC.W
DC.W
DC.W
0
0
0
0
BK_STACK
STAT1
STAT2
STAT3
STAT4
;;;;;;;;;;;;;;;;;;;;;;;;;;;;
; END OF MONITOR VARIABLES ;
;;;;;;;;;;;;;;;;;;;;;;;;;;;;
;;;;;;;;;;;;;;;;;;;;;;;;;;;;;;
; KEY MONITOR ENTRY ROUTINES ;
;;;;;;;;;;;;;;;;;;;;;;;;;;;;;;
BK_RESET_ENTRY
MOVE.W
DC.W
DC.L
NOP
INT_ENTRY
MOVE.B
MOVE.L
MOVE.B
AND.B
BTST
BEQ
MOVE.L
ADDQ.L
DC.W
DC.L
NO_SWBK_ENTRY
MOVE.L
MOVE.W
DC.W
DC.L
#01H,0D2H
04EF9H
BK_RESET_PROCESS
#008H,0F4H
*CLEAR SCR IPA BIT
D0,PD0
STEP_ENTRY+1,D0
*POLL IOB REGISTER, BG CONTROL BIT
#0FH,D0
*CHECK IF SWBK ENTRY
#03H,D0
NO_SWBK_ENTRY
PD0,D0
#6,A7
*FIX THE SYSTEM STACK POINTER
04EF9H
SW_ENTRY-MONITOR_START
PD0,D0
#02H,0D2H
04EF9H
MON_ENT
Concepts 5-23
NOP
SW_ENTRY
NOP
NOP
NOP
NOP
MOVE.L
MOVE.W
BEQ
MOVE.L
ADDQ.L
NO_STEP_FIX
MOVE.L
MOVE.W
DC.W
DC.L
NOP
D0,PD0
0D4H,D0
NO_STEP_FIX
PD0,D0
#6,A7
*FIX THE SYSTEM STACK POINTER
PD0,D0
#03H,0D2H
04EF9H
MON_ENT
INMON_TRACE_ENTRY
ADDQ.L #6,A7
MOVE.W #0BH,0D0H
JMP
SW_ENTRY
;ADJUST STACK POINTER TO IGNORE STACKING FOR TRACE
;INDICATES A STEP HAS OCCURRED.
;;;;;;;;;;;;;;;;;;;;;;;;;;;;;;;;;;;;;
; END OF KEY MONITOR ENTRY ROUTINES ;
;;;;;;;;;;;;;;;;;;;;;;;;;;;;;;;;;;;;;
;;;;;;;;;;;;;;;;;;;;;;;;;;;;;;;;;;;;;;;;;;;;;;;;;;;;
;;;;;;;; MONITOR OPERATING ROUTINES ;;;;;;;;;;;;;;;;
;;;;;;;;;;;;;;;;;;;;;;;;;;;;;;;;;;;;;;;;;;;;;;;;;;;;
; SOFTWARE IN MONITOR AND OPERATING VERIFICATION
;
THIS ROUTINE IS USED TO TELL THE EMULATOR CONTROLLER
;
IF THE EMULATOR IS OPERATING IN THE MONITOR AND IS
;
READY TO ACCEPT COMMANDS.
SW_IN_MON
MOVE.W
BRA
#3,CMD_CONTROL
MON_LOOP
; MONITOR EXIT ROUTINE
;
THE MONITOR EXIT ROUTINE PERFORMS THE TRANSITION FROM FOREGROUND
;
MONITOR OPERATION TO EXECUTION OF THE USERS PROGRAM
START_EXIT
MOVE
BTST
BNE
MOVE.W
BRA
EXIT_OK
MOVE.L
MOVE.L
MOVEM.L
MOVE
MOVE
MOVE
MOVE
RTE
5-24 Concepts
SR,D0
#13,D0
EXIT_OK
#0FH,LAST_ENTRY
MON_LOOP
PUSP,A0
A0,USP
PREGS,D0-D7/A0-A7
PCL,-(SP)
PCH,-(SP)
PSTAT,-(SP)
#3,CMD_CONTROL
;CHECK THAT 68302 IS IN
;SUPERVISOR MODE
;FLAG THE PROBLEM
;GO BACK TO MONITOR LOOP
;RESTORE USER STACK POINTER
;RESTORE REGISTERS
;PUSH PCL
;PUSH PCH
;PUSH STATUS
;RETURN TO USERS PROGRAM
; END OF THE MONITOR EXIT ROUTINE
; WRITE TARGET MEMORY ACCESS ROUTINE
;
THIS ROUTINE WRITES DATA TO TARGET SYSTEM MEMORY.
;
THE DATA WAS LOADED INTO THE ’XFER_BUF’ BY THE EMULATION CONTROLLER.
;
THE STARTING ADDRESS OF THE WRITE PROCESS WAS LOADED INTO
;
’TARG_START’ BY THE EMULATION CONTROLLER. THE LOWER BYTE OF THE
;
’TARG_BYTES’ VARIABLE CONTAINS THE NUMBER OF BYTES OF DATA WHICH
;
WILL BE WRITTEN TO TARGET MEMORY. IF BIT 11 OF THE ’TARG_BYTE’
;
FIELD IS SET THEN THE ACCESS MODE TO TARGET MEMORY IS WORDS. IF
;
BIT 11 IS NOT SET THEN THE ACCESS MODE IS BYTES. THE ’TARG_BYTE’
;
VARIABLE WAS SET BY THE EMULATION CONTROLLER.
;
TARG_MEM_WR
MOVE.L
MOVE.L
MOVE.W
CMP.W
BPL
TARG_BYTE_WR
AND.W
T_BYTE_LP_WR
MOVE.B
MOVE.B
NOP
SUB.W
BEQ
BRA
TARG_START,A0
#XFR_BUF,A1
TARG_BYTES,A2
#00800H,A2
TARG_WORD_WR
#007FFH,TARG_BYTES
(A1)+,D0
D0,(A0)+
#1,TARG_BYTES
TARG_WR_ACC_DONE
T_BYTE_LP_WR
TARG_WORD_WR
AND.W
#007FFH,TARG_BYTES
T_WORD_LP_WR
MOVE.W
(A1)+,A2
MOVE.W
A2,(A0)+
SUB.W
#2,TARG_BYTES
BEQ
TARG_WR_ACC_DONE
BRA
T_WORD_LP_WR
TARG_WR_ACC_DONE
MOVE.W
#3,CMD_CONTROL
BRA
MON_LOOP
; END OF WRITE TARGET MEMORY ACCESS ROUTINE
; READ TARGET MEMORY ACCESS ROUTINE
;
THIS ROUTINE READS DATA FROM TARGET SYSTEM MEMORY.
;
THE DATA IS STORED IN THE ’XFER_BUF’.
;
THE STARTING ADDRESS OF THE READ PROCESS WAS LOADED INTO
;
’TARG_START’ BY THE EMULATION CONTROLLER. THE LOWER BYTE OF THE
;
’TARG_BYTES’ VARIABLE CONTAINS THE NUMBER OF BYTES OF DATA WHICH
;
WILL BE READ FROM TARGET MEMORY. IF BIT 11 OF THE ’TARG_BYTE’
;
FIELD IS SET THEN THE ACCESS MODE TO TARGET MEMORY IS WORDS. IF
;
BIT 11 IS NOT SET THEN THE ACCESS MODE IS BYTES. THE ’TARG_BYTE’
;
VARIABLE WAS SET BY THE EMULATION CONTROLLER.
;
TARG_MEM_RD
Concepts 5-25
MOVE.L
MOVE.L
MOVE.W
CMP.W
BPL
TARG_START,A0
#XFR_BUF,A1
TARG_BYTES,A2
#00800H,A2
TARG_WORD_RD
; PROCESS IN BYTES
TARG_BYTE_RD
AND.W
T_BYTE_LP_RD
MOVE.B
MOVE.B
SUB.W
BEQ
BRA
#007FFH,TARG_BYTES
(A0)+,D0
D0,(A1)+
#1,TARG_BYTES
TARG_RD_ACC_DONE
T_BYTE_LP_RD
;; PROCESS IN WORDS
TARG_WORD_RD
AND.W
T_WORD_LP_RD
MOVE.W
MOVE.W
SUB.W
BEQ
BRA
#007FFH,TARG_BYTES
(A0)+,D0
D0,(A1)+
#2,TARG_BYTES
TARG_RD_ACC_DONE
T_WORD_LP_RD
TARG_RD_ACC_DONE
MOVE.W
#3,CMD_CONTROL
BRA
MON_LOOP
; END OF READ TARGET MEMORY ACCESS ROUTINE
;;;;;;;;;;;;;;;;;;;
;; MONITOR ENTRY ;;
;;;;;;;;;;;;;;;;;;;
MON_ENT
CMP.L
BMI
CMP.L
BPL
RTE
BREAK_OK
MOVE
MOVE
MOVE
INT_JUMP_ENTRY
MOVEM.L
MOVE
BTST
BNE
MOVE.W
BRA
MODE_OK
MOVE.L
5-26 Concepts
#MONITOR_START,2(A7)
BREAK_OK
#MONITOR_END,2(A7)
BREAK_OK
;LOOK FOR BREAK WHILE
;ALREADY IN THE MONITOR
;STACK ADDRESS LESS THAN
;MONITOR_START
;STACK ADDRESS GREATER THAN
;MONITOR_END
;ALREADY IN THE MONITOR
(SP)+,PSTAT
(SP)+,PCH
(SP)+,PCL
;SAVE STATUS REGISTER PRIOR TO ENTRY
;SAVE PC PRIOR TO ENTRY
;STACK IS AS IT WAS BEFORE
D0-D7/A0-A7,PREGS
SR,D0
#13,D0
MODE_OK
#10H,LAST_ENTRY
MON_LOOP
;SAVE REGISTERS
;VERIFY SUPERVISOR MODE OPERATION
USP,A0
;SAVE USER STACK POINTER
;FLAG THE PROBLEM
;GO TO MONITOR LOOP
MOVE.L
MOVE.W
;
;
;
;
;
;
;
A0,PUSP
#3,CMD_CONTROL
SET STATUS REGISTER AS IT WAS
PRIOR TO MONITOR ENTRY
MOVE.W
OR
MOVE.W
AND
MOVE.W
JMP
PSTAT,D0
#0F8FFH,D0
SR,D1
D1,D0
D0,SR
MON_LOOP
; MONITOR CONTROL LOOP
;
THE FOREGROUND MONITOR WAITS IN THIS LOOP UNTIL THE EMULATOR
;
CONTROLLER REQUESTS AN ACTION BY SETTING CMD_CONTROL TO 1
;
MON_LOOP
MOVE.W
CMP.W
BEQ
BRA
CMD_CONTROL,D0
#1,D0
COMMAND_REQUEST
MON_LOOP
;COMMAND HAS BEEN REQUESTED
; COMMAND_REQUEST
;
WHEN A COMMAND HAS BEEN REQUESTED, THIS ROUTINE DETERMINES THE
;
TYPE OF COMMAND REQUESTED AND INITIATES THE APPROPRIATE ACTION
COMMAND_REQUEST
MOVE.W
MOVE.W
MOVE.W
CMP.W
BEQ
CMP.W
BEQ
CMP.W
BEQ
CMP.W
BEQ
BRA
#0,CMD_RESULT
#2,CMD_CONTROL
CMD_TYPE,D0
#1,D0
SW_IN_MON
#2,D0
START_EXIT
#4,D0
TARG_MEM_WR
#8,D0
TARG_MEM_RD
ILL_CTRL_REQ
;CLEAR OUT RESULT VARIABLE
;SET TO INDICATE COMMAND PROCESSING STARTED
;IN MONITOR OPERATION VERIFICATION
;START MONITOR EXIT PROCESS
;PERFORM TARGET MEMORY ACCESS WRITES
;PERFORM TARGET MEMORY ACCESS READS
;;;;;;;;;;;;;;;;;;;;;;;;;;;;;;;;;;;;;;;;;;;;;;;;;;;
; COMMAND ERROR LOOP
ILL_CTRL_REQ
BRA ILL_CTRL_REQ
;;;;;;;;;;;;;;;;;;;;;;;;;;;;;;;;;;;;;;;;;;;;;;;;;;;
; FG_RESET_ENTRY IS THE ENTRY ROUTINE THAT A RESET: INITITAL PC
;
IN THE USERS EXCEPTION VECTOR TABLE SHOULD POINT TO IF THE
;
USER WANTS THE EMULATOR TO VECTOR TO THE FOREGROUND MONITOR
;
FROM TARGET SYSTEM RESETS.
;
THIS ROUTINE CLEARS OUT THE REGISTERS D7-D0 AND A6-A0.
;
THE STATUS REGISTER IS SET TO 2700H.
;
THE PC IS SET TO JUMP_ENTRY
;
THE A7 REGISTER, THE SUPERVISOR STACK POINTER AND THE USER
;
STACK POINTER ARE SET TO THE VALUE OF THE SSP AS THE EMULATOR
;
IS RELEASED FROM TARGET RESET.
FG_RESET_ENTRY
MOVE.W
MOVE.L
MOVE.W
CLR.L
#01H,LAST_ENTRY
#JUMP_ENTRY,CURRENT_PC
#2700H,PSTAT
PD0
;SET ENTRY CAUSE
;SET COPY OF PC
;SET STATUS
;CLEAR REGISTERS
Concepts 5-27
CLR.L
CLR.L
CLR.L
CLR.L
CLR.L
CLR.L
CLR.L
CLR.L
CLR.L
CLR.L
CLR.L
CLR.L
CLR.L
CLR.L
MOVE.L
MOVE.L
MOVE.L
BRA
BERR_ENTRY
MOVE.W
BRA
ADDR_ERR_ENTRY
MOVE.W
BRA
ILL_INST_ENTRY
MOVE.W
BRA
ZERO_D_ENTRY
MOVE.W
BRA
CHK_I_ENTRY
MOVE.W
BRA
TRAPV_ENTRY
MOVE.W
BRA
PRIV_V_ENTRY
MOVE.W
BRA
TRACE_ENTRY
MOVE.W
MOVE.W
BRA
EMUL_1010_ENTRY
MOVE.W
BRA
EMUL_1111_ENTRY
MOVE.W
BRA
JUMP_ENTRY
MOVE.W
BRA
PD1
PD2
PD3
PD4
PD5
PD6
PD7
PA0
PA1
PA2
PA3
PA4
PA5
PA6
A7,PA7
A7,USP
A7,PUSP
MON_LOOP
;SET EMULATOR COPY OF SSP
;SET USP TO SAME AS SSP
;SET EMULATOR COPY OF USP
#04H,LAST_ENTRY
SPECIAL_ENTRY
#05H,LAST_ENTRY
SPECIAL_ENTRY
#06H,LAST_ENTRY
MON_ENT
#07H,LAST_ENTRY
MON_ENT
#08H,LAST_ENTRY
MON_ENT
#09H,LAST_ENTRY
MON_ENT
#0AH,LAST_ENTRY
MON_ENT
#0BH,STEP_ENTRY
#0BH,LAST_ENTRY
MON_ENT
#0CH,LAST_ENTRY
MON_ENT
#0DH,LAST_ENTRY
MON_ENT
#0EH,LAST_ENTRY
INT_JUMP_ENTRY
BK_RESET_PROCESS
MOVE.W
#0,CMD_RESULT
MOVE.W
#2700H,PSTAT
BRA
MON_LOOP
;SET STATUS
; SPECIAL ENTRY IS EXECUTED WHEN THE MONITOR IS ENTERED FROM A BERR
;
OR AN ADDRESS ERROR. INFORMATION STACKED AS A RESULT OF THE
;
BERR OR ADDRESS ERROR IS SAVED IN STAT1, STAT2, STAT3 AND STAT4.
5-28 Concepts
SPECIAL_ENTRY
MOVE
MOVE
MOVE
MOVE
BRA
(SP)+,STAT1
(SP)+,STAT2
(SP)+,STAT3
(SP)+,STAT4
MON_ENT
;PULL
;PULL
;PULL
;PULL
&
&
&
&
SAVE
SAVE
SAVE
SAVE
EXCEPTION STATUS.
ACCESS ADDRESS HIGH.
ACCESS ADDRESS LOW.
INSTRUCTION REGISTER.
MONITOR_END
Concepts 5-29
Notes
5-30 Concepts
A
Syntax for the MC68302 Emulator
The Terminal Interface Reference describes the syntax for commands
which are common to all HP 64700-series emulators.
This chapter contains information about syntax items that are specific
to the MC68302 emulator. These include:
ADDRESS
CONFIGURATION ITEMS
MODE
REGISTERS
ANALYZER INPUTS
Syntax for the MC68302 Emulator A-1
Notes
A-2 Syntax for the MC68302 Emulator
ADDRESS
Summary Address specifications in run and memory modification
Syntax
Description The MC68302 emulator provides the capability to specify function
code information in addition to the numerical address. This allows you
to specify separate regions of memory for user and supervisor program
and data space.
All address specifications are of the form:
<EXPR>@FC
Expressions are defined in the Terminal Interface Reference. For
address specifications, any number specified in the expression defaults
to hexadecimal unless specifically identified as another base.
The @ symbol is required if you specify a function code. Otherwise, it
must be omitted.
ADDRESS A-3
The function code (FC) may be any one of the following:
Function Code
A-4 ADDRESS
Description
u
User
s
Supervisor
d
Data
p
Program
ud
User Data
up
User Program
sd
Supervisor Data
sp
Supervisor Program
x
don’t care
Examples These are some examples of correct address specifications, both with
and without function codes, shown in the context of the m (memory)
command:
M>m 400..40f@sd
0000400..000040f@sd
08 08 08 01 08 00 0c 01 00 00 08 01 00 08 01 01
M>m 200..20f@d
0000200..000020f@d
00 00 00 00 04 08 0c 01 08 00 00 00 08 00 0d 01
M>m 400..40f@up
0000400..000040f@up
08 00 08 00 09 00 00 01 00 00 0c 00 09 08 01 00
M>m 000..00f
0000000..000000f
00 00 80 00 11 08 88 09 08 00 08 00 0c 00 0d 00
In the last memory display, we can specify part of the range 0 through
1ffh without specifying a function code, because no other range
numerically overlaps this range.
Related Commands Refer to the <EXPR> command in the Terminal Interface Reference
for additional information about specifying expressions.
ADDRESS A-5
Notes
A-6 ADDRESS
CONFIG_ITEMS
Summary Emulator configuration items
Syntax cf <item name>=<value>
Description The MC68302 emulator has several dedicated configuration items
which allow you to specify the emulator interaction with the target
system and the rest of the emulation system. These items are:
ba
Enables or disables bus arbitration.
bbk
Use with dbc to define A23-A16 during
background monitor execution.
be
Enables or disables emulation processor
response to target system /BERR signal.
bfc
Defines function code values during
background monitor execution.
clk
Selects the internal or external emulation clock.
cs0_dtk-cs3_dtk
Selects internal or external /DTACK for chip
select.
dbc
Enables or disables driving signals to the target
system during background monitor execution.
dti
Enables or disables /DTACK interlock.
iack7
Selects configuration for IACK7 pin.
im
Selects normal (IPL) or dedicated (IRQ)
interrupt mode.
int7
When im=ded, selects level mode or edge mode
for IRQ7 interrupts.
CONFIGURATION ITEMS A-7
lfc
Selects a function code for file loading.
mon
This selects a foreground or background
monitor.
pdw
Selects 8/16-bit processor data bus width.
rrt
Restricts the emulator to real-time runs.
rssp
Sets SSP value upon reset.
swtp
Selects which trap instruction to use.
ti
Enables or disables target system interrupts.
trc_dma
Enables or disables tracing of DMA cycles, or
enables generation of an analyzer state for each
bus arbitration sequence.
Explanations of selected configuration items are included in chapter 4.
Examples To display the current configuration item settings, enter:
M>cf
To select an external clock source, enter:
M>cf clk=ext
Related Commands help cf
Refer to the cf command in the Terminal Interface Reference. Also,
refer to chapter 4 of this manual for information about each
configuration item.
A-8 CONFIGURATION ITEMS
MODE
Summary Memory access/display modes
Syntax
Description Each emulator allows you to access memory in several different ways
for memory display and modification. The size of the access is set
using the mo command. There are two types of mode settings.
Display Mode
Display mode defines how the emulator displays or modifies memory.
The MC68302 emulator allows the following access modes:
l
long word (four bytes)
w
word (two bytes) display mode
b
byte display mode
m
mnemonic display mode
The mnemonic display mode allows you to display memory
disassembled into processor instruction mnemonics using the m
command. If you specify mnemonic display mode and then perform a
memory modification, search for a value, or execute any other
command that references the display mode, the command will behave
as if "byte" display mode were in effect.
Access Mode
Access mode defines how the emulator accesses target system memory.
The MC68302 emulator allows the following access modes:
w
word (double byte) access mode
b
byte access mode
MODE A-9
The emulation monitor uses the access mode to determine whether to
use byte or word instructions during target system memory accesses,
such as for memory modification or display. (It does not affect how
that data is displayed on screen. That is controlled by the display
mode.)
Defaults At powerup or after init, the default access and display modes are set to
w (word).
Examples These are some examples of the different display modes using the
memory display command:
R>m -dm 1000..101f@u
0001000@u init
0001004@u process_comm
0001008@u 000100c@u 0001010@u 0001014@u 0001018@u 000101c@u -
MOVEA.L
CMPI.B
BEQ.W
CMPI.B
BEQ.W
BRA.W
MOVE.B
MOVEA.L
0002000,A3
#041,D0
0001018
#042,D0
0001026
0001034
#011,D0
#000002004,A0
R>m -db 1000..101f@u
0001000..000100f@u
0001010..000101f@u
26 78 20 00 0c 00 00 41 67 00 00 0e 0c 00 00 42
67 00 00 14 60 00 00 1e 10 3c 00 11 20 7c 00 00
R>m -dw 1000..101f@u
0001000..000100f@u
0001010..000101f@u
2678 2000 0c00 0041 6700 000e 0c00 0042
6700 0014 6000 001e 103c 0011 207c 0000
R>m -dl 1000..101f@u
0001000..000100f@u
0001010..000101f@u
26782000 0c000041 6700000e 0c000042
67000014 6000001e 103c0011 207c0000
Related Commands help mo
Refer to the mo command in the Terminal Interface Reference for
additional information about using the "mode" command.
A-10 MODE
REGISTERS
Summary MC68302 register designators
Description The reg command allows you to display individual processor registers
or groups of registers defined by a <REG_CLASS> identifier.
The MC68302 emulator supports the display and modification of these
register classes:
*
This represents all of the MC68302 registers.
302
This class represents various MC68302 (BAR,
SCR, CR) and serial interface registers.
idma
This represents the IDMA controller registers.
interrupt
This class represents the interrupt controller
registers.
pio
These represent the port data and control
registers.
chip_sel
These represent the chip select registers.
tmr
These represent the timer registers.
scc
These represent all of the serial communication
controllers.
sccn
These represent the registers for each serial
communication controller.
Examples To display the basic set of MC68302 registers, enter:
REGISTERS A-11
M>reg
reg
reg
reg
reg
pc=00000000 st=2700 d0=00000000 d1=00000000 d2=00000000 d3=00000000
d4=00000000 d5=00000000 d6=00000000 d7=00000000 a0=00000000 a1=00000000
a2=00000000 a3=00000000 a4=00000000 a5=00000000 a6=00000000 a7=00000009
usp=00000000 ssp=00000009 bar=bfff scr=00000f00
To display the MC68302 interrupt registers, enter:
M>reg interrupt
reg gimr=0000 ipr=0000 imr=0000 isr=0000
Related Commands help reg
Type help reg to see a list of the registers you may display.
Refer to the reg command in the Terminal Interface Reference for
additional information about displaying and modifying registers.
A-12 REGISTERS
ANALYZER
INPUTS
Analyzer Input Line
(address field)
AD0
AD1
AD2
AD3
AD4
AD5
AD6
AD7
AD8
AD9
AD10
AD11
AD12
AD13
AD14
AD15
AD16
AD17
AD18
AD19
AD20
AD21
AD22
AD23
Signal Name
A(0)
A(1)
A(2)
A(3)
A(4)
A(5)
A(6)
A(7)
A(8)
A(9)
A(10)
A(11)
A(12)
A(13)
A(14)
A(15)
A(16)
A(17)
A(18)
A(19)
A(20)
A(21)
A(22)
A(23)
Description
Address Lines 1-23
ANALYZER INPUTS A-13
Analyzer Input Line
(status field)
AD24
AD25
AD26
AD27
AD28
AD29
AD30
AD31
AD32
AD33
AD34
AD35
AD36
AD37
AD38
AD39
AD40
AD41
AD42
AD43
AD44
AD45
AD46
AD47
stat(0)
stat(1)
stat(2)
stat(3)
stat(4)
stat(5)
stat(6)
stat(7)
Signal Name
or Equate Name
Description
byte/word
read/write
in_cyc/ext_cyc
FC0
FC1
FC2
dma
bgd/fgd
6800 (8-bit) mode
Processor read/write
Processor IAC
Function code bit 0
Function code bit 1
Function code bit 2
Internal or external DMA (low)
Background/foreground monitor. Becomes analyzer
qualifier FG_H.
D0
D1
D2
D3
D4
D5
D6
D7
D8
D9
D10
D11
D12
D13
D14
D15
Processor data lines 0-15
A-14 ANALYZER INPUTS
Analyzer Input Line
(extra field)
Equate Name
Description
These bits are available only on 64-channel analyzers.
They are not available on 48-channel analyzers.
Note that these inputs are accessed via the "extra" label.
AD48
AD49
AD50
AD51
AD52
AD53
AD54
AD55
AD56
AD57
AD58
AD59
AD60
AD61
AD62
AD63
int_dma/ext_dma
bclr
cs3
cs2
cs1
cd0
berr
grd
rom
pb8_l/pb8_h
pb9_l/pb9_h
pb10_l/pb10_h
pb11_l/pb11_h
External DMA_L
Processor BCLR_L
Processor CS3
Processor CS2
Processor CS1
Processor CS0
Processor BERR_L
GRDAC_L
ROMAC_L
Processor PB8
Processor PB9
Processor PB10
Processor PB11
Target IPL0
Target IPL1
Target IPL2
-
ANALYZER INPUTS A-15
Notes
A-16 ANALYZER INPUTS
B
Messages
These messages may appear while using the HP 64746 MC68302
emulator. Messages are listed in numerical order.
Error messages numbered 200 and above are common to all HP
64700-Series emulators and are listed in the Terminal Interface
Reference.
1
I/O port access not supported
See Terminal Interface Reference.
2
Invalid word access for odd address
Word accesses are allowed only for even addresses.
3
Invalid word access for odd number of bytes
Specify an even number of bytes for a word access, or use
byte access instead (use mo -ab).
20
Attempt to change foreground monitor map term
See Terminal Interface Reference.
21
Insufficient emulation memory
You need to map a smaller area of emulation memory.
40
Restricted to real time runs
See Terminal Interface Reference.
61
Emulator is in the reset state
See Terminal Interface Reference.
Messages B-1
62
Reset encountered while in monitor
The emulator encountered a target system reset while
running in the motor.
80
Stack pointer is odd
See Terminal Interface Reference.
81
Stack is in guarded memory
See Terminal Interface Reference.
82
Stack is in target ROM
See Terminal Interface Reference.
83
Stack is in emulation ROM
See Terminal Interface Reference.
84
Program counter is odd
See Terminal Interface Reference.
107
Monitor failure; bus error
See Terminal Interface Reference.
140
Supervisor stack pointer not initialized
Use reg ssp=value to set the SSP. If you type cf
rssp=value, the SSP will be re-initialized automatically
whenever the emulator is reset.
141
Foreground monitor operating in USER mode
The foreground monitor must be run in supervisor mode.
142
Supervisor stack in guarded memory at xxxxxxxx
You need to map the supervisor stack to emulator or target
RAM. Remember to place the supervisor stack where it
will not collide with the vector table.
143
B-2 Messages
Supervisor stack is in ROM at xxxxxxxx
You need to map the supervisor stack to emulator or target
RAM. Remember to place the supervisor stack where it
will not collide with the vector table.
145
BERR occurred during background operation
One possible cause is that you are not driving background
cycles to the target system, and a watchdog timer went off.
146
BERR during background access to supervisor stack
A BERR occurred while the monitor was looking at the
stack to determine the PC value (this happens just after
breaking into the monitor).
147
RESET during background operation
The target was reset while the emulator was operating in
background mode.
148
cf int7 must be lev if cf im=nor
The target system interrupt mode is set to normal, so there
is no such thing as IRQ7. Either set cf int7=lev or cf
im=ded.
149
register modify would cause chip select address decode
conflict
The chip select register modify you just attempted would
cause two or more chip selects to be enabled and
overlapping.
150
bar register must not map internal memory to 0
If internal memory were mapped to 0, the vector table
along with the BAR and SCR registers would be
overwritten.
Messages B-3
151
HP 64170A has missing memory module:
bank <bank number>
Make sure the HP 64170 memory board has at least one
memory module installed in bank 0. It is not required for
bank 1 to have a memory module. This must be corrected
for the emulator to function correctly.
An example showing an empty bank (bank 1), viewed
with the ver command, is:
HP 64746 (PPN: 64746A) Motorola 68302 Emulator
Version:
A.00.03 24Jun91
Control:
HP64170A Memory Control Board
Memory:
0 KBytes
Bank 0: HP64171A/C 256 KByte Memory Module
Bank 1: Empty
Bank 2: Empty
Bank 3: Empty
152
HP 64170A has mixed memory modules:
banks 0, <bank number>
The memory modules loaded on the memory board can be
256 Kbyte modules or 1 Mbyte modules, but not a
combination of both types. Mixing the two types of
memory modules is not allowed. This must be corrected
for the emulator to function correctly.
An example showing an invalid mixing of modules,
viewed with the ver command, is:
HP 64746 (PPN: 64746A) Motorola 68302 Emulator
Version:
A.00.03 24Jun91
Control:
HP64170A Memory Control Board
Memory:
0 KBytes
Bank 0: HP64171A/C 256 KByte Memory Module
Bank 1: HP64171B/D 1024 KByte Memory Module
Bank 2: Empty
Bank 3: Empty
153
HP 64170A has unrecognized memory module:
bank <bank number>
The HP 64170 memory board has detected an unusable
memory module. Verify that a memory module is installed
in the bank in question. If the correct memory module is
installed, or if there is no memory module installed, a
B-4 Messages
hardware fault may be present. This must be corrected for
the emulator to function properly.
An example showing an unrecognized memory module,
viewed with the ver command, is:
HP 64746 (PPN: 64746A) Motorola 68302 Emulator
Version:
A.00.03 24Jun91
Control:
HP64170A Memory Control Board
Memory:
0 KBytes
Bank 0: HP64171A/C 256 KByte Memory Module
Bank 1: Unrecognized Memory Module
Bank 2: Empty
Bank 3: Empty
154
Unable to find emulation memory
The emulator cannot determine which emulation memory
board is installed. This is a hardware fault, and must be
corrected for the emulator to function correctly. Contact
your HP Representative.
Error messages numbered 200 and above are common to all HP
64700-Series emulators and are listed in the Terminal Interface
Reference.
Messages B-5
Notes
B-6 Messages
C
MC68302 Specifications and Characteristics
General
Specifications
Processor
Compatibility
This chapter lists the specifications and characteristics for the
HP 64746 MC68302 emulator/analyzer with external analyzer, and for
the HP 64746 emulator probe.
The HP 64746 is compatible with the Motorola 68302 microprocessor
with clock speeds up to 20.0 MHz, and any other microprocessors that
comply with the specifications of the Motorola 68302. The HP 64746
supports the MC68302 in either 8 or 16 bit mode. CPU disable mode
is not supported.
Electrical
Maximum Clock Speed
The maximum external clock speed is at least 20 MHz for the HP
64746 emulator. No wait states are required for emulation or target
system memory. (The internal clock speed is 16 MHz.)
Power
The emulator draws an additional 40 milliamps from the target system
when operating at 16.67 MHz.
Inputs/Outputs
The emulator loads the processor lines with an additional 50
picofarads, except for the clockout signal, which is 20 picofarads.
MC68302 Specifications and Characteristics C-1
Physical
Emulator Dimensions
325 mm width x 125 mm height x 354 mm depth (12.8 in. x 4.9 in. x
14 in.).
Note
Dimensions are for general information only. If dimensions are
required for building special enclosures, contact your HP sales
representative.
Emulator Weight
HP 64746: 6.7 kg (14.7 lb). With external analyzer: 7.2 kg (15.9 lb).
(Any component used in suspending the emulator must be rated for 65
lb capacity.)
Cable Length
Emulator to target system, approximately 600 mm (2 feet).
Environmental
Temperature
Operating, 0 to +40 C (+32 F to +131 F); nonoperating, -40 C to +70 C
(-40 F to +158 F).
Altitude
Operating, 4600 m (15 000 ft); nonoperating, 15 300 m (50 000 ft).
Relative Humidity
15% to 95%.
C-2 MC68302 Specifications and Characteristics
Regulatory
Compliance
Safety Approvals
Self-certified to UL 1244, IEC 348, CSA 556B.
BNC (labeled
TRIGGER IN/OUT)
Output Drive
Driven active high only = +2.4 V into a 50 ohm load.
Input
Input signal must drive approximately 4 mA at 2 V. Edge sensitive.
Minimum pulse width is approximately 25 ns.
Communications
Host Port
25-pin female type "D" subminiature connector.
RS-232-C DCE or DTE to 38.4 kbaud.
RS-422 DCE only to 460.8 kbaud.
Auxiliary Port
25-pin female type "D" subminiature connector.
RS-232-C DCE only to 19.2 kbaud.
CMB Port
9-pin female type "D" subminiature connect.
MC68302 Specifications and Characteristics C-3
Emulator Probe
Characteristics
Unbuffered Signals
These specifications are for an emulator with a clock speed of 16.67
MHz.
The following signals are unbuffered to the target system: /RESET,
/HALT, PB1-PB11, PA0-PA15, RXD1, TXD1, RCLK1, TCLK1,
/CD1, /CTS1, /RTS1, BRG1, BCLR, /RMC, IAC.
Data Inputs
One 74FCT245A load per bit plus 50 pf capacitance.
Address and
Function Codes
One 74FCT245A load per bit plus 50 pf capacitance.
Clocks
Chip Selects
Interrupts
Other Signals
One 74ACT load per bit plus 20 pf capacitance.
One 74FCT244A load per bit plus 50 pf capacitance.
One F load per bit plus a 3.3K pullup and 50 pf capacitance.
/FRZ, /AVEC, BUSW are 74ALS inputs plus 50 pf capacitance.
/DTACK, /BR, /BG, /BGACK have a 5 ns pal path to the processor.
/UDS, /LDS, /AS, R/W have a 5 ns pal path to the processor plus a
3.3K pullup and 50 pf capacitance.
Bus Error is either connected to the target system unbuffered or totally
disconnected from the target.
C-4 MC68302 Specifications and Characteristics
The emulator specifications for "worst case" and "typical" are a
function of loading in the target system. Actual performance may be
worse than "worst case" if the loading is above Motorola specifications
for the processor.
Processor
Num
Description
Emulator
Worst
Typical
Unit
Symbol
Min Max Min Max Min Max
1
Clock Period
MHz
f
8
16.7 8
16.7 -
-
2,3
Clock Pulse Width
ns
Tcvc
60
125
60
125
-
-
4,5
Clock Rise and Fall times
ns
Tcr,Tcf
-
5
-
5
-
-
5a
EXTAL to CLK0 Delay
ns
Tcd
2
11
16
29
18
-
6
Clock High to FC, Addr valid
ns
Tchfcadv
-
45
9
59
5
40
7
Clock High to addr, data - Z
ns
Tchadz
-
50
-
-
-
-
8
Clock High to addr, fc invalid
ns
Tchafi
0
-
0
-
0
-
9
Clock High to AS, DS asserted
ns
Tchsl
3
30
5
50
8
23
11
Addr, FC valid to AS,DS (READ)
AS (WRITE) asserted
ns
Tafcvsl
15
-
13
-
20
-
12
Clock low to AS,DS negated
ns
Tslsh
-
30
-
35
-
20
13
AS,DS negated - Addr,FC invalid
ns
Tshafi
15
-
12
-
20
-
14
AS,(DS read) width asserted
ns
Tsl
120
-
110
-
-
120
14A
DS width asserted (write)
ns
Tdsl
60
-
50
-
60
-
15
AS,DS width Negated
ns
Tsh
60
-
55
-
65
-
16
Clock High to Control Bus Z
ns
Tchcz
-
50
-
50
-
50
17
AS,DS negated to R/W invalid
ns
Tshrh
15
-
5
-
10
-
MC68302 Specifications and Characteristics C-5
18
Clock High to RW high
ns
Tchrh
-
30
-
40
-
30
20
Clock High to RW low
ns
Tchrl
-
30
-
40
-
30
21
Addr, FC valid to RW low
ns
Tafcvfl
15
-
10
-
20
-
22
RW low to DS asserted write
ns
Trlsl
30
-
25
-
32
-
23
Clock low to Data Out valid
ns
Tcldo
-
30
-
40
-
35
25
AS,DS negated to data invalid
ns
Tshdoi
15
-
10
-
16
-
26
Data Out to DS asserted write
ns
Tdosl
15
-
10
-
16
-
27
Data Valid to Clock low (setup)
ns
Tdicl
7
-
21
-
15
-
28
AS,DS negated to DTACK negated
ns
Tshdah
0
110
0
90
0
100
29
AS,DS negated to Data in (hold)
ns
Tshdii
0
-
0
-
0
-
30
AS,DS negated to BERR negated
ns
Tshdeh
0
-
0
-
0
-
31
DTACK asserted to data in-setup
ns
Tdaldi
-
50
43
-
49
-
32
Halt, Reset input transition
ns
Trhr,
Trhf
-
150
-
150
-
<150
33
Clock High to BG asserted
ns
Tchgl
-
30
-
45
-
40
34
Clock High to BG negated
ns
Tchgh
-
30
-
60
-
40
35
BR asserted to BG asserted
clks
Tbrlgl
2.5
4.5
2.5
4.5
2.5
4.5
36
BR negated to BG negated
clks
Tbrhgh
1.5
2.5
1.5
2.5
1.5
2.5
37
BGACK asserted to BG negated
clks
Tgalgh
2.5
4.5
2.5
4.5
2.5
4.5
37A
BGACK asserted to BR negated
ns/
clks
Tgalbrh
10
1.5
20
1.5
10
1.5
38
BG asserted to high Z
ns
Tglz
-
50
-
50
-
50
C-6 MC68302 Specifications and Characteristics
39
BG width negated
clks
Tgh
1.5
-
1.5
-
1.5
-
44
AS,DS negated to AVEC negated
ns
Tshvph
0
50
0
30
0
40
46
BGACK width low
clks
Tgal
1.5
-
1.5
-
1.5
-
47
Async input setup time
ns
Tasi
10
-
20
-
15
-
48
BERR asserted to DTACK asserted
ns
Tbeldal
10
-
20
-
15
-
53
Data Out hold from clock high
ns
Tchdoi
0
-
0
-
0
-
55
RW asserted to Data bus change
ns
Trldbd
0
-
0
-
0
-
56
HALT,RST pulse width
clks
Thrpw
10
-
10
-
10
-
57
BGACK negated to AS,DS,RW drive clks
Tgasd
1.5
-
1.5
-
1.5
-
57A
BGACK negated to FC driven
clks
Tgafd
1
-
1
-
1
-
58
BR negated to AS,DS,RW driven
clks
Trhsd
1.5
-
1.5
-
1.5
-
58A
BR negated to FC driven
clks
Trhfd
1
-
1
-
1
-
60
Clock high to BCLR asserted
ns
Tchbcl
-
30
-
45
-
35
61
Clock high to BLCR negated
ns
Tchbch
-
30
-
45
-
35
62
Clock low to RMC asserted
ns
Tclrml
-
30
-
45
-
35
63
Clock high to RMC negated
ns
Tchrmh
-
30
-
45
-
35
64
RMC negated to BG asserted
ns
Trmhgl
-
30
-
45
-
35
"High Z" or "Z" means high impedance.
MC68302 Specifications and Characteristics C-7
Notes
C-8 MC68302 Specifications and Characteristics
Index
/DTACK interlock, 4-10
A
absolute files, 2-8
HP, 2-8
Intel hex, 2-8
Motorola S-records, 2-8
Tektronix hex, 2-8
access mode, A-9
address lines driven during background, 4-6
address ranges
overlaying, 3-7
address syntax, A-3
addresses, reserved, 1-6
analyzer
branch qualifiers, 3-15
break on measurement complete, 3-28
clock speed, 5-10
complex configuration, 3-14, 3-18
configuration, 2-27
configuration commands, 4-3
display larger trace list range, 3-26
display trace list, 3-21
effect of 68302 prefetch on, 3-22
fixing prefetch problem, 3-23
function codes, 3-15
global storage qualifiers, 3-19
halting, 2-28
labels, 5-13
number of channels, 5-13
pattern names, 3-18
pipeline, 2-28
primary branch qualifier, 3-19
range variables, 3-18
secondary branch qualifier, 3-17
sequencer, 3-14
signal labels, 3-18
Index-1
analyzer (cont.)
starting the trace, 3-21
storage qualifiers, 3-15, 3-19
storage specification, 2-26/2-27
storing execution between certain states, 3-15
trace, 2-26
trace list display, 2-27
trace list format, 2-27
trace tag counter, 3-20
trigger position, 3-24
trigger specification, 2-26
trigger term specification, 3-19
analyzer inputs, A-13
analyzer label "stat", 5-13
analyzer trace
starting, 2-27
analzyer
storage qualifiers, 3-14
assembler/linker/librarian, 2-8
assembling programs, 2-20
B
2-Index
b Command, 2-24, 3-14
background
address driven, 4-6
driving target system during, 4-9
background function codes driven, 4-7
background monitor, 5-17
selecting, 4-13
BAR register, 1-6/1-7
bc Command, 2-14, 3-28/3-30, 5-4
before using the emulator, 2-1
BERR signal, 4-6
BNC characteristics, C-3
BNC trigger signal
break on receipt, 3-29
bp command, 3-29, 5-4
BR0-BR3 registers, 4-9
BR0-BR3 registers, 1-7
break
BNC trigger, 3-29
CMB trigger, 3-29
conditions, 3-28
break (cont.)
defining, 3-28
effect of processor prefetch, 3-30
emulator, 3-14
on trigger signal, 3-28
software breakpoints, 3-29
software breakpoints TRAP instruction, 4-17
trig1 signal, 3-28
trig2 signal, 3-29
write to ROM, 3-30
break conditions, 5-4
building command files, 3-11
bus arbitration
configure emulator’s response, 4-5
bus arbitrations
using configuration to isolate target problem, 4-6
bus error response by emulator, 4-6
bus width, 4-15, 5-3
C
cautions
equipment damage, 1- 10, 1-13
possible damage to target system, 2-2, 4-16
possible loss of information, 2-5
possible damage to emulator probe, 5-10
cf ba command, 4-5
cf bbk command, 4-6
cf be command, 4-6
cf bfc command, 4-7
cf clk command, 4-8
cf Command, 2-13, 4-3
cf csx_dtk command, 4-9
cf dbc command, 4-9
cf dti command, 4-10
cf iack7 command, 4-11
cf im command, 4-11
cf int7 command, 4-12
cf lfc command, 3-10, 4-12
cf mon command, 4-13
cf pdw, 5-3
cf pdw command, 4-15
cf rrt command, 4-15
cf rssp Command, 2-17, 3-14, 4-16
Index-3
cf swtp command, 3-29, 4-17
cf ti command, 4-18
cf trc_dma command, 4-19
changing trigger position in trace list, 3-24
characteristics
BNC, C-3
communications, C-3
electrical, C-1
emulator, C-1
environmental, C-2
physical, C-2
characteristics of emulation probe, C-4
chip selects, 1-7, 4-9
clock selection for microprocessor, 4-8
CMB, 5-7
CMB trigger signal
break on receipt, 3-29
combined measurements, 3-30
combining commands with macros, 3-31
combining measurements
set initial conditions, 3-31
combining multiple macros, 3-32
command files
building, 3-11
complete emulator configuration, 3-13
loading, 3-13
command help, 2-6
command prompts, 2-23
commands
analysis, 1-16
analyzer configuration, 4-3
b, 2-24, 3-14
b (break), 2-24
bc, 2-14, 3-28/3-30, 5-4
bp, 3-29, 5-4
cf, 2-13, 4-3
cf ba, 4-5
cf bbk, 4-6
cf be, 4-6
cf bfc, 4-7
cf clk, 4-8
4-Index
commands (cont.)
cf csx_dtk, 4-9
cf dbc, 4-9
cf dti, 4-10
cf iack7, 4-11
cf im, 4-11
cf int7, 4-12
cf lfc, 3-10, 4-12
cf mon, 4-13
cf pdw, 4-15
cf rrt, 4-15
cf rssp, 2-17, 3-14, 4-16
cf swtp, 3-29, 4-17
cf ti, 4-18
cf trc_dma, 4-19
cmb, 5-7
configuration, 4-1
echo, 3-31
emulation, list of, 4-1
equ, 3-17, 3-23, 3-31, 5-12
help, 2-6
init, 2-13
init (initialize), 2-5
load, 2-21, 3-10
m, 2-18, 2-25, 3-12, 3-21
mac, 3-31/3-32
map, 2-16, 3-7
measurement, 4-1
mo, 3-14
r, 2-23, 2-25, 3-21
r (run), 2-23
reg, 2-25, 3-32
rep, 3-33
repeating, 3-33
rst, 2-23, 3-14
s, 3-32
ser, 3-34
system, 4-3
t, 2-27
tcf, 3-18
tcq, 3-20
Index-5
commands (cont.)
tf, 2-27, 3-20
tg, 2-27
tgout, 3-28
th, 2-28
tif, 3-19
tl, 2-27, 3-21
tlb, 3-18
tp, 3-24
tpat, 3-18, 3-23
trng, 3-18
tsq, 3-19
tsto, 2-27, 3-19
communications characteristics, C-3
comparison of foreground/background monitors, 5-17
complex analyzer configuration, 3-18
conductive pin guard
emulation probe, 5-9
configuration
/DTACK interlock, 4-10
address driven during background, 4-6
analyzer, 4-3
background cycles driven to target, 4-9
bus arbitration, 4-5
bus error response by emulator, 4-6
bus width, 4-15, 5-3
chip selects, 1-7, 4-9
clock selection, 4-8
displaying, 4-3
DMA tracing, 4-19
for getting started, 2-13
function codes driven during background, 4-7
interrupt mode, 4-11
IRQ7 mode, 4-12
measurement commands, 4-1
monitor selection, 4-13
PB0/IACK7, 4-11
processor to emulator/target system, 4-3
program load function codes, 4-12
restrict to real-time runs, 4-15
supervisor stack pointer, 4-16
6-Index
configuration (cont.)
syntax, A-7
system, 4-3
target system interrupts enable/disable, 4-18
TRAP instruction for breakpoint, 4-17
with command files, 3-13
configuration commands, 4-1
configuration items, A-7
connections
PGA socket, 1-8
QFP or PQFP, 1-10
target system, connecting to, 1-8
TQFP, 1-13
controlling terminal
with escape sequences, 3-31
coordinated measurement bus operation, 5-7
counting states, 3-20
coverage measurement not supported, 1-2
create macros, 5-5
D
data terminal
escape sequences, 3-31
define logical expressions, 5-12
Defining a stack pointer, 2-16
defining analyzer patterns, 3-18
defining equates, 3-17
defining macros, 3-31
defining ranges, 3-18
display mode, A-9
display mode for memory, 3-14
display trace
format, 3-20
displaying
configuration, 4-3
larger trace list range, 3-26
macro definitions, 3-33
memory, 2-25, 3-32
registers, 2-25, 3-32
trace list, 2-27, 3-21
DMA limitations, 4-5
driving background cycles to target system, 4-9
Index-7
DTACK interlock
needed for correct bus error response, 4-7
DTACK signal, 1-7, 4-9
dummy part, 1-10, 1-13
E
8-Index
echo
display measurement headers, 3-32
echo command, 3-31
echoing escape sequences, 3-31
effect of prefetch on analyzer, 3-22
electrical characteristics, C-1
emulation
components, 1-5
emulation probe
conductive pin guard, 5-9
pin protector, 5-9
emulator
bus error response, 4-6
characteristics, C-1
configuration, 2-13
initialization, 2-13
purpose, 1-1
running, 3-21
specifications, C-1
emulator features, 1-3
analyzer, 1-3
breakpoints, 1-4
clock speeds, 1-3
emulation memory, 1-3
processor reset control, 1-4
register display/modify, 1-3
restrict to real-time runs, 1-4
single-step processor, 1-3
supported microprocessors, 1-3
emulator limitations and restrictions, 4-5
emulator reset, 3-14
enable/disable target system interrupts, 4-18
environmental characteristics, C-2
equ command, 3-17, 3-23, 3-31
equates
16-bit, 5-13
defining, 3-17
equates (cont.)
dynamic modification in macros, 3-32
evaluated at command entry, 3-23
predefined, 5-12
predefined status, 3-17
predefining value for counter, 3-31
reentering other commands when modified, 3-23
equates for tag0-3, 5-12
equating values to labels, 3-17
error messages, B-1
errors
invalid option or operand, 2-3
escape sequences
for terminal, 3-31
using echo to send, 3-31
expressions
searching for, 3-34
extra label, 5-13
F
fixing prefetch problem w/analyzer, 3-23
foreground monitor, 5-18
address requirements, 4-14
interrupts during, 4-18
listing, 5-20
selecting, 4-13
transition to, 4-6/4-7
format for trace display, 3-20
fr2 signal, 5-18
function codes
memory mapping, 3-7
function codes, A-4
analyzer, 3-15
driven during background, 4-7
for loading programs, 3-10
for program loads, 4-12
need for separately linked modules, 3-8
G
global storage qualifiers, 3-19
Index-9
10-Index
H
halting the analyzer, 2-28
help command, 2-6
host computers
command files, 3-11
I
information help, 2-6
init Command, 2-13
initialization options, 2-5
initialize emulator, 2-5
Initializing the Emulator, 2-13
inserting software breakpoints, 3-29
interlock /DTACK, 4-10
interrupts
enable/disable from target system, 4-18
invalid option or operand error, 2-3
L
labeling analyzer signals, 3-18
limitations
DMA, 4-5
linking programs, 2-21
list of emulation commands, 4-1
load Command, 2-21, 3-10
loading programs, 3-9
loading programs, 2-17
changing function code for load, 3-10
for Standalone Configuration, 2-17
for Transparent Configuration, 2-19
function codes, 4-12
link supervisor/user modules separately, 3-1
load command, 2-21
transfer, 3-9
transfer utility, 2-19
logical expressions, 5-12
M
m Command, 2-18, 2-25, 3-12, 3-21
mac command, 3-31/3-32
macros
combining several, 3-32
defining, 3-31
display current definitions, 3-33
nesting, 3-33
map Command, 2-16, 3-7
measurement commands, 4-1
measurements
combinations, 3-30
memory
internal, 4-5
mapping, 1-6
memory display, 2-25, 3-32
mnemonic format, 2-22
memory display mode, 3-14
memory mapping, 3-7
for different function codes, 3-7
for getting started program, 2-16
function codes, 3-7
memory modification, 3-12, 3-21
memory, low, 1-6
messages, B-1
mnemonic display format, 2-22
mo command, 3-14
mode
access, A-9
display, A-9
syntax, A-9
modifying equates, 3-32
modifying memory, 3-12
monitor
selecting, 4-13
watchdog timer reset, 1-8
monitors
background, 5-17
comparison of foreground/background, 5-17
multiple instruction steps, 3-32
multiple measurements, 3-30
N
naming groups of analyzer signals, 3-18
naming values, 3-17
nesting macros, 3-33
NOP instruction
to fix prefetch problem, 3-23
numeric expressions
searching for, 3-34
Index-11
O
OR0-OR3 registers, 4-9
OR0-OR3 registers, 1-7
order for turning on equipment, 2-2
orientation diagram
HP Wedge probing system, 1-14
QFP probe adapter, 1-11
overlaid address ranges, 3-7
12-Index
P
personal computer (PC), 1-2
physical characteristics, C-2
pin protector
emulation probe, 5-9
PQFP probe, 1-10, 1-13
predefined equates for display counter, 3-31
predefined status equates, 3-17
predefining supervisor stack pointer, 4-16
prefetch
effect on break, 3-30
fixing analyzer problem with, 3-23
prefetch effect on analyzer, 3-22
prerequisites for using the emulator, 2-1
primary branch qualifiers, 3-19
probe adapter assembly, 1-10, 1-13
probe characteristics, C-4
processor
register displays, 3-32
single-step, 3-32
processor clock selection, 4-8
processor compatibility, C-1
program loads, 2-17
program tracing, 2-26
programs
load function codes, 4-12
prompts, 2-3
emulator command, 2-23
running in monitor, 2-24
running user code, 2-23
purpose of the emulator, 1-1
Q
QFP probe, 1-10, 1-13
R
r Command, 2-23, 2-25, 3-21
real-time runs
restricting emulator to, 4-15
reg Command, 2-25, 3-32
Register Display, 2-25
register displays, 3-32
registers
modifying BAR and SCR, 1-7
registers syntax, A-11
rep command, 3-33
repeating commands or command groups, 3-33
reset
emulator, 3-14
resolution, memory, 2-16
restrict to real-time runs, 4-15
permissible commands, 4-15
target system dependency, 4-16
RFI, C-3
rotation of
QFP adapter assembly, 1-11, 1-14
TQFP probing system, 1-11, 1-14
rst Command, 2-23, 3-14
S
s command, 3-32
sample programs
assembling, 2-20
for getting started, 2-9
linking, 2-21
loading user/supervisor, 3-9
supervisor program, 3-2
user program, 3-4
user/supervisor switching, 3-1
saving commands in a command file, 3-11
SCR register, 1-6/1-8
searching for strings or expressions, 3-34
selecting emulation monitor, 4-13
sequencer, 3-14
primary branch qualifier, 3-15
primary branch qualifiers, 3-19
secondary branch qualifier, 3-15, 3-17
ser command, 3-34
single-step microprocessor, 3-32
Index-13
software breakpoints, 5-4
enable, 3-29
how managed, 3-29
inserting, 3-29
software breakpoints (cont.)
read accesses to software breakpoint TRAP vector, 3-30
selection of TRAP instruction, 4-17
to break emulator, 3-29
TRAP instruction, 3-29
undefined, 4-18
sources of information, 1-16
spaces, 2-3
specifications
emulator, C-1
stack is in guarded memory, error message, 4-17
stack pointer
defining, 3-14
defining supervisor, 4-16
definition for emulation, 2-16
starting a trace, 2-27
starting an emulation run, 3-21
starting the analyzer, 3-21
step microprocessor, 3-32
storage qualifier, 2-27, 3-14
storage qualifiers, 3-15, 3-19
global, 3-19
strings
searching for, 3-34
supervisor stack pointer
predefining, 4-16
required for proper operation, 4-17
symbols, 5-15
syntax, A-1
address, A-3
registers, A-11
system commands, 4-3
T
14-Index
t Command, 2-27
target system
connecting the emulator probe, 1-8
target system dependency on executing code, 4-16
target system interrupts
enable/disable, 4-18
tcf command, 3-18
tcq command, 3-20
terminal
escape sequences, 3-31
tf Command, 2-27, 3-20
tg Command, 2-27
tgout command, 3-28
th Command, 2-28
tif command, 3-19
tl Command, 2-27, 3-21
tlb command, 3-18
tp command, 3-24
tpat command, 3-18, 3-23
trace display format, 3-20
trace list
displaying larger range, 3-26
trace list display, 2-27, 3-21
trace list format, 2-27
trace tag counter, 3-20
tracing program execution, 2-26
transfer
absolute files, 5-8
transfer utility, 2-19, 3-9
TRAP instruction
selecting for software breakpoints, 4-17
trig1 signal
break on receipt, 3-28
trig2 signal
break on receipt, 3-29
trigger patterns, 5-12
trigger position in trace list, 3-24
trigger signals
break upon, 5-5
trigger term specification for analyzer, 3-19
trng command, 3-18
tsq command, 3-19
tsto Command, 2-27, 3-19
turning on the emulator, 2-2
U
undefined breakpoint, 4-18
Index-15
16-Index
V
vector table, 1-6, 5-2
W
watchdog timer, and monitor problems, 1-8
write to ROM break, 3-30