1
GLOBAL WARMING INFORMATION TOOL – A MAP BASED
TEACHING AID
_______________
A Thesis
Presented to the
Faculty of
San Diego State University
_______________
In Partial Fulfillment
of the Requirements for the Degree
Master of Science
in
Computer Science
_______________
by
Gaurav Mathur
Fall 2010
iii
Copyright © 2010
by
Gaurav Mathur
All Rights Reserved
iv
DEDICATION
I would like to dedicate this thesis to all my family members who have always
encouraged and supported me. Thank you for everything.
v
ABSTRACT OF THE THESIS
Global Warming Information Tool – A Map Based Teaching Aid
by
Gaurav Mathur
Master of Science in Computer Science
San Diego State University, 2010
In today’s computer age, the focus of high school teachers is slowly shifting to more
interactive teaching methodologies as opposed to a typical lecture format. Computer aided
teaching enables teachers to engage the students to the subject material in a more successful
manner and also increases kid’s desire and motivation to learn. One challenge faced by some
teachers is the need of interactive teaching software that is easily customizable, configurable
to fit the needs of both teachers and students and also supports creativity. This thesis project
attempts to find a solution for one topic in a way that can transfer to some other topics.
A Map Based Teaching Aid is an audio-visual map based GIS tool that facilitates
teaching through the use of interactive maps. It attempts to engage the students to the subject
by providing information overlaid on various maps that the student can interact with. The
current unit being prepared as part of this project is tailored to give information on Global
Warming and its affects all over the world. Various places that have shown some evidence of
global warming are identified as hotspots by this tool. These hotspots are dynamically
overlaid as points over the map and the students can interact with the hotspots to get audio
and visual information regarding global warming effects in the area. The students have the
capability to research and add new hotspots and also dynamically add pictures to the existing
hotspots.
This tool is accompanied by a custom web page that provides detailed information on
global warming, its impacts, controversial theories surrounding it and various online links to
games, videos and quizzes to capture interests of the students towards global warming.
This tool also integrates the Java Speech API with the MOJO (Map Objects with Java
Edition) tool provided by ESRI. This enables all the information regarding hotspots to be
delivered in an audio fashion also to further capture the interest of the students.
vi
TABLE OF CONTENTS
PAGE
ABSTRACT ...............................................................................................................................v
LIST OF TABLES ................................................................................................................. viii
LIST OF FIGURES ................................................................................................................. ix
ACKNOWLEDGEMENTS ..................................................................................................... xi
CHAPTER
1
INTRODUCTION .........................................................................................................1
1.1 Background and Motivation ..............................................................................1
1.2 Overview ............................................................................................................1
1.3 Concept ..............................................................................................................2
1.3.1 Hotspots ....................................................................................................2
1.3.2 GIS ............................................................................................................3
1.3.3 Features .....................................................................................................3
1.4 About this Document .........................................................................................4
2
TECHNOLOGY ............................................................................................................5
2.1 JAVA .................................................................................................................5
2.2 Swing Application Framework ..........................................................................6
2.3 Map Objects JAVA Edition ...............................................................................7
2.4 Java Speech API ................................................................................................8
3
REQUIREMENT SPECIFICATION ..........................................................................11
4
DESIGN AND ARCHITECTURE ..............................................................................14
4.1 High Level Architecture ..................................................................................14
4.2 Design of the Project ........................................................................................15
5
PROJECT IMPLEMENTATION AND FEATURES .................................................21
5.1 Development Environment ..............................................................................21
5.2 Swing Application framework .........................................................................22
5.3 Using The MOJO Toolbars ..............................................................................22
5.3.1 Zoom Pan Tool Bar .................................................................................23
vii
5.3.2 Selection Tool Bar ..................................................................................24
5.3.3 Custom Tools ..........................................................................................25
5.3.3.1 XY Layer and Hotspots .................................................................26
5.3.3.2 Add Pic Tool ..................................................................................28
5.3.3.3 Custom Identify Icon .....................................................................28
5.3.3.4 Help Menu .....................................................................................30
5.3.3.5 User Manual ...................................................................................32
5.4 Custom Web Page ............................................................................................32
6
SCREENSHOTS..........................................................................................................34
7
CONCLUSION AND FUTURE ENHANCEMENTS ................................................37
BIBLIOGRAPHY ....................................................................................................................39
viii
LIST OF TABLES
PAGE
Table 5.1. Custom Tools ..........................................................................................................26
ix
LIST OF FIGURES
PAGE
Figure 1.1. Concept of hotspot...................................................................................................2
Figure 2.2. Application and ApplicationContext class interaction.. ..........................................6
Figure 2.3. JSR-296 architecture – Application and ApplicationContext singletons. ...............7
Figure 2.4. State diagram for a speech synthesizer. ...................................................................9
Figure 3.1. Project life cycle. ...................................................................................................11
Figure 4.1. High Level Architecture diagram. .........................................................................15
Figure 4.2. Class diagram for application level component. ...................................................16
Figure 4.3. Global Info Map Class...........................................................................................17
Figure 4.4. Class Diagram for XY Feature Layer. ...................................................................18
Figure 4.5. Class Diagram for Hotlink Identify tool. ...............................................................19
Figure 4.6. Class Diagram for Add Pic tool.............................................................................19
Figure 4.7. Class Diagram for Helper Classes. ........................................................................20
Figure 5.1. Toolbars. ................................................................................................................23
Figure 5.2. Zoom Pan Tool Bar. ..............................................................................................24
Figure 5.3. Selection Tool Bar. ................................................................................................25
Figure 5.4. Custom Toolbar. ....................................................................................................26
Figure 5.5. CSV File Format....................................................................................................27
Figure 5.6. A Sample CSV File. ..............................................................................................27
Figure 5.7. Add Pic Tool..........................................................................................................29
Figure 5.8. Add Pic Dialog Box...............................................................................................29
Figure 5.9. Information Dialog. ...............................................................................................30
Figure 5.10. Help menu. ..........................................................................................................31
Figure 5.11. Help Dialog. ........................................................................................................31
Figure 5.12. User Manual. .......................................................................................................32
Figure 5.13. Web Page for the project. ....................................................................................33
Figure 6.1. Home screen of GWIT. .........................................................................................34
Figure 6.2. World map view. ...................................................................................................35
x
Figure 6.3. New map view. This is initially blank and can be customized by the user.
Add Pic tool is activated in this view...........................................................................35
Figure 6.4 Video page. Contains links to online videos regarding global
warming. ......................................................................................................................36
Figure 6.5. Games page. Contains links to some very informative links on the
internet. ........................................................................................................................36
xi
ACKNOWLEDGEMENTS
I would like to thank Dr. Carl Eckberg for his support and help during this thesis. I
would also like to thank Professor Tao Xie and Dr. Piotr Jankowski for being a part of my
thesis committee. I would also like to thank Ms. Debra Byrd, Science Teacher at Helix
Charter High School for her support and suggestions during the project.
1
CHAPTER 1
INTRODUCTION
1.1 BACKGROUND AND MOTIVATION
In modern times, keeping high school students interested in the course material is one
challenge faced by many teachers. Students get bored easily reading course books and
usually loose motivation. In today’s computer age, focus is slowly shifting to more
interactive methodologies of teaching students in high schools as opposed to typical lecture
formats. Computer aided teaching helps in engaging the students to the subject material and
also increases their motivation and desire to learn. One challenge faced by some high school
teachers is the need of an interactive map based teaching tool that fits the need of both
students and teachers, is easy to learn and use and easily configurable. This was the major
source of inspiration for this thesis project. This project attempts to provide a solution for one
topic in a way that can be easily transferred to various other topics in future.
This thesis report discusses the project in detail, how it was developed in accordance
to the requirements gathered from high school teachers and how it focuses on teaching the
students at high schools.
1.2 OVERVIEW
The study unit being prepared as part of this thesis gives detailed information on
global warming, it’s affects all over the world, controversial theories surrounding it and
various online multimedia links to games, videos and quizzes regarding climate shift and
global warming.
Global Warming Information Tool (GWIT) is an audio visual map based Geographic
Information System (GIS) tool that facilitates learning in a more interactive manner. It
attempts to engage the students to the course material by providing information overlaid on
various maps that the students can interact with and make changes dynamically. It provides a
teaching environment where teachers can easily extend the tool to prepare various study units
in future and also distribute research assignments to students.
2
1.3 CONCEPT
This section introduces some of the concepts used in this thesis project. This includes
hotspots, Geographic Information System (GIS), overview of the features of this application
and some information regarding this document.
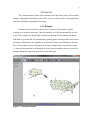
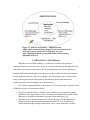
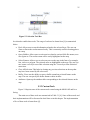
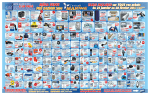
1.3.1 Hotspots
Hotspots are places that have shown some evidence of climate shift or global
warming over the past few decades. This tool identifies over 100 such hotspots all over the
world. These hotspots are dynamically overlaid over the map and the students can interact
with them to get audio and video information regarding global warming effects in the area of
the hotspot. Students have the capability to research new hotspots and add them to the map.
They can also add pictures or information to already existing hotspots dynamically. Figure
1.1 shows the hotspots that were identified for North America and how they are overlaid on
the map. Hotspots are the small green dots on top of the map.
Figure 1.1. Concept of hotspot.
3
The architecture of the project and concept of hotspots are easily extendable. This
concept can be used to create new study units in future. A hotspot can be anything, it just
represents a point on the map, its significance is in the information it provides.
1.3.2 GIS
GIS abbreviates Geographic Information System [4]. GIS is any system capable of
displaying location based data and capable of performing analysis on the spatial data. An
example would be display of information using maps [4]. Few of the biggest GIS software
available to the users are ArcGIS and ArcView that are developed by ESRI.
This thesis project utilizes the GIS component architecture by the name Map Objects
Java Edition (MOJO). The main advantage of using component software like MOJO is that it
can programmed to customer requirements using the libraries provided and Java technology.
Another motivation for choosing MOJO as the GIS software is the detailed documentation
provided by Dr. Carl Eckberg at San Diego State University and his course on GIS [4].
MOJO is discussed in detail in chapter two of this report.
1.3.3 Features
The main features of Global Warming Information tool (GWIT) that will be discussed
in detail in the following chapters are summarized below.
GWIT provides a map based teaching environment tailored to give detailed
information on global warming.
This tool uses the MOJO component architecture as the GIS software and
programmatically enhances it according to the needs of the user.
This tool provides a generic architecture that can be enhanced or reused in various
study units.
Users have the ability of creating custom layers on the map in the form of points file.
They can dynamically add pictures and information to these points.
This tool integrates the Java Speech API with the MOJO component to incorporate
text to speech support to further capture the interest of the students. This feature can
be enhanced in future to include better quality audio voices.
This tool is accompanied by a custom web page that contains links to various
information sources on the internet regarding global warming and various quizzes,
videos and games related to it to capture the interests of the students.
4
This tool is easy to learn and use and is accompanied by a very informative help
menu and a detailed web based user manual to guide the students and teachers
through various features of this tool.
1.4 ABOUT THIS DOCUMENT
This document is prepared in seven chapters. Chapter one provides an overview of
the thesis project and the motivation behind the project. Chapter two gives details on all the
technologies used during the development of the project. Chapter three and four concentrate
on the initial phases of software development life cycle. They include requirement gathering
and analysis and design of the project in the form of architecture diagram and various class
diagrams. Chapter five gives detailed information on all the features implemented as part of
this thesis, including code snippets wherever required. Chapter six contains few screenshots
of the application and chapter seven concludes this report by presenting a conclusion and
some suggestions regarding future enhancements.
5
CHAPTER 2
TECHNOLOGY
This chapter focuses on various technologies used in the development of this thesis
project.
2.1 JAVA
Java is an object-oriented, cross platform programming language that is intended to
let application developers “write once, run anywhere” [10]. It is designed to be general
purpose, concurrent, distributed, highly scalable, reliable, secure and have as few
implementation and system dependencies as possible. Java is currently one of the most
popular programming languages due to its wide range of use in application based software,
desktop based applications and distributed web applications [10].
Few of the features and advantages of Java are captured below.
Object Oriented programming support– Java is an object oriented programming
language. All the code written in Java is written in the form of classes. This helps
developers to write re-usable modules and components. Existing classes can be easily
reused adding additional features as and when required. Concepts like inheritance,
encapsulation, abstraction and polymorphism all make Java a strong object oriented
programming language [8]. Due to this feature most of the classes built as part of this
project are reusable and can be easily extended by other GIS applications in future.
Architecture Neutral – Java is an architecture neutral language [8]. Not only is it
platform independent, but it works on wide variety of hardware architectures and
operating systems. The Java compiler generates a set of byte code instructions that are
platform/operating system/hardware independent [8]. This byte code can be
interpreted on any system by the Java Virtual Machine (JVM). Platform
independency was a big requirement for this thesis project.
Java is easy to learn and use. This makes java code easier to learn, write, compile and
debug [1].
Other features include robustness, security, multi-threading support and reliability.
All the above mentioned features make Java a popular programming language and a
good choice for this project.
6
2.2 SWING APPLICATION FRAMEWORK
The Swing Application Framework is a Java specification that aims to provide a
simple application framework for Java swing applications [18].The purpose of this
framework is to manage the lifecycle of swing applications in an efficient and reliable
manner and to provide basic resource management required for java swing applications. The
main emphasis of this framework is to allow programmers to quickly get started with swing
applications and to adopt best practices common to every application [13].
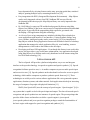
The Application base class defines the application lifecycle, most importantly the
startup and shutdown procedures. A single instance of this class is created at startup of the
application [3]. The Application subclass and all its functionality are supported by the
ApplicationContext base class. Both these classes together manage the swing application and
have a one to one relationship [13] as shown in Figure 2.2.
Figure 2.2. Application and ApplicationContext class
interaction. Source: [13] J. O’Conner, Using the swing
application framework. Sun Java, http://java.sun.
com/developer/technicalArticles/javase/swingappfr/,
accessed September 2010, July 2007.
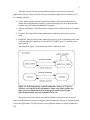
The Application Context class acts as a wrapper over the Application Class and
provides access to session storage, resource manager, task manager, local storage etc. [3] as
shown in Figure 2.3.
This thesis project utilizes the above architecture to create a standalone java swing
desktop application based on the Swing Application Framework. The lifecycle of the project
including startup, resource and memory management, error logging, shutdown etc are
managed by calling the appropriate methods of the SingleFrameApplication and Application
classes.
7
Figure 2.3. JSR-296 architecture – Application and
ApplicationContext singletons. Source: [3] An introduction to the
swing application framework API (JSR-296). Java.net,
https://appframework.dev.java.net/intro/index.html, accessed
September 2010, n.d
2.3 MAP OBJECTS JAVA EDITION
Map Objects Java Edition (MOJO) is a collection of various map based java
components that can be used to create variety of web based and desktop GIS applications [5].
This allows for creation of both client side GIS applications and server side constructs to
integrate with internet based applications anywhere in the world. Some of the main features
include displaying dynamic, real time geographic data, allowing the users to interact with
maps, perform spatial queries and geometric operations on spatial information and
customizing map views according to user requirements [5].
Key features regarding MOJO as described in [4] [14] that made it a perfect choice
for this thesis project are summarized below.
This gives users the ability to combine variety of data sources together in a single
application. This feature allows users to combine personal data sources with various
data sources available on the internet to create custom map layers [14].
Map Objects Java edition provides users with a wide range of GIS capabilities to
interact with the maps and spatial information related to it. Few of the features
include labeling maps, creating custom point’s layer, zoom capabilities, creating
8
layers dynamically by selecting features on the map, querying spatial data, statistical
analysis, panning multiple layers, measuring distances etc [14].
Easy integration with IDE’s (Integrated Development Environments) – Map Objects
can be easily integrated with any Java IDE. NetBeans IDE was used for the
development of this thesis project. Map Objects library was easily imported in the
NetBeans IDE.
Dr. Carl Eckberg’s course on GIS and the book prepared by him on using Map
Objects Java Edition [4] has been a major source of inspiration and motivation behind
this project. It provides all the programming help required to get started with
developing a GIS application using this technology.
A rich set of java swing components are included with Map Objects that help to
create applications with attractive User Interfaces. Various dynamic dialogs, map
views, toolbars, intelligent legends can be created easily [14]. Easy integration of
Map Objects with the Swing Application Framework facilitated creation of a desktop
application that manages the whole application lifecycle, error handling, resource
management etc which reduces the burden on the developer.
Developing web based GIS applications – Even though this feature is not used in this
project, but it provides a very useful future enhancement. Any application developed
using Map Objects Java Edition can be easily distributed over the internet using Sun
Java Web Start technology [14].
2.4 JAVA SPEECH API
The Java Speech API provides a platform independent, easy to use and integrate
interface to the speech technology via speech recognition and speech synthesis [11]. Speech
recognition facilitates speech to text, i.e. it enables computers to process audio speech input
and convert it to text [11]. Speech synthesis on the other hand is referred to as text to speech
technology which enables computers to produce synthetic speech from text [11]. These
technologies are widely used in various software applications like voice generated response
applications, dictation systems, and online tutorials. Such applications also help in increasing
the usage of computers for people with physical limitations [11].
JSAPI (Java Speech API) uses the concept of speech engine. “Speech engine” [16] is
any system that is capable to deal with speech input and output. The above discussed speech
recognizers and speech synthesizers are instances of speech engine. The parent package that
provides all the classes and interfaces to define a speech engine is javax.speech.
javax.speech.synthesis and javax.speech.recognition packages extend the functionalities of
the basic engine with support for speech recognition and synthesis [16].
9
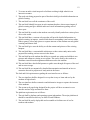
This thesis project uses the speech.synthesis package to provide text to speech
support. The four basic steps involved in all speech synthetic applications as shown in [17]
are summarized below.
Create: In this step the application grabs the instance of the speech synthesizer by
calling the createSynthesizer method. A particular language can be requested at this
moment using the SynthesizerModeDesc argument.
Allocate and Resume: This allocates the system resources and puts them in a resumed
state.
Generate: This step facilitates the generation of synthesized speech from a given
string.
Deallocate: This step frees up the synthesizer resources. This is important as the caller
is blocked until the synthesizer is in the QUEUE_EMPTY state, i.e. until the text is
being spoken.
The diagram in Figure 2.4 illustrates the various synthesizer states.
Figure 2.4. State diagram for a speech synthesizer. Source: [17] Speech
Synthesis. Java Speech API Programmer's Guide. Sun Microsystems, Inc.,
http://java.sun.com/products/java-media/speech/forDevelopers/jsapiguide/Synthesis.html, accessed September 2010, n.d.
This project utilizes the features provided by JSAPI to incorporate text to speech
support. JSAPI allows developers to integrate speech technology with any java based desktop
or web start application. The API provides a cross platform interface to speech synthesizers
[12].
10
This project uses an open source, third party implementation of the speech
synthesizer available on Sun’s website with the name FreeTTS 1.2 [6]. This is a speech
synthesis system written entirely in Java language and utilizes the javax.speech API provided
by Sun itself.
11
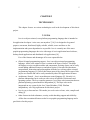
CHAPTER 3
REQUIREMENT SPECIFICATION
This chapter focuses on the requirement gathering phase. All the requirements
gathered from the end users are explained in this chapter.
One of the most important phases of software development is requirement gathering.
This phase occurs during the beginning of any project that is being developed for a customer.
During this phase all the requirements are gathered from the customer and analyzed in detail.
The requirements are mainly analyzed from a feasibility stand point. Figure 3.1 depicts the
overall lifecycle of the project.
Figure 3.1. Project life cycle. Source: [2] Analysis World: Strategize –
Analyze – Architect. Analysis World, http://analysisworld.com/
RequirementsGathering.aspx, accessed September 2010, n.d.
GWIT (Global Warming Information Tool) has been made under the guidance of Dr.
Carl Eckberg of Computer Science department, San Diego State University and Ms. Debra
Byrd of Helix Charter High School. This tool is designed to facilitate teaching in high
schools with the use of interactive maps. The study unit being prepared under this thesis
project is tailored to give detailed information on global warming all over the world. The
main users of this tool would be the students of high schools which made it even more
important to carefully collect and analyze the requirements so that the project is made in a
manner that is useful to the students.
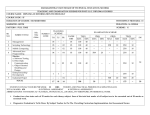
The main requirements regarding the features and final deliverables of the project as
discussed with Ms. Debra Byrd at the start of the project are summarized below.
The functional and data requirements of the project are as follows:
12
1. To create an audio-visual map tool to facilitate teaching in high schools in an
interactive manner.
2. The study unit being prepared as part of the thesis shall give detailed information on
global warming.
3. This tool shall cover all the continents of the world.
4. This tool shall identify hot spots in each continent that have shown some impact of
global warming and give detailed audio and visual information regarding each of
these spots.
5. This tool shall be created so that students can easily identify and relate various places
all over the world.
6. This tool shall have a custom web page that will provide detailed information on
global warming, its impacts, controversial theories surrounding it and various online
links to games, videos and quizzes to capture interests of the students towards global
warming and climate shift.
7. This tool shall give users the ability to edit the content and pictures of the existing
hotspots.
8. This tool shall have a customizable architecture so that various study units can be
prepared for teaching various courses in the future.
9. This tool shall provide students the ability to research new points and add their own
pictures and content to existing or new points. This can be used by the teachers to
distribute research based assignments and homework to the students.
10. This tool shall have detailed help menus to guide users through all aspects of the tool
and its correct usage.
11. This tool shall be accompanied by detailed documentation and tutorial on how to
customize the tool to prepare new study units in the future.
The look and feel requirements regarding the user-interface are as follows:
1. The user interface shall be designed in a way that is easy to learn and use by the
students of high schools.
2. The user interface shall use attractive and informative images to capture the interests
of the students.
3. The custom web page being designed for the project will have an attractive user
interface and use large and attractive fonts.
The platform requirements are as follows:
1. The tool shall be platform and operating system independent. The major platforms it
should be tested before delivery are Mac OS and Windows.
2. This tool shall be easily deployable and executable to facilitate ease of use for
teachers and students.
13
3. To make the tool platform and system independent, the tool shall be developed in
Java which is a platform independent technology. Map Objects Java Edition provided
by ESRI will be used in this project. All the technologies used are described in detail
in the chapter two of this report.
14
CHAPTER 4
DESIGN AND ARCHITECTURE
Any software is as efficient as its underlying design and architecture. This chapter
focuses on the higher level architecture and design of this thesis project.
4.1 HIGH LEVEL ARCHITECTURE
A high level design defines the various components of the software being developed.
A High Level Architecture diagram (HLA) tries to represent and analyze all the requirements
finalized in the previous phase and constructs an architecture that can fulfill all the
requirements. This is a very important step in the development cycle as all the components
will be designed and programmed according to this HLA. Any non functional requirements
like scalability have to be addressed at this stage of development [7].
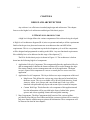
The HLA for this thesis project is shown in Figure 4.1. The architecture is broken
down into the following high level components:
1. Application Lifecycle Component: This component defines the application lifecycle
and its management. It defines the framework that will be used to manage the steps
like startup, launch, resource management and exit of the application. The home
screen is a part of this component as it acts as a central place to access rest of the
application.
2. Application Level Component: This layer defines two major components of this tool.
Map Screen: This defines the various map views that can be launched from
the home screen. The views available will be World, North America, South
America, Africa, Asia, Europe and a new blank map. Each view will be
launched with preloaded map layers and custom layers created for hotspots.
Custom Web Page: This defines the web component of this application and
how the information will be provided in the form of online links, games,
quizzes and videos regarding climate shift and global warming.
3. Map Components: The Map Components shall consist of the various toolbars
provided by Map Objects Java Edition and all the custom tools that will be created to
help users interact with the maps to gain useful information. These components will
be discussed in detail in later chapters.
15
Figure 4.1. High Level Architecture diagram.
4. Custom Helper Components: This layer defines all the low lever helper components
that will be developed. They include integrating text to speech support into the Map
Component, collecting relevant data regarding global warming in the form of
hotspots, downloading all the required map files, creating custom help menu, user
manual and creating a configuration file for the project.
4.2 DESIGN OF THE PROJECT
Once the architecture is in place and all the components have been identified, the next
phase is to design each component. This consists of determining the functionality of each
component, relationship between them, identifying any component dependencies and also
identifying any inter component interactions.
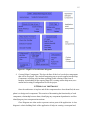
Class Diagrams are often used to represent various parts of the application. A class
diagram is a basic building block of the application. It helps in creating a conceptual and
16
visual model of the components defined by the architecture. The classes represent the various
real world objects the application is composed of. This helps in defining the relationships and
dependencies between the classes. The class diagrams that were designed for this project are
depicted in Figure 4.2.
Figure 4.2. Class diagram for application level component.
The class diagram shown in Figure 4.2 represents two high level classes of this
project. GlobalWarmingInfoToolApp class extends the SingleFrameApplication class which
provides the functionality of managing the lifecycle of any swing application. On startup, it
instantiates the GlobalWarmingInfoToolView class which represents the home screen that
the users see on the startup of the application. This class implements functionality to launch
17
the various map views according to the configurations file. The actual map view is depicted
by the GlobalInfoMap class shown in Figure 4.3.
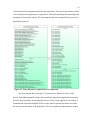
Figure 4.3. Global Info Map Class.
This class extends all the features, toolbars and other required functionalities from the
com.esri.mo2 package which is part of the standard Map Objects Java Edition API as
provided by ESRI.
The classes providing the XY feature support are depicted in Figure 4.4. This
functionality is inspired from [4]. AddXYtheme and XYfeatureLayer class provide the
functionality of adding custom layers on the maps. The XY points are read from Comma
18
Figure 4.4. Class Diagram for XY Feature Layer.
Separated Value (CSV) files which are represented by the FileBean class. CSVFileHandler is
the class which reads and updates the CSV files represented as FileBeans.
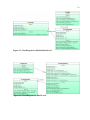
The class diagram for the hotlink identify functionality is depicted in Figure 4.5. The
HotImage class extends the javax.swing.JDialog class. This represents the dialog that opens
up when the user clicks on any hotspot on the map. The information is read from the
FileBean representing the CSV file using the CSVFileHandler object.
The classes used to implement the AddPic tool are shown in Figure 4.6. The AddPic
tool changes the cursor icon and allows the user to click on any hotspot over the map in edit
mode. The AddImageDialog class extends the javax.swing.JDialog class. This allows the
user to browse to any image that needs to be added to the clicked hotspot. The CSV file
19
Figure 4.5. Class Diagram for Hotlink Identify tool.
Figure 4.6. Class Diagram for Add Pic tool.
20
handler manages the updates to the CSV file bean.
Figure 4.7 depicts the class diagrams for the various helper classes developed during
the development of the project. Blabber class imports the javax.speech package to implement
text to speech functionality. HelpMain class implements the help menu created to enrich the
user experience.
Figure 4.7. Class Diagram for Helper Classes.
21
CHAPTER 5
PROJECT IMPLEMENTATION AND FEATURES
This chapter focuses on the implementation of the project, development environment
used and the various features implemented.
5.1 DEVELOPMENT ENVIRONMENT
NetBeans [15] was used as the integrated development environment (IDE) to develop
this project. The reasons to choose NetBeans as the development platform were as follows:
NetBeans is one of the largest development IDE’s available for building Java based
applications. It provides support for building standalone desktop based as well as web
based applications.
Integrated support to develop GUI based java swing applications. Swing Application
Framework was used as the framework to develop this GUI based application.
NetBeans already comes integrated with this framework and can be used easily to
create desktop based applications.
Easy integration with Map Objects Java Edition (MOJO). MOJO is the GIS
component architecture provided by ESRI that was used to provide GIS support in
this project. NetBeans was easily integrated with MOJO libraries which further
enhanced the development capabilities.
Inbuilt profiling tools in NetBeans help to monitor the applications for memory leaks,
optimizations etc. This proved to be really helpful during the development of this
project.
NetBeans provides great drag and drop features for GUI development which was a
major part of this project. Complex swing based designs can be easily accomplished
using this feature without having to bother about various layouts and other
dependencies.
NetBeans provides a UML modeling tool which was used to create the class diagrams
shown in chapter four.
To summarize, following tools and technologies were used to develop this project:
NetBeans IDE available at [15].
Java SE Development Kit downloadable at [9].
Map Objects Java Edition installation CD obtained from Dr. Carl Eckberg, Computer
Science Dept, San Diego State University.
22
FreeTTS 1.2 – speech synthesizer for java applications available at [6].
5.2 SWING APPLICATION FRAMEWORK
The merits of using Swing Application framework are discussed in the technology
section in chapter two. This section describes how the framework was used and some java
code snippets are provided. GlobalWarmingInfoToolApp is the base class which extends the
SingleFrameApplication class. The following code snippet represents the standard functions
provided by this class. The startup method launches the GlobalWarmingInfoToolView class
which represents the home screen. The getApplication() method returns the single static
instance available for this class. The main function calls the launch() function to start the
application and calls the custom function to parse the configuration file prepared for this
project.
public class GlobalWarmingInfoToolApp extends
SingleFrameApplication {
@Override protected void startup() {
show(new GlobalWarmingInfoToolView(this));
}
@Override protected void configureWindow(java.awt.Window
root) {
}
public static GlobalWarmingInfoToolApp getApplication() {
return
Application.getInstance(GlobalWarmingInfoToolApp.class);
}
public static void main(String[] args) {
launch(GlobalWarmingInfoToolApp.class, args);
parseCfgFile();
}
}
The rest of the attributes and operations defined in this class are shown in the class
diagram for this class, Figure 4.2 in chapter four.
5.3 USING THE MOJO TOOLBARS
MOJO provides a set of toolbars that can be included in any GIS project. These
toolbars are provided as part of the com.esri.mo2.ui.tb package. A toolbar is a collection of
various tools that give users the capability to interact with the maps and perform other map
23
related tasks like zoom, pan etc. This section discusses the toolbars used in this project. The
toolbars are shown in Figure 5.1.
Figure 5.1. Toolbars.
Following code snippet shows how to add the ZoomPanToolBar and
SelectionToolBar to a GIS application as learnt from [4].
// import the mojo toolbar classes
import com.esri.mo2.ui.tb.ZoomPanToolBar;
import com.esri.mo2.ui.tb.SelectionToolBar;
public class GlobalInfoMap extends javax.swing.JFrame {
public GlobalInfoMap() {
// declaration
Map map;
ZoomPanToolBar zptb;
SelectionToolBar stb;
//instantiation
map = new Map();
zptb = new ZoomPanToolBar();
stb = new SelectionToolBar();
//setting the toolbars on the map
zptb.setMap(map);
stb.setMap(map);
getContentPane().add(zptb);
getContentPane().add(stb);
}
...
}
Any additional tools can be added on a custom JToolBar which is part of javax.swing
package. The JToolBar can be added to the map in the same way as shown above.
5.3.1 Zoom Pan Tool Bar
The Zoom Pan Tool Bar provides a wide variety of tools enabling users to perform
activities like zoom, pan, change the extent of the map etc. Figure 5.2 shows the various tools
24
Figure 5.2. Zoom Pan Tool Bar.
available in the Zoom Pan Tool Bar. The icons used are pretty common and self descriptive
to a large sense. The usage of each tool as learnt from [4] is summarized below.
Previous Extent: All the displays of the map keep getting saved. Previous extent helps
user to go back to an old display of the map.
Next Extent: Allows the user to go forward to the next display of the map.
Zoom to Active Layer: Allows the user to zoom to the active selected layer.
Zoom to Full Extent: Gives user the ability to zoom to the fullest extent of all layers
on the map. Helps user to return to the original view of the map.
Zoom In: Gives user the ability to zoom in to any area on the map.
Zoom Out: Gives user the ability to zoom out of any previously zoomed in state.
Pan: This gives user the ability to drag the map in any direction required. This helps
in uncovering areas on the map that were earlier not visible.
Pan One Direction: This is an abstract form of the pan tool. Gives user a set of
options to pan the map in a particular direction.
Identify: This is the information tool. Clicking this changes the cursor to an identify
icon. The users can now click on any area of the map to get more information about
it.
5.3.2 Selection Tool Bar
This toolbar gives user the ability to select features on the map, write spatial queries,
search places on the map etc. Figure 5.3 shows the various tools available in the Selection
Pan Tool Bar. Most of these tools are disabled or grayed out initially. A map layer needs to
25
Figure 5.3. Selection Tool Bar.
be selected to enable these tools. The usage of each tool as learnt from [4] is summarized
below.
Find: Allows user to search information related to the selected layer. The user can
Zoom or Pan to the results returned easily. This is extremely useful in locating places
on a map.
Query Builder: Allows user to write queries related to various fields like names, area
in a region etc. The results returns can be easily highlighted on the map.
Select Features: Allows user to select any area on the map in the form of a rectangle,
line, circle or a polygon. The selected areas are highlighted on the map. The user can
now create a new layer out of this selection using the “Create layer from Selection”
menu item.
Clear All Selection: This helps in clearing any previous selections on the map that
may have been created by the select tools.
Buffer: Gives user the ability to create a buffer around any selected feature on the
map. The user can specify the buffer distance radius in miles.
Attributes: Opens up the attribute table corresponding to the selected features on the
map.
5.3.3 Custom Tools
Figure 5.4 depicts some of the custom tools created using the MOJO API and Java
Swing.
The main uses of these tools are summarized in Table 5.1 [4]. Some of these tools and
their implementation will be discussed in detail later on in this chapter. The implementation
of few of these tools is learnt from [4].
26
Figure 5.3. Custom Toolbar.
Table 4.1. Custom Tools
Tool
User Manual
Function
This launches an html web page that contains the user manual created for
this tool.
Print
Gives user the ability to print the map. Currently both the table of
contents and the map screen are printed.
Arrow
Gives user the ability to clear any selected tools. Allows user to go back
to the original cursor icon and deselects any selected tools. Also clears
the lines created on the map by the Measure tool.
Measure
Allows the user to measure distance between any two points on the map.
A line can be drawn between any two points on the map by dragging the
cursor after clicking this tool. The distance is displayed both in
kilometers and miles near the foot of the map.
Add Layer
Allows the user to add map layers on the map in the form of shape files.
Opens up a dialog box using which the user can browse to the desired
shape file. Any number of layers can be added at a time on the map.
XY tool
This is a custom tool to add XY Feature Layers on the map as shown in.
Users can load custom layers on the map using this feature.
Identify
This is a custom identify icon. This allows the users to interact with the
hotspots on the map to gain information regarding them.
Help Menu
This opens up a help menu dialog box. Gives sufficient help on all the
toolbars available to the user.
Add Pic Tool Allows users to dynamically add new pictures and descriptions to
existing hotspots on the map.
Source: [4] Advantages of Java. IBM, http://publib.boulder.ibm.com/infocenter/
aix/v6r1/index.jsp?topic=/com.ibm.aix.prftungd/doc/prftungd/advantages_java.htm,
accessed September 2010, n.d.
5.3.3.1 XY LAYER AND HOTSPOTS
A hotspot is defined as any point displayed over the map. This tool gives user the
ability to create custom hotspots and add them to CSV files that can then be loaded on to the
map using the XY tool.
The format of the hotspot is shown in Figure 5.5.
27
Figure 5.5. CSV File Format.
A sample CSV file is shown in Figure 5.6.
Figure 5.6. A Sample CSV File.
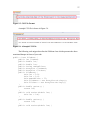
The following code snippet describes the FileBean class which represents the above
mentioned hotspot in forms of java code.
public class FileBean {
public int lineNum;
public double lat;
public double lon;
public String nameOfPlace;
public ArrayList fileNames;
public ArrayList fileDesc;
public FileBean(){
this.lat = 0.0;
this.lon = 0.0;
this.nameOfPlace = "";
this.fileNames = new ArrayList<String>();
this.fileDesc = new ArrayList<String>();
}
public double getLat() {
return lat;
}
public void setLat(double lat) {
this.lat = lat;
}
public double getLon() {
return lon;
}
public void setLon(double lon) {
28
this.lon = lon;
}
public String getName() {
return nameOfPlace;
}
public void setName(String nameOfPlace) {
this.nameOfPlace = nameOfPlace;
}
public ArrayList getFileNames() {
return fileNames;
}
public void setFileNames(ArrayList fileNames) {
this.fileNames = fileNames;
}
public ArrayList getFileDesc() {
return fileDesc;
}
public int getLineNum() {
return lineNum;
}
public void setLineNum(int lineNum) {
this.lineNum = lineNum;
}
}
5.3.3.2 ADD PIC TOOL
This tool implements the functionality of dynamically adding pictures and description
to the hotspots on the map. Clicking on this tool changes the cursor icon. This is shown in
Figure 5.7. Clicking on the hotspot opens up a dialog box as shown in Figure 5.8. The users
can browse to the desired image and add description related to it.
The Add Pic Tool dynamically updates the CSV file which contains the hotspot. A
copy is made of the original image and stored in the project folder.
5.3.3.3 CUSTOM IDENTIFY ICON
The custom identify icon allows user to click on any hotspot and obtain more
information regarding it. On clicking this tool, the cursor changes to the identify cursor and
the user can then click on any hotspot.
Clicking the hotspot results in an information dialog as shown in Figure 5.9. This
dialog contains images and descriptions regarding the hotspot as specified in the CSV file.
29
Figure 5.7. Add Pic Tool.
Figure 5.8. Add Pic Dialog Box.
30
Figure 5.9. Information Dialog.
The text can also be converted into audio form by clicking the Listen button which converts
the text to speech using the Java speech API.
5.3.3.4 HELP MENU
One requirement of this project was to build a detailed help menu that will make the
tool easy to learn and use for the students of the high schools. This is accomplished in two
parts. A detailed web based user manual is created which is discussed in the next section.
Also, a help menu is integrated into the map screen which gives information on all the tools
available to the user. The help menu and help dialog are shown in Figures 5.10 and 5.11.
31
Figure 5.10. Help menu.
Figure 5.11. Help Dialog.
32
5.3.3.5 USER MANUAL
User Manual is a web based manual for the users of the tool. This gives detailed
information including introduction, installation instructions and how to use the tool. The
manual is broken down into chapters, has navigation buttons as shown in Figure 5.12.
Figure 5.12. User Manual.
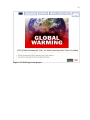
5.4 CUSTOM WEB PAGE
This section describes the custom web page made for this project. This page gives
detailed information on global warming, climate shift etc as shown in Figure 5.13. This was
developed using XHTML, CSS and Java script. The web page contains the following links:
Global Warming Info – contains various links on global warming and its affects all
over the world.
Controversies – contains links to some of the controversial theories surrounding
global warming.
Play Games – contains links to some very informative online games regarding global
warming.
Videos – contains links to online videos related to global warming.
Quiz Time – contains links to various online quizzes. Students can take the quiz to
check and enhance their information on global warming.
How to use GWIT? – this links to the user manual page.
33
Figure 5.13. Web Page for the project.
34
CHAPTER 6
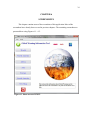
SCREENSHOTS
This chapter contains some of the screenshots of this application. Most of the
screenshots have already been covered in previous chapters. The remaining screenshots are
presented here using Figures 6.1 – 6.5.
Figure 6.1. Home screen of GWIT.
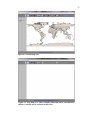
35
Figure 6.2. World map view.
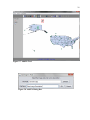
Figure 6.3. New map view. This is initially blank and can be customized by
the user. Add Pic tool is activated in this view.
36
Figure 6.4 Video page. Contains links to online videos regarding global
warming.
Figure 6.5. Games page. Contains links to some very informative links on
the internet.
37
CHAPTER 7
CONCLUSION AND FUTURE ENHANCEMENTS
This thesis project has been developed in accordance to the requirements collected at
the beginning of the project as described in chapter three of this report. All the requirements
have been fulfilled to a large extent. The major focus from a development point of view has
been reusability of code, extendibility of the underlying architecture and ease of use for the
end users. These objectives and how they were achieved in this project are discussed below.
Easily customizable and configurable: This application meets this criterion and the
users can easily configure and customize the tool. The teachers can prepare various
study units and use this tool to teach them.
Easily deployable: This application has an executable JAR file. This makes the tool
easily deployable and executable by simply double clicking the JAR file.
Extendable – The various functionalities implemented are in the form of reusable java
classes. Other similar applications in future can reuse these classes and extend the
functionality.
Platform and Browser independence: This application is system and platform
independent and has been tested on a variety of operating systems like Windows 7,
Windows XP, Windows Vista and Mac OS. The webpage included with the
application supports all popular browsers.
Ease of use: Considering that majority of the users of this application would be
students in high schools, ease of use were a major requirement. This application
fulfils this requirement to a large extent. The application is easy to learn and use,
intuitive and is accompanied by a detailed web based user manual and help menu to
guide the users at all times.
Although the requirements set at the beginning have been fulfilled, a lot of scope
exists to further extend this application to implement more functionality. Few suggestions for
future enhancements are presented below.
A lot more features can be implemented to enrich the user experience even more.
Some examples would be adding animations and games in the tool itself to further
capture the interests of the students.
The application can be made web based using the Java Web Start technology. The
application can deployed on a central server and made accessible via a URL. This
would remove the requirement of installing the application separately on each
machine and would definitely increase the usability.
38
The text to speech support is very basic in this application. A lot more speech API’s
can be researched to incorporate variety of voices in the application. Various different
languages can be used in the future to make this a multi lingual teaching tool.
The Add Pic tool can be extended to incorporate multiple photo albums related to a
hotspot. Another feature could be to allow users to embed videos corresponding to the
hotspots.
39
BIBLIOGRAPHY
WORKS CITED
[1] Advantages of Java. IBM, http://publib.boulder.ibm.com/infocenter/
aix/v6r1/index.jsp?topic=/com.ibm.aix.prftungd/doc/prftungd/advantages_java.htm,
accessed September 2010, n.d.
[2] Analysis World: Strategize – Analyze – Architect. Analysis World,
http://analysisworld.com/RequirementsGathering.aspx, accessed September 2010, n.d.
[3] An introduction to the swing application framework API (JSR-296). Java.net,
https://appframework.dev.java.net/intro/index.html, accessed September 2010, n.d.
[4] C. Eckberg, CS 537- Component GIS Architectures. Lecture notes on MapObjects Java
Edition, San Diego State University, San Diego, CA, Fall 2007.
[5] D. Falkman, Review: ESRI MapObjects - Java Edition 2. Javaboutique,
http://javaboutique.internet.com/reviews/ESRI/, accessed September 2010, n.d.
[6] FreeTTS 1.2. A speech synthesizer written entirely in Java programming language. Sun
Microsystems, Inc., http://freetts.sourceforge.net/docs/index.php, accessed September
2010, n.d.
[7] High level software design. Target, http://www.the-software-experts.de/e_dta-swdesign-high-level.htm, accessed September 2010, n.d.
[8] Java features. Roseindia.net, http://www.roseindia.net/java/java-introduction/javafeatures.shtml, accessed June 2010, n.d.
[9] Java SE downloads. Oracle, http://www.oracle.com/technetwork/java/javase/
downloads/index.html, accessed September 2010, n.d.
[10] Java programming language. Wikipedia, http://en.wikipedia.org/wiki/Java_
(programming_language), accessed September 2010, n.d.
[11] Java Speech API – Introduction. Java Speech API Programmer's Guide. Sun
Microsystems, Inc., http://java.sun.com/products/java-media/speech/forDevelopers/
jsapi-guide/Introduction.html#7408, accessed September 2010, n.d.
[12] Java Speech API. Oracle, http://java.sun.com/products/java-media/speech/, accessed
September 2010, n.d.
[13] J. O’Conner, Using the swing application framework. Sun Java, http://java.sun.
com/developer/technicalArticles/javase/swingappfr/, accessed September 2010, July
2007.
[14] Map Objects Java edition. ESRI, http://www.thaigis.com/Support/document/
mo_java_bro.pdf, accessed September 2010, n.d.
40
[15] NetBeans IDE for Java developers. NetBeans, http://netbeans.org/downloads/
index.html, accessed September 2010, n.d.
[16] Speech engine. Java Speech API Programmer's Guide. Sun Microsystems, Inc.,
http://java.sun.com/products/java-media/speech/forDevelopers/jsapiguide/SpeechEngine.html, accessed September 2010, n.d.
[17] Speech Synthesis. Java Speech API Programmer's Guide. Sun Microsystems, Inc.,
http://java.sun.com/products/java-media/speech/forDevelopers/jsapiguide/Synthesis.html, accessed September 2010, n.d.
[18] Swing application framework. Wikipedia, http://en.wikipedia.org/wiki/
Swing_Application_Framework, accessed September 2010, n.d.
WORKS CONSULTED
Climategate. Conservapedia, http://www.conservapedia.com/Climategate, accessed
September 2010, n.d.
Climate Research Unit email controversy. Wikipedia, http://en.wikipedia.org/wiki/Climatic_
Research_Unit_email_controversy, accessed September 2010, n.d.
Global cooling. Wikipedia, http://en.wikipedia.org/wiki/Global_cooling, accessed September
2010, n.d.
Global warming articles. Science Daily, http://www.sciencedaily.com/articles/earth_
climate/global_warming/, accessed September 2010, n.d.
Global warming: Early warning signs. Union of Concerned Scientists, http://www.climate
hotmap.org/, accessed September 2010, n.d.
Global warming. Wikipedia, http://en.wikipedia.org/wiki/Global_warming, accessed
September 2010, n.d.
United States Environmental Protection Agency. Climate change. http://epa.gov/
climatechange/kids/index.html, accessed September 2010, n.d.