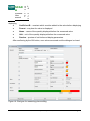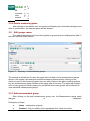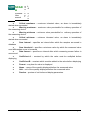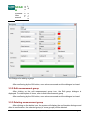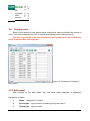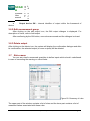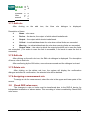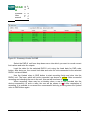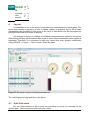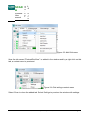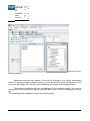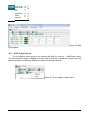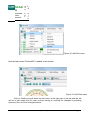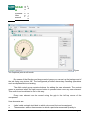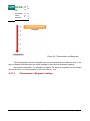
1
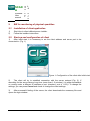
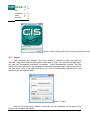
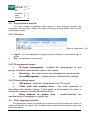
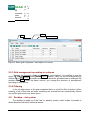
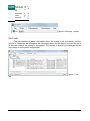
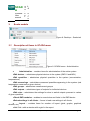
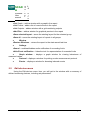
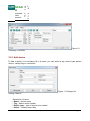
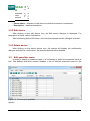
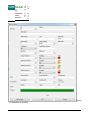
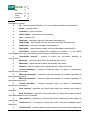
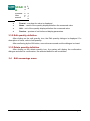
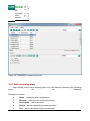
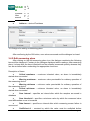
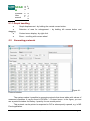
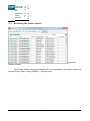
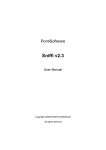
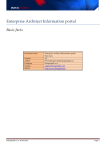
SCADA Software - User manual no. documentation: 212 04-100-02 Author: Ing . Ma rtin Ře zá č reza c@c utter .cz 603 573 605 Document version: 1.0 Date of creation: 29 Ma SCAD A Ve rsi on : 1. 0 Software - D 12 at .1 User e: 2. manual 13 rch 20 13 Last update: Public 12. De ce mb er 20 13 © CUTTER Systems spol. s r.o, 2012 Page 2 SCAD A Ve rsi on : 1. 0 Software - D 12 at .1 User e: 2. manual 13 Contents TOC List of figures TOI Public © CUTTER Systems spol. s r.o, 2012 Page 3 SCAD A Ve rsi on : 1. 0 Software - D 12 at .1 User e: 2. manual 13 1. Introduction 1.1. General information 1.2. Principle of system operation Public © CUTTER Systems spol. s r.o, 2012 Page 4 SCAD A Ve rsi on : 1. 0 Software - D 12 at .1 User e: 2. manual 13 2. SW for monitoring of physical quantities 2.1. Installation of client application 1) 2) Start the cis-client-v##-setup.exe installer Follow the installer instructions 2.2. Start-up and configuration of client 1) After initial start, it is necessary to set the client address and server port to be connected to. (Fig. 1). Figure 1: Configuration of the client after initial start 2) The client will try to establish connection with the server entered (Fig. 2). If searching for the server takes a long time (more than 1-2 minutes), it is either unavailable or running under a different IP address or port (standard port is 11321). To change the settings, you can press Cancel and check or change the client settings. 3) After successful finding of the server, the client downloads the necessary files and opens the login window. Public © CUTTER Systems spol. s r.o, 2012 Page 5 SCAD A Ve rsi on : 1. 0 Software - D 12 at .1 User e: 2. manual 13 Figure 2: After starting, the client is trying to find the server 2.3. Login After launching the software, the Login screen is opened to login and start the software. User name and password options are used to login. For more comfortable login, you can use "Remember username" or possibly "Login automatically" options. The first option fills in the user name, the second one executes automatic login. We recommend to use this option only in the case that there is no risk of unauthorised intervention in the system by an incompetent user. Figure 3: Login Use the "Change server" button to manually set the connection to the server (Fig. Chyba: zdroj odkazu nenalezen). Public © CUTTER Systems spol. s r.o, 2012 Page 6 SCAD A Ve rsi on : 1. 0 Software - D 12 at .1 User e: 2. manual 13 2.4. Program main window The main window is displayed after logging in. Main program functions are contained in the main menu. Some of the items in the menu are only shown if the user has authorisation to them 2.4.1.File menu Figure 4: Main menu - File Logout – the client application is logged out and a dialogue for subsequent login is shown Exit – the application is terminated. 2.4.2.IS management menu IS Users management – enables the management of user groups, individual users and their rights in the system. Server log – the current server log is displayed in a new window. Server Management – contains server characteristics settings. 2.4.3.Client settings menu CSV export – sets basic characteristics of CSV export. Client ends with window close – the client operation is terminated with window closing. If this option is deactivated, the client is minimized to system tray with the window close. Show baloons in system representation of messages in system tray. tray – enables/disables the 2.5. Grid component module The application contains a universal grid component by which means the majority of reports provided by the system. This component also contains the functions to export and print these reports. Public © CUTTER Systems spol. s r.o, 2012 Page 7 SCAD A Ve rsi on : 1. 0 Software - D 12 at .1 User e: 2. manual 13 Print Edit Print preview Refresh Figure 5: Basic grid component - description of controls 2.5.1.Grid arrangement according to columns Besides the functions of the buttons in the control panel, it is possible to use the Export option for arrangement Deleteaccording to individual columns. Carry out the re-arrangement by double left click onto column header according to which the grid should be re-arranged. By Add another double click onto the same column, you change the direction of arrangement according to this column. 2.5.2.Filtering In the top right corner of the grid component there is a field for filter activation. When entering a text in this field, all items containing the entered text are automatically filtered out and the grid shows only these items. 2.6. Desktop – tab system The desktop is made up of the "tab" (or panels) system, which makes it possible to switch between individual functional blocks. Public © CUTTER Systems spol. s r.o, 2012 Page 8 SCAD A Ve rsi on : 1. 0 Software - D 12 at .1 User e: 2. manual 13 Figure 6: Desktop - panels 2.6.1.Info This tab contains all basic information about the system such as software version, volume of transferred data between the client application and the server and also the list of all devices currently connected to the system. The devices in this list are displayed without any linkage to the system configuration. Figure 7: Info tab Public © CUTTER Systems spol. s r.o, 2012 Page 9 SCAD A Ve rsi on : 1. 0 Software - D 12 at .1 User e: 2. manual 13 3. Scada module Figure 8: Desktop – Scada tab 3.1. Description of items in SCADA menu Figure 9: SCADA menu - Administration Administration – contains items for administration of the entire system Edit devices – administers physical devices in the system (DKD11 and ABV) Edit quantities – administers physical quantities in the system (concentration, temperatures) measurings – administers measured quantities appearing in the system (real temperature measured on given device) Edit Edit groups – administers measurement groups Edit outputs – administers types of outputs for individual devices Edit rules – administers the settings for rules to switch outputs pursuant to values of given quantities Check DKD modules – enables to record rules and limits in the DKD device Reload settings in all clients – forces to load new settings in all clients. Layout – contains items for creation of layout (grids, graphs, graphical window, etc.) Add Public Grid– adds a window with a grid in the report © CUTTER Systems spol. s r.o, 2012 Page 10 SCAD A Ve rsi on : 1. 0 Software - D 12 at .1 User e: 2. manual 13 Add Graph – adds a window with a graph in the report Add Events – adds a list of recent events in the report Add Outputs – adds a window with a grid containing outputs Add Plan – adds a window for graphical preview in the report Save selected layout – saves the existing layout for the selected group Save all – saves the existing layout of reports in all groups Window Restore Windows – returns the report to the state saved last time Settings Sound Hide – enables/disables audio notification of exceeding limits Event notification – hides the tool for representation of exceeded limits Graph window – displays a graph window for viewing behaviours of measured values Protocol – displays a window for printing a value measurement protocol Events – displays a window for browsing induced events 3.2. Edit devices menu Using the Edit devices menu item, you will get to the window with a summary of defined measuring devices, including set parameters. Public © CUTTER Systems spol. s r.o, 2012 Page 11 SCAD A Ve rsi on : 1. 0 Software - D 12 at .1 User e: 2. manual 13 Figure 10: Summary of devices 3.2.1.Add device To add a device, it is necessary fill in a name, you can select a tag, device type, parent device, validity flag or a comment. Figure 11: Dialogue for adding a device Description of items • • • • Public Name – device name Tag – device serial number Device type – type of device to be added Active – validity record flag © CUTTER Systems spol. s r.o, 2012 Page 12 SCAD A Ve rsi on : 1. 0 Software - D 12 at .1 User e: 2. manual 13 • Parent name – selection of the device to which the element is connected • Description – detailed description 3.2.2.Edit device After clicking on the edit device icon, the Edit device dialogue is displayed. For description of items, refer to Add device. After confirming by the OK button, new values are saved and the dialogue is closed. 3.2.3.Delete device After clicking on the delete device icon, the system will display the confirmation dialogue and after its confirmation, the selected devices will be deleted. 3.3. Edit quantities menu In order to display a measured value, it is necessary to define the measured value at first. The defined quantities window displays a list of defined quantities saved in the Figure 12: Summary of quantities system. Public © CUTTER Systems spol. s r.o, 2012 Page 13 SCAD A Ve rsi on : 1. 0 Software - D 12 at .1 User e: 2. manual 13 3.3.1.Add quantity definition After clicking on the Add new definition icon, the following dialogue is displayed: Public © CUTTER Systems spol. s r.o, 2012 Page 14 SCAD A Ve rsi on : 1. 0 Software - D 12 at .1 User e: 2. manual 13 Figure 13: Definition of quantity Public © CUTTER Systems spol. s r.o, 2012 Page 15 SCAD A Ve rsi on : 1. 0 Software - D 12 at .1 User e: 2. manual 13 Description of items ID – internal quantity identifier (it is set up by the hardware manufacturer) Name – quantity name Comment – user's comment Abbreviation – short name of the quantity Unit – quantity unit Data type – data type (set up by hardware manufacturer) Data length – data length in bytes (set up by hardware manufacturer) Coefficient – (set up by hardware manufacturer) Byte mask – (state quantity mask) (set up by hardware manufacturer) Cumulative – specifies whether the quantity is cumulative – i.e. the values are displayed as a sum of incoming partial values in a defined time interval Cumulative interval – interval in which the cumulative quantity is summarized Minimum – minimum value which the quantity may reach Maximum – maximum value which the quantity may reach Enabled – flag for validity of the appropriate limit value and colour Critical maximum – maximum tolerated value, an alarm is immediately started when exceeded Warning maximum – maximum value permissible for ordinary operation of the measuring device Warning minimum – minimum value permissible for ordinary operation of the measuring device Critical minimum – minimum tolerated value, an alarm is immediately started when exceeded Save interval – specifies an interval after which the samples are saved in database Save threshold – specifies a minimum value by which the measured value must differentiate so as to be saved Data timeout – specifies an interval after which measuring sensor failure is announced Coefficient A – constant by which the value must be multiplied before displaying Public Coefficient B – constant which must be added to the value before displaying © CUTTER Systems spol. s r.o, 2012 Page 16 SCAD A Ve rsi on : 1. 0 Software - D 12 at .1 User e: 2. manual 13 Format – way how the value is displayed Name – name of the quantity displayed before the measured value Unit – unit of the quantity displayed before the measured value Preview – preview of set limits and display parameters 3.3.2.Edit quantity definition After clicking on the edit quantity icon, the Edit quantity dialogue is displayed. For description of items, refer to Add quantity. After confirming by the OK button, new values are saved and the dialogue is closed. 3.3.3.Delete quantity definition After clicking on the delete quantity icon, the system will display the confirmation dialogue and after its confirmation, the selected definition will be deleted. 3.4. Edit measurings menu Public © CUTTER Systems spol. s r.o, 2012 Page 17 SCAD A Ve rsi on : 1. 0 Software - D 12 at .1 User e: 2. manual 13 Figure 14: Summary of measuring places 3.4.1.Add measuring place After clicking on the add measuring place icon, the dialogue containing the following items will be displayed: Description of items Name – measuring place designation Quantity – selection of a monitored quantity Description – user's comment Device – device transmitting measured values Port – port to which the device is connected Public © CUTTER Systems spol. s r.o, 2012 Page 18 SCAD A Ve rsi on : 1. 0 Software - D 12 at .1 User e: 2. manual 13 Address – device IP address Figure 15: Dialogue for adding a measuring place After confirming by the OK button, new values are saved and the dialogue is closed. 3.4.2.Edit measuring place After clicking on the edit measuring place icon, the dialogue containing the following items will be displayed: Contrary to the dialogue displayed while creating a new measuring place, it shows also the items inherited from the selected measured quantity whereas they can be re-defined after unchecking the appropriate check box. Description of items Critical maximum – maximum tolerated value, an alarm is immediately started when exceeded Warning maximum – maximum value permissible for ordinary operation of the measuring device Warning minimum – minimum value permissible for ordinary operation of the measuring device Critical minimum – minimum tolerated value, an alarm is immediately started when exceeded Save interval – specifies an interval after which the samples are saved in database Save threshold – specifies a minimum value by which the measured value must differentiate so as to be saved Data timeout – specifies an interval after which measuring sensor failure is announced Public Coefficient A – constant by which the value must be multiplied before © CUTTER Systems spol. s r.o, 2012 Page 19 SCAD A Ve rsi on : 1. 0 Software - D 12 at .1 User e: 2. manual 13 displaying Coefficient B – constant which must be added to the value before displaying Format – way how the value is displayed Name – name of the quantity displayed before the measured value Unit – unit of the quantity displayed before the measured value Preview – preview of set limits and display parameters After confirming by the OK button, new values are saved and the dialogue is closed. Figure 16: Dialogue for measuring place editing Public © CUTTER Systems spol. s r.o, 2012 Page 20 SCAD A Ve rsi on : 1. 0 Software - D 12 at .1 User e: 2. manual 13 3.4.3.Delete measuring place After clicking on the delete icon, the system will display the confirmation dialogue and after its confirmation, the selected place will be deleted. 3.5. Edit groups menu The measuring places can be joined together in groups that are displayed as tabs in the main window of the module. Figure 17: Summary of measurement groups The window is divided into 2 parts; the upper part includes a list of measurement groups saved in the system, the lower part includes measuring places and by clicking on the check box next to the measuring place you can add or remove the given measuring place into the measurement group checked in the upper part of the form. The other tab contains a list of user groups by which means you can define which user groups will be allowed to view individual measurement groups. 3.5.1.Add measurement group After clicking on the add measurement group icon, the Measurement group detail dialogue is displayed. Description of items Name – designation of group Enabled – flag for validity of the appropriate limit value and colour Public © CUTTER Systems spol. s r.o, 2012 Page 21 SCAD A Ve rsi on : 1. 0 Software - D 12 at .1 User e: 2. manual 13 Critical maximum – maximum tolerated value, an alarm is immediately started when exceeded Warning maximum – maximum value permissible for ordinary operation of the measuring device Warning minimum – minimum value permissible for ordinary operation of the measuring device Critical minimum – minimum tolerated value, an alarm is immediately started when exceeded Save interval – specifies an interval after which the samples are saved in database Save threshold – specifies a minimum value by which the measured value must differentiate so as to be saved Data timeout – specifies an interval after which measuring sensor failure is announced Coefficient A – constant by which the value must be multiplied before displaying Coefficient B – constant which must be added to the value before displaying Format – way how the value is displayed Name – name of the quantity displayed before the measured value Unit – unit of the quantity displayed before the measured value Preview – preview of set limits and display parameters Public © CUTTER Systems spol. s r.o, 2012 Page 22 SCAD A Ve rsi on : 1. 0 Software - D 12 at .1 User e: 2. manual 13 Figure 18: Dialogue for adding a group After confirming by the OK button, new values are saved and the dialogue is closed. 3.5.2.Edit measurement group After clicking on the edit measurement group icon, the Edit group dialogue is displayed. For description of items, refer to Add measurement group After confirming by the OK button, new values are saved and the dialogue is closed. 3.5.3.Deleting measurement group After clicking on the delete icon, the system will display the confirmation dialogue and after its confirmation, the selected group (or more groups) will be deleted. Public © CUTTER Systems spol. s r.o, 2012 Page 23 SCAD A Ve rsi on : 1. 0 Software - D 12 at .1 User e: 2. manual 13 3.6. Outputs menu Some of the devices in the system have outputs that can be switched by means of rules. This menu contains only a list of outputs that belong to the existing devices. This list is generated at the first installation and incompetent intervention may result in malfunction of the system. Figure 19: Summary of outputs in the system 3.6.1.Add output After clicking on the add output icon, the New output dialogue is displayed. Description of items Name – designation of output Device type – type of device containing the given output Output type – type of output Public © CUTTER Systems spol. s r.o, 2012 Page 24 SCAD A Ve rsi on : 1. 0 Software - D 12 at .1 User e: 2. manual 13 Output device SN – internal identifier of output within the framework of device 3.6.2.Edit measurement group After clicking on the edit output icon, the Edit output dialogue is displayed. For description of items, refer to Add output After confirming by the OK button, new values are saved and the dialogue is closed. 3.6.3.Delete output After clicking on the delete icon, the system will display the confirmation dialogue and after its confirmation, the selected output (or more outputs) will be deleted. 3.7. Rules menu You can set rules for measured quantities to define inputs which should make/break in case of exceeding the warning or critical limits. Figure 20: Summary of rules The upper part of the window contains a list of rules and the lower part contains a list of measured values associated with these rules. Public © CUTTER Systems spol. s r.o, 2012 Page 25 SCAD A Ve rsi on : 1. 0 Software - D 12 at .1 User e: 2. manual 13 3.7.1.Add rule After clicking on the add icon, the New rule dialogue is displayed. Description of items Name – rule name Device – the device, the output of which should make/break. Output – the output which should make/break Critical – to activate/deactivate the rule when critical limits are exceeded Warning – to activate/deactivate the rule when warning limits are exceeded Output value – the value to which the output should be set in case the limits are exceeded. (1 for make in case the limit is exceeded, 0 for break in case the limit is exceeded) 3.7.2.Edit rule After clicking on the edit rule icon, the Edit rule dialogue is displayed. For description of items, refer to Add rule. After confirming by the OK button, new values are saved and the dialogue is closed. 3.7.3.Delete rule After clicking on the delete rule icon, the system will display the confirmation dialogue and after its confirmation, the selected rule will be deleted. 3.7.4.Assigning a measurement rule To assign a rule for measurement, select the rule in the upper and lower parts of the screen. 3.8. Check DKD rules menu The changes in rules or limits must be transferred also to the DKD11 device for independent evaluation of alarms states. This recording of rules is enabled by Check DKD rules menu. Public © CUTTER Systems spol. s r.o, 2012 Page 26 SCAD A Ve rsi on : 1. 0 Software - D 12 at .1 User e: 2. manual 13 Figure 21: Summary of rules for DKD Select the DKD11 unit from drop-down menu into which you want to record current limit values and rules for outputs. Load the data for the selected DKD11 unit using the Load data for DKD rules button. After doing so, the current limit data and rules for units connected to the selected DKD11 unit are loaded. Use the Upload rules to DKD button to start recording limits and rules into the DKD11 unit. The rows, which will not be recorded, are shown in yellow. After successful recording and checking the row in the unit, this row will be shown in green. When recording, there may be a situation when a row is not recorded into the device successfully. In such a case, the row will be shown in red. After completion of recording, it is possible to re-record the unsuccessful limits by pressing down the Upload rules to DKD button again. Public © CUTTER Systems spol. s r.o, 2012 Page 27 SCAD A Ve rsi on : 1. 0 Software - D 12 at .1 User e: 2. manual 13 4. Layout It is possible to set up the layout of the data from measurement for each group. The layout may contain a summary of data in tables, graphs or graphical layout. All of these components can be added to the group in the form of tabs which can be rearranged by pulling the tab within the scope of window. All changes in layout or settings of individual components are copied to the server after saving and they are distributed from there to other client workstations when update is requested. Therefore, it is necessary to save any layout after every greater modification using (SCADA → Layout → Save current / Save all) menu. Figure 22: Example of layout of displayed elements The resulting layout may look like in the figure: 4.1. Add Grid menu You can add windows to the current tab according to group for overview of the system state. The first window is the one with a table Public © CUTTER Systems spol. s r.o, 2012 Page 28 SCAD A Ve rsi on : 1. 0 Software - D 12 at .1 User e: 2. manual 13 Figure 23: Add Grid menu Now the tab named "DockedGridView" is added in the window and by a right click on this tab, a context menu is produced: Figure 24: Grid settings context menu Select Close to close the added tab. Select Settings to produce the window with settings. Public © CUTTER Systems spol. s r.o, 2012 Page 29 SCAD A Ve rsi on : 1. 0 Software - D 12 at .1 User e: 2. manual 13 Figure 25: Grid settings window Measured quantities are added to the grid by clicking on the Select measurings button for opening another window where you can choose the given quantities from the tree menu and press OK. The tab can be arbitrarily renamed in the settings window. The selected quantities will now be displayed in the settings window. You can rearrange them by selecting and pulling or delete them from the list by pressing the Delete key. The quantities will be added in the grid by confirming OK: Public © CUTTER Systems spol. s r.o, 2012 Page 30 SCAD A Ve rsi on : 1. 0 Software - D 12 at .1 User e: 2. manual 13 Figure 26: Add Grid window 4.2. Add Graph menu It is possible to add a graph in the current tab. Add it in Layout → Add Graph menu. The item named "Graph" is added by a right click on this tab to show the context menu as previously done by selecting Settings to open the settings window: Figure 27: Grid settings context menu Public © CUTTER Systems spol. s r.o, 2012 Page 31 SCAD A Ve rsi on : 1. 0 Software - D 12 at .1 User e: 2. manual 13 Figure 28: Graph settings window The tab can be arbitrarily renamed in the settings window. The graph is added by clicking on the Add Graph button. If more of them are required, you can rearrange them as necessary by pulling them by the green header. Click on the Select button to select the particular quantity or quantities you want to display in the graph. After confirming with OK, the resulting graph will appear as follows: Public © CUTTER Systems spol. s r.o, 2012 Page 32 SCAD A Ve rsi on : 1. 0 Software - D 12 at .1 User e: 2. manual 13 Figure 29: Window with set graph 4.3. Add Events It is possible to add events in the current tab. This grid displays several recent events in the system. It has no special setting. 4.4. Add Outputs Public © CUTTER Systems spol. s r.o, 2012 Page 33 SCAD A Ve rsi on : 1. 0 Software - D 12 at .1 User e: 2. manual 13 Figure 30: Outputs For summary of output states at ABV or DKD11 ports and their controls there is a summary of outputs. Add them through SCADA → Layout → Add outputs menu. 4.4.1.Description of columns Device – name of device for which the output is registered Output – name of output on the device Value – state of output on the device green icon - active input grey icon – inactive icon Forced – state of forced rewriting of output controlling. If an output is mapped to the rule, it is switched by this rule and the user has no option to change the state unless controlling is rewritten by force yellow grey icon – output can be controlled manually. icon – output is controlled automatically according to rules. Date – date and time when records of the state of the output arrived for the last time On/Off button – sets the output Forced check box– enables manual rewriting of controls of outputs bound to rules. Public © CUTTER Systems spol. s r.o, 2012 Page 34 SCAD A Ve rsi on : 1. 0 Software - D 12 at .1 User e: 2. manual 13 Figure 31: Output settings 4.4.2.Output settings You can select which outputs will be displayed in the selected grid in the output settings. Select a device in Device pull-down menu and select an output from Output menu which you want to add. After pressing down the Add (+) button, add a new output in the list below. You can change the position of the output in such a way that you use mouse to select the row with the output which you want to move and drag it to the desired position. The output is deleted in such a way that you select the appropriate output in the list of outputs and press down the Delete key. 4.5. Add Plan menu Public © CUTTER Systems spol. s r.o, 2012 Page 35 SCAD A Ve rsi on : 1. 0 Software - D 12 at .1 User e: 2. manual 13 Figure 32: Add Plan menu Now the tab named "DockedGA" is added in the window: Figure 33: Add Plan menu Click on Settings to pull down the edit menu in the right part of the tab and the tab will be in edit mode until the user confirms saving or undoing the changes by pressing down the Save or Undo changes buttons. Public © CUTTER Systems spol. s r.o, 2012 Page 36 SCAD A Ve rsi on : 1. 0 Software - D 12 at .1 User e: 2. manual 13 Figure 34: Graphical plan in edit mode By means of the Background image control group you can set up the background of the tab using any picture file. The background provides elementary handling operations such as displacement and scaling. The Add control group contains buttons for adding the user elements. The context menu is produced when the right mouse button is pressed down over any user element. This control can be deleted or set in this way. Every user element can be moved using the grip in the left top corner of the component. User elements are: Public Label: adds a simple text label to which colour and font can be assigned. Thermometer: adds a thermometer to which a particular measured quantity is © CUTTER Systems spol. s r.o, 2012 Page 37 SCAD A Ve rsi on : 1. 0 Software - D 12 at .1 User e: 2. manual 13 assigned. Gauge: adds a gauge o which a particular measured quantity is assigned. Bargraph: adds a bargraph to which a particular measured quantity is assigned. Setting is briefly illustrated in the following figure. 4.5.1.Label Figure 35: Label Labels make it possible to add any text on the area of the plan. They serve primarily for designation of background data. 4.5.2.Thermometer and Bargraph Public © CUTTER Systems spol. s r.o, 2012 Page 38 SCAD A Ve rsi on : 1. 0 Software - D 12 at .1 User e: 2. manual 13 Figure 36: Thermometer and Bargraph The thermometer and the bargraph are two elements that are different only in the style of display. But they have the same settings so they will be described together. Using these elements, it is possible to display the state of a quantity on the simple scale in the form of a thermometer or just one column / row. 4.5.2.1. Public Thermometer / Bargraph settings © CUTTER Systems spol. s r.o, 2012 Page 39 SCAD A Ve rsi on : 1. 0 Software - D 12 at .1 User e: 2. manual 13 Figure 37: Thermometer / Bargraph settings In Fig 37., you can see a dialogue window for setting the appearance of Thermometer and Bargraph elements. In the Measuring place group, you can select a quantity you wish to display using the Select button. In the Scale group, you can set minimum and maximum of the scale and a large step displayed on the scale. In the Appearance group, you can set the appearance of the element and displayed information. 4.5.3.Gauge Public © CUTTER Systems spol. s r.o, 2012 Page 40 SCAD A Ve rsi on : 1. 0 Software - D 12 at .1 User e: 2. manual 13 Figure 38: Gauge The Gauge makes it possible to display the measured value in the style of analogue pointer instruments. The options are shown in the figure 39. Figure 39: Gauge settings Much like in other elements, it is possible to select the measured quantity in the Public © CUTTER Systems spol. s r.o, 2012 Page 41 SCAD A Ve rsi on : 1. 0 Software - D 12 at .1 User e: 2. manual 13 Measuring Place group at first. The Scale group contains again setting the scale and divisions on it. There are two scroll bars newly. StartAngle makes it possible to turn the origin of the scale. SweepAngle sets the size of sector which is used for drafting the scale. In the Appearance group, you can set the appearance of the control again. Public © CUTTER Systems spol. s r.o, 2012 Page 42 SCAD A Ve rsi on : 1. 0 Software - D 12 at .1 User e: 2. manual 13 5. Data viewing The system provides access to the measured data in several different ways that will be described in this Chapter later. 5.1. Viewing of measured quantity development Bx means of the Graph tool, you can display the development of any quantity in a separate window. Figure 40: Quantity graph development window The controls are apparent from the figure 40. Left to right: Update button – loads the development from the database according to current settings Select button – selects the desired quantity for representation Selection of time frame From – To – selects the data within the desired data range Public Thickness and colour of line – development display settings © CUTTER Systems spol. s r.o, 2012 Page 43 SCAD A Ve rsi on : 1. 0 Software - D 12 at .1 User e: 2. manual 13 5.1.1.Graph handling Graph displacement - by holding the central mouse button. Selection of area for enlargement – by holding left mouse button and dragging Context menu display– by right click Zoom – scrolling with mouse wheel 5.2. Generating protocols Figure 41: Protocol window The system makes it possible to generate protocols that show tables with values of measured quantities. It can be found in SCADA → Protocol menu. In the figure, you can see a protocol window for Battery I quantity for one-month period. This protocol can be printed or exported to CVS a subsequently opened, e.g. in MS Excel application. Public © CUTTER Systems spol. s r.o, 2012 Page 44 SCAD A Ve rsi on : 1. 0 Software - D 12 at .1 User e: 2. manual 13 5.3. Browsing the recent events Figure 42: Events window The Events window serves for browsing the events arisen in the system within the set time frame. Open it using SCADA → Events menu. Public © CUTTER Systems spol. s r.o, 2012 Page 45