1
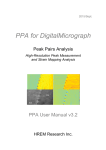
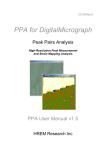
2014/June
qHAADF
for DigitalMicrograph
Quantitative High Angle Annular Dark
Field Image Analysis
qHAADF User Manual v1.3
HREM Research Inc.
HREM Research Inc.
qHAADF for DM Manual
Contact Information
General enquiries on the qHAADF plug-in for Digital Micrograph should be sent
to:
HREM Research Inc.
14-48 Matsukazedai
Higashimatsuyama
Saitama 355-0055
Japan
Email:
Website:
[email protected]
http://www.hremresearch.com /
Technical enquiries should be directed to:
Dr. Sergio I. Molina
Univ. de Cádiz, Spain
Email:
Website:
[email protected]
http://mse.com.es
Acknowledgements
The scientific developers of this method (Prof. Sergio I. Molina, Prof. Pedro L.
Galindo and Dr. J. Pizarro) would like to acknowledge to all authors of the references
cited in this manual for their collaboration in the process of its application to the
scientific problems presented in these cited papers.
Copyright Statements
© Copyright 2012-2014 HREM Research Inc (Japan) and Universidad de Cádiz
(Spain)
All rights reserved. This manual is protected by international copyright laws and
treaties. Unauthorized reproduction and distribution of this manual, or any portion of it,
will be prosecuted to the maximum extent possible and may result in severe civil and
criminal penalties.
Portions of this document were prepared by HREM Research Inc. by editing the
materials supplied by Dr. Sergio I. Molina, Dr. Pedro L. Galindo and Dr. Joaquín
Pizarro
DigitalMicrograph is a trademark of Gatan Inc.
2
HREM Research Inc
HREM Research Inc.
qHAADF for DM Manual
Introduction to Quantitative High Angle Annular
Dark Field Image Analysis (qHAADF)
qHAADF stands for Quantitative High Angle Annular Dark Field Image Analysis, the
DigitalMicrograph plug-in for atomic column-to-column compositional analysis of materials.
All results obtained by qHAADF are fully compatible with other functions present in DM.
For example, compositional maps can be analysed and/or manipulated with functions such as
histograms, statistics (mean, standard deviation, min, max etc.), or using the corresponding
buttons, such as the Profile utility.
The main references for the algorithm are:
[1] Column-by-column compositional mapping by Z-contrast imaging
S.I. Molina, D.L. Sales, P.L. Galindo, D. Fuster, Y. González, B. Alén, L. González,
M. Varela and S.J. Pennycook
Ultramicroscopy 109 (2009) 172–176
doi:10.1016/j.ultramic.2008.10.008
(see also Erratum on Ultramicroscopy 109 (2009) 1315)
[2] Compositional Analysis with Atomic Column Spatial Resolution by 5th-Order
Aberration-Corrected Scanning Transmission Electron Microscopy
D. Hernández-Maldonado, M. Herrera, P. Alonso-González, Y. González, L. González,
J. Gázquez, M. Varela, S. J. Pennycook, M. P. Guerrero-Lebrero, J. Pizarro, P. L.
Galindo and S. I. Molina
Microscopy & Microanalysis 17 (2011) 1-4
doi: 10.1017/S1431927611000213
[3] Distribution of Bismuth Atoms in GaAsBi Epilayers
D. L. Sales, E. Guerrero, J. F. Rodrigo, A. Yáñez, P. L. Galindo, M. Shafi, A. Khatab,
M. Henini, S. Novikov, M. F. Chisholm and S. I. Molina
Appl. Phys. Lett. 98 (2011) 101902:1-3
doi:10.1063/1.3562376
This manual will help you to use of the qHAADF package with some worked examples.
Software requirements
The following is a list of the software requirements necessary to run the qHAADF plug-in:
-
DigitalMicrograph (GATANTM )
USB Key Driver
HREM Mouse Tool Plug-in (Free-ware downloadable from www.hremresearch.com)
IPU Plug-in (Free-ware downloadable from www.hremresearch.com)
3
HREM Research Inc
HREM Research Inc.
qHAADF for DM Manual
Software Installation
Installing USB Key Driver
The user key driver should be installed by following the instructions given by the key driver
installer. You can find the key driver installer at the plug-in page on HREM Research web
site.
Installing DigitalMicrograph Plug-ins
The DigitalMicrograph Plug-in will be provided as Gatan compiled script file(s) (.gtk) and
dynamic link library file(s) (.dll). All these files can be installed by copy-and-paste to the
folder “PlugIns.” (The PlugIns folder should exist under a normal installation of the
DigitalMicrograph).
When the DigitalMicrograph is launched after placing the plug-ins into the PlugIns folder, the
PlugIns will appear as a new menu or an addition to the standard tools.
Installing Mouse Tools
All the files relating Mouse tool plug-in can be installed
by copy-and-paste to the folder “PlugIns.” The Mouse
tool will appear as an addition to the standard tools.
Installing IPU Plug-in
The qHAADF plug-in uses some functions based on the Intel’ MKL (Math Kernel Library)
provided by the IPU plug-in. All the files relating the IPU plug-in can be installed by copyand-paste copy. The IPU plug-in will appear as under IPU menu. Please consult the ReadMe
file that comes with the IPU plug-in.
Installing qHAADF
qHAADF.gtk and qHAADF.dll can be installed by
copy-and-paste to the folder “PlugIns”. The qHAADF
plug-in will appear under qHAADF menu.
Installing Polygon ROI Tools
The Polygon ROI tool comes with the qHAADF plug-in.
This tool will be installed in the same way as the Mouse
tool. The Polygon ROI tool will appear as an addition to
the standard tools.
4
HREM Research Inc
HREM Research Inc.
qHAADF for DM Manual
Getting Started
Open the file “Test image.dm3” using the DM command File…Open.
This image was taken from a sample that consists of two InAs layers of 1.4 monolayers (ML)
and 0.9 ML of InAs, respectively, grown by molecular beam epitaxy on a GaAs (001) at a
substrate temperature of 500ºC. Further growth and sample preparation details can be found
elsewhere1. The layer structure of this sample is shown above.
In this example, qHAADF package is used to measure atomic column by column the
percentage of In and Ga atoms on each cationic column.
All the commands related to qHAADF are located in the menu qHAADF.
1
Microscopy & Microanalysis 17 (2011) 1-4.
5
HREM Research Inc
HREM Research Inc.
qHAADF for DM Manual
Image pre-processing
Filtering can be used to improve the quality of images with "snow" or other noise resulting
from poor reception conditions. There exist two commands to denoise images, Fourier and
Real Space Noise Filter. However, it is important to notice that all later calculations leading to
compositional determination are done using raw data (from detector black level subtracted
original image).
Fourier Space Noise Filter
The first command to be applied to the image is to calculate the Power Spectrum of the
image:
Now, using the mouse tool, click on desired
spots. The usual choice is to select the
brightest spots in the spectrum, but those
corresponding to higher harmonics can also
be selected:
The user doesn’t need to hit the spot exactly,
because qHAADF looks for the local
maxima near the selected point. Anyway,
you can zoom in the spectrum before hitting
peaks using the DM zoom tool:
6
HREM Research Inc
HREM Research Inc.
qHAADF for DM Manual
Hint: if you wish to delete any spot,
just click on the mouse mark again
with the SHIFT key down.
Hint: Symmetry in the selection for
each spot is assumed.
Don’t be surprised if the central spot is not present in the power spectrum. It just indicates that
the mean intensity of the image is zero.
We are now ready to apply a Bragg Filter. This process creates an image where the contrast
resulting from the ordered regions is clearly distinguishable from the background intensity.
The shape and size of the Bragg filter must be adjusted such that no loss of information
occurs. In this dialog box we can determine the size (in pixels), smoothing width (in pixels),
oval ratio (height/width) and direction (in degrees) of mask spots.
7
HREM Research Inc
HREM Research Inc.
qHAADF for DM Manual
By pressing the Apply button, the mask described by the chosen parameters may be previsualized, as it is shown in these two examples:
Let us select the first choice by pressing
the OK button, and the Bragg filtered
image will appear immediately.
If Bragg filter parameters are properly
chosen (big masks and a sufficient number
of peaks), the resulting filtered image will
preserve the location of maxima. The
great advantage in using the filtered image
is the reduction of noise.
8
HREM Research Inc
HREM Research Inc.
qHAADF for DM Manual
Real Space Noise Filter
qHAADF package offers two different types of Real Space filter:
(i) Wiener Filter
(ii) Low Pass Filter.
Wiener filter:
The Wiener filter is widely used for image restoration and calculates the optimal filter for the
removal of noise from a signal which is corrupted by the measuring process itself. It assumes
that if noise is present in the system, then it is considered to be additive white Gaussian noise.
After selecting the original image, and applying the Adaptive Wiener Filter in the menu, the
user should decide the size of the windows used for calculating the Adaptive Average and the
Noise Estimation, as follows:
In a typical qHAADF session, if Wiener filtering is desired, it is usually the first operation to
be applied to the original image. The result of the Wiener filtering operation on qHAADF
Test image and respective Power Spectra (Adaptive Average =10, Noise Estimation=10) is
depicted below.
9
HREM Research Inc
HREM Research Inc.
qHAADF for DM Manual
Low Pass Filtering
In order to generate a Low-Pass filtered image, we simply select the input image and use the
Low Pass Filter command in the menu. The strength of the filter is defined by the radius of
the mask in pixels (the highest the radius, the strongest the filter):
In the following figure, the resulting images after the application of a Low-Pass filter to the
Test image with different radius are shown:
Original image
Low Pass Filtered (Radius=1)
10
Low Pass Filtered (Radius=3)
HREM Research Inc
HREM Research Inc.
qHAADF for DM Manual
Motif Detection
Motif Detection focus on locating peaks of intensity in the image.
In order to achieve it, three steps must be
followed:
Step 1. x-Cross Correlation Histogram
Step 2. x-Cross Correlation with Refined
Motif
Step 3. Find Motif Centers
To determine quantitatively the InGaAs composition distribution in the image, cation peaks of
intensity will be located.
Step 1: Use the Rectangle ROI tool and select the motif. You can zoom in the filter image
before selecting the motif by using the Zoom tool.
Select the x-Corr Histogram in the Motif Detection submenu. A dialog shown below will
open:
After clicking OK, a new window will appear showing the histogram of all maxima found in
the Cross-Correlation map, obtained using the User-Selected motif and the original image.
11
HREM Research Inc
HREM Research Inc.
qHAADF for DM Manual
There will be a single point with unit value, which corresponds to the selected motif location,
and the remaining peaks will correspond to areas in the image quite similar to the selected
motif. Its cross-correlation value is a measure of similarity, being possible values in the range
from -1 (completely different) to 1 (exactly the same). Usually, peaks have cross-correlation
values above 0.5.
Step 2: The next step is to obtain a refined motif using all those patterns in the image, which
give high cross-correlation value with the selected motif. To do so, the user should select the
range of desired cross-correlation value in the histogram by using the Select and Move
Objects tool (Arrow tool).
When threshold is selected, the discovered motifs will be classified to red or blue depending
on their cross-correlation values: red indicate the motif, whose cross-correlation value is
higher than the selected threshold, while blue indicate the motif equal to or lower than the
threshold. The peak colour will be dynamically revised by changing the threshold.
12
HREM Research Inc
HREM Research Inc.
qHAADF for DM Manual
Select the x-Corr with Refined Motif in the Motif Detection submenu.
In doing so, two operations are automatically done.
First, a refined motif is calculated by averaging all patterns associated to each point in the
histogram above the chosen threshold (0.68 in the figure). The average motif is automatically
shown:
The second operation is the calculation of a new histogram of all maxima found in the CrossCorrelation map, obtained using the Refined motif and the original image. Usually, peaks
have cross-correlation values in the range 0.7-0.9.
13
HREM Research Inc
HREM Research Inc.
qHAADF for DM Manual
Step 3: The last step consists of repeating the selection of values in the new histogram, which
is determined from the refined motif.
The discovered motifs will be classified to red or blue as before. The peak colour will be
dynamically revised by changing the threshold.
And then select the Find Motif Centers in the Motif Detection submenu.
Peak Threshold indicates the minimum cross-correlation value with the refined motif to be
considered as a valid peak. This value will be read from the minimum value of the Range ROI
in the histogram. Peaks having cross-correlation values below this threshold will be discarded.
If we want to restrict the distance between the motifs, it is possible to define the Minimum
Motif Distance in the first dialog of the Motif Detection.
By pressing OK, the centers of the valid motifs will be shown over the filtered image as
shown below:
14
HREM Research Inc
HREM Research Inc.
qHAADF for DM Manual
15
HREM Research Inc
HREM Research Inc.
qHAADF for DM Manual
Integration areas definition
qHAADF allows you to define three different Intensity Integration Areas: main, secondary
and third integration Area. Main area will be shown using red spots, secondary area using
green spots and third integration area using yellow spots.
The HREMPolygonROI tool is used to define Integration Areas
Zoom the filter image and define a polygon by using the HREM Polygon ROI tool. At first
select the Polygon ROI, and click the first point, then move the mouse pointer to the next
point and click to fix the second point. In this way, you can define the polygon of any number
of vertices. Press double click when finished. The polygon will be drawn in green. If you
make any error in the polygon definition, you can delete it (Select the ROI and press Delete
key).
To define Intensity Integration Area select Create Mask for in the menu and define the main
Area.
A set of red spots inside the polygon will be shown and they will define the Integration Area.
You can add or deleted spots by using the Polygon ROI tool: Select the Polygon ROI tool,
and click a new pixel to add a point or a selected (red) point to delete the point, when pressing
the ALT key.
Repeat the process to define the secondary (Green) and third (Yellow) Integration Area in the
same way, if necessary.
16
HREM Research Inc
HREM Research Inc.
qHAADF for DM Manual
By selecting the option Show/Hide Intensity Masks the Integration Areas in the whole image
will be shown or hided.
Main and secondary Integration Area can be exchanged by selecting the Change Main/Second
in the menu.
Once the Intensity Integration Areas have been determined, intensity maps can be drawn.
17
HREM Research Inc
HREM Research Inc.
qHAADF for DM Manual
Main Area shows intensity map from the main Integration Area defined. Ratio shows
intensity map by dividing the first Integration Area by the second one. Corrected Ratio shows
intensity map by computing the three integration areas as indicated in the window. The
display type can be defined as polygon type or circle type at different radius. To show
intensity maps at least the main Integration Area must be defined.
The color circles can be shown on the original image and/or on the intensity map. The latter
display is useful for drawing a line profile of the intensity. The Display Range is used to
modify the colour scale.
Display type polygon
Display type circle
18
HREM Research Inc
HREM Research Inc.
qHAADF for DM Manual
Compositional Analysis
Once all Integration Areas have been determined, we can proceed to the calculation of
compositional maps. Although there are three Integration Areas, the results presented in this
section relates to the main Integration Area.
Step 1: Reference area definition
A very important step is to define the reference area, that is to say, the area which is
considered to correspond to the substrate (with 0% In in this example, that is, GaAs). All
values will be referred to this area. Use the Rectangle ROI tool (Region Of Interest tool) or
Polygon ROI tool to select a reference area in the image. Then select Set Reference Area in
the menu. The Reference Area will be shown in red. If you make any error, you can delete the
reference area (Select the Reference Area and press Delete key) and repeat the process.
Step 2: Compositional Maps
The ratio R for each atomic column (the In-Ga cationic columns in the present work), defined
as the ratio between the intensity integrated around an InxGa1-x column (in InxGa1-xAs) and the
intensity integrated around a Ga column (in GaAs) keeps a linear relation with the
composition x, as it is expressed in the equation: R=ax+b. The R-values are determined from
integrated intensities calculated from the HAADF image.
19
HREM Research Inc
HREM Research Inc.
qHAADF for DM Manual
If the linear relation is known:
Select the Compositional Map -> with R Factor Coefficients.
Write the coefficient values A and B and select the display type (Polygon or Circle), then
press the OK button. The color circles can be shown on the original image and/or on the
compositional map. The latter display is useful for drawing a line profile of the composition.
The Display Range is used to modify the colour scale.
It is possible to draw a color bar by selecting the option Add Color Marker
20
HREM Research Inc
HREM Research Inc.
qHAADF for DM Manual
If the linear relation is unknown:
Step 1: Select a region where total deposition amount is known (2.3 monolayers of InAs in
GaAs, in this example) by using the HREMPolygonROI tool.
Step 2: Draw a line, which indicates the direction of monolayers by using Line ROI tool. Try
to draw the line as longer as possible for a better result.
21
HREM Research Inc
HREM Research Inc.
qHAADF for DM Manual
Step 3: Select the Compositional Map -> with Deposited Amount option.
[001]
Write the Total amount deposited and select the Display Type (Polygon or Circle). The color
circles can be shown on the original image and/or on the compositional map. The latter
display is useful for drawing a line profile of the composition. The Display Range is used to
modify the colour scale. The obtained compositional map is shown in this figure:
An example of a compositional profile taken from an area with a width of 6 atomic columns
is shown below, expressed as In% versus the number of pixels along [001]
22
HREM Research Inc
HREM Research Inc.
qHAADF for DM Manual
Convert from composition to atoms number
The composition of each column will be converted to a number of atoms in the column, when
you know the total number of atoms in the column. To do so, after calculating a composition
map, select the Convert from composition to atoms number command. Then, the following
dialog will appear:
Here, the total number of atoms in the column will be calculated from the sample thickness
and a mean distance between atoms. You may note the information obtained here is, in
principle, identical to the compositional map. You can change the display range of the Atom
Number Map and its Histogram by changing the Contrast Limit of the Image Display Info in
usual way.
23
HREM Research Inc
HREM Research Inc.
qHAADF for DM Manual
Additional functions
Analyze column positions
Once Peaks using motif have been located, it is possible to analyze column positions with
respect to its relative position within the grid.
In order to do so, go through the following
steps:
- Choose the original image and select the
area of interest using the Rectangle ROI
tool or Polygon ROI tool.
- Choose atomic column(s) to be analysed in
the original image, using the HREM
Mouse tool.
- Choose the project image, for which the
Find Columns command has been applied.
- Apply the
command
Analyze Column Positions
Then, the user will have the option to calculate the distances from the checked point to other
points (if there more than two points), or the angles subtended by two adjacent points (if there
more than three points). The column value may be the integrated intensity or the peak height,
and the column coordinates may be based on the image origin or the motif origin (see Quick
Reference Guide).
24
HREM Research Inc
HREM Research Inc.
qHAADF for DM Manual
The column positions will be shown in the original image, and the intensity of each point will
be stored in a datasheet.
25
HREM Research Inc
HREM Research Inc.
qHAADF for DM Manual
Histogram from spreadsheet
It is also possible to get a histogram from the Spreadsheet by using the Histogram from
Spreadsheet command, thus obtaining a histogram for the column in the spreadsheet.
26
HREM Research Inc
qHAADF for DM Manual
Quick Reference Guide
The qHAADF Main Menu
The commands in the qHAADF menu are described below.
Command
Fourier Space Noise
Filter
(see sub menus)
Real Space Noise Filter
(see sub menus)
Motif Detection
(see sub menus)
Create Mask for
(see sub menus)
Change Main/Second
Show Intensity Maps...
Set Reference Area
Description
Noise reduction through a Bragg filter
Noise reduction in Real Space Filter
Peak Detection using a Motif
Define an Intensity Integration Area
Change Integration Area Order (main/second areas)
Show maps of Integrated Intensities
Define the reference area (usually a pure binary
compound; it is usual to choose this reference area
from a substrate material in the case of epitaxial
materials)
Computes Compositional map
Compositional Map
(see sub menus)
Convert from composiComputes the number of atoms of each column from
tion to atoms number… a compositional map
27
HREM Research Inc
qHAADF for DM Manual
Analyze Column
Positions...
Histogram from
Spreadsheet
Show/Hide
(see sub menus)
Add Color Marker
Analyzes column positions and intensity and angles
Calculates a different histogram for each column in
the spreadsheet
Show/Hide Windows
Draws a color bar
Fourier Space Noise Filter SubMenu
Component
Power Spectrum
Bragg Filter
Description
Calculates the Fourier transform of the front most
image, and displays the power at each frequency
(commonly called the Power Spectrum).
Calculates Bragg Filter using the spots selected in the
Power Spectrum. Shape and size of the mask can be
defined by the user in the dialog.
Note: spots should be selected previously in the
Power Spectrum using the Mouse Tool.
Bragg Filter Dialog
The components of the dialog are described below.
Dialog
Component
Project Name
Size
Smoothing Width
Oval Ratio
Direction
Description
Name given to the group of images and results
Defines mask radius in pixels (beyond which values
are set to zero).
Specifies mask smoothing width in pixels
Defines the shape of the oval, as major to minor axis
ratio
Sets the direction of the oval masks angle, in degrees
28
HREM Research Inc
qHAADF for DM Manual
Real Space Noise Filter SubMenu
Component
Adaptive Wiener Filter...
Low Pass Filter...
Description
Remove noise from the image using an adaptive
Wiener filter based on a local variance.
Calculates and applies a Low Pass filter to the image
Adaptive Wiener Filter Dialog
If the local variance is small, the pixel value is replaced by the local average to
reduce slat-and-pepper noise. Contrary, the pixel value is retained, when the
local variance is large to keep the image sharpness.
Dialog
Component
New Project
Adaptive Average
Noise Estimation
Description
Name given to the group of images and results
Window size [(2N+1)x(2N+1) pixels] to be used in the
calculation of local average
Window size [(2N+1)x(2N+1) pixels] to be used in the
calculation of local variance.
Low Pass Filter Dialog
Dialog
Component
New Project
Radius (pixel)
Description
Name given to the group of images and results
The radius of the mask in pixels
29
HREM Research Inc
qHAADF for DM Manual
Motif Detection SubMenu
Component
x-Corr Histogram…
(see Dialog)
x-Corr with Refined
Motif
Find Motif Centers...
(see Dialog)
Description
Calculates Cross-Correlation Histogram between the
selected reference region (motif) and the original
image.
Note: The left edge of the selection in the histogram is
used as a threshold to obtain the refined motif in the
next step.
Obtains a refined motif, and then calculates
Cross-Correlation Histogram between the refined
motif and the original image.
Note: The left edge of the selection in the histogram is
used as a threshold to find good motifs in the next
step.
Finds the centers of good Motifs in the image.
x-Corr Histogram Dialog
Dialog
Component
Approximate Column
Size (diameter)
Minimum Motif Distance
Description
Specifies an approximate atom column size (the
minimum distance between atom column peaks).
(This parameter is used in x-corr with Refined Motif
to define peaks in the refined motif.)
Specifies a minimum distance between allowed
motifs. (This parameter is used in Find Motif
Centers…)
30
HREM Research Inc
qHAADF for DM Manual
Find Motif Centers Dialog
Dialog
Component
Peak Threshold
Show all points
Show stacked motif
Description
Specifies a minimum for the intensity of allowed
peaks
Shows also the Motif centers in blue that were
rejected by the cross-correlation threshold and/or the
minimum motif distance criteria. (Namely, all the peak
points are displayed in red or blue color.)
Make a stacked image from detected motifs.
Create Mask SubMenu
Component
1 (Red): Main area of
integration
2 (Green): Second area
of integration
3 (Yellow): Third area of
integration
Description
Defines the Intensity Integration Area used in the
Compositional Analysis
Defines an auxiliary Intensity Integration Area
Defines an auxiliary Intensity Integration Area
31
HREM Research Inc
qHAADF for DM Manual
Show Intensity Map Dialog
Dialog
Component
Main Area:1
Ratio: 1/2
Corrected Ratio
(1-3)/(2-3)
Display Type
Circle
Radius
On the original image
On the compositional
map
Display Range
(Percentile)
Description
Shows an Intensity map obtained using the main
integration area
Shows an Intensity map obtained by dividing
integrated intensities of the main area by the
integrated intensities of the second one
Shows an intensity map obtained as
(Main-third) / (second-third) integration areas
Selects the display type from Polygon and Circle
Defines the circle radius
Shows the color circles on the original image
Shows the color circles on the compositional map
Defines minimum (Low) and maximum (High) values
of Integrated intensities to be shown
32
HREM Research Inc
qHAADF for DM Manual
Compositional Map SubMenu
Component
with R Factor
Coefficients...
with Deposited
Amount...
Description
Compositional map determination knowing the R
Factor
Compositional map determination knowing the
Deposited Amount in a certain area
Compositional Map with R Factor Coefficients... Dialog
Dialog
Component
R Factor coefficients
Display Type
Circle
Radius
On the original image
On the compositional
map
Display Range
(Percentile)
Description
Slope and y-intercept of R(x)= A x + B
Selects the display type from Polygon and Circle
Define the circle radius
Show the color circles on the original image
Show the color circles on the compositional image
Defines minimum (Low) and maximum (High) values
of Integrated intensities to be shown
33
HREM Research Inc
qHAADF for DM Manual
Compositional Map with Deposited Amount... Dialog
Dialog
Component
Total amount deposited
Display Type
Circle
Radius
On the original image
On the compositional
map
Display Range
(Percentile)
Description
Total deposited amount in a defined polygonal area
Selects the display type from Polygon and Circle
Defines the circle radius
Show the color circles on the original image
Show the color circles on the compositional image
Defines minimum (Low) and maximum (High) values
of Integrated intensities to be shown
Convert from composition to atoms number... Dialog
Dialog
Component
Sample thickness (nm)
Mean distance between
atoms along each
column (nm)
Show Histogram
Description
Specify the sample thickness in nm.
Specify the mean distance between atoms along the
column in nm.
If checked, the histogram of the number of atoms
within a ROI (an interested area) will be shown.
34
HREM Research Inc
qHAADF for DM Manual
Analyze Column Positions Dialog
The user will have the option to decide the distances and/or angles to be
evaluated.
Distance Tab
The number of each check box corresponds to the assigned number to the
mouse click. All the distance(s) from the checked point to other points will be
calculated.
Angle Tab
The number of each check box corresponds to the assigned number to the
mouse click. All possible angle(s) whose vertex corresponds to the checked
point will be calculated.
35
HREM Research Inc
qHAADF for DM Manual
Option Tab
Component
Description
Position (Pos) number Display position number (Left column of the spread
on the image
sheet) on original image.
Column coordinates
You can select the origin of column positions from
‘Image origin (Top-left)’ or ‘Motif origin (Top-left)’.
Column value
You can select output column value from averaged
‘Intensity over the Mask 1/2/3’ or ‘Peak Height’.
Show/Hide SubMenu
Component
Motif
Motif with All Columns
Intensity Masks...
Description
Shows/hides Motif
Shows/hides Motif with all columns
Shows/hides intensity mask
36
HREM Research Inc