1
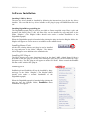
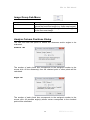
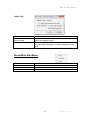
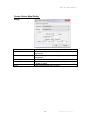
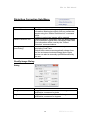
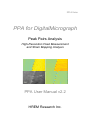
2014/June.
PPA for DigitalMicrograph
Peak Pairs Analysis
High-Resolution Peak Measurement
and Strain Mapping Analysis
PPA User Manual v2.2
HREM Research Inc.
HREM Research Inc.
PPA for DM Manual
Contact Information
General enquiries on the PPA plug-in for DigitalMicropraph should be sent to:
HREM Research Inc.
14-48 Matsukazedai
Higashimatsuyama
Saitama 355-0055
Japan
Email:
Website:
[email protected]
http://www. hremresearch.com/
Technical enquiries on the Peak Pairs algorithm should be directed to:
Dr. Pedro L. Galindo
Univ. de Cádiz, Spain
Email:
[email protected]
Acknowledgements
The scientific developer of this method (Prof. Pedro L. Galindo) would like to
acknowledge to all authors of the references cited in this manual for their
collaboration in the process of its application to the scientific problems presented in
these cited papers.
Copyright Statements
© Copyright 2008-2014 HREM Research Inc (Japan) and Universidad de Cádiz
(Spain)
All rights reserved. This manual is protected by international copyright laws and
treaties. Unauthorized reproduction and distribution of this manual, or any portion of it,
will be prosecuted to the maximum extent possible and may result in severe civil and
criminal penalties.
Portions of this document were prepared by HREM Research Inc. by editing the
materials supplied by Dr. Pedro L. Galindo.
DigitalMicrograph is a trademark of Gatan Inc.
2
HREM Research Inc.
PPA for DM Manual
Conventions
The typographic conventions used in this manual are described below.
Convention
Bold
Menu...MenuOption
Description
Used to denote specified elements of the user interface such as
buttons, field names, menus, and menu options.
For example, the New button.
Select the Menu from the Menu bar then select the Menu Option
from the Menu.
For example, File...Open would mean select the File Menu and
then the Open Option.
CAPS
Used to denote the name of a key on the keyboard.
For example, the ENTER key.
Italics
Used to denote emphasis, captions and the result of an action in a
procedure.
3
HREM Research Inc.
PPA for DM Manual
Table of contents
Introduction to Peak Pairs Analysis (PPA)
Software Requirements
Software Installation
5
5
6
Getting Started
7
Image Pre-processing and Basis Vector Selection
Peak Detection (Simple Images)
Motif Detection (Complex Images)
Peak Pairs Determination
Displacement and Strain Maps Calculation
Setting the Reference Base Vectors
Real Space Noise Filters
Adaptive Wiener Filtering
Low Pass Filtering
Geometric distortion correction
Additional functions
7
10
13
17
18
21
22
22
23
24
27
Lattice Analysis
Atomic Column Analysis (Analyze Column Positions)
Create Vector Maps
Image rectification
Appendix:
27
28
30
31
33
Some useful DM tricks
33
Quick Reference Guide
34
4
HREM Research Inc.
PPA for DM Manual
Introduction to Peak Pairs Analysis (PPA)
PPA stands for Peak Pairs Analysis, the DigitalMicrograph plug-in for High-Resolution Peak
Measurement and Strain Mapping Analysis.
All results obtained by PPA are fully compatible with the other functions present in DM. For
example, strain maps can be analyzed and/or manipulated with functions such as histograms,
statistics (mean, standard deviation, min, max etc.), or using the corresponding buttons, such
as the Profile utility.
The main reference for the algorithm is:
The Peak Pairs algorithm for strain mapping from HRTEM images
Pedro L. Galindo, Sławomir Kret, Ana M. Sanchez, Jean-Yves Laval, Andrés Yáñez,
Joaquín Pizarro, Elisa Guerrero, Teresa Ben and Sergio I. Molina
Ultramicroscopy 107 (2007) 1186–1193 (doi: 10.1016/j.ultramic.2007.01.019)
This manual will help you to use of the PPA package with some worked examples. There is
also a quick reference guide at the end of this document.
Software requirements
The following is a list of the software requirements necessary to run the PPA plug-in:
- DigitalMicrograph (GatanTM )
- USB Key Driver
- HREM Mouse Tool Plug-in (freeware downloadable from www.hremresearch.com)
- IPU Plug-in (freeware downloadable from www.hremresearch.com)
5
HREM Research Inc.
PPA for DM Manual
Software Installation
Installing USB Key Driver
The user key driver should be installed by following the instructions given by the key driver
installer. You can find the key driver installer at the plug-in page on HREM Research web
site.
Installing DigitalMicrograph Plug-ins
The DigitalMicrograph Plug-in will be provided as Gatan compiled script file(s) (.gtk) and
dynamic link library file(s) (.dll). All these files can be installed by copy-and-paste to the
folder “PlugIns.” (The PlugIns folder should exist under a normal installation of the
DigitalMicrograph).
When the DigitalMicrograph is launched after placing the plug-ins into the PlugIns folder, the
PlugIns will appear as a new menu or an addition to the standard tools.
Installing Mouse Tools
All the files relating Mouse tool plug-in can be installed
by copy-and-paste to the folder “PlugIns.” The Mouse
tool will appear as an addition to the standard tools.
Installing IPU Plug-in
The PPA plug-in uses some functions based on the Intel’ MKL (Math Kernel Library)
provided by the IPU plug-in. All the files relating the IPU plug-in can be installed by copyand-paste copy. The IPU plug-in will appear as under IPU menu. Please consult the ReadMe
file that comes with the IPU plug-in.
Installing PPA
PeakPairs.gtk and PeakPairs.dll can be installed by dragand-copy to the folder “PlugIns” (The PlugIns folder
should exist under a normal installation of the
DigitalMicrograph.)
When the DigitalMicrograph is launched after placing the
plug-ins into the PlugIns folder, PeakPairs menu
commands will appear.
6
HREM Research Inc.
PPA for DM Manual
Getting Started
Image pre-processing and Basis Vector Selection
(Bragg Filter)
Open the file QuantumWire.dm3 using the DM command File…Open:
This image represents a
capped InAs quantum
wire on GaAs.
Composition was considered to be uniform
inside the quantum wire
and across the wetting
layer.
All the commands related to PPA are located in the menu Peak Pairs. The first command to
be applied to a new image is the Power Spectrum command to calculate the power
spectrum of the image:
Hint: if the Power Spectrum
appears completely black, you
will probably need to adjust
the histogram
Press
here
7
HREM Research Inc.
PPA for DM Manual
Now, select the HREM mouse tool, and
click on desired spots to apply Bragg filter.
The usual choice is to select the brightest
spots in the spectrum, but those
corresponding to higher harmonics can also
be selected:
The user doesn’t need to hit the spot exactly,
because PPA looks for the local maxima near
the selected point.
Anyway, you can zoom in the spectrum
before hitting peaks using the DM zoom
tool:
Hint: if you wish to delete any spot,
just click on the mouse mark again
with the SHIFT key down.
Hint: Symmetry in the selection for
each spot is assumed.
IMPORTANT: First and second chosen spots (numbered as 1 and 2) will define the lattice
basis vectors. These spots should be apart from the vertical or horizontal of the central spot, in
order to obtain maximum resolution.
Don’t be surprised if the central spot is not present in the power spectrum. It just indicates that
the mean intensity of the image is zero.
8
HREM Research Inc.
PPA for DM Manual
We are now ready to apply Bragg Filter. This process creates an image where the contrast
resulting from the ordered regions is clearly distinguishable from the background intensity.
The shape and size of the Bragg filter must be
adjusted such that no loss of information
occurs. In this dialog box we can determine the
size (in pixels), smoothing width(in pixels),
oval ratio(height/width) and direction(in
degrees) of mask spots.
By pressing the Apply button, the mask
described by the chosen parameters will be
redrawn, as it is shown in the example on the
left.
Let us select the first option (small
window, oval ratio=1) and press the OK
button, and the Bragg filtered image will
appear immediately.
If Bragg filter parameters are properly
chosen (big masks and a sufficient
number of peaks), the resulting filtered
image will preserve the location of
maxima. The great advantage in using
the filtered image is the reduction of
noise.
9
HREM Research Inc.
PPA for DM Manual
Peak Detection (simple images)
IMPORTANT: Peak Detection uses two base vectors information (unit cell) to find a set of
good intensity peaks. The Bragg filter defines the two base vectors automatically. However,
in the case of the Real Space Noise Filter, the two base vectors should be defined
manually using the Set Reference Base vectors command.
Once we have a Bragg filtered image, the next step is to locate peaks of intensity in the image
by using the Find Peaks menu commands.
The approach to peak detection is based on peak
identification based on their intensities.
The Peak Histogram command detects all
intensity maxima in the image, and calculates the
histogram of peak intensities.
The histogram allows the user locating different sets
of peaks, based on their intensities, for determining
strain. This discrimination is obtained by defining a
lower threshold using the histogram. All peaks of
intensity lower than this threshold are discarded.
Here, we use Test image.dm3 as a sample data. First, we
apply the Bragg filter using all the spots in the Power
Spectrum. When the command Peak Histogram is issued,
the following dialog box allows the user to specify if the user
is interested in white (unchecked) or black spots (checked)
using the Invert Peaks checkbox option
Once the histogram is shown, the user should select the intensity threshold for identifying
which peaks will be used in further analysis. To do so, just click the mouse on the histogram,
and select the desired range of peaks. The left side of the selection made in the histogram will
be used in the following Find Peak Positions command.
10
HREM Research Inc.
PPA for DM Manual
The discovered peaks will be classified to red or blue depending on the peak values: red
indicate the peak that is higher value than the selected threshold, while blue indicate the peak
equal to or lower than the threshold. The peak colour will be dynamically revised by changing
the threshold.
Once the range of peaks is selected, the Find Peak Positions should be issued.
The following dialog box appears:
Peak Threshold indicates the minimum intensity
of a point to be considered as a valid peak. Peaks
having intensities below this threshold will be
discarded. Peak threshold value is automatically
read from the left side of the selection made in the
histogram. However, the user can manually
modify this value, if necessary.
You may want to use Minimum Peak Distance
(in pixel) to restrict a minimum distance between
nearby peaks.
By pressing OK, we get a first set of peaks shown as coloured spots over the filtered image.
Blue dots represent local maxima (8-neighbourhood) on a pixel basis. Red dots represent
refined maxima at sub-pixel resolution. Sub-pixel resolution is achieved by fitting a 2D
quadratic function and calculating analytically the maxima, as described in the reference for
the algorithm in the Introduction section.
11
HREM Research Inc.
PPA for DM Manual
Sometimes, extra peaks are obtained in this automatic Peak Finding process, especially at the
borders of the image. Repeating the Find Peaks command with a new Peak Threshold, all
peaks in the border of the image will be discarded and won’t be considered in any further
calculations.
12
HREM Research Inc.
PPA for DM Manual
Motif Detection (complex images)
In cases where the repeating unit in the image is more complex than a single dot, such as a
dumbbell, an alternative, more complex way to determine the lattice may be useful. Thus, the
Motif Detection has been implemented. Here, we explain the Motif detection using the
image QuantumWire.dm3.
First, a rectangle should be defined using the Rectangle ROI tool. The rectangle defines the
basic pattern that will be searched across the whole image using normalized cross-correlation.
For example, in this image, a cation location (an upper part of a dumbbell) may be a good
choice. Rectangle size and location is a critical decision in the accuracy of strain results. Let
us zoom in the substrate, and select a rectangle area around a cation.
Once the rectangle has been defined, select the x-Corr Histogram in the Motif Detection
submenu. A dialog shown below will open:
After clicking OK, a new window will appear showing the histogram of all maxima in the
normalized cross-correlation between the selected pattern (Motif) and the whole image.
13
HREM Research Inc.
PPA for DM Manual
In this case, we may observe two peaks in the histogram, corresponding to Ga and In cations
across the image.
Once the histogram is shown, you should select the intensity threshold for identifying which
peaks will be used in further analysis. To do so, just click the mouse on the histogram, and
select the desired range of peaks.
The discovered motifs will be classified to red or blue depending on their cross-correlation
values: red indicate the motif, whose cross-correlation value is higher than the selected
threshold, while blue indicate the motif equal to or lower than the threshold. The peak color
will be dynamically revised by changing the threshold.
Given that we are interested in the detection of both cations, we will select a threshold lower
than 0.9 to take all peaks into consideration. To do that, the Select tool should be used by
dragging the mouse on the histogram directly. The left edge will be used as a lower threshold.
14
HREM Research Inc.
PPA for DM Manual
Next, the x-Corr with Refined Motif command will show the refined Motif, which is
calculated as an average only from the areas that will give cross-correlation values higher than
the specified threshold.
Then, this command will show the cross-correlation between the refined Motif and the whole
image. This is especially useful in the presence of noise.
Once the refined histogram is shown, the user should select the intensity threshold on the
refined histogram as before
The discovered motifs will be classified to red or blue as before. The peak colour will be
dynamically revised by changing the threshold.
15
HREM Research Inc.
PPA for DM Manual
And then select the Find Motif Centers in the Motif Detection submenu.
The Find Motif Centers command finds the motif positions by taking into account the
minimum motif distance, and places the red small boxes on the motif centers (the center of
the motif box).
IMPORTANT: In the case of Motif Detection, the reference base vectors should be selected
using the Set Reference Base vectors before applying the Find Peak Pairs command.
16
HREM Research Inc.
PPA for DM Manual
Peak Pairs Determination
IMPORTANT: Peak Pairs are calculated using two basis vectors. The Bragg filter defines
the two base vectors automatically. However, in the case of the Real Space Noise Filter or
Motif Detection, the two base vectors should be defined manually using the Set
Reference Base Vectors command.
Once all peaks or motif centers have been selected, Peak Pairs should be calculated using the
Find Peak Pairs command. This process will find all pairs of peaks along the predefined
two basis vectors.
Peak Finding
Motif Detection
17
HREM Research Inc.
PPA for DM Manual
Displacement and Strain Maps calculation
Once all Peak Pairs have been determined, we can proceed to the calculation of displacement
maps using the command Displacement Maps. This generates horizontal and vertical
displacements (D1h, D1v, D2h and D2v).
Technical note:
PPA uses an automatic selection of contrast and the temperature color scale for
displaying image values. Default color range is ±5%.
If you prefer a grey scale or a different contrast limit, press the right button on the
image, and modify ImageDisplay options properly.
Changing this option will not change the actual values, only its appearance.
A very important step is to define the reference area, that is to say, the area that is considered
to correspond to the reference lattice.
All displacements and strain values will be referred to this area. Use the Rectangle ROI tool
(region of interest tool) to select an area on any one of the Displacement images (D1h, D1v,
D2h or D2v):
18
HREM Research Inc.
PPA for DM Manual
Once the reference area has been chosen, the user should select the Define Reference
command. This will change the displacement values, so as to obtain a uniform displacement
in the chosen reference area.
The final step is the determination of strain maps (exx,eyy,exy and eyx) at the desired angle.
When the Strain Map command is selected, the Strain Map dialog appears. Here, you can
specify the coordinate axes to display the strain maps using Angle of x-axis to horizontal. If
the angle is set equal to 0, horizontal and vertical directions are assumed to be x and y
coordinate axis respectively.
The angle of x-axis to horizontal may be determined
graphically. To do so, just add a Line ROI on the
original image, along the desired direction of x-axis,
before issuing the Strain Map command.
19
HREM Research Inc.
PPA for DM Manual
Once the OK button is chosen, a set of 4 images corresponding to (exx,eyy,exy and eyx) are
obtained. The mean dilatation and Rotation angle are additional images available.
There is an option for strain representation (Overlay):
DESCRIPTION
Full image
Detail
No overlay:
Continuous strain
maps are shown.
Hint: If you prefer a grey scale or a
different contrast limit, press the right
button on the image, and modify
ImageDisplay options properly.
Overlay:
Strain maps at
each atomic
column are
shown with
colour dots over
the original
images.
Technical Note:
The results of the PPA package is the complete strain tensor defined as follows:
Strain values
e xx =
∂u
∂u
∂u x
, e yy = y , e xy = ∂u x , e yx = y
∂x
∂y
∂x
∂y
Strain tensor:
ε ij =
1 &$ ∂ui ∂u j
+
2 $% ∂x j
∂xi
Mean dilatation :
Δ ij =
#
! i.e. ε = ∂u x , ε = ∂u y , ε = 1 &$ ∂u x + ∂u y #!
xx
yy
xy
!
∂x
∂y
2 $% ∂y
∂x !"
"
1 &$ ∂ui ∂u j #! i.e.
Δ xy =
+
2 $% ∂xi ∂x j !"
1
2
(ε
xx
+ εyy )
Rotation (in radians and anti-clockwise positive):
∂u #
1 & ∂u
∂u
ω ij = $$ j €
− i ! i.e. ω xy = 1 &$$ y − ∂u x #!!
2 % ∂xi ∂x j !"
2 % ∂x
∂y "
20
HREM Research Inc.
PPA for DM Manual
Setting the Reference Base Vectors
It is possible to manually set the reference base vectors.
To manually define the Reference Base vectors, use the HREM Mouse Tool to select 3
points in the order (origin of both vectors, terminal point of vector 1, terminal point of vector
2), so that the directions of the desired reference base vectors are described by the directions
of vectors 1->2and 1->3.
Approximate directions
as described by the user
When applying the Set Reference Base Vectors command, the precise magnitude and
direction of both reference base vectors are calculated using a least-squares fitting to all the
peaks within the parallelogram defined by two vectors 1->2and 1->3.
Reference Base Vectors
21
HREM Research Inc.
PPA for DM Manual
Real Space Noise Filters
While Bragg filtering is very useful to reduce noise, some researchers may prefer other
alternative noise filtering techniques in real space. There are two alternative noise filtering
commands: Adaptive Wiener Filter and Low Pass Filter. The techniques have no way to
determine automatically the basis vectors, and they should be determined manually by using
the Set Reference Base Vectors command
Adaptive Wiener Filter
The Wiener filter is widely used for image restoration and calculates the optimal filter for the
removal of noise from a signal which is corrupted by the measuring process itself. It assumes
that if noise is present in the system, then it is considered to be additive white Gaussian noise.
In a typical Peak Pairs session, if Wiener filtering is desired, it is usually the first operation to
be applied to the original image. When applying the Adaptive Wiener Filter on the front
image, the user should decide the size of the windows used for calculating the Adaptive
Average and the Noise Estimation, as follows:
If the standard deviation of the local area is small, then the
pixel value will be replaced by a local average. On the other
hand, if the standard deviation of the local area is large, then
the pixel value will not be modified. Thus, the new pixel value
will be between the old value and the local average according
to the local standard deviation.
The result of the Wiener filtering operation on Test image.dm3 (Adaptive Average =3, Noise
Estimation=3) is depicted below.
22
HREM Research Inc.
PPA for DM Manual
Low Pass Filter
In order to generate a Low-Pass filtered image, use the Low Pass Filter command on the
front image. The strength of the filter is defined by the Radius of the mask in pixels (the
larger the radius, the stronger the filter):
The new pixel value will be a local average with a
Gaussian weight (mask) of the defined radius. You
can specify a radius of les than one pixel.
In the following figure, the resulting images after the application of a Low-Pass filter to the
lower left part of Test image.dm3 with different radius are shown:
Original image
(right-lower corner only)
Low Pass Filtered
(radius=0.8 pixels)
23
Low Pass Filtered
(radius=1.6 pixels)
HREM Research Inc.
PPA for DM Manual
Geometric distortion correction
All optical systems distort the images they form. CCD cameras and scanners (for digitising
negatives for example) introduce additional distortions. If these geometric distortions are
fixed (what is usual for a given system), it is possible to eliminate them. This is valid not only
for projector lens distortions but also for any other systematic distortions present in the image.
In order to correct the distortions, an image of a perfect crystal is needed. We explain here
distortion correction using a pair of images with the same distortion, Test image.dm3 and
Substrate.dm3, the latter of which corresponds to an image of a perfect crystal.
Open the image Substrate.dm3, execute the Power Spectrum, and then Bragg Filter in
the usual way by selecting relevant spots in the Power Spectrum.
Then calculate the Peak Pairs using the usual commands (Find Peaks followed by Find
Peak Pairs). If we analyse the displacements with the Displacement Maps command, we
can observe that the image of a perfect crystal is distorted as shown below.
24
HREM Research Inc.
PPA for DM Manual
The distortion information obtained for the perfect crystal image can be used to correct
distortions in any other image with the same distortion. In order to obtain the distortion
information, select the image with Peak Pairs information, and apply the command Obtain
Distortion Info.
The new image with distortion information will be created. This Distortion Info image can be
saved to disk (e.g., Distortion Info of Substrate using Save As command) and used in further
analysis of the image having the same distortion.
In order to rectify the original image using the distortion information obtained from the
perfect crystal image, just apply the Correct Distortion on the Target Image as follows:
Select the Target Image (the image to be
corrected), and the Distortion Info (the image
created by the Obtain Distortion Info command).
Here, we use the Test image.dm3 and the Distortion
Info obtained from Substrate.dm3.
25
HREM Research Inc.
PPA for DM Manual
This will produce a corrected image, where all the
distortions estimated from the perfect crystal image
have been eliminated.
We can now proceed to analyze this image in the
usual way to get the final results:
1. Power Spectrum
2. Bragg Filtering
3. Find Peaks
4. Find Peak Pairs
5. Displacement Maps
6. Define reference
7. Strain maps
The strain maps before and after distortion correction:
before correction
after correction
If we plot a horizontal profile across exx and a vertical one across eyy, we get the expected
results (exx=0.1 and eyy=0.05) after distortion correction.
26
HREM Research Inc.
PPA for DM Manual
Additional functions
Lattice Analysis (Analyze Lattice Points)
The Analyze Lattice Points command applied on the project image, such as Bragg filtered
image, will generate an output in spreadsheet including the following information (one row
for each lattice peak):
- Peak position at sub-pixel resolution (x,y coordinates)
- Peak intensity
- Strain tensor at each lattice peak (exx,eyy,exy and eyx): only after Strain Analysis.
It is also possible to get a histogram from the Spreadsheet by using the Histogram from
Spreadsheet command, thus obtaining a different histogram for each column in the
spreadsheet.
27
HREM Research Inc.
PPA for DM Manual
Atomic Column Analysis (Analyze Column Positions)
Once Peak Pairs have been located, it is possible to analyze atomic column positions. This is
very useful when there are more than one atomic column within a unit cell. For example, in
the case of [110] projection of InP (the zincblende type materials), we can evaluate cation
and/or anion atomic columns. In order to do so, go through the following steps (on the
zincblende.dm3):
- Calculate Peak Pairs in the usual way
- Bring the original raw image to
frontmost.
- Choose the area of interest on the
original image using the Rectangle ROI
tool.
- Select atomic column(s) to be analysed
using the HREM mouse. (Here, we
select a set of cation and anion columns)
- Bring the project image with Peak Pairs
information to frontmost.
- Apply the Analyze Column
Positions command
All the columns in the selected area will be shown in the
image, and the intensity of each column will be stored in a
spreadsheet.
28
HREM Research Inc.
PPA for DM Manual
If there is more than one column, the user will
have the option to evaluate the distances between
the columns.
If there are more than two columns, the user will
have the option to evaluate the angles subtended
by two neighbour columns.
You can see visually the distribution of distances using the Histogram from Spreadsheet
command:
29
HREM Research Inc.
PPA for DM Manual
Create Vector maps
It is possible to a create vector map from two vector components, such as D1h and D1v. To
do so, launch the Create Vector Maps command, and select two vector component images
of the associated vector map.
We explain here this function using the displacement maps, D1h and D1v, calculated from
Substrate.dm3. After launching the Create Vector Map command, select these two images,
D1h and D1v, and press OK.
Then, you will get a colour map corresponding to the vector magnitude, with arrows showing
the directions and magnitudes of the vectors as shown below:
The vector map here is a complex DM image, whose real and imaginary parts correspond
respectively to the Horizontal and Vertical images selected in the dialog.
30
HREM Research Inc.
PPA for DM Manual
Image rectification
This command allows the user to correct any distortion from an image of a perfect crystal,
using Peak Pairs information. We explain here distortion correction using an image
corresponding to a perfect crystal, Substrate.dm3.
Open the image Substrate.dm3, execute the Power Spectrum, and then Bragg Filter in
the usual way by selecting relevant spots in the Power Spectrum.
Then calculate the Peak Pairs using the usual commands (Find Peaks followed by Find
Peak Pairs). If we analyse the displacements with the Displacement Maps command, we
can observe that the image of a perfect crystal is distorted as shown below.
31
HREM Research Inc.
PPA for DM Manual
Given that the image corresponds to a perfect crystal, we can get a rectified image. In order to
do that, select the project image with Peak Pairs information, and then apply the Rectify
image command.
The lengths and angles of current reference base vectors will be shown in the dialog. If the
values in the parentheses differ from the values expected from an ideal unit cell, you can
change the values accordingly.
By pressing OK, the distorted image is rectified using the local distortions at each point of the
image. To verify this, calculate the displacement maps from the rectified image. Then, we
observe that distortions have been corrected as shown below:
before correction
after correction
32
HREM Research Inc.
PPA for DM Manual
Appendix
Some useful DM tricks
DM ROI tool:
Hint: to select a square area, hold down SHIFT.
To select powers of two, hold down SHIFT-ALT.
DM Zoom tool:
Hint: to demagnify, press ALT.
HREM Mouse tool
Hint: to delete any spot, just
click on the mouse mark with
the SHIFT key down.
.
DM Image Display Command
Hint: to change the color map of
any image, press the right mouse
button on it, select ImageDisplay,
and modify the options as desired.
For example, it is useful to set
manually the color range of each
map to be the same, so as to be able
to compare each other.
33
PPA for DM Manual
Quick Reference Guide
The PPA Main Menu
The commands in the PPA menu are described below.
Command
Fourier Space Noise
Filter (see sub menus)
Real Space Noise Filter
(see sub menus)
Set Reference Base
Vectors
Motif Detection
(see sub menus)
Description
Reduces noise using Fourier space filter.
Reduces noise using Real Space Filter.
Set the reference base vectors manually on a
real-space noise-filtered image or an image after
Motif detection.
Note: Bragg filter sets the reference base vectors
automatically.
Detects repeating units (unit cells) using a Motif (small
reference region).
34
HREM Research Inc
PPA for DM Manual
Find Peaks
(see sub menus)
Find Peak Pairs
Displacement Maps
Define Reference
Strain Map...
(see Dialog)
Repeat Project…
(see Dialog)
Project
(see sub menus)
Image Group
(see sub menus)
Analyze Lattice Points
Analyze Column
Positions... (see Dialog)
Histogram from
Spreadsheet
Show/Hide
(see sub menus)
Add Color Marker
Create Vector Map...
(see Dialog)
Distortion Correction
(see sub menus)
Locates peaks of intensity in an image.
Note: Reference base vectors should be defined
beforehand.
Calculates pairs of peaks along two reference base
vectors automatically.
Generates horizontal and vertical displacements
along the two directions defined by the basis vectors
Changes the displacement values, so as to obtain a
uniform displacement in the chosen area.
Note: the area should be selected previously using
the ROI tool on any displacement image
Calculates strain maps (exx,eyy,exy and eyx) at any
desired angle.
Generates strain maps and other outputs for the front
most image using the same conditions of a selected
project.
Menu to manage all the images in a particular project.
Menu to close or save groups of images within a
particular project.
Generates a spreadsheet of data (peak position, peak
intensities, strain values) for each peak
Analyzes column positions with respect to its relative
position within the grid
Calculates a different histogram for each column in
the spreadsheet
Shows/hides a selected annotation on the image.
Adds a color bar and the low and high display ranges.
You can move the whole color marker or change its
size. Since the display ranges are text annotations,
you can move and edit them as you like. The color
marker can be placed outside of the image display.
You can rotate and flip using Edit commands. (The
ratio of the color bar is fixed.)
Create a vector map from two component images
selected in the dialog.
Eliminates systematic distortions present in the image
based on the measurement of an ideal distortion-free
image.
35
HREM Research Inc
PPA for DM Manual
Fourier Space Noise Filter SubMenu
Component
Power Spectrum
Bragg Filter…
(see Dialog)
Description
Calculates the Fourier transform of the front most
image, and displays the power at each frequency
(commonly called the Power Spectrum).
Calculates Bragg Filter using the spots selected in the
Power Spectrum. The shape and size of the mask
can be defined by the user in the dialog.
Note: Spots should be selected beforehand in the
Power Spectrum using the Mouse Tool.
Note: The first and second spots defined the
Reference Base Vectors in real space.
Bragg Filter Dialog
The components of the dialog are described below.
Dialog
Component
Project Name
Size
Smoothing Width
Oval Ratio
Direction
Description
Name given to the group of images and results
Defines mask radius of hard cut-off (beyond which
values are set to zero).
Specifies mask smoothing width in pixels
Defines the shape of the oval, as major to minor axis
ratio
Sets the prescribed masks angle, in degrees
36
HREM Research Inc
PPA for DM Manual
Real Space Noise Filter SubMenu
Component
Adaptive Wiener Filter...
(see Dialog)
Low Pass Filter...
(see Dialog)
Description
Remove noise from the image using an adaptive
Wiener filter based on a local variance.
Calculates and applies a Low Pass filter to the image
Adaptive Wiener Filter Dialog
Dialog
Component
New Project
Adaptive Average
Noise Estimation
Description
Name given to the group of images and results
Window size [(2N+1)x(2N+1) pixels] to be used in the
calculation of the adaptive average
Window size [(2N+1)x(2N+1) pixels] to be used in the
calculation of the noise estimation
Low Pass Filter Dialog
Dialog
Component
New Project
Radius(pixel)
Description
Name given to the group of images and results
The radius of the mask in pixels
37
HREM Research Inc
PPA for DM Manual
Motif Detection SubMenu
Component
x-Corr Histogram…
(see Dialog)
x-Corr with Refined
Motif
Find Motif Centers...
(see Dialog)
Description
Calculates Cross-Correlation Histogram between the
selected reference region (motif) and the original
image.
Note: The left edge of the selection in the histogram is
used as a threshold to obtain the refined motif in the
next step.
Obtains a refined motif, and then calculates
Cross-Correlation Histogram between the refined
motif and the original image.
Note: The left edge of the selection in the histogram is
used as a threshold to find good motifs in the next
step.
Finds the centers of good Motifs in the image.
x-Corr Histogram Dialog
Dialog
Component
Approximate Column
Size (diameter)
Minimum Motif Distance
Description
Specifies an approximate atom column size (the
minimum distance between atom column peaks).
(This parameter is used in x-corr with Refined Motif
to define peaks in the refined motif.)
Specifies a minimum distance between allowed
motifs. (This parameter is used in Find Motif
Centers…)
38
HREM Research Inc
PPA for DM Manual
Find Motif Center Dialog
Dialog
Component
Peak Threshold
Show all points
Show stacked motif
Description
Specifies a minimum for the intensity of allowed
Peaks.
Shows also the Motif centers in blue that were
rejected by the cross-correlation threshold and/or the
minimum motif distance criteria. (Namely, all the peak
points are displayed in red or blue color.)
Make a stacked image from detected motifs.
Find Peaks SubMenu
Component
Peak Histogram...
(see Dialog)
Find Peak Positions…
(see Dialog)
Remove Peaks
Add Peaks
Description
Calculates a histogram of peaks intensities, helping
the user to determine a precise value for Peak
Threshold.
Locates peaks of intensity in a filtered image. A
threshold for the minimum allowed peak intensity and
a minimum distance for peaks can be defined.
Note: The left edge of the selection in the histogram is
used as a threshold to find good peaks.
This threshold can be changed in the dialog below.
Remove the peaks, which are selected by using
HREM Mouse.
Refine and add the peaks, which are selected by
using HREM Mouse.
39
HREM Research Inc
PPA for DM Manual
Peak Histogram Dialog
Dialog
Component
Invert Peaks
Description
It allows the user to calculate intensity minima
histograms (instead of maxima)
Find Peak Positions Dialog
Dialog
Component
Invert Peaks
Description
It allows the user to calculate intensity minima
(instead of maxima)
Peak Threshold
Specifies a minimum for the intensity of allowed
peaks
Minimum Peak Distance Specifies a minimum distance between allowed peaks
Show Local Maxima
Show local maxima (of 8-neighbourhood) as blue
points.
40
HREM Research Inc
PPA for DM Manual
Strain Map Dialog
Dialog
Option
Angle of x-axis to
horizontal
Strain Matrix
Independent
Symmetric
Mean Dilatation
Rotation Angle
Overlay
Description
Specifies the angle of the direction to be considered
as x-axis.
You can specify the orientation of the x-axis by
placing a Line ROI on the HREM image. In this case,
the angle of the Line ROI appears here automatically.
Note: If angle is set equal to 0, horizontal and vertical
directions are assumed to be x and y coordinate axis
respectively.
Specifies the images to be shown
Images of du/dx, du/dy, dv/dx, dv/dy to be displayed
Images of εxx, εyy and εxy to be displayed.
Image of δxy to be displayed (average of εxx and εyy).
Image of ωxy to be displayed. Values in degrees and
anticlockwise positive.
Shows the strain at each atomic column, and
displayed as coloured dots over the original image
41
HREM Research Inc
PPA for DM Manual
Repeat Project Dialog
Dialog
Component
New Project
Project image to be
repeated
Find Peaks
Find Peak Pairs
Displacement Maps
Strain Map
Description
Defines the name of the new project.
Selects an open project to be used to generate strain
maps and other outputs for the front most HREM
image.
Note: If you want to use the project created during the
previous session, you may want to open it again.
Repeats Find Peaks Operation.
Repeats Find Peak Pairs Operation.
Repeats Displacement Maps Operation.
Repeats Strain Map Operation.
Project Sub-Menu
Component
Hide
Show
Save
Close
Description
Hides all the images in a project.
Shows all the images in a hidden project.
Saves all the images in a project (with save dialog
window).
Closes all the images in a project without saving.
42
HREM Research Inc
PPA for DM Manual
Image Group Sub-Menu
Component
Save
Close
Description
Saves (with dialog) all images in a project of the same
type as the front most image (e.g. strain map images).
Closes (without saving) all images of the same type
as the front most image.
Analyze Column Positions Dialog
The user will have the option to decide the distances and/or angles to be
evaluated.
Distance Tab
The number of each check box corresponds to the assigned number to the
mouse click. All the distance(s) from the checked point to other points will be
calculated.
Angle Tab
The number of each check box corresponds to the assigned number to the
mouse click. All possible angle(s) whose vertex corresponds to the checked
point will be calculated.
43
HREM Research Inc
PPA for DM Manual
Option Tab
Component
Position (Pos) number
on the image
Column coordinate
Description
Display position number (Left column of the spread
sheet) on original image.
(Motif Detection only)
You can select the origin of column positions in the
Motif.
Show/Hide Sub-Menu
Command
Peaks
Peak Pairs
Motif
Description
Displays the circle at the peak positions on the image.
Displays the peal-pair lines on the image.
Shows/hides Motif
44
HREM Research Inc
PPA for DM Manual
Create Vector Map Dialog
Dialog
Component
Horizontal
Vertical
Interval
Length Scale
Color
Description
Select an image corresponding to the horizontal
component.
Select an image corresponding to the vertical
component.
Specifies an interval to draw arrows (in pixel)
Specifies an arrow length. An actual length is Interval
* Scale (in pixel)
Specifies an arrow color in RGB.
45
HREM Research Inc
PPA for DM Manual
Distortion Correction Sub-Menu
Command
Correct Distortion…
Obtain Distortion Info
Rectify Image...
(see Dialog)
Description
Rectifies any distorted image using the distortion
information obtained previously from an undistorted
sample using the “Obtain Distortion Info” command
below.
A dialog to select two images will be opened.
Extracts distortion information from the Bragg image
of an undistorted crystal after calculating Peak Pairs.
This information will be used by the “Correct
Distortion” command above.
Rectifies an image of an undistorted crystal after
calculating Peak Pairs.
Default basis vector are automatically chosen from
the first and second selected Bragg spots. Basis
vectors can also be manually specified/modified by
the user.
Rectify Image Dialog
Dialog
Component
Length
Angle
Description
Length of base vector considered for image
rectification, measured in pixels
Angle of base vector considered for image
rectification, measured in degrees
46
HREM Research Inc