1
403 Poyntz Avenue, Suite B
Manhattan, KS 66502
USA
+1.785.770.8511
www.thunderheadeng.com
Technical Reference
Pathfinder 2015
Disclaimer
Thunderhead Engineering makes no warranty, expressed or implied, to users of
Pathfinder, and accepts no responsibility for its use. Users of Pathfinder assume sole
responsibility under Federal law for determining the appropriateness of its use in any
particular application; for any conclusions drawn from the results of its use; and for any
actions taken or not taken as a result of analyses performed using these tools.
Users are warned that Pathfinder is intended for use only by those competent in the
field of egress modeling. Pathfinder is intended only to supplement the informed
judgment of the qualified user. The software package is a computer model that may or
may not have predictive capability when applied to a specific set of factual
circumstances. Lack of accurate predictions by the model could lead to erroneous
conclusions. All results should be evaluated by an informed user.
ii
Acknowledgements
This work was partially funded by a Small Business Innovative Research (SBIR) grant by
the United States National Science Foundation.
We would like to thank Rolf Jensen and Associates for their assistance with testing and
other suggestions that helped guide the development of the simulator.
In addition, we would like to thank all of the beta testers who contributed feedback on
the web forums and via email.
iii
Table of Contents
Disclaimer ..................................................................................................................... ii
Acknowledgements ..................................................................................................... iii
Table of Contents ......................................................................................................... iv
Figures ......................................................................................................................... vi
Overview ......................................................................................................................7
Example Problem IMO Test 10 ....................................................................................... 7
Geometry ................................................................................................................... 10
Geometry Subdivision ................................................................................................... 10
Open Space (Room and Ramps) ............................................................................... 11
Doors (Connecting) ................................................................................................... 11
Stairs.......................................................................................................................... 12
Ramps........................................................................................................................ 12
Doors (Exit)................................................................................................................ 12
Behaviors and Goals ................................................................................................... 13
Seek Goals ..................................................................................................................... 13
Idle Goals....................................................................................................................... 13
Paths .......................................................................................................................... 14
Path Planning (Locally Quickest) ................................................................................... 14
Door Choice............................................................................................................... 15
Backtrack Prevention ................................................................................................ 16
Path Generation ............................................................................................................ 17
Path Following............................................................................................................... 17
Path Following in SFPE Mode ...................................................................................... 19
SFPE Mode Parameters................................................................................................. 19
Velocity ......................................................................................................................... 19
Base Speed, vb ........................................................................................................... 20
Density, D .................................................................................................................. 21
Speed Modifiers and Constants ................................................................................ 22
Movement through Doors ............................................................................................ 22
Collision Handling/Response ........................................................................................ 23
Path Following in Steering Mode ................................................................................ 24
Velocity ......................................................................................................................... 24
Acceleration .................................................................................................................. 24
Estimation of Occupant Density, D ............................................................................... 25
Steering ......................................................................................................................... 26
Seek ........................................................................................................................... 26
Idle Separate ............................................................................................................. 26
Avoid Walls ............................................................................................................... 27
iv
Avoid Occupants ....................................................................................................... 28
Seek Separate ........................................................................................................... 28
Seek Wall Separate ................................................................................................... 29
Lanes ......................................................................................................................... 29
Cornering .................................................................................................................. 29
Final Direction Cost ................................................................................................... 30
Evaluating Movement ................................................................................................... 30
Occupant States ............................................................................................................ 31
Effect on Steering Behavior ...................................................................................... 31
Effect on Sample Directions ...................................................................................... 32
Priority........................................................................................................................... 32
Resolving Movement Conflicts ..................................................................................... 33
Free Pass ................................................................................................................... 35
Collision Avoidance/Response ...................................................................................... 35
Movement through Doors ............................................................................................ 36
Elevators ..................................................................................................................... 37
Idling.............................................................................................................................. 37
Elevator Calling ......................................................................................................... 37
Pickup ............................................................................................................................ 37
Countdown Timer ..................................................................................................... 38
Loading ...................................................................................................................... 38
Discharge....................................................................................................................... 38
Solution Procedure ..................................................................................................... 39
File Format.................................................................................................................. 40
Results ........................................................................................................................ 48
Occupant Contours ....................................................................................................... 48
Density ...................................................................................................................... 49
Level of Service ......................................................................................................... 50
Speed ........................................................................................................................ 50
Normalized Speed ..................................................................................................... 50
Usage [Instantanteous] ............................................................................................. 50
Usage [Accumulated] ................................................................................................ 51
Time to Exit ............................................................................................................... 51
Average ..................................................................................................................... 51
Maximum .................................................................................................................. 51
Integrate.................................................................................................................... 51
References .................................................................................................................. 53
v
Figures
Figure 1: Cabin area (from IMO, 2002) ............................................................................... 8
Figure 2: Steering mode results for IMO 10 problem showing occupant movement. Note
how highlighted occupants move to their assigned exits. ................................................. 9
Figure 3: SFPE mode result for IMO 10 problem. Note that multiple occupants can
occupy the same space. ...................................................................................................... 9
Figure 4: A simple building model and the corresponding navigation mesh ................... 10
Figure 5: Rooms, doors, exits and the navigable mesh in the IMO Test 10 problem ...... 11
Figure 6: An occupant's planned path with waypoints shown ......................................... 17
Figure 7: Paths and waypoints for the IMO Test 10 analysis............................................ 18
Figure 8: k as a function of step slope .............................................................................. 21
Figure 9: Average Longitudinal and Lateral Spacing of Pedestrians in a Traffic System
(Figure 3.4 of Fruin's pedestrian planning and design) .................................................... 25
Figure 10: Sample inverse steering directions .................................................................. 26
Figure 11: Potential conflict scenarios .............................................................................. 34
Figure 12: Occupant contours........................................................................................... 48
Figure 13: Navigation Mesh vs. Occupant Contour Mesh ................................................ 49
vi
Pathfinder Technical Reference
Overview
Overview
Pathfinder is an agent-based egress simulator that uses steering behaviors to model
occupant motion. It consists of three modules: a graphical user interface, the simulator,
and a 3D results viewer.
Pathfinder provides two primary options for occupant motion: an SFPE mode and a
steering mode. The SFPE mode implements the concepts in the SFPE Handbook of Fire
Protection Engineering [Nelson and Mowrer, 2002]. This is a flow model, where walking
speeds are determined by occupant density within each room and flow through doors is
controlled by door width.
The steering mode is based on the idea of inverse steering behaviors. Steering
behaviors were first presented in Craig Reynolds' paper "Steering Behaviors For
Autonomous Characters" [Reynolds, 1999] and later refined into inverse steering
behaviors in a paper by Heni Ben Amor [Amor et. al., 2006]. Pathfinder's steering mode
allows more complex behavior to naturally emerge as a byproduct of the movement
algorithms - eliminating the need for explicit door queues and density calculations.
Example Problem IMO Test 10
In the following discussions, it is often useful to have an example with which to illustrate
particular points. One frequently referenced example is Test 10 from the International
Maritime Organization (IMO) [IMO, 2002].
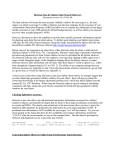
This test problem represents a cabin corridor section as shown in Figure 1. The cabins
are populated as indicated. The population consists of males 30-50 years old with a
minimum walking speed of 0.97 m/s, a mean speed of 1.30 m/s, and a maximum speed
of 1.62 m/s. There is no delay in response and the walking speeds are distributed
uniformly between the minimum and maximum to the 23 occupants. The passengers in
cabins 5 and 6 are assigned the secondary exit; all the remaining passengers use the
main exit. The expected result is that the allocated passengers move to the appropriate
exits.
7
Pathfinder Technical Reference
Overview
Figure 1: Cabin area (from IMO, 2002)
The display of occupant movement, Figure 2, does show that occupants have selected
the assigned exits. In this display, the paths of all occupants are displayed, with selected
occupants and their paths highlighted. For the steering mode analysis, all occupants
exited the corridor in 18.0 seconds.
The results for SFPE mode are illustrated in Figure 3. In SFPE mode, the passengers form
a queue at the main exit and the flow through this door controls the exit time. For the
SFPE analysis, all occupants exited in 21.2 seconds. In SFPE mode, occupants can
overlap in space during movement and when the queue forms.
8
Pathfinder Technical Reference
Overview
Figure 2: Steering mode results for IMO 10 problem showing occupant movement. Note
how highlighted occupants move to their assigned exits.
Figure 3: SFPE mode result for IMO 10 problem. Note that multiple occupants can
occupy the same space.
9
Pathfinder Technical Reference
Geometry
Geometry
Pathfinder uses a 3D geometry model. Within this geometric model is a navigation mesh
defined as a continuous 2D triangulated surface referred to as a "navigation mesh."
Occupant motion takes place on this navigation mesh. The navigation mesh is an
irregular one-sided surface represented by adjacent triangles.
Figure 4 shows a townhouse model and the corresponding navigation mesh. Pathfinder
supports drawing or automatic generation of a navigation mesh from imported
geometry – including Fire Dynamics Simulator files [McGrattan et al., 2007], PyroSim
files, and Autodesk’s Drawing Exchange Format (DXF) and DWG files.
a. 3D geometry
b. Navigation mesh
Figure 4: A simple building model and the corresponding navigation mesh
As can be seen in Figure 4, obstructions in Pathfinder are represented implicitly as gaps
in the navigation mesh. Since occupants can only travel on the navigation mesh, this
technique prevents the overhead of any solid object representation from affecting the
simulator. When the navigation mesh is generated by importing geometry, any region
of the mesh blocked by a solid object is automatically removed. For overhead
obstructions, the mesh generator considers any obstruction within 1.8 meters (6 feet) of
the floor to be an obstacle.
Geometry Subdivision
The navigation geometry is organized into rooms of irregular shape. Each room has a
boundary that cannot be crossed by an occupant. Travel between two adjacent rooms
is through doors. A door that does not connect two rooms and is defined on the
exterior boundary of a room is an Exit door. There can be multiple exit doors. When an
occupant enters an exit door in SFPE mode, they are queued at the door and removed
10
Pathfinder Technical Reference
Geometry
at the flow rate defined by SFPE. Occupants that enter an exit door in reactive steering
mode are removed from the simulation immediately.
Figure 5 illustrates these concepts for the IMO Test 10 problem. The rooms (and
corridors) are shaded different colors. Doors from individual rooms to the corridor (just
another room in the model) are indicated by a thick orange line. Exit doors are
indicated by a thick light green line. Occupants are shown by the blue dots.
Superimposed on the geometry is the navigation mesh.
Figure 5: Rooms, doors, exits and the navigable mesh in the IMO Test 10 problem
Any location on the navigation mesh can be categorized as one of four terrain types:
open space, doors, stairs, and exit. Ramps and rooms are classified as open space. Each
terrain type has an effect on the behavior of occupants on that section of the mesh.
Open Space (Room and Ramps)
Open space provides no explicit constraints on movement. Rooms creating in the user
interface using the room drawing tools are all considered open space having level
terrain, even if rotated so that they have slope. In SFPE mode, the maximum walking
speed of occupants becomes a function of the occupant density in the room.
Doors (Connecting)
Doors connect two adjacent rooms together. In SFPE mode they act as the main flow
control mechanism, as discussed in Movement through Doors on page 22, but in
steering mode, doors merely record the flow between rooms for results viewing unless
explicitly set to limit flow.
11
Pathfinder Technical Reference
Geometry
Normally, occupants can travel through doors in either direction; however, in the user
interface the door can be marked as one-way. This limits occupants to travelling through
the door in only the indicated direction unless the occupant’s profile dictates otherwise.
Stairs
Stairways connect rooms on different levels. They denote areas where the maximum
occupant velocity is controlled by an alternate calculation specific to stairways. The
specific velocity calculation is given in the stairway section for each simulator mode.
At the top and base of each stairway, there are two doors. While the user can edit the
width and activation events for the doors, the doors cannot be directly moved or
deleted independently of the stair. These doors connect the stairway mesh to the
adjacent rooms’ meshes and function identically to ordinary connecting doors.
Like doors, stairs can normally be traversed in either direction, but they can also be
marked as one-way. The simulator models this by making both doors on the ends of the
stair one-way.
Each stair has associated step rise and step run properties, which are settable in the
user interface. This rise/run does not have to match the geometric slope of the stair.
This is important as it relates to the calculation of an occupant’s speed on stairs as
discussed in Velocity on page 19.
Ramps
Ramps are created and represented very similarly to stairs in a Pathfinder model, but
they are treated very differently in the simulation. Like stairs, ramps have two doors at
either end and can be made to be one-way. Unlike stairs, however, ramps do not affect
the speed of occupants when using the default SFPE ramp speed calculations. When
using a custom ramp speed function, the input slope is geometric and cannot be
entered by the user.
NOTE: While a room may be rotated such that it resembles a ramp, it is still a room and
is considered to be level terrain in the speed calculations. The only way to create a
ramp in the user interface is to use one of the ramp drawing tools.
Doors (Exit)
Exits are a special case of doors that mark building exits.
12
Pathfinder Technical Reference
Behaviors and Goals
Behaviors and Goals
Each occupant has a behavior assigned to them in the user interface. A behavior
dictates a sequence of goals that the occupant must achieve in the simulation. There
are two main types of goals in Pathfinder: idle goals and seek goals. Idle goals are ones
in which an occupant must wait at a location until an event occurs, such as a timeinterval elapses or an elevator reaches a discharge floor. Seek goals are ones in which
an occupant moves toward a destination, such as a waypoint, room, elevator, or exit.
Seek Goals
When an occupant seeks, they are trying to find a destination on the mesh. The
occupant uses path planning, path generation, and path following to reach the
destination as discussed in Paths on page 14. The types of seek goals that can be
defined in the user interface and the criteria for an occupant reaching them are defined
as follows:
Waypoint – a point is defined on the mesh along with a radius. The occupant
attempts to reach the point. The waypoint is reached once the occupant is
within the radius of the point.
Room – a room or set of rooms is defined that the occupant should seek. This
goal is reached once the occupant crosses a door leading into one of the rooms.
Elevator – an elevator or set of elevators is defined that the occupant should use.
This goal is implemented in Pathfinder through a combination of a room-seek
goal and an idle goal (the idle goal is discussed in the next section). As discussed
in Elevators, there is a virtual pickup room representing the elevator at each
floor to which the elevator attaches. The room-seek portion of the elevator goal
points to one or more of these virtual rooms. The virtual rooms are selected
based on the location of the previous seek goal. If the previous seek goal is
attached to the elevator on the same floor, the elevator’s room on this floor is
selected as the target room. If not, the next floor down is tested. This continues
until the bottom floor is reached. If no elevator connection is found, the search
continues with the next floors up from the previous seek goal. This continues
until an elevator pickup room is found that connects to the previous seek goal.
Exit – a door or set of doors is defined that the occupant seeks. The goal is
reached once the occupant crosses one of the exit doors. Additionally, the
occupant is removed from the simulation.
Idle Goals
When occupants idle, they wait until an event occurs. While the occupant is waiting in
SFPE Mode, they stand still until the event occurs. While the occupant is waiting in
Steering Mode, they use separation to maintain a distance from other occupants (see
Idle Separate on page 26).
13
Pathfinder Technical Reference
Behaviors and Goals
Because the occupant may move in Steering Mode, they are assigned a containment
area that depends on the previous seek goal in the occupant’s behavior. If the occupant
leaves this area because of separation, they create and use a temporary seek goal to
return to the area. The areas are defined as follows:
If the previous seek goal was a waypoint, the occupant tries to stay in the radius
of the waypoint.
If the previous seek goal was a room (including an elevator), the occupant tries
to stay in the room, away from the doors, allowing other occupants to enter.
If there was no previous seek goal, the occupant can move anywhere along the
mesh.
There are currently two types of events that can trigger an idle goal to finish:
A time interval elapses.
An elevator that the occupant is in reaches its discharge floor and the doors
open. This type of idling is implicit when an occupant is instructed to use an
elevator.
Paths
When an occupant has a destination to seek, they need a plan for how to reach the
destination, a path to follow, and a way to follow the path while accounting for dynamic
obstacles along the path, such as other occupants.
Path Planning (Locally Quickest)
Path planning is the process of determining a plan for moving toward a destination.
Given an occupant seeking a destination, there may be multiple paths to reach the
destination, each with differing lengths, numbers of occupants along the way, and
various hazards. A naïve path planning approach to choosing a route would be to take
the shortest route. This may not be the fastest or best route to the destination for a
particular occupant, however.
Locally quickest is the path planning approach used in Pathfinder to solve this problem.
It plans the route hierarchically, using local information about the occupant’s current
room and global knowledge of the building. It is assumed that an occupant knows about
all doors in their current room as well as queues at those doors. It is also assumed that
the occupant knows how far it is from one of those doors to the current destination
(seek goal). Locally quickest then uses this information to choose a door in the current
room based on a calculated cost of that door. A path is then generated to the door,
which the occupant can follow.
More formally, the occupant uses the following steps to plan a path.
14
Pathfinder Technical Reference
Behaviors and Goals
1. Generate a list of local targets. By default, the local targets include the doors
attached to the occupant’s current room that can lead to the seek goal.1 If the
seek goal is in the current room, it is added to the list of local targets.
2. Choose a local target based on local and global knowledge of the model and
occupant preferences. This is discussed further below.
3. Move toward the local target using path generation and path following,
periodically repeating these steps until the final seek goal is reached.
Door Choice
As mentioned in step 2 above, the occupant chooses a local target by calculating a cost
for the target and choosing the target with the lowest cost. The cost for each target is
based on multiple criteria and the occupant’s preferences. The criteria are as follows:
current room travel time, 𝒕𝒍𝒕 – the time it would take the occupant to reach the
target at maximum speed, ignoring all other occupants.
current room queue time, 𝒕𝒒 – if the target is a door, this is an estimate of the
time the occupant will have wait in the queue at the door based on the
occupant’s position in the queue and the flowrate of the door. If the target is not
a door, the queue time is 0. The flowrate through doors is calculated using a biquad low-pass filter with a cut-off frequency of .05 Hz. In addition, the flowrate
as seen by the occupant is clamped so that it will never be less than 10% of the
nominal flowrate of the door as calculated by SFPE unless there is counterflow at
the door.
NOTE: neither the flowrate filter cutoff frequency nor the minimum clamp are
currently settable in the user interface.
global travel time, 𝒕𝒈𝒕 – the time it would take the occupant to travel from the
target to the current seek goal at the occupant’s maximum speed, ignoring all
other occupants. If the target is the current seek goal, this time is 0.
NOTE: if two targets have global travel times within 10% of the longer time, the
global travel time is treated as the lower of the values. This causes occupants to
prefer the closer door if two targets have similar global travel times.
distance travelled in room, 𝒅𝒕 – the distance the occupant has travelled since
entering the current room.
Each occupant also has a set of door choice preferences that are settable in the user
interface. These preferences are:
Current Room Travel Time Cost Factor, 𝒌𝒍𝒕 – a cost factor associated with the
current room travel time.
1
A door leads to a seek goal if the shortest path from that door to the goal goes immediately outside the
current room or a path exists from the door to the goal that does not pass through any rooms more than
once and does not go through the current room.
15
Pathfinder Technical Reference
Behaviors and Goals
Current Room Queue Time Cost Factor, 𝒌𝒒 – a cost factor associated with the
current room queue time.
Global Travel Time Cost Factor, 𝒌𝒈𝒕 – a cost factor associated with the global
travel time.
Current Door Preference, 𝐩 – a value that gives preference to the occupant’s
most recently chosen target. This value also helps to prevent occupants from
frequently switching local targets.
Current Room Distance Penalty, 𝐤 𝒅𝒅 – a doubling distance that is turned into a
cost factor. This factor causes the travel time costs to increase as the occupant
travels further in a room. It has the effect of causing occupants to prefer doors
with shorter overall distances to shorter times the further they travel in a room.
This is a simplistic way to model fatigue and helps to dampen the frequency at
which occupants switch local targets.
The cost of a particular target is then calculated as follows:
𝐶𝑡𝑎𝑟𝑔𝑒𝑡 = 𝐶𝑙 + 𝐶𝑔
𝐶𝑔 = 𝑝𝑑 𝑘𝑔𝑡 𝑡𝑔𝑡
𝐶𝑙 = max(𝑝𝑑 𝑘𝑙𝑡 𝑡𝑙𝑡 |𝑘𝑞ℎ 𝑘𝑞 𝑡𝑞 )
𝑝𝑑 = 𝑒 𝑘𝑑 𝑑𝑡
log 2
𝑘𝑑 =
𝑘𝑑𝑑
In the equation above, k 𝑞ℎ is set to 1 − 𝑝 for the most recently chosen target and 1.0
for all other targets.
Each occupant chooses a door using this technique when they first enter a room. The
second door choice in the room is randomized per-occupant between 0 to 1 second
later. The third and subsequent door choices occur at intervals of 1 second from the
second door choice. NOTE: This is currently not settable in the user interface.
Backtrack Prevention
Occupants are only aware of queue sizes and door flowrates in their current room.
When they enter a new room, knowledge about the last room is replaced by knowledge
about the current room. Without any sort of backtrack prevention in place, large queues
could lead to occupants walking back-and-forth between two rooms, potentially for long
periods of time (until the previous room emptied). In Pathfinder, once an occupant
manages to exit a room using a particular exit door, they are committed to that routing
decision using the following rules:
1. The next local door the occupant selects may not lead back into any previous
rooms. If this rule eliminates all options (e.g. the occupant went through an
unplanned door), then
2. Backtrack prevention is disabled, the occupant can choose from any valid local
door.
16
Pathfinder Technical Reference
Behaviors and Goals
Path Generation
Once a local target has been chosen through path planning, a path is needed to reach
the target. Pathfinder uses the A* search algorithm [Hart et al., 1968] and the
triangulated navigation mesh. The resulting path is represented as a series of points on
edges of mesh triangles. These points from A* create a jagged path to the occupant’s
goal.
To smooth out this jagged path, Pathfinder then uses a variation on a technique known
as string pulling [Johnson, 2006]. This re-aligns the points so the resulting path only
bends at the corner of obstructions but remains at least the occupant’s radius away
from those obstructions. Examples of these final points, called waypoints, are shown in .
shows the projected path of an occupant in a simple rectangular room. The occupant is
standing in the lower-left corner and plans to exit out the lower-right corner. The
navigation mesh is shown by the thin lines that form triangles inside the rectangular
area. An obstruction prevents the occupant from walking straight to the exit. The
planned path of the occupant is shown as the dark line and the waypoints are shown as
circles. A waypoint is generated for each edge that intersects the path.
Once these waypoints are found, Pathfinder removes intermediate points that lie
between two others in a straight line. This creates a series of waypoints only where the
direction of travel will change.
Figure 6: An occupant's planned path with waypoints shown
Path Following
Once a path is generated, the occupant needs a way to follow the waypoints. The
occupant performs the following:
1. Two waypoints are tracked: (1) a current waypoint that is initially the furthest
waypoint on the path that defines a bend in the path, and (2) a next waypoint
that defines the next bend in the path.
2. The occupant checks if the next waypoint should become the current. This is
determined by checking if the occupant crossed an infinite line connecting the
current waypoint with the next waypoint. If the line is crossed, the next
waypoint becomes the current and a new next waypoint is determined.
3. The occupant checks for the need to re-path. Occupants must re-path if they
cannot see a straight line to their current waypoint or if it is time to re-evaluate
the current door choice according to locally quickest.
17
Pathfinder Technical Reference
Behaviors and Goals
4. A seek curve is generated to define the desired motion. In SFPE mode, this curve
is merely a straight line segment from the current position to the current
waypoint. In steering mode, this is a quadratic B-spline using the current
position, the current waypoint, and a control point that is projected back along
the direction from the current waypoint to the next waypoint.
5. The occupant attempts to move along the tangent to the current seek curve.
This movement is strongly influenced by the movement mode (SFPE or steering)
and is discussed in the next sections.
Figure 7 shows the paths and waypoints for the IMO Test 10 problem for both SFPE and
steering modes. The green lines indicate the current seek curves for each occupant. The
red lines and points indicate future paths and waypoints. Notice the straight seek curve
in the SFPE mode as compared to the spline used in steering mode.
a. SFPE mode
b. Steering mode
Figure 7: Paths and waypoints for the IMO Test 10 analysis
18
Pathfinder Technical Reference
Path Following in SFPE Mode
Path Following in SFPE Mode
Pathfinder provides the option to calculate motion in an SFPE Mode. This mode
implements the flow-based egress modeling techniques presented in the SFPE
Handbook of Fire Protection Engineering [Nelson and Mowrer, 2002] and the SFPE
Engineering Guide: Human Behavior in Fire [SFPE, 2003]. The SFPE calculation as
described in the handbook is a flow model, where walking speeds and flow rates
through doors and corridors are defined.
In Pathfinder, navigation geometry can be grouped into three types of components;
doors, rooms, and stairs. Rooms are open space on which occupants can walk. Stairs
can be thought of as specialized rooms in which the slopes of the stairs limit the speed
of the occupants. Doors are flow limiters that connect rooms and stairs. There is no
specialized corridor type as in the SFPE guide. Instead, corridors are modeled as rooms
with doors on either end. In this manner, corridors are handled in the same manner as
rooms, with the flow being controlled by the doors.
In SFPE mode, multiple occupants can occupy the same space.
SFPE Mode Parameters
In SFPE Mode, the following parameters are used.
Max Room Density (0.0 < Dmax, default=3.55 pers/m2) – This parameter controls how
many occupants will be allowed to enter a room via doors and stairways. Pathfinder
uses room density to determine movement speed and door flowrate. When occupants
queue at doors, they will not be able to leave the queue on their turn unless doing so
will keep the density in the next room below this value.
Boundary Layer (0.0 <= BL) – This value controls the effective width of every door in the
simulation – including doors associated with stairs. The effective width of a door is W 2*BL where W is the actual width of the door. The effective width of a door controls the
rate at which occupants can pass through the door.
Door Flow Rates at High Density, Use a Calculated Specific Flow (on/off, default=on) –
This flag controls the calculation of door specific flow with respect to density. If this flag
is enabled, specific flow for doors is calculated based on the occupant density in
adjacent rooms. This calculation is explained in Movement through Doors on page 22.
Door Flow Rates at High Density, Always Use Max Specific Flow (on/off, default=off) –
This flag controls the calculation of door specific flow with respect to density. If this flag
is enabled, doors always use maximum specific flow.
Velocity
The velocity, v, at which an occupant moves depends on several factors, including the
occupant’s maximum velocity (𝑣𝑚𝑎𝑥 ) specified in the user interface, the type of terrain
19
Pathfinder Technical Reference
Path Following in SFPE Mode
being travelled on, speed modifiers and constants associated with the terrain, and
occupant density in the current room.
Base Speed, vb
The occupant’s base speed, 𝑣𝑏 , is defined as a function of density, terrain, and a speed
fraction curve based on the SFPE fundamental diagram. It does not take terrain speed
modifiers or constants into account.
𝑣𝑏 = 𝑣𝑚𝑎𝑥 ∗ 𝑣𝑓 (𝐷) ∗ 𝑣𝑓𝑡
𝑣𝑚𝑎𝑥 is the occupant’s maximum speed as entered in the user interface as Speed.
𝑣𝑓 (𝐷) is a speed fraction as a function of density as follows:
𝑣𝑓 (𝐷) = {
𝑚𝑎𝑥 [𝑣𝑓𝑚𝑖𝑛 ,
1,
𝐷 < .55 𝑝𝑒𝑟𝑠/𝑚2
1
(1 − .266𝐷)] ,
. 85
𝐷 ≥ .55 𝑝𝑒𝑟𝑠/𝑚2
𝑣𝑓𝑚𝑖𝑛 is a minimum speed fraction as defined in the user interface (default=.15), and 𝐷
is the occupant density in the current room.
𝑣𝑓𝑡 is a speed fraction that depends on the type of terrain being traversed by the
occupant. It is defined as
𝑘
1.4
For level terrain (rooms) and ramps, k = 1.40 m/s. For stairs, 𝑘 depends on the step
slope of the stairway. The SFPE handbook defines 𝑘 only for a limited set of known step
slopes as follows:
𝑣𝑓𝑡 =
Stair Riser (inches) Stair Tread (inches) k
7.5
10.0
1.00
7.0
11.0
1.08
6.5
12.0
1.16
6.5
13.0
1.23
Pathfinder uses this information to determine k values for any stairs by constructing a
piece-wise linear function that maps step slope to k values using these known data
points. The step slope of a stair is defined as:
20
Pathfinder Technical Reference
Path Following in SFPE Mode
𝑆𝑡𝑎𝑖𝑟 𝑅𝑖𝑠𝑒𝑟
𝑆𝑡𝑎𝑖𝑟 𝑇𝑟𝑒𝑎𝑑
For step slopes above .75 (the maximum in the table), the values are extrapolated down
to a minimum k of .034. This ensures that very steep stairs do not cause occupants to
become excessively slow. For step slopes below .5 (the minimum in the table), 𝑘 is
linearly interpolated to 1.4 at a step slope of 0 (while not realistic, this would
correspond to a flat stairway). This produces a 𝑘 function as shown in Figure 8.
𝑠𝑡𝑒𝑝 𝑠𝑙𝑜𝑝𝑒 =
k
1.6
1.4
0.5, 1.23
0.541, 1.16
0.638, 1.08
0.748, 1
1.2
1
0.8
0.6
0.4
0.2
0
0
0.2
0.4
0.6
0.8
1
1.2
1.4
1.6
1.8
2
Step Slope
Figure 8: k as a function of step slope
Density, D
In SFPE mode, density is considered uniform throughout a single room. It is calculated as
follows:
𝑛𝑝𝑒𝑟𝑠
𝐷=
𝐴𝑟𝑜𝑜𝑚 − 𝐴𝑏𝑙𝑎𝑦𝑒𝑟
𝑛𝑝𝑒𝑟𝑠 is the number of occupants in the room, 𝐴𝑟𝑜𝑜𝑚 is the area of the room, and
𝐴𝑏𝑙𝑎𝑦𝑒𝑟 is the area of the boundary layer, which is calculated by multiplying the total
length of the boundary edges in the room by the boundary layer as set in the user
interface.
21
Pathfinder Technical Reference
Path Following in SFPE Mode
Speed Modifiers and Constants
Egress components, such as rooms, stairs, and ramps, can be assigned speed modifiers
and speed constants in the user interface, which can be used to emulate environmental
effects, such as smoke, and specialized navigational geometry such as escalators and
moving walkways. By default, all egress components have a speed modifier of 1.
When an occupant enters an egress component with a speed modifier, the occupant’s
speed on that component is calculated as follows:
𝑣 = 𝑘𝑣 𝑣𝑏
where 𝑘𝑣 is the speed modifier for the component, and 𝑣𝑏 is the occupant’s base speed
on the component.
If the component has a speed constant instead of a speed modifier, the occupant’s
speed depends on the occupant’s profile parameter, Walk on Escalators, and the speed
constant value. If Walk on Escalators is turned on or the speed constant’s value is 0, the
occupant’s speed is:
𝑣 = 𝑣𝑐 + 𝑣𝑏
where 𝑣𝑐 is the speed constant for the component. Otherwise, the occupant’s speed is:
𝑣 = 𝑣𝑐
Movement through Doors
When using Pathfinder in SFPE Mode, the occupant flow rate through the door is
specified by the SFPE guidelines. This is implemented using a delay timer that controls
how quickly occupants are allowed to pass through the door. This timer is initially set at
zero. When an occupant passes through the door, the simulator calculates a delay time
based on the specific flow of the door. That delay time is added to the door and must
elapse before another occupant is allowed to pass through.
Each door may have a different specific flow depending on the direction occupants are
going through the door and the type of terrain connected to the door. The specific flow
for a particular direction through a door is
𝐹𝑠 = (1 − .266 ∗ 𝐷) ∗ 𝑘 ∗ 𝐷
The evacuation speed constant, 𝑘, depends on the terrain of the previous room, and 𝐷
is the maximum of the occupant densities in the rooms attached to the door. Because
the flow equation is quadratic, the value of 𝐷 is clamped to the range [1.9, 3.0] pers/m2.
This range ensures that low densities do not slow the flowrate and that high densities
do not reduce the flowrate to zero.
In the user interface, if Door Flow Rates at High Density, Use a Calculated Specific Flow is
selected, the density is calculated as described above. Otherwise, it is set to 1.88 pers/
m2 to maximize the flowrate.
The time it takes n occupants to pass through a door with effective width We is
22
Pathfinder Technical Reference
Path Following in SFPE Mode
𝑇=
𝑛−1
𝐹𝑠
The n value is reduced by 1 because the first occupant through a door does not have to
wait for a time delay.
In counter-flow situations, an occupant from R1 may be waiting at a queue to enter R2
while an occupant from R2 may be waiting to enter R1. In this case, the queues evenly
exchange their next occupant and both occupants are allowed through the door. The
delay time placed on the door queue becomes the sum of the delay times from each
occupant’s passage, which maintains the correct flow rate for the simulation.
Collision Handling/Response
In SFPE mode, while occupants cannot collide with other occupants, they can still collide
with walls. Collision handling is applied in two steps. The first step occurs before
movement is attempted for a time step, and the second occurs during movement. For
the pre-movement step, the travel velocity is adjusted to force the occupant to slide
along any nearby walls. After the travel velocity is adjusted, the occupant attempts to
move using this new velocity. During the movement stage, wall collisions are still
possible, so the occupant will simply halt at the earliest collision.
23
Pathfinder Technical Reference
Path Following in Steering Mode
Path Following in Steering Mode
In steering mode, Pathfinder uses a combination of steering mechanisms and collision
handling to control how the occupant follows their seek curve. These mechanisms allow
the occupant to deviate from the path while still heading in the correct direction toward
their goal.
Velocity
As an occupant moves along their path, they calculate a modified maximum velocity,
𝑣́𝑚𝑎𝑥 , that depends on the occupant's current terrain, specified maximum velocity, 𝑣𝑚𝑎𝑥 ,
and the spacing of surrounding occupants. The spacing of surrounding occupants is
used to estimate an occupant density, D, as described below. These parameters are
then used in the equations to calculate v in SFPE mode (see Velocity on page 19), which
becomes 𝑣́𝑚𝑎𝑥 .
In steering mode, both 𝑣𝑓 (𝐷) and 𝑣𝑓𝑡 , which are used to calculate 𝑣́𝑚𝑎𝑥 , may either be
left at the SFPE default or may be user-defined in the occupant profile as piece-wise
linear functions. 𝑣𝑓 (𝐷) is entered as a function of occupant density and 𝑣𝑓𝑡 is entered
as a function of either stair step slope or ramp slope, depending on the terrain type.
Stair step slope is entered in the user interface by specifying a stair’s riser and tread.
Ramp slope is determined by the normal of the triangle that belongs to a ramp node
and cannot be entered directly by the user. A triangle’s slope is calculated as follows:
𝑠𝑙𝑜𝑝𝑒 =
√ 𝑛𝑥 2 + 𝑛𝑦 2
𝑛𝑧
𝑛𝑥 , 𝑛𝑦 , and 𝑛𝑧 are the components of the triangle’s normal. In addition, different 𝑣𝑓 (𝐷)
and 𝑣𝑓𝑡 functions may be defined for when the occupant goes up or down stairs or
ramps. This is in contrast to SFPE calculations, which use the same functions for both up
and down.
Once 𝑣́𝑚𝑎𝑥 is calculated, it is then used by the steering system to calculate a desired
velocity vector as described in Steering on page 26.
Acceleration
An occupant’s acceleration is split into multiple components depending on the desired
velocity vector calculated by the steering system. A tangential forward component of
acceleration is calculated as:
𝑎𝑓𝑚𝑎𝑥 =
𝑣𝑚𝑎𝑥
𝑡𝑎𝑐𝑐𝑒𝑙
where 𝑡𝑎𝑐𝑐𝑒𝑙 is the occupant profile parameter, Acceleration Time. The tangential reverse
component of acceleration is:
𝑎𝑏𝑚𝑎𝑥 = 2 ∗ 𝑎𝑓𝑚𝑎𝑥
24
Pathfinder Technical Reference
Path Following in Steering Mode
The radial component of acceleration is:
𝑎𝑟𝑚𝑎𝑥 = 1.5 ∗ 𝑎𝑓𝑚𝑎𝑥
These components are combined to determine the final acceleration vector.
Estimation of Occupant Density, D
To calculate 𝑣́𝑚𝑎𝑥 for an occupant, the occupant density D at that occupant’s location
must be known. Pathfinder estimates the density by using the spacing of the near
occupants and the average longitudinal and lateral spacing density relationship
demonstrated in Chapter 3 of (Fruin, 1987) as shown in Figure 9.
Figure 9: Average Longitudinal and Lateral Spacing of Pedestrians in a Traffic System
(Figure 3.4 of Fruin's pedestrian planning and design)
In Pathfinder, the density lines in the figure are treated as contours, each being
estimated as an ellipse. The contours are mirrored about Y=0.
To calculate the density for an occupant, the X axis in the figure is aligned with the
occupant’s current velocity and the origin is set to the occupant’s location, forming a
local coordinate system. Then for each other near occupant, their location is
transformed to this local coordinate system. If the local coordinate for the other
occupant has an x value less than 0, the occupant is ignored. This prevents an
occupant’s speed from being affected by occupants behind them. For occupants with
local x >= 0, the density is interpolated or extrapolated from the density contours. The
maximum of these densities is then used as the density for the occupant.
25
Pathfinder Technical Reference
Path Following in Steering Mode
Steering
The steering system in Pathfinder moves occupants so they roughly follow their current
seek curve and can respond to a changing environment. Inverse steering, used in
Pathfinder, is the process of evaluating a set of discrete movement directions for an
occupant and choosing the direction that minimizes a cost function. See Figure 10 for
an example of sample directions. The cost function is evaluated by combining several
types of steering behaviors to produce a cost. The types of steering behaviors used are
determined by the occupant’s current state, and the number of sample directions is
controlled by the occupant’s state and current velocity. For more information on states,
see Occupant States on page 31.
Figure 10: Sample inverse steering directions
Pathfinder defines several steering behaviors: seek, idle separate, seek separate, seek
wall separate, avoid walls, avoid occupants, lanes, and cornering. Most behaviors award
a cost between 0 and 1 for each sample direction. The net cost for a direction is a
weighted sum of these values.
Seek
The seek behavior steers the occupant to travel along a seek curve. Given the sample
direction v, and a seek curve sc, the seek behavior bases its cost on the magnitude of
the angle between v and the tangent to sc. The cost is calculated as follows:
𝐶𝑠𝑒𝑒𝑘 =
𝜃𝑡
2𝜋
Where 𝜃𝑡 is the angle between v and the tangent vector to sc.
Idle Separate
The idle separate behavior steers occupants to maintain a desired distance away from
other occupants and is used when occupants are in an idle state. This behavior works
somewhat outside the inverse steering system, in that before considering sample
directions, the separation behavior calculates a desired absolute movement vector
(direction and distance). This movement vector is calculated as the average of occupant
separation vectors as follows:
𝑚
̅=
1
𝑛𝑜𝑐𝑐
26
𝑛𝑜𝑐𝑐
∑ ̅̅̅̅
𝑚𝑖
𝑖=1
Pathfinder Technical Reference
Path Following in Steering Mode
Where 𝑛𝑜𝑐𝑐 is the number of occupants by which the occupant would like to separate.
If the ith occupant is idle, ̅̅
𝑚̅̅𝑖 is calculated as:
𝐷𝑔𝑎𝑝 = |𝑝 − 𝑝𝑖 | − 𝑟 − 𝑟𝑖
𝑝 − 𝑝𝑖
𝑚̅̅𝑖 = (𝐷𝑔𝑎𝑝 − 𝐷𝑠𝑒𝑝 )
̅̅
|𝑝 − 𝑝𝑖 |
Where 𝑝 is the position of an occupant, 𝑟 is the radius of an occupant, and 𝐷𝑠𝑒𝑝 is the
desired separation distance of the occupant (settable via the input parameter, comfortDist).
If the ith occupant is seeking, ̅̅̅̅
𝑚𝑖 is instead calculated such that it is perpendicular to the
ith occupant’s direction of travel and its magnitude is defined as:
|𝑚
̅̅̅̅|
𝑖 = r + 𝑟𝑖 + 𝐷𝑠𝑒𝑝 − 𝐷𝑝𝑎𝑡ℎ
Where 𝐷𝑝𝑎𝑡ℎ is the occupant’s distance to the nearest point on the line tangent to the
ith occupant’s seek curve.
Once the movement vector is defined, the separation behavior works like other inverse
steering behaviors. The cost is calculated as follows:
𝐶𝑖𝑠𝑒𝑝 = 1 − (𝑚
̅̅̅̅𝑖 ∙ ̅̅̅
𝑑𝑠 )
Where ̅̅̅
𝑑𝑠 is the sample direction.
Avoid Walls
The avoid walls behavior detects walls and steers the occupant to avoid collisions with
them. This behavior projects a moving cylinder ahead of the occupant in the direction of
the projected point. The cost reported by this behavior is based on the distance the
occupant can travel in the direction of the projected point. It is also affected by the
angle at which the occupant hits the wall. The cost is decreased if the agent will hit the
wall at a shallow angle to the desired direction.
𝐷𝑚𝑖𝑛 =
𝑣́𝑐𝑢𝑟𝑟 2
2𝑎𝑏𝑚𝑎𝑥
𝑣́𝑚𝑎𝑥 2
[
𝐷𝑚𝑎𝑥 = 𝐷𝑚𝑖𝑛 + max
, 𝑣́
𝑡 ]
2𝑎𝑏𝑚𝑎𝑥 𝑐𝑢𝑟𝑟 𝑤𝑐𝑟
𝐷𝑐𝑜𝑙𝑙 − 𝐷𝑚𝑖𝑛
𝐶 =1−
𝐷𝑚𝑎𝑥 − 𝐷𝑚𝑖𝑛
1,
𝐶𝑎𝑤 = {
̅̅̅̅̅̅̅
̅̅̅
𝐶 ∗ (1 − 𝑑𝑠𝑙𝑖𝑑𝑒 ∙ 𝑑𝑠 ),
̅̅̅̅̅̅̅
𝑑𝑠𝑙𝑖𝑑𝑒 ∙ ̅̅̅̅̅̅
𝑑𝑑𝑒𝑠 ≤ 0
̅̅̅̅̅̅̅
𝑑𝑠𝑙𝑖𝑑𝑒 ∙ ̅̅̅̅̅̅
𝑑𝑑𝑒𝑠 > 0
𝑡𝑤𝑐𝑟 is the maximum time at which an occupant will react to a wall collision (fixed at 2 s),
𝑎𝑏𝑚𝑎𝑥 is the maximum tangential deceleration, 𝐷𝑐𝑜𝑙𝑙 is the collision distance, ̅̅̅̅̅̅̅
𝑑𝑠𝑙𝑖𝑑𝑒 is the
̅̅̅̅̅̅
direction the agent would slide if they hit the wall, 𝑑𝑑𝑒𝑠 is the desired travel direction,
and ̅̅̅
𝑑𝑠 is the sample direction. The resulting cost is clamped from 0 to 1.
27
Pathfinder Technical Reference
Path Following in Steering Mode
Avoid Occupants
The avoid occupants behavior steers an occupant to avoid collisions with other
occupants. This behavior first creates a list of occupants within a frustum whose size and
shape is controlled by the velocity of the occupant. Then the behavior projects a moving
cylinder ahead of the occupant in the sample direction. This cylinder is tested against
another moving cylinder for each nearby occupant. If none of the moving cylinders
collide the cost is zero, otherwise the cost is based on how far the occupant can travel
prior to the collision. The closer this collision point, the higher the cost of the steering
behavior.
The cost is based on the earliest collision with another occupant along the sample
direction and is evaluated as follows:
𝐷𝑚𝑖𝑛 = 𝐷𝑠𝑒𝑝 +
𝑣́𝑐𝑢𝑟𝑟 2
2𝑎𝑚𝑎𝑥
𝑣́𝑚𝑎𝑥 2
𝐷𝑚𝑎𝑥 = 𝐷𝑚𝑖𝑛 + max [
, 𝑣́
𝑡 ]
2𝑎𝑚𝑎𝑥 𝑐𝑢𝑟𝑟 𝑐𝑟
𝐷𝑐𝑜𝑙𝑙 − 𝐷𝑚𝑖𝑛
𝐶𝑎𝑜 = 1 −
𝐷𝑚𝑎𝑥 − 𝐷𝑚𝑖𝑛
Where 𝐷𝑠𝑒𝑝 is the desired separation distance between the occupant and the collision
occupant (settable via the input parameter, comfortDist), 𝑡𝑐𝑟 is the maximum time at
which an occupant will react to a collision (settable via the input parameter,
collisionResponseTime), and 𝐷𝑐𝑜𝑙𝑙 is the collision distance. The resulting cost is clamped
from 0 to 1.
Seek Separate
The seek separate behavior spreads out occupants to maximize their travel speed as
calculated by the occupant’s speed-density curve and Fruin’s spacing-density
relationship (see Figure 9).
For a sample direction, the occupant’s future location along that direction is predicted
using 𝑣́𝑚𝑎𝑥 and the steering update interval, settable in the user interface. In addition,
the locations of the surrounding occupants are predicted using their current velocity
and the steering update interval. From these predicted locations, the density is
estimated as described in Estimation of Occupant Density, D on page 25. The speed is
then predicted at that location from the density and the occupant’s speed-density curve.
The predicted speed is then used to calculate the cost.
𝐶𝑠𝑠𝑒𝑝 = 1 − (
𝑣𝑝𝑟𝑒𝑑 2
)
𝑣𝑚𝑎𝑥
𝑣𝑚𝑎𝑥 is the occupant’s maximum speed ignoring occupant density, and 𝑣𝑝𝑟𝑒𝑑 is the
predicted speed.
28
Pathfinder Technical Reference
Path Following in Steering Mode
Seek Wall Separate
The seek wall separate behavior steers occupants such that they want to main a
boundary layer distance away from walls. Like the seek separate behavior, the
occupant’s location is predicted along the sample direction using 𝑣́𝑚𝑎𝑥 and the steering
update interval. The nearest wall to this location is then used calculate the cost.
𝑑𝑤 − 𝑟 − 𝑏𝑙
𝑏𝑙
Where 𝑑𝑤 is the distance to the nearest wall (walls more than 90° from the sample
direction are ignored), 𝑟 is the occupant’s radius, and 𝑏𝑙 is the boundary layer set in the
occupant profile. The cost is clamped from 0 to 1.25.
𝐶𝑠𝑤𝑠𝑒𝑝 = 1 −
Lanes
The lanes behavior steers occupants into lanes when they detect that they are in
counterflow with other occupants. It works by steering an occupant towards the center
of mass of the occupants in front who are not in counterflow. Other occupants are
considered to be in front if their center is within 60° of the tangent to the occupant’s
seek curve. For these in-front occupants, the vector to their center of mass is calculated
as the following:
𝑣𝑐𝑒𝑛 = −𝑝
̅̅̅̅̅
̅̅̅̅̅
𝑜𝑐𝑐 +
1
𝑛𝑜𝑐𝑐
𝑛𝑜𝑐𝑐
∑ 𝑝̅𝑖
𝑖=1
𝑝
̅̅̅̅̅
̅𝑖 is the
𝑜𝑐𝑐 is the location of the occupant, 𝑛 is the number of occupants in front, and 𝑝
th
location of the i occupant in front.
The cost, 𝐶𝑙𝑎𝑛𝑒𝑠 , for the lanes behavior is determined in the following order:
1. If the occupant is considered to be a lane leader, the cost is 0. An occupant is a
lane leader if there are no occupants in front who are not in counterflow.
2. If a test direction does not lead to counterflow, the cost is 0. A test direction
leads to counterflow if at least one vector from the occupant to a counterflow
occupant has an angle less than 36° to the test direction.
3. The cost is calculated as the angle between the test direction and ̅̅̅̅̅.
𝑣𝑐𝑒𝑛
Cornering
The cornering behavior seeks to steer agents so that they can take wide turns as part of
a group without cutting in front of each other. This allows them to better utilize wide
hallways/ramps with turns. To a certain extent, the avoid occupants and seek separate
behaviors already achieve this, but the cornering behavior improves this.
The cornering behavior works similarly to avoid occupants, but it treats the size and
positions of the nearby occupants differently when calculating intersections between
occupant paths. The size of a nearby occupant is expanded by 50% and their position is
moved by a distance of 150% of the occupant’s radius along their most recent steering
29
Pathfinder Technical Reference
Path Following in Steering Mode
direction. In addition, a flow direction is calculated from nearby occupants who are in
front of the occupant as follows:
𝑛
𝑣𝑓𝑙𝑜𝑤 = ∑ ̅̅̅̅
̅̅̅̅̅̅̅
𝑑𝑖𝑓
𝑖=1
𝑛 is the number of nearby occupants in front, and ̅̅̅̅
𝑑𝑖𝑓 is the direction that the ith
occupant is facing.
The cost, 𝐶𝑐𝑛𝑟 , is calculated as follows:
1. If any intersections are found, the cost is calculated the same as in avoid
occupants except with the expanded occupant radius and adjusted positions.
2. If the test direction’s angle with the tangent to the seek curve is greater than 60°
and the test direction’s angle with 𝑣
̅̅̅̅̅̅̅
𝑓𝑙𝑜𝑤 is greater than 90°, the cost is 1.0.
3. Otherwise, the cost is 0.
Final Direction Cost
The final cost for a sample direction is a weighted sum of the individual behavioral costs:
𝐶𝑑𝑠 = .5𝐶𝑠𝑒𝑒𝑘 + 𝑤𝑖𝑠𝑒𝑝 𝐶𝑖𝑠𝑒𝑝 + 𝑤𝑎𝑜 𝐶𝑎𝑜 + 𝑤𝑎𝑤 𝐶𝑎𝑤 + 𝑤𝑠𝑠𝑒𝑝 𝐶𝑠𝑠𝑒𝑝 + 𝑤𝑠𝑤𝑠𝑒𝑝 𝐶𝑠𝑤𝑠𝑒𝑝
+ 𝑤𝑙𝑎𝑛𝑒𝑠 𝐶𝑙𝑎𝑛𝑒𝑠 + 𝑤𝑐𝑛𝑟 𝐶𝑐𝑛𝑟
The weights depend on the occupant’s current state, and are defined in the following table.
Weight
State=Idle
State=Seeking
𝑤𝑎𝑜
1
1
𝑤𝑎𝑤
1
1
𝑤𝑖𝑠𝑒𝑝
1
0
𝑤𝑠𝑠𝑒𝑝
0
2
𝑤𝑠𝑤𝑠𝑒𝑝
0
1
𝑤𝑙𝑎𝑛𝑒𝑠
0
1
𝑤𝑐𝑛𝑟
.2
.2
Evaluating Movement
Once the lowest cost direction has been determined, the steering velocity and
acceleration are calculated that will move the occupant in the steering direction.
30
Pathfinder Technical Reference
Path Following in Steering Mode
Along with a cost, each steering behavior calculates a maximum distance that should be
traveled along the sample direction. This maximum distance is then used to determine
the magnitude of the desired velocity, 𝑣𝑑𝑒𝑠 , as follows:
𝑣́𝑐𝑢𝑟𝑟 2
2𝑎𝑚𝑎𝑥
0,
𝐷𝑚𝑎𝑥 ≤ 𝐷𝑠𝑡𝑜𝑝
|𝑣𝑑𝑒𝑠 | = {
𝑣𝑚𝑎𝑥 , 𝐷𝑚𝑎𝑥 > 𝐷𝑠𝑡𝑜𝑝
𝑣𝑑𝑒𝑠 = |𝑣𝑑𝑒𝑠 |𝑑𝑑𝑒𝑠
𝐷𝑠𝑡𝑜𝑝 =
Where 𝐷𝑚𝑎𝑥 is the maximum distance for the lowest cost sample direction, 𝑑𝑑𝑒𝑠 is the
lowest cost sample direction, and 𝑣𝑐𝑢𝑟𝑟 is the occupant’s current velocity.
The acceleration is calculated as follows [Reynolds, 1999]:
𝑎=
𝑣𝑑𝑒𝑠 − 𝑣𝑐𝑢𝑟𝑟
𝑎
|𝑣𝑑𝑒𝑠 − 𝑣𝑐𝑢𝑟𝑟 | 𝑚𝑎𝑥
Explicit Euler integration is then used to calculate the velocity and position of each
occupant for the next time step from their steering acceleration. The velocity and
position are calculated as follows:
𝑣̅𝑛𝑒𝑥𝑡 = 𝑣𝑐𝑢𝑟𝑟 + 𝑎∆𝑡
𝑝̅𝑛𝑒𝑥𝑡 = 𝑝𝑐𝑢𝑟𝑟 + 𝑣̅𝑛𝑒𝑥𝑡 ∆𝑡
Where ∆𝑡 is the time step size, 𝑝𝑐𝑢𝑟𝑟 is the current position, and 𝑝̅𝑛𝑒𝑥𝑡 is the position
after the time step.
Occupant States
Depending on an occupant’s current scripted behavior, they will be in one of two states:
a. Seeking – the occupant is trying to follow a path to some destination.
b. Idling – the occupant is waiting for a specified amount of time.
Effect on Steering Behavior
Occupant state has a direct effect on which steering behaviors are combined to
determine the lowest cost steering direction.
When idling, the occupant combines separation, avoid occupants, and avoid walls. This
allows the occupant to maintain a separation with other occupants, move away from
others that might be trying to seek near them, and avoid other occupants and walls at
the same time.
When seeking, the occupant combines seek, avoid occupants, avoid walls, seek
separation, seek wall separation, lanes, and cornering. This allows the occupant to
avoid collisions with other occupants and walls and follow their seek curve. To a limited
extent, the avoid occupants behavior integrates separation, so a separate separation
behavior is unnecessary. While seeking, the occupant may temporarily switch to an idle
31
Pathfinder Technical Reference
Path Following in Steering Mode
state if they sense another occupant of higher priority or they have moved in such a way
that they are touching another occupant. By temporarily switching to the idle state,
they are able to move away from the other occupant to maintain the desired separation.
Effect on Sample Directions
Occupant state also affects the number of sample directions used for inverse steering.
In an idle state, 8 sample directions are tested, 45° apart, along with a “null” direction
that tests standing still. This allows the occupant 360° of movement so they can easily
separate from others.
When seeking, the occupant tests a different set of directions depending on the
occupant’s speed. A seed direction tangent to the occupant’s seek curve is used as the
starting direction. If the occupant’s speed is relatively slow, they will consider 7 more
sample directions, 45° apart as when idling. If their speed is faster, the sample
directions are taken 15° apart, up to 75° to either side, creating 9 sample directions.
The occupant’s speed is considered “slow” if the following is true:
𝑣𝑐𝑢𝑟𝑟 ≤ 𝑓𝑠𝑙𝑜𝑤 𝑣́𝑚𝑎𝑥
Where 𝑓𝑠𝑙𝑜𝑤 is settable via the input parameter, slowFactor, and 𝑣́𝑚𝑎𝑥 is the occupant’s
modified maximum velocity. In addition to the sample directions, the null direction is
again considered for seeking.
Priority
Pathfinder provides a priority system that operates on discrete priority levels assigned
to each occupant. When occupants encounter other occupants at the same priority
level as their own, they behave as indicated above (the common case). If, however,
they detect another occupant with a different priority nearby and in front of them, they
will slightly alter the above behaviors.
If the other occupant is of lower priority, the occupant will not separate and will use a
comfort distance of zero, effectively allowing them to push against the other occupant if
necessary. Because there is no notion of occupants exerting force on one-another, the
other occupant must respond accordingly.
So in the inverse case of an occupant detecting another of higher priority within their
comfort distance, they will ignore their seek behavior and instead use their separation
behavior, even if their goal puts them in a seek state. This allows them to back away
from the occupant of higher priority, giving the higher priority occupant a chance to
move through.
Priority levels are completely relative. For example, if three occupants meet having
priorities of 5, 7, and 12, their behavior toward one another would be exactly the same
as if their priorities were 0, 1, and 2, respectively. Occupants with higher priority values
have higher priority over other occupants.
32
Pathfinder Technical Reference
Path Following in Steering Mode
Resolving Movement Conflicts
There are some scenarios where an occupant’s movement conflicts with another
occupant’s movement due to limitations of the geometry. In these situations occupants
must negotiate how to resolve these conflicts such that they can continue moving. The
following examples illustrate how these situations can arise and are pictured in Figure
11:
a) Multiple occupants are simultaneously headed in a common direction and are
approaching a physically tight area that will not allow all of them to pass at once
(such as a narrow door or narrow hallway).
b) Occupants are headed in opposite directions in a crowded hallway (counterflow).
c) Occupants have squeezed into a tight area and cannot back up, due to a wall or
one-way door.
d) Occupants are headed in opposite directions in a hallway that will not physically
allow them to pass.
33
Pathfinder Technical Reference
Path Following in Steering Mode
a. Occupants are headed toward a similar,
conflicting waypoint.
b. Occupants are headed toward opposing
waypoints in a crowded hall.
c. Merging occupants squeezed together
d. Counterflow occupants squeezed together
Figure 11: Potential conflict scenarios
Pathfinder employs special handling to resolve these movement conflicts and prevent
occupants from becoming stuck. This is handled as part of each occupant’s steering
behavior as follows:
1. The occupant performs their steering behavior as described previously and
determines that the lowest cost direction is to either stand still or to move
counter to their desired steering direction because of another occupant.
2. The occupant performs a “free pass” test as discussed below. If the occupant
obtains a free pass, they continue the next step. Otherwise, they return the noprogress steering direction.
3. The occupant recalculates steering with a locally-elevated priority. A locallyelevated priority is one that makes the occupant appear to have a higher priority
34
Pathfinder Technical Reference
4.
5.
6.
7.
Path Following in Steering Mode
to others within the same priority level, but to other occupants with higher
priority levels, the occupant still appears to have lower priority.
If the occupant makes progress with the newly calculated steering direction, the
occupant raises their priority to this new locally-elevated priority (if not already
raised) and returns the new steering calculation. If the occupant does not make
progress, however, they skip to the next step. NOTE: When an occupant raises
their priority, they also begin a count-down timer (settable via the input
parameter, Persist Time) or extend a previous timer if priority was already raised.
In addition, the occupant’s radius is reduced by a reduction factor (settable via
the input parameter, Reduction Factor in the pre-processor), allowing the
occupant to squeeze past other occupants. If other occupants detect this
occupant, they too will reduce their radii by their set reduction factors.
If the occupant has not yet set a timer, they will return the no-progress result. If
they have set a timer, they skip to the next step.
If the occupant’s timer has not yet expired from a previous steering calculation,
the occupant remains stationary with a locally-elevated priority in hopes that
other occupants will separate due to the elevated priority. If the timer has
expired, however, they skip to the next step.
The occupant maintains raised-priority and enters a state in which they can pass
through the other occupants that are immediately in their way.
Free Pass
In steering mode, an occupant obtains a free pass if at least one of the following
conditions is true for all nearby occupants:
a. The other occupant is a lower priority.
b. The other occupant is the same priority and has a lower chance of reaching the
intersection of their paths before the occupant being considered can.
Collision Avoidance/Response
While the wall and occupant avoidance behaviors will attempt to steer around obstacles,
they might not always succeed. This often occurs in crowded situations when occupants
cannot avoid being pressed tightly against walls and other occupants. In these situations,
additional collision handling is necessary to prevent the simulation from entering an
invalid state. There are two collision handling scenarios: one in which two or more
occupants collide and another where an occupant collides with the boundary of the
navigation mesh (i.e. a wall).
If collision handling is turned on, the occupant will halt at the earliest collision with
either a wall or another occupant for a given time step. If collision handling is off, the
occupant will only halt at the earliest collision with a wall.
35
Pathfinder Technical Reference
Path Following in Steering Mode
Movement through Doors
By default, Steering Mode simulations provide no additional constraints on occupants
when they move through doors. Flow limiting can be turned on, however, either
through the simulation parameter, Limit Door Flow Rate, or the Flowrate parameter on
individual doors.
In Steering mode, flow limiting works similarly to that in SFPE mode. For more details,
see Movement through Doors on page 22. The main differences between flow limits in
the two modes are as follows:
In steering mode, the flow limit can only be specified as a fixed value. It cannot
be based on room densities as in SFPE mode.
The actual achieved flowrate in steering mode will often be less than the
specified limit. This is due to the acceleration model and occupant avoidance
used in steering mode. When an occupant is stopped at a door, they have to
accelerate again to leave the doorway and allow another occupant to enter.
Occupants passing through a flow-limited door in steering mode may encounter
a slight slow-down at the door threshold even if they do not need to be held at
the door to achieve the flow limit. This is because each occupant always needs
to be enqueued at the door when they cross the threshold in order for the
limiting logic to progress properly. This enqueuing step stops the occupant
completely. In situations such as these, the door will immediately release the
occupant, but some of the occupant’s momentum will be lost. This slowdown
effect is dependent on the simulation time-step size. It will be worse for large
time steps.
36
Pathfinder Technical Reference
Elevators
Elevators
Elevators in Pathfinder are composed of a discharge node and any number of elevator
levels. Rather than modeling elevators using dynamic geometric elements (i.e. a floor
that moves up and down), Pathfinder represents elevators using ordinary rooms. There
is a room at each level the elevator touches, with doors connecting the elevator rooms
to each level. There is one discharge room at the discharge level. There are several
pickup rooms, one at each pickup level. Occupants that have entered a pickup room are
moved directly toward the discharge room, bypassing any geometry in-between. They
still appear to move, however, as if they are in a moving room as they are moved
toward the discharge room. Elevator rooms that are not currently being served by the
elevator are blocked using closed doors.
Elevator operation can be split into three main stages:
1. Idling
2. Pickup
3. Discharge
Idling
At the start of a simulation, each elevator is idle. All doors connecting all levels to the
elevator are closed, the elevator is at the discharge floor, and the elevator is waiting to
be called from one of the pickup levels. Once called, it proceeds to the pickup stage.
Elevator Calling
In order for an occupant to call an elevator, they must be assigned an elevator goal. If
the elevator goal specifies multiple elevators to choose from, the occupant uses a
modified version of Locally Quickest to choose the best one. This version of Locally
Quickest adds the elevator doors on the level closest to occupant’s location to the list of
door targets. The global travel time for each elevator door reflects an estimate of the
time it will take for the elevator to reach the pickup level for that door as well as the
time to travel in the elevator to the discharge level and walk to the nearest exit.
Once the occupant has chosen one of the elevator doors, the occupant walks to the
door. When they are within .5 m of the chosen elevator door and the elevator is in the
idle state, the elevator is called. If the elevator is part of a call group, all elevators in
that group are called.
Pickup
When a pickup level calls an elevator, the elevator moves toward that level. If multiple
pickup levels call the elevator at once, the elevator travels to the one with the highest
priority as specified in the user interface. As the elevator travels toward the pickup level,
it continues monitoring calls. If a call is received from a level with higher priority before
37
Pathfinder Technical Reference
Elevators
the elevator reaches the current pickup level, the elevator switches pickup levels. The
time to reach the pickup level is specified in the user interface.
When the elevator reaches a pickup level, it opens its doors and waits for a countdown
timer to elapse. The elevator then closes its doors and proceeds to the discharge stage.
Countdown Timer
When the elevator doors open at a pickup level, the elevator begins a countdown timer,
initialized to the time specified by the Open Delay input parameter. Once this timer
reaches zero, the elevator doors close. While the timer is counting down and the
elevator has room for more occupants, two events may occur that can affect the timer:
An occupant enters the elevator.
An occupant is outside the elevator desiring to enter it, is moving more than 10%
of their maximum speed toward the elevator, and is within 7 m of one of the
elevator doors.
If one of these events occurs, the countdown timer is reset to be the larger of its current
value or the Close Delay input parameter.
Loading
The process of loading an elevator and achieving the user-specified nominal load is
controlled by occupants and their movement behavior rather than elevator logic.
Pathfinder provides different mechanisms for achieving the nominal load depending on
the simulation mode.
In SFPE mode, achieving the nominal load is fairly trivial. Usually, a room is assigned a
maximum occupant density from the simulation parameters. The doors leading to that
room use a gating mechanism to prevent occupants from entering if doing so would
exceed the maximum density in the room. For elevator rooms, the maximum occupant
density is derived from the nominal load as nominal_load/area. Because occupants can
overlap in SFPE mode, no additional work is needed to ensure that the nominal load can
be met.
In steering mode, however, Pathfinder requires further action to ensure the nominal
load. This is because each room has a physical loading limit due to room shape,
occupant size, and avoidance behavior. To allow elevators to reach the nominal load,
collisions are turned off, while still allowing occupants to avoid one-another.
Discharge
After the elevator is loaded at the pickup level, it moves toward the discharge level. The
amount of time it takes to reach the discharge level is the same as travelling from the
discharge to pickup level as specified in the user interface. Once the elevator reaches
the discharge level, it opens its doors. When the elevator is empty, it closes its doors
and enters the idle state again.
38
Pathfinder Technical Reference
Solution Procedure
Solution Procedure
Pathfinder runs in a simulation loop that calculates movement at discrete time steps.
For each time step, the following steps are carried out:
1. Update each occupant’s current target point. This step takes the longest on the
first time step because each occupant must find a path to their goal.
2. Calculate each occupant’s steering velocity. The steering velocity will be
calculated differently depending on whether SFPE or Reactive Steering mode is
active.
3. Increment the current time step.
4. Move each occupant. This involves several sub-steps:
5. Calculate the velocity for the current time. If steering mode is on, this will
calculate a desired steering force from the desired velocity, and then use
integration to calculate the actual velocity. In SFPE mode, this will simply be set
to the desired velocity.
6. If collision avoidance is turned on, detect potential collisions, and modify the
desired velocity to avoid the collisions.
7. Integrate the final velocity to find the maximum travel distance, and travel along
the mesh until this distance is reached or until the earliest collision.
8. Update output files.
39
Pathfinder Technical Reference
File Format
File Format
The simulator portion of Pathfinder can optionally use an input file to run simulations. By
default, this input file is written every time a simulation takes place. This section describes the
input file including its format and all parameters.
NODES
Rooms, doors, and stairways are represented by nodes. At any given time during the
simulation each occupant is either inside one of the following nodes or has exited the
simulation.
[nodes]
name
...
name : string
Name of a node
VERTS
This section contains all of the vertices that will be used by the geometry (triangles and
edges) in the input file.
[verts]
xyz
...
x : float
x-coordinate
y : float
y-coordinate
z : float
z-coordinate
NAVMESH << NODES, VERTS
This section defines the walkable space within a simulation.
40
Pathfinder Technical Reference
File Format
[navmesh]
ixnode ttype ixverta ixvertb ixvertc
...
ixnode : int
Index of the node associated with this triangle
ttype : string
Terrain type: [open, stair]
ixverta : int
Index of first vertex
ixvertb : int
Index of second vertex
ixvertc : int
Index of third vertex
Note: The order of the three vertices is significant. Use CCW ordering (i.e. right hand
rule) to define the top of the mesh element.
GEOMMESH (optional) << NODES, VERTS
The definition of this section is identical to the definition of the NAVMESH section. If
present, the mesh defined in this section will be used for geometry searches during the
simulation. This can improve performance if this mesh is coarser than the NAVMESH.
[geommesh]
ixnode ttype ixverta ixvertb ixvertc
...
(same as NAVMESH)
DOORS (optional) << NODES
This section defines the doors that will be used if the use_door_queues option is
enabled. Associating a door entry with a node causes that node to be recognized by the
simulator as a door node and prevents the density calculation from being used to
control the speeds of occupants within triangles associated with that node. This section
does not define the geometric edges that the door represents (see Note).
41
Pathfinder Technical Reference
File Format
Exit doors should define only one adjoining room and internal doors should define two
such rooms. These entries are used to prevent overcrowding as occupants transition
between rooms and to provide for more elaborate merge calculations.
[doors]
ixnode eff_width ixnodeA ixnodeB
...
ixnode : int
Index of the node corresponding to this door
eff_width : float
Effective width of this door
ixnodeA : int
Index of a room adjoining the door (use dash “-“ for none)
ixnodeB : int
Index of a room adjoining the door (use dash “-“ for none)
Note: Agents will not enter a door’s queue unless they cross a special door edge
(defined in the EDGES section).
EDGES (optional) << NODES, VERTS
The entries in this section represent the geometric portion of entities that are defined as
edges in the NAVMESH.
[edges]
etype <depends on etype>
...
etype : string
Edge type: [boundary, door, exit_door]
boundary ixverta ixvertb
This edge type represents a boundary that occupants will not walk across.
42
Pathfinder Technical Reference
File Format
ixverta : int
Index of the first vertex
ixvertb : int
Index of the second vertex
door ixnode ixverta ixvertb
This edge type represents an internal door. Doors of this type will not be included in the
search for the nearest exit and should have two adjoining nodes defined in the
corresponding door record.
ixnode : int
Index of the node corresponding to this door
ixverta : int
Index of the first vertex
ixvertb : int
Index of the second vertex
exit_door ixnode ixverta ixvertb
This edge type represents an exit door. Doors of this type will be included in the search
for the nearest exit and should have one adjoining node defined in the corresponding
door record.
ixnode : int
Index of the node corresponding to this door
ixverta : int
Index of the first vertex
ixvertb : int
Index of the second vertex
Note: Edge definitions must match edge definitions in the NAVMESH. If a door is
formed by the three vertices A, B, and C, it must be given as two edges: A-B and B-C.
Edges that do not correspond to edges in the NAVMESH (e.g. A-C) are invalid and may
cause the simulation to crash or otherwise behave unexpectedly.
PARAM (optional)
This section allows you to customize global simulation parameters. The format is a list
of key value pairs.
43
Pathfinder Technical Reference
File Format
[param]
key value
...
key : string
The name of a simulation parameter
value : mixed
The value for a simulation parameter (type depends on key)
max_time
0
Simulation time limit in seconds (0=infinite)
show_vis
0
Turn debugging visualization on/off (0=off, 1=on)
out_time_history
vis.out
Movie playback (time history) output
out_node_pop
nodes.csv Node populations over time
out_clear_times
clear.csv
Clearing times for each node
dt_init
0.025
Simulation time step size (s)
dt_vis
0.25
Frequency of visualization output (s)
dt_wall_meta
0.5
Frequency of simulation progress meta data (s)
dt_csv_data
1.0
CSV data print time increment (s)
handle_collisions
1
Turn collision handling on/off (0=off, 1=on)
reactive_steering
1
Turn reactive steering on/off (0=off, 1=on)
inertia
1
Turn inertia on/off (0=off, 1=on)
vel_from_density
1
Turn density-based velocity calculation on/off (0=off,
1=on). Only applies when inertia is off.
use_door_queues
0
Turn door queues on/off (0=off, 1=on)
wall_slide
1
Turn wall sliding on/off (0=off, 1=on)
density_max
3.55
Maximum room fill density. Only applies when door
queues are active.
44
Pathfinder Technical Reference
File Format
PROFILES << NODES
These entries are descriptions of artificial intelligence for simulation agents.
[profiles]
goto [ixnode | nearest]
...
goto
Currently, the only form of AI allowed by the simulator.
Ixnode : int
The index of the goal node
nearest
This option causes the occupant to search for the nearest exit
OCCUPANTS << PROFILES, NODES (indirect), NAVMESH (indirect)
This section describes the occupants present at the beginning of the simulation. The
starting node for each occupant is inferred based on the location of the occupant.
[occupants]
name ixprofile x y z
...
name : string
The name of the occupant
ixprofile : int
The index of the corresponding profile entry
x : float
The x-coordinate of the occupant
y : float
The y-coordinate of the occupant
z : float
The z-coordinate of the occupant
OTHER NOTES
Lines beginning with the comment character (“#”) will be ignored.
45
Pathfinder Technical Reference
File Format
Lines are considered to be delimited by spaces and commas. Strings containing spaces
and commas should be enclosed in double-quotes. The following three VERT definitions
are identical to inferno.
1, 1, 0
1.0 1. 0.
1, 1 0
EXAMPLE INPUT FILE
# Sample 0
# Pathfinding with edge exits test case
[nodes]
"R1"
"e2"
[doors]
1 1.32 0 [verts]
0. 0. 0.
1. 0. 0.
1. 1. 0.
0. 1. 0.
[navmesh]
0 open 0 1 2
0 open 2 3 0
[geommesh]
0 open 0 1 2
0 open 2 3 0
[edges]
46
Pathfinder Technical Reference
File Format
#type ixNode ixVert1 ixVert2
exit_door 1 1 2
[param]
show_vis 1
handle_collisions 1
reactive_steering 1
inertia 1
vel_from_density 0
use_door_queues 0
[profiles]
#goto <ixNode>
goto nearest
[occupants]
#name ixProfile x y z
"001" 0 0.25 0.75 0.
47
Pathfinder Technical Reference
Results
Results
Occupant Contours
The 3D results provide some post-processing capabilities, including the ability to
generate contours that show dynamic occupant data overlaid on the navigation mesh or
imported geometry as shown in Figure 12.
Figure 12: Occupant contours
Contours can either be calculated as results are played back or can be optimized and
stored on disk for later retrieval. Optimization is discussed further in the User Manual.
The calculation of the contours is described in this guide.
Contours are calculated using a sub-divided version of the navigation mesh as seen in
Figure 13.
48
Pathfinder Technical Reference
Results
Navigation Mesh
Occupant Contour Mesh
Figure 13: Navigation Mesh vs. Occupant Contour Mesh
Contour values are calculated at the vertices of the triangles in the contour mesh and
are linearly interpolated across triangles to produce the shading. The contour mesh is
used only to display occupant contours and is independent from the navigation mesh
used during the simulation. The spatial resolution of the contour mesh as well as the
update frequency can be controlled using the Occupant Contours Properties dialog.
Smaller values for space and time resolution offer smoother contours at the cost of
greater calculation time and memory requirements.
Frames of contour data are produced throughout time depending on both the 3D results
data frames and the time step specified in the Occupant Contours Properties dialog as
discussed in the User Manual. Each contour frame lines up in time with a frame of
occupant animation data, though there does not have to be a one-to-one
correspondence. This ensures that contour data is only produced when occupants are at
known positions rather than interpolated positions. To view contour data at times
between contour frames, the data is linearly interpolated between frames.
Density
The density calculated at each vertex of the contour mesh is dependent on the location
of nearby occupants and the value of the Density Radius parameter. Any occupant
intersecting the circle around a vertex contributes to the density at that vertex.
Occupants who partially fall within the circle around a vertex contribute partially based
on intersection area.
Increasing the Density Radius parameter smooths out contours by eliminating peaks
and valleys in the density calculation. This effect will tend to be more visible near the
edges of dense flows and more stable within uniformly dense regions due to partial
attribution of occupants intersected by the density measurement radius.
49
Pathfinder Technical Reference
Results
The following steps describe in detail how the density values that control contour colors
are calculated.
1. For each vertex of the contour mesh, an area is calculated. The area is at most
𝜋𝑟𝑑 2 , where 𝑟𝑑 is the user-settable parameter, Density Radius, as described in
the User Manual. The area will be less if there are boundaries closer than 𝑟𝑑 .
2. For each vertex, the mesh is traversed to find occupants whose bodies are at
least partially within 𝑟𝑑 .
3. The number of occupants within this radius are summed, with occupants fully
within the radius counting as 1 and occupants partially within the radius
counting as follows:
𝑑 − 𝑟𝑑 + 𝑟𝑜
𝐶 =1−
2𝑟𝑜
where 𝑟𝑜 is the occupant’s radius and 𝑑 is the 2-d distance from the vertex to the
occupant’s center.
4. The occupant count is then divided by the area at the vertex to produce the
density value.
Level of Service
Level of Service is implemented the same as density but with three special color maps.
Each color map represents a different type of terrain, including Walkway, Stairway, and
Queuing [Fruin, 1987].
Speed
For each occupant, their speed is applied to the vertices of the contour mesh within a
distance of 𝑟𝑖 (see Influence Radius in the User Manual). The speed value at each vertex
is calculated as follows:
𝑟𝑖 − 𝑑𝑥
𝑠𝑣 = max (𝑠𝑥
)
1≤𝑥≤𝑛
𝑟𝑖
where 𝑛 is the number of occupants within a 2-d radius of 𝑟𝑖 surrounding the vertex’s
position, 𝑠𝑥 is the current speed of occupant 𝑥, and 𝑑𝑥 is the 2-d distance from the
vertex to the position of occupant 𝑥.
Normalized Speed
The normalized speed contour is calculated similarly to the speed contour, except that
the speed value per vertex is the following:
𝑠𝑥
𝑟𝑖 − 𝑑𝑥
𝑠𝑣 = max (
∗
)
1≤𝑥≤𝑛 𝑠𝑥𝑚𝑎𝑥
𝑟𝑖
where 𝑠𝑥𝑚𝑎𝑥 is the maximum speed of occupant 𝑥.
Usage [Instantanteous]
The usage value at each vertex is calculated as follows:
50
Pathfinder Technical Reference
Results
𝑟𝑖 − 𝑑𝑥
1≤𝑥≤𝑛
𝑟𝑖
𝑢𝑣 = max
Usage [Accumulated]
The accumulated usage contour is implemented as a time-integrated filter on top of an
instantaneous usage contour. See Integrate below for more information about the
integration filter.
Time to Exit
The Time to Exit contour value at each vertex is calculated as follows:
𝑡𝑡𝑒𝑣 = max ((𝑡𝑒𝑥𝑖𝑡 − 𝑡𝑐𝑢𝑟𝑟 )
1≤𝑥≤𝑛
𝑟𝑖 − 𝑑𝑥
)
𝑟𝑖
where 𝑡𝑒𝑥𝑖𝑡 is the occupant’s exit time and 𝑡𝑐𝑢𝑟𝑟 is the current contour calculation time.
Average
Average contours are applied on top of other contours. They are calculated over a userspecified interval that is always trailing a particular time step. So if the averaging interval
is 30 s long, then at t=120 s, the averaging interval is [90,120] s. The interval cannot go
back in time, however, so at t=10 s, the interval is [0,10] s.
For each vertex, the vertex contour values of the base contour are averaged over this
interval to produce the final vertex value as follows:
1
𝑣𝑥 =
𝑛
𝑥
∑
𝑣𝑓
𝑓=𝑥−𝑛+1
where 𝑥 is the index of the contour frame for the current time step, 𝑛 is the number of
frames that intersect the calculation interval (see Calculation Interval in the User
Manual), 𝑣𝑓 is the vertex value of the base contour at frame 𝑓.
Maximum
Maximum contours are applied similarly to average contours. For each vertex, the final
vertex value is the maximum of the vertex values of the base contour over the time
interval as follows:
𝑣𝑥 =
max
𝑥−𝑛+1≤𝑓≤𝑥
𝑣𝑓
Integrate
Currently, the integration filter is not exposed as a general contour filter – it is only
available incorporated into the accumulated usage contour. The integration filter is
implemented on a per-vertex basis as follows:
51
Pathfinder Technical Reference
Results
𝑥
𝑣𝑥 =
∑
𝑣𝑓 (𝑡𝑓 − 𝑡𝑓−1 )
𝑓=𝑥−𝑛+1
where 𝑡𝑓 is the time of frame 𝑓, and 𝑡𝑓−1 is the time at frame 𝑓 − 1.
52
Pathfinder Technical Reference
References
References
[Amor et al., 2006] Heni Ben Amor, Jan Murray, and Oliver Obst, "Fast, Neat, and Under
Control: Arbitrating Between Steering Behaviors," AI Game Programming Wisdom 3,
ed. S. Rabin. pp. 221-232.
[Fruin, 1987] John J. Fruin, 1987. Pedestrian planning and design. Revised Edition.
Elevator World, Inc. pp. 71-87.
[Hart et al., 1968] P. E. Hart, N. J. Nilsson, B. Raphael, 1968. A Formal Basis for the
Heuristic Determination of Minimum Cost Paths. IEEE Transactions on Systems
Science and Cybernetics (SSCA). SSC-4 (2). pp. 100-107.
[IMO, 2002] Interim Guidelines for Evacuation Analyses for New and Existiing Passenger
Ships. June 6, 2002. International Maritime Organization. 4 Albert Embankment
London Great Britain . MSC/Circ.1033.
[Johnson, 2006] Geraint Johnson, “Smoothing a Navigation Mesh Path,” AI Game
Programming Wisdom 3, ed. S. Rabin. pp. 129-139, 2006.
[Kuligowski and Peacock, 2005] Erica D. Kuligowski and Richard D. Peacock, “A Review of
Building Evacuation Models,” National Institute of Standards and Technology, Fire
Research Division, Building and Fire Research Laboratory, Technical Note 1471, July,
2005. Available for download at http://fire.nist.gov/bfrlpubs/.
[McGrattan et al., 2007] Kevin McGrattan, Bryan Klein, Simo Hastikka, and Jason Floyd.
Fire Dynamics Simulator (Version 5) User's Guide. July, 2007. NIST Building and Fire
Research Laboratory. Gaithersburg Maryland USA . NIST Special Publication 1019-5.
[Nelson and Mowrer, 2002] Nelson, H. E., and Mowrer, F. W. "Emergency Movement."
The SFPE Handbook of Fire Protection Engineering Ed. DiNenno, P., and Walton, D.
W. National Fire Protection Association 2002. 3-367 - 3-380.
[Reynolds, 1999] Craig W. Reynolds, "Steering Behaviors For Autonomous Characters."
Proceedings of the Game Developers Conference 1999. 1999, Miller Freeman
Game Group, San Francisco, California, pp. 763-782.
[Santos and Aguirre, 2004] Gabriel Santos and Benigno E. Aguirre, “ A Critical Review of
Emergency Evacuation Simulation Models,” NIST Workshop on Building Occupant
Movement during Fire Emergencies, June 9-10, 2004.
[SFPE, 2003] Engineering Guide - Human Behavior in Fire. June, 2003. Society of Fire
Protection Engineers. 7315 Wisconsin Avenue, Suite 620E Bethesda Maryland USA
1-301-718-2910 .
53
Pathfinder Technical Reference
Index
Index
Doors, 10, 11
Generation, 17
Exit, 10, 12
Waypoints, 17
File Format, 40
SFPE Mode, 19
Geometry, 10
Doors, 22
Boundary, 10
Solution Procedure, 39
Navigation Mesh, 10
Stairs, 12
Obstructions, 10
States
Open Space, 11
Idling, 31
Rooms, 10
Seeking, 31
Subdivision, 10
Steering
Goals
steering behaviors, 7, 26
goals, 13
Steering Mode, 24
Input Parameters
Behaviors, 26
collisionResponseTime, 27, 28
Avoid Occupants, 28
comfortDist, 27, 28
Avoid Walls, 27
persistTime, 35
Seek, 26
locally-elevated priority, 34
Collision Avoidance/Response, 35
Overview, 7
Steering, 26
Path
54